
Mill slag turns into cement feed and road stone
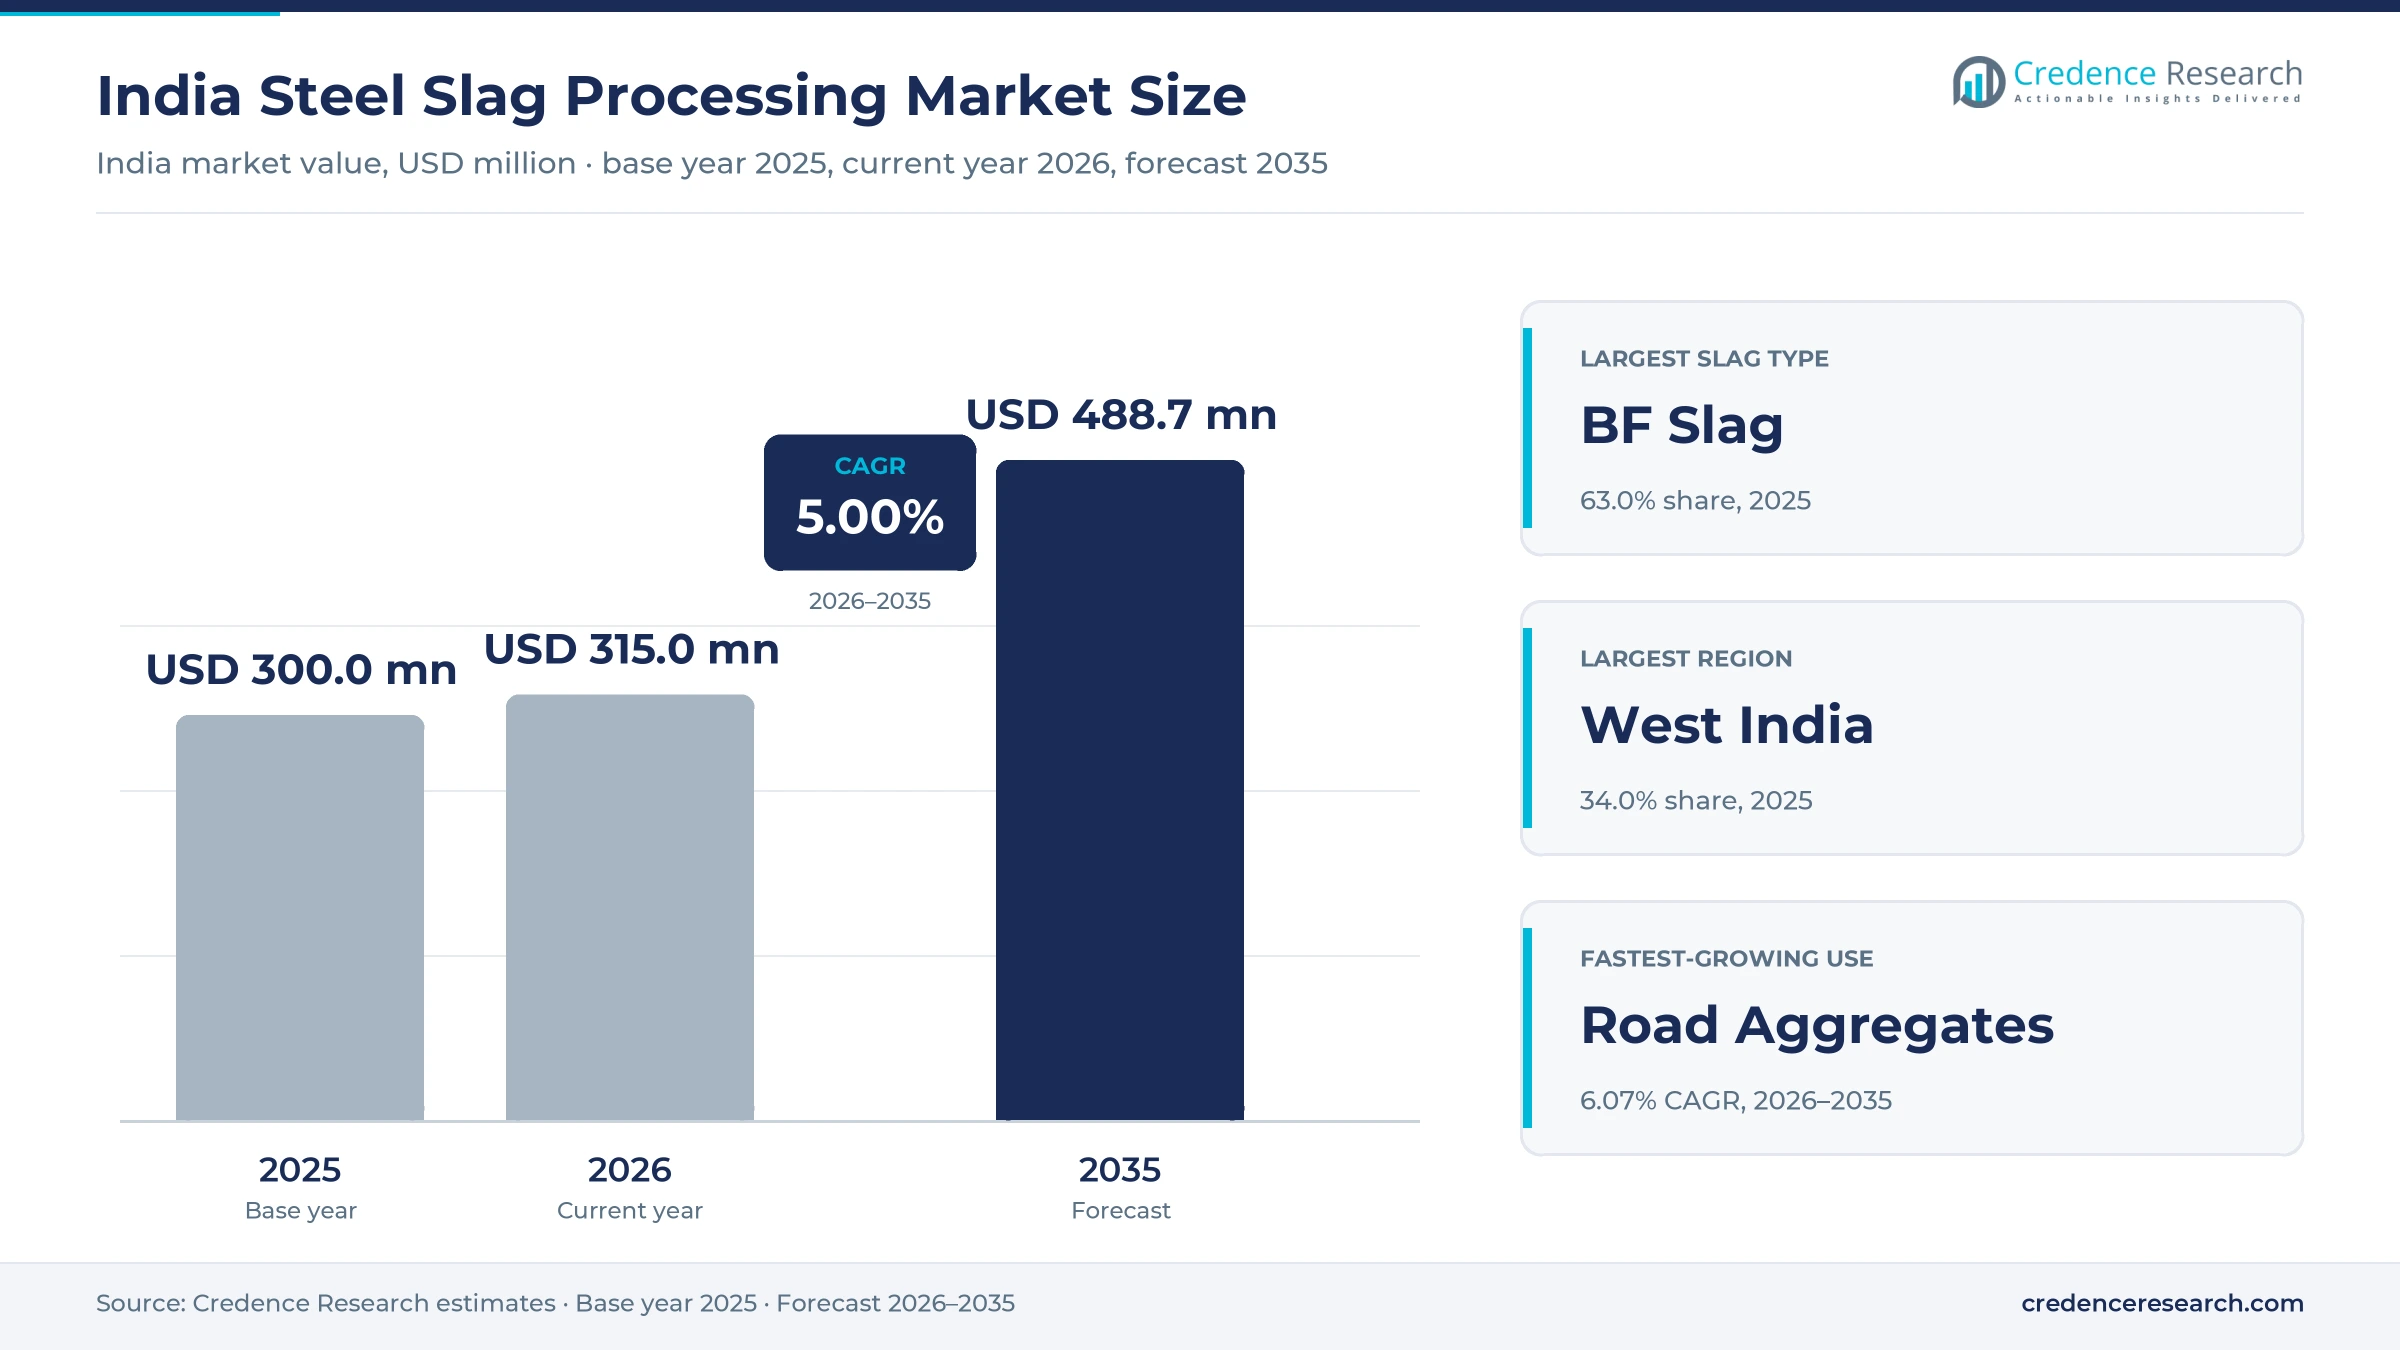
The India steel slag processing market was valued at USD 300.0 million in 2025 and is projected to increase from USD 315.0 million in 2026 to USD 488.7 million by 2035, registering a CAGR of 5.00% during 2026–2035. Demand comes from integrated steel mills that must cool, crush and clear slag every day, cement makers that grind granulated blast furnace slag into blended cement, and road agencies that now accept processed steel slag in place of natural stone. West India held the largest regional share, 34.0% in 2025, because JSW Steel at Dolvi in Maharashtra and AM/NS India at Hazira in Gujarat generate large volumes close to highway and cement buyers. Northeast India is the fastest-growing region at 6.01% a year, from a very small base, as border road builders use processed slag. The main regulatory change is the NITI Aayog guideline of July 2024 promoting processed steel slag aggregates in road construction.
Which slag processing revenue is counted here?
The market counts the value added when iron and steel slag from Indian plants is granulated, cooled, crushed, screened, weathered and stripped of metal so it can be sold or reused. It covers in-house processing lines at steel mills, outsourced slag handling and mill service contracts, and the processing margin on granulated slag, aggregates and slag-based soil products.
The scope excludes the steel itself, the full price of cement or concrete made with slag, non-ferrous slag such as copper slag, and fly ash. Untreated slag sent to dumps carries no processing value and is left out, while metal recovered from slag is counted only as a processing service.
India Steel Slag Processing Market Insights
- The market grows from USD 300.0 million in 2025 to USD 488.7 million by 2035 at a 5.00% CAGR, as crude steel output reached 170.15 million metric tons in FY 2025-26.
- West India held 34.0% of 2025 value, as AM/NS India generates about 1.70 million metric tons of steel slag a year at Hazira.
- BF slag led the slag type split with 63.0% in 2025, as JSW Cement sold 5.18 million metric tons of GGBS in FY25.
- AM/NS India became the first company to license CSIR-CRRI steel slag aggregate technology on July 28, 2025, branding the product AM/NS Aakar.
- Harsco, now Enviri, holds a 10-year slag handling contract at JSW Steel Dolvi, announced in January 2019, while Tata Steel runs its own lines.
BF slag, cement buyers and in-house lines lead value
Why does BF slag hold the larger share?
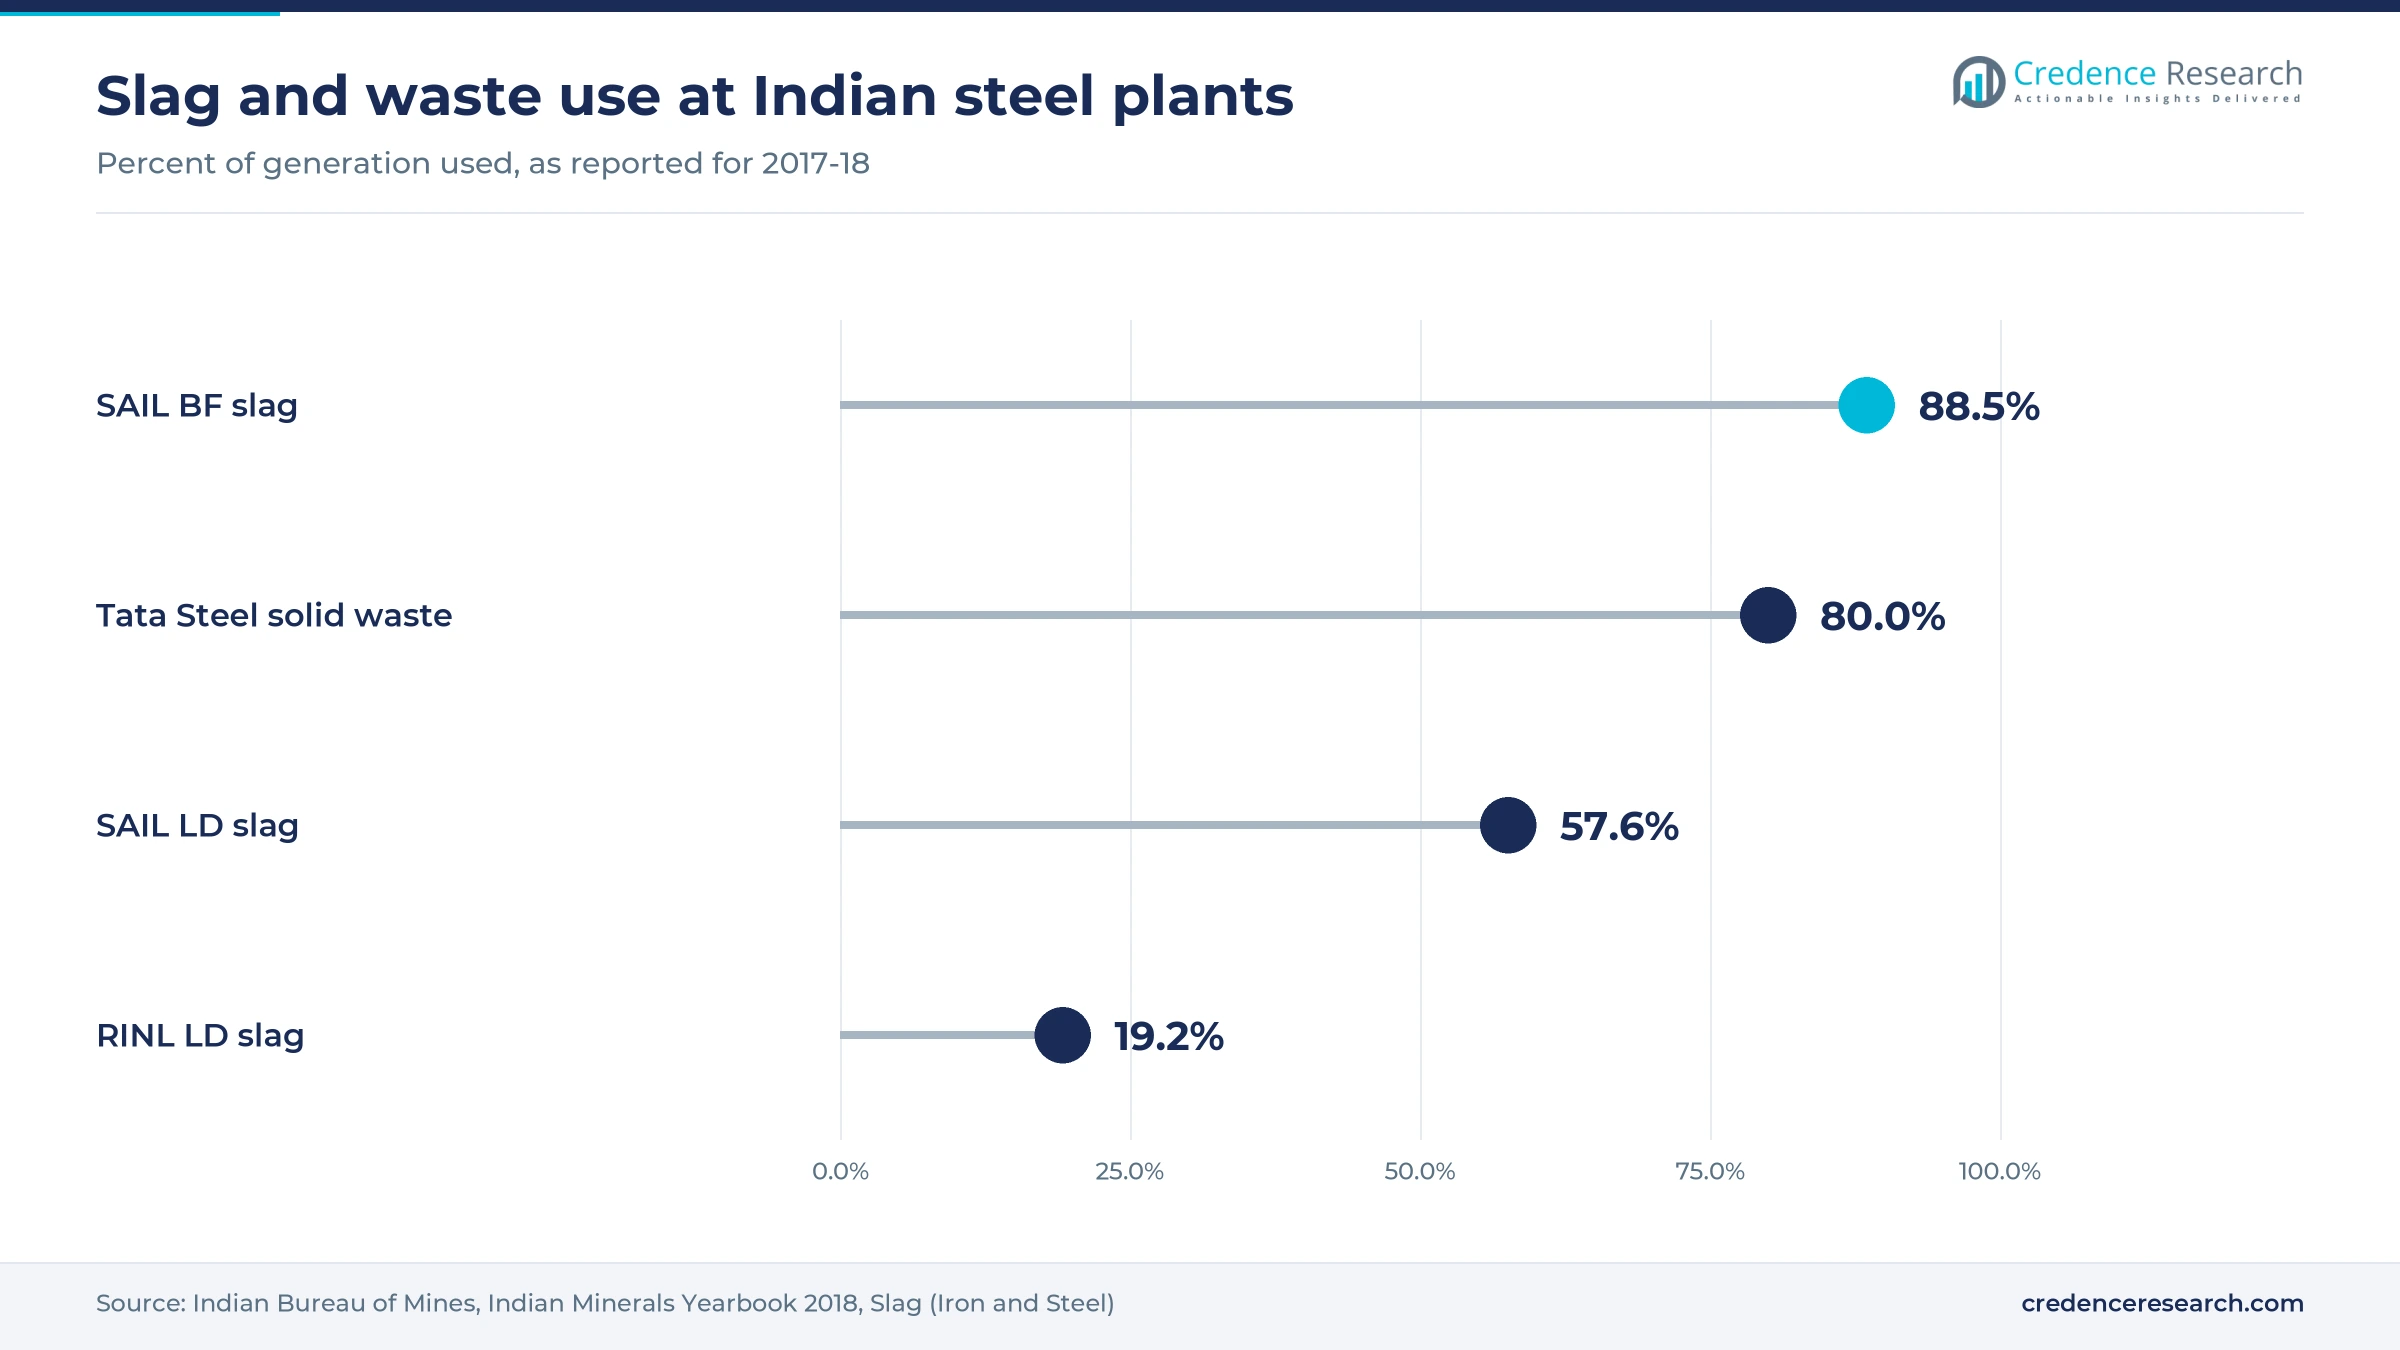
Based on slag type, the market is categorized into BF slag and steel (LD) slag. BF Slag led with 63.0% of 2025 value because granulated blast furnace slag has a ready buyer in cement grinding, and JSW Cement sold 5.18 million metric tons of GGBS in FY25, according to its IPO details published by Upstox. The Indian Bureau of Mines puts blast furnace slag at 300 kg to 540 kg per metric ton of iron. Steel (LD) Slag grows fastest at 5.86% a year as its use catches up, since SAIL used only 57.55% of its LD slag against 88.47% of its BF slag, the Indian Bureau of Mines reported.
How do cement, road and farm uses compare?
Based on use, the market is categorized into cement, road aggregates and fertilizer. Cement led with 62.0% of 2025 value because portland slag cement and GGBS absorb most granulated slag, and Construction World reported Indian cement output of 491.4 million metric tons in FY26, up 8.6%. Road Aggregates grows fastest at 6.07% a year as highway agencies accept processed slag in place of stone and recycled concrete aggregates, after JSW Steel supplied about 80,000 metric tons of CONARC slag for a 1 km NH-66 section, CSIR-CRRI reported. Tata Steel adds a 25,000-ton-a-year plant for its Dhurvi Gold crop nutrient.
Why do in-house lines still lead processing?
Based on model, the market is categorized into in-house and outsourced. In-House led with 66.0% of 2025 value because integrated mills run their own granulation and aggregate lines, and Tata Steel granulates all of its blast furnace slag in line, according to the Indian Bureau of Mines. Tata Steel also sells processed LD slag under the Tata Aggreto and Tata Nirman brands. Outsourced processing grows fastest at 5.78% a year as mills hand slag yards to specialists, after Harsco, now Enviri, announced a 10-year contract in January 2019, starting that September, for slag handling at JSW Steel's Dolvi plant in Maharashtra.
| Segment Group | Leading Sub-segment | Share, 2025 | Fastest-growing Sub-segment | CAGR, 2026–2035 |
|---|---|---|---|---|
| By Slag Type | BF Slag | 63.0% | Steel (LD) Slag | 5.86% |
| By Use | Cement | 62.0% | Road Aggregates | 6.07% |
| By Model | In-House | 66.0% | Outsourced | 5.78% |
Request a Free Sample
Fill in your details and we'll send you a free sample report.
- Sample data tables & charts
- Research methodology
Steel output, road use and rules lift processed tonnage
Steelmaking output produces more slag needing treatment
Steel production growth is the largest driver, because every metric ton of crude steel leaves slag that must be treated. Ministry of Steel data show crude steel output of 170.15 million metric tons in FY 2025-26, and the same overview puts crude steel capacity at 220.4 million metric tons in 2025-26, against the 300 million projected for 2030-31 under the National Steel Policy 2017. Steel slag alone was about 19 million metric tons a year in July 2023 and is expected to reach 60 million by 2030, junior steel minister Faggan Singh Kulaste said, SteelOrbis reported. An MCX report in August 2026 projected the blast furnace share of output rising from 42% to 56% by 2030. In the Credence Research model this adds about 2.1 percentage points to annual growth to 2035.
Road and cement users adopt processed slag aggregates
Road builders and cement makers now buy processed slag as a regular input, which turns stockpiles into paid tonnage. CSIR-CRRI reports that JSW Steel processed about 80,000 metric tons of CONARC slag for a 1 km four-lane section of NH-66 between Indapur and Panvel, with a bituminous layer 28% thinner and a cost about 32% lower than a conventional road. Tata Steel shipped 1,200 metric tons of Tata Aggreto to the Border Roads Organisation for Project Arunank in November 2022, Maritime Gateway reported. The Ministry of Road Transport and Highways built 10,660 km of national highways in FY 2024-25, The Tribune reported, so even small slag shares mean large volumes. In the Credence Research model this adds about 1.3 percentage points to annual growth to 2035.
Environmental compliance favors processing over dumping
Environmental pressure pushes mills to process slag rather than store it, because slag hills near plants pollute water, air and land, as the steel ministry noted in July 2023, SteelOrbis reported. NITI Aayog released guidelines on July 2, 2024 that promote processed steel slag aggregates in roads and set a framework for safe handling and storage, Indian Infrastructure reported. The Indian Roads Congress code IRC SP 121 of November 2018 caps the volumetric expansion of slag aggregates at 2%, so only treated material qualifies for road work. Down To Earth reported in April 2013 that SAIL held 1.2 million metric tons of weathered slag at Rourkela awaiting tests. In the Credence Research model this adds about 0.9 percentage point to annual growth to 2035.
Slag cement grinding capacity lifts granulated slag offtake
A fourth driver is the build-out of slag-based cement capacity, which ties granulated slag demand to new grinding units. JSW Cement had 20.60 million metric tons a year of grinding capacity in March 2025 and plans 41.85 million, with new plants in Rajasthan, Punjab, Uttar Pradesh and Madhya Pradesh, according to its IPO details published by Upstox. GGBS made up over 41% of its FY25 sales volume, and the company listed on BSE and NSE on Aug. 14, 2025. Its seven plants are in Andhra Pradesh, Karnataka, Tamil Nadu, Maharashtra, West Bengal and Odisha, the same IPO details show. As a result, cement keeps 62.0% of 2025 processing value.
Branded aggregates and farm products reshape slag sales
Rise of branded slag aggregates under CSIR-CRRI licences
Steelmakers are shifting from bulk slag disposal to branded aggregate products sold on specification. The Tribune reported on July 28, 2025 that AM/NS India became the first company to license CSIR-CRRI technology for processed EAF slag aggregates at Hazira, branded AM/NS Aakar, from about 1.70 million metric tons of slag a year. The same report said AM/NS Aakar was used on the NH-53 Diamond Bourse road in Surat. Tata Steel launched Tata Aggreto and Tata Nirman as the first branded LD slag products in India in January 2018, in 0 mm to 65 mm and 0 mm to 6 mm sizes, CemNet reported. In turn, road aggregates grow fastest at 6.07% a year.
Emerging slag-based crop nutrients for farm markets
Slag is moving into agriculture, as steelmakers bring out nutrient products made from basic oxygen furnace slag. Tata Steel launched Dhurvi Gold, a sulfur-rich crop nutrient, from a plant of 25,000 metric tons a year in February 2023, Lagatar24 reported. The product is sold in Bihar, Jharkhand, West Bengal, Odisha and Maharashtra, and Tata Steel says it can cut primary fertilizer use by up to 50% and lift crop yields by 15% to 60%. The Indian Bureau of Mines also lists soil conditioning among the uses of granulated slag. Fertilizer remains the smallest use, so growth comes from a low base as distribution widens beyond those five states.
Highway and border programs open bulk aggregate deals
Highway and border road programs offer a large opening for processors that can deliver specification aggregates at scale. Union minister Jitendra Singh said in July 2023 that steel slag roads cost about 30% less than conventional paving, Outlook India reported, after Surat received the first processed steel slag road in June 2022. Tata Steel supplied slag free of cost for a heavy-duty road in Arunachal Pradesh, moved by Indian Railways from Jamshedpur. AM/NS India claims slag roads are 30% to 40% more cost-effective and last up to three times longer than bitumen roads, SteelOrbis reported in July 2025. Mills that win such contracts can sell slag at a positive price instead of paying for storage.
Metal recovery and specialty products open new income
Advanced recovery offers a second opening, as slag yields metal and specialty products beyond aggregates. SAIL's Bokaro Steel Plant partnered with Ram Charan Company in 2024 on a pilot modular unit to process 50 metric tons a day of steel slag into silicon carbide for semiconductor use, The Daily Pioneer reported. JSW Steel's Vijayanagar works used 25,039 metric tons of LD slag in place of limestone in its blast furnaces, according to its 2024-25 annual report, and plans to extend this to all furnaces. Harsco won metal recovery and slag sales services at Tata Steel's Kalinganagar plant in May 2017. As a result, outsourced processing grows at 5.78% a year.
Expansion risk, stockpiles and buyer power test processors
Volume instability of LD slag delays road use
LD slag swells when its free lime and magnesia hydrate, so it cannot go straight into pavements. IRC SP 121, issued in November 2018, requires basic oxygen furnace slag to be weathered, with natural stockpiling for up to six months, and caps expansion at 2%. Construction World noted in March 2022 that open-yard weathering can take one to two years. This ties up yard space and working capital, so processors invest in steam ageing to shorten the wait.
Low LD slag utilization leaves large stockpiles
Many plants still use only a small part of their steel slag, which leaves stockpiles that cost money to hold. The Indian Bureau of Mines reported that RINL used 89,474 metric tons of the 466,582 metric tons of LD slag it generated, or 19.18%, in the period to December 2017. Down To Earth reported that only 20% to 25% of slag found gainful use in a 2012 assessment. Processors must find steady buyers before adding capacity at such sites.
Concentrated cement buying limits slag prices
Granulated slag sales depend on a small group of cement buyers, which limits the price processors can charge. JSW Cement held about 84% of the Indian GGBS market in FY25 and ran its grinding units at 62.89% utilization, according to its IPO details published by Upstox. GGBS made up over 41% of its FY25 volume, so mills that sell granulated slag face few large buyers, so they look to road aggregates and other outlets to keep their yards clear.
Freight distance erodes value of low-priced slag
Slag is heavy and cheap, so freight can wipe out its value once buyers sit far from the mill. The Indian Bureau of Mines notes that granulated slag prices vary with the distance between steel and cement plants. Tata Steel's first consignment for Arunachal Pradesh, sent in November 2022, was 1,200 metric tons moved by rail from Tatanagar, Maritime Gateway reported. Long hauls like this need public support, so most slag stays within a few hundred kilometers of its source.
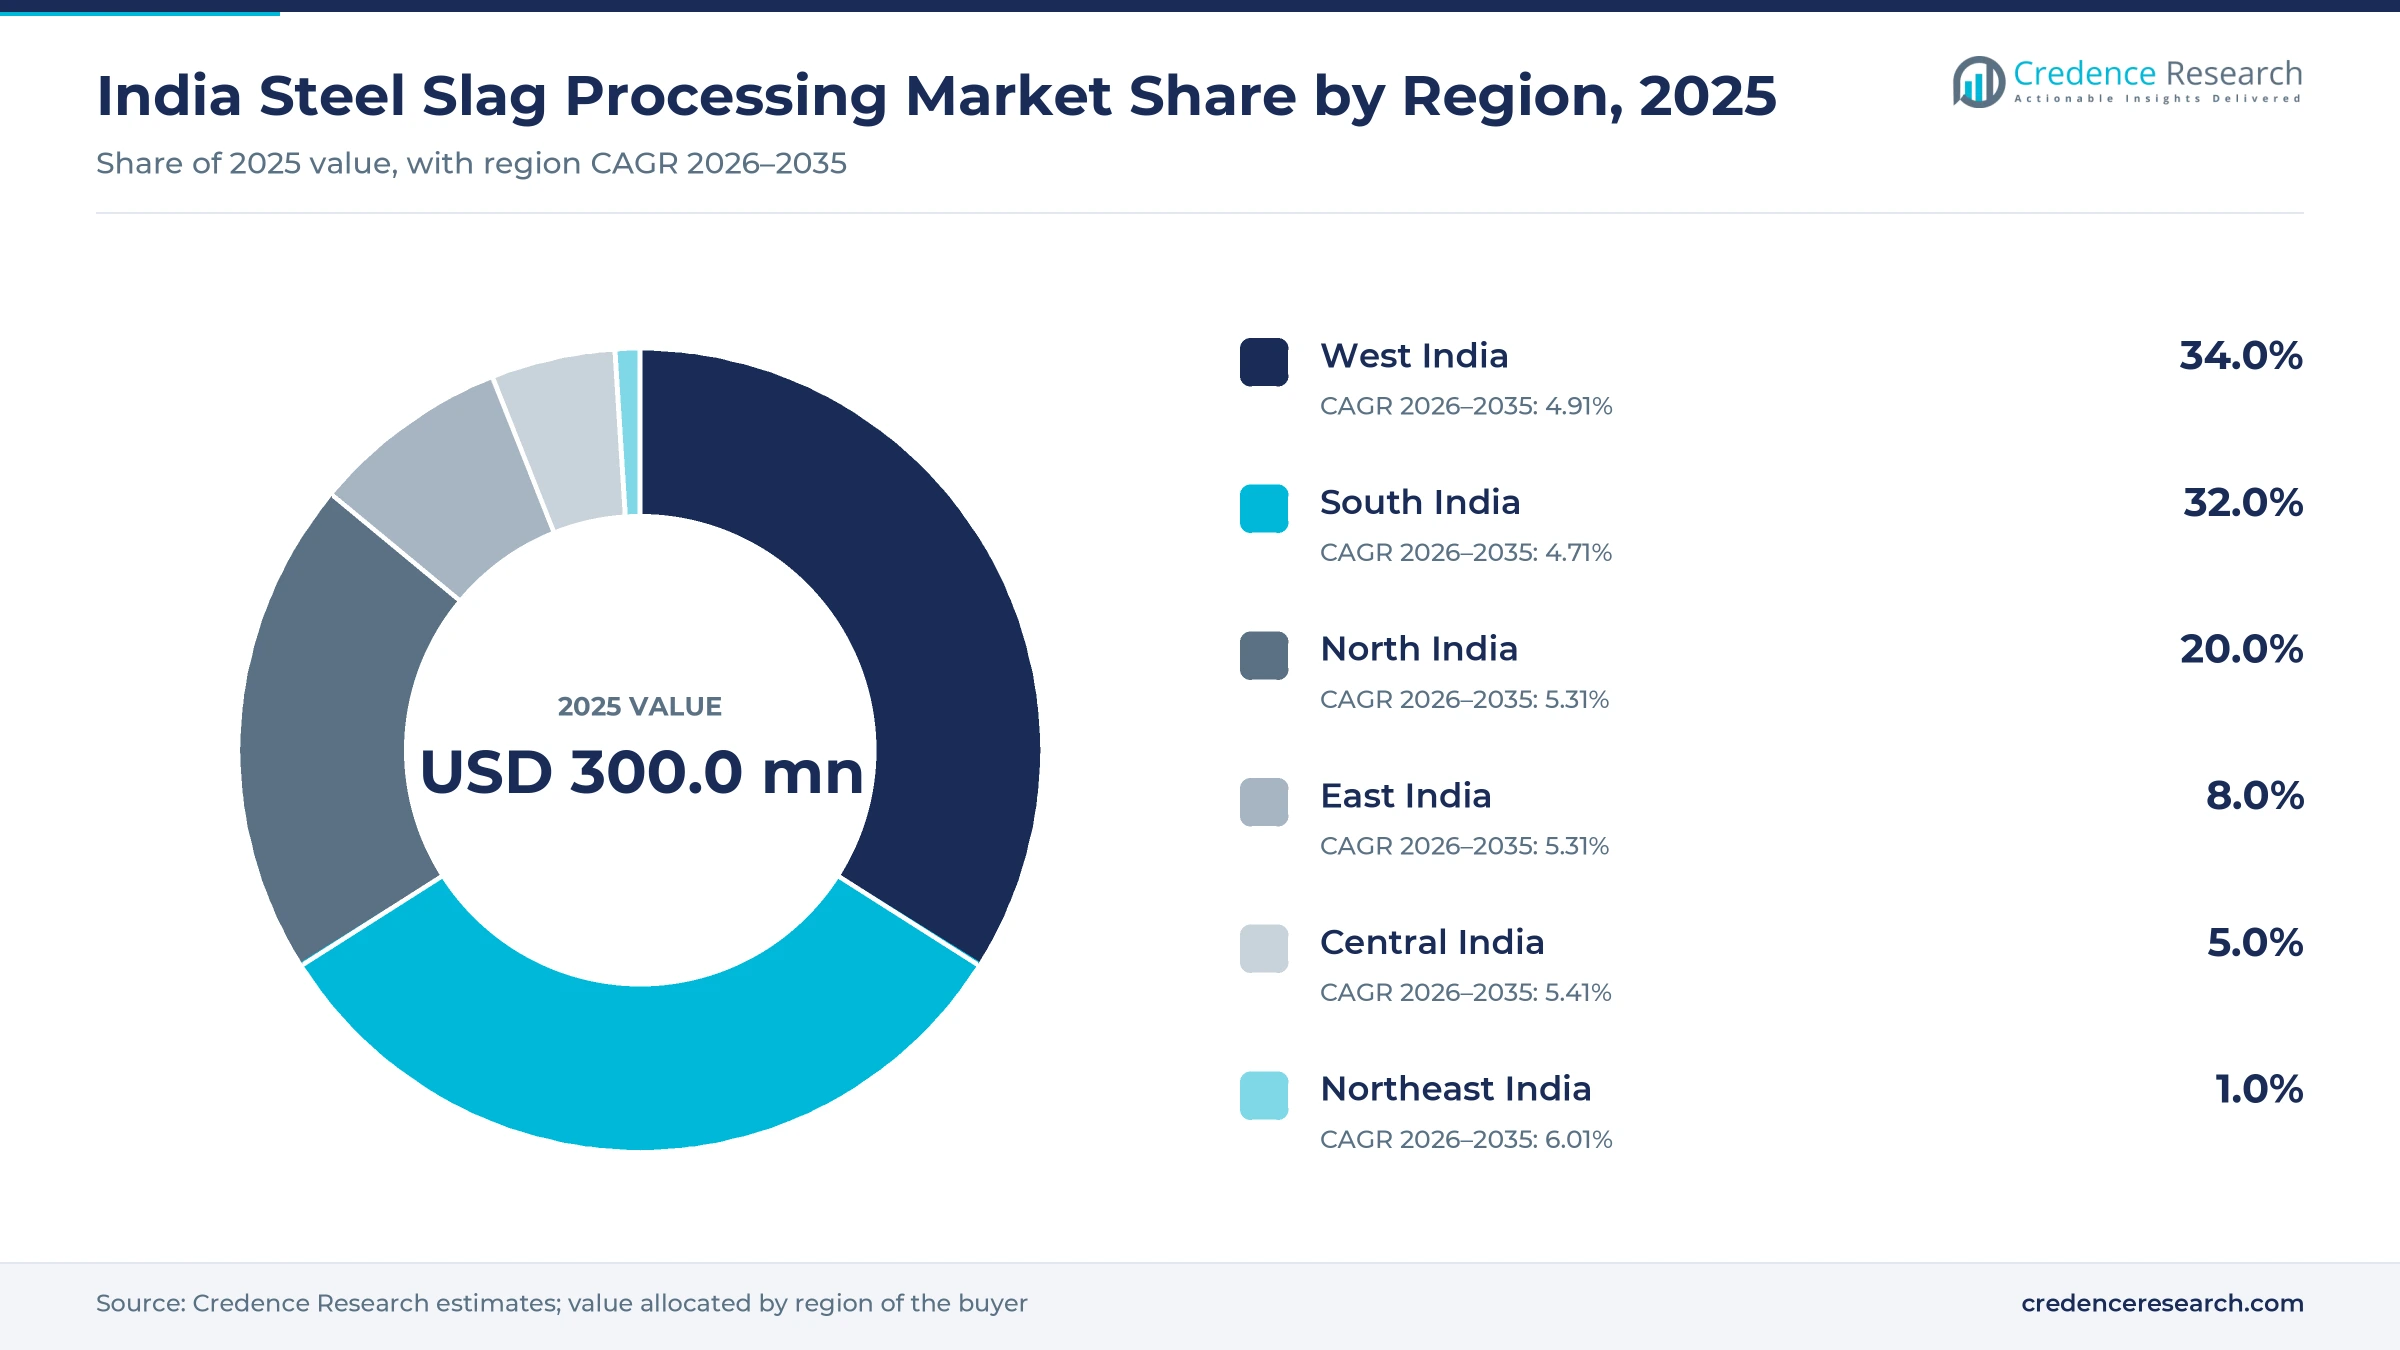
West India leads on Dolvi and Hazira slag volumes
| Region | Value, 2025 (USD million) | Share, 2025 | CAGR, 2026–2035 |
|---|---|---|---|
| West India | 102.0 | 34.0% | 4.91% |
| South India | 96.0 | 32.0% | 4.71% |
| North India | 60.0 | 20.0% | 5.31% |
| East India | 24.0 | 8.0% | 5.31% |
| Central India | 15.0 | 5.0% | 5.41% |
| Northeast India | 3.0 | 1.0% | 6.01% |
West India leads on Dolvi and Hazira slag volumes
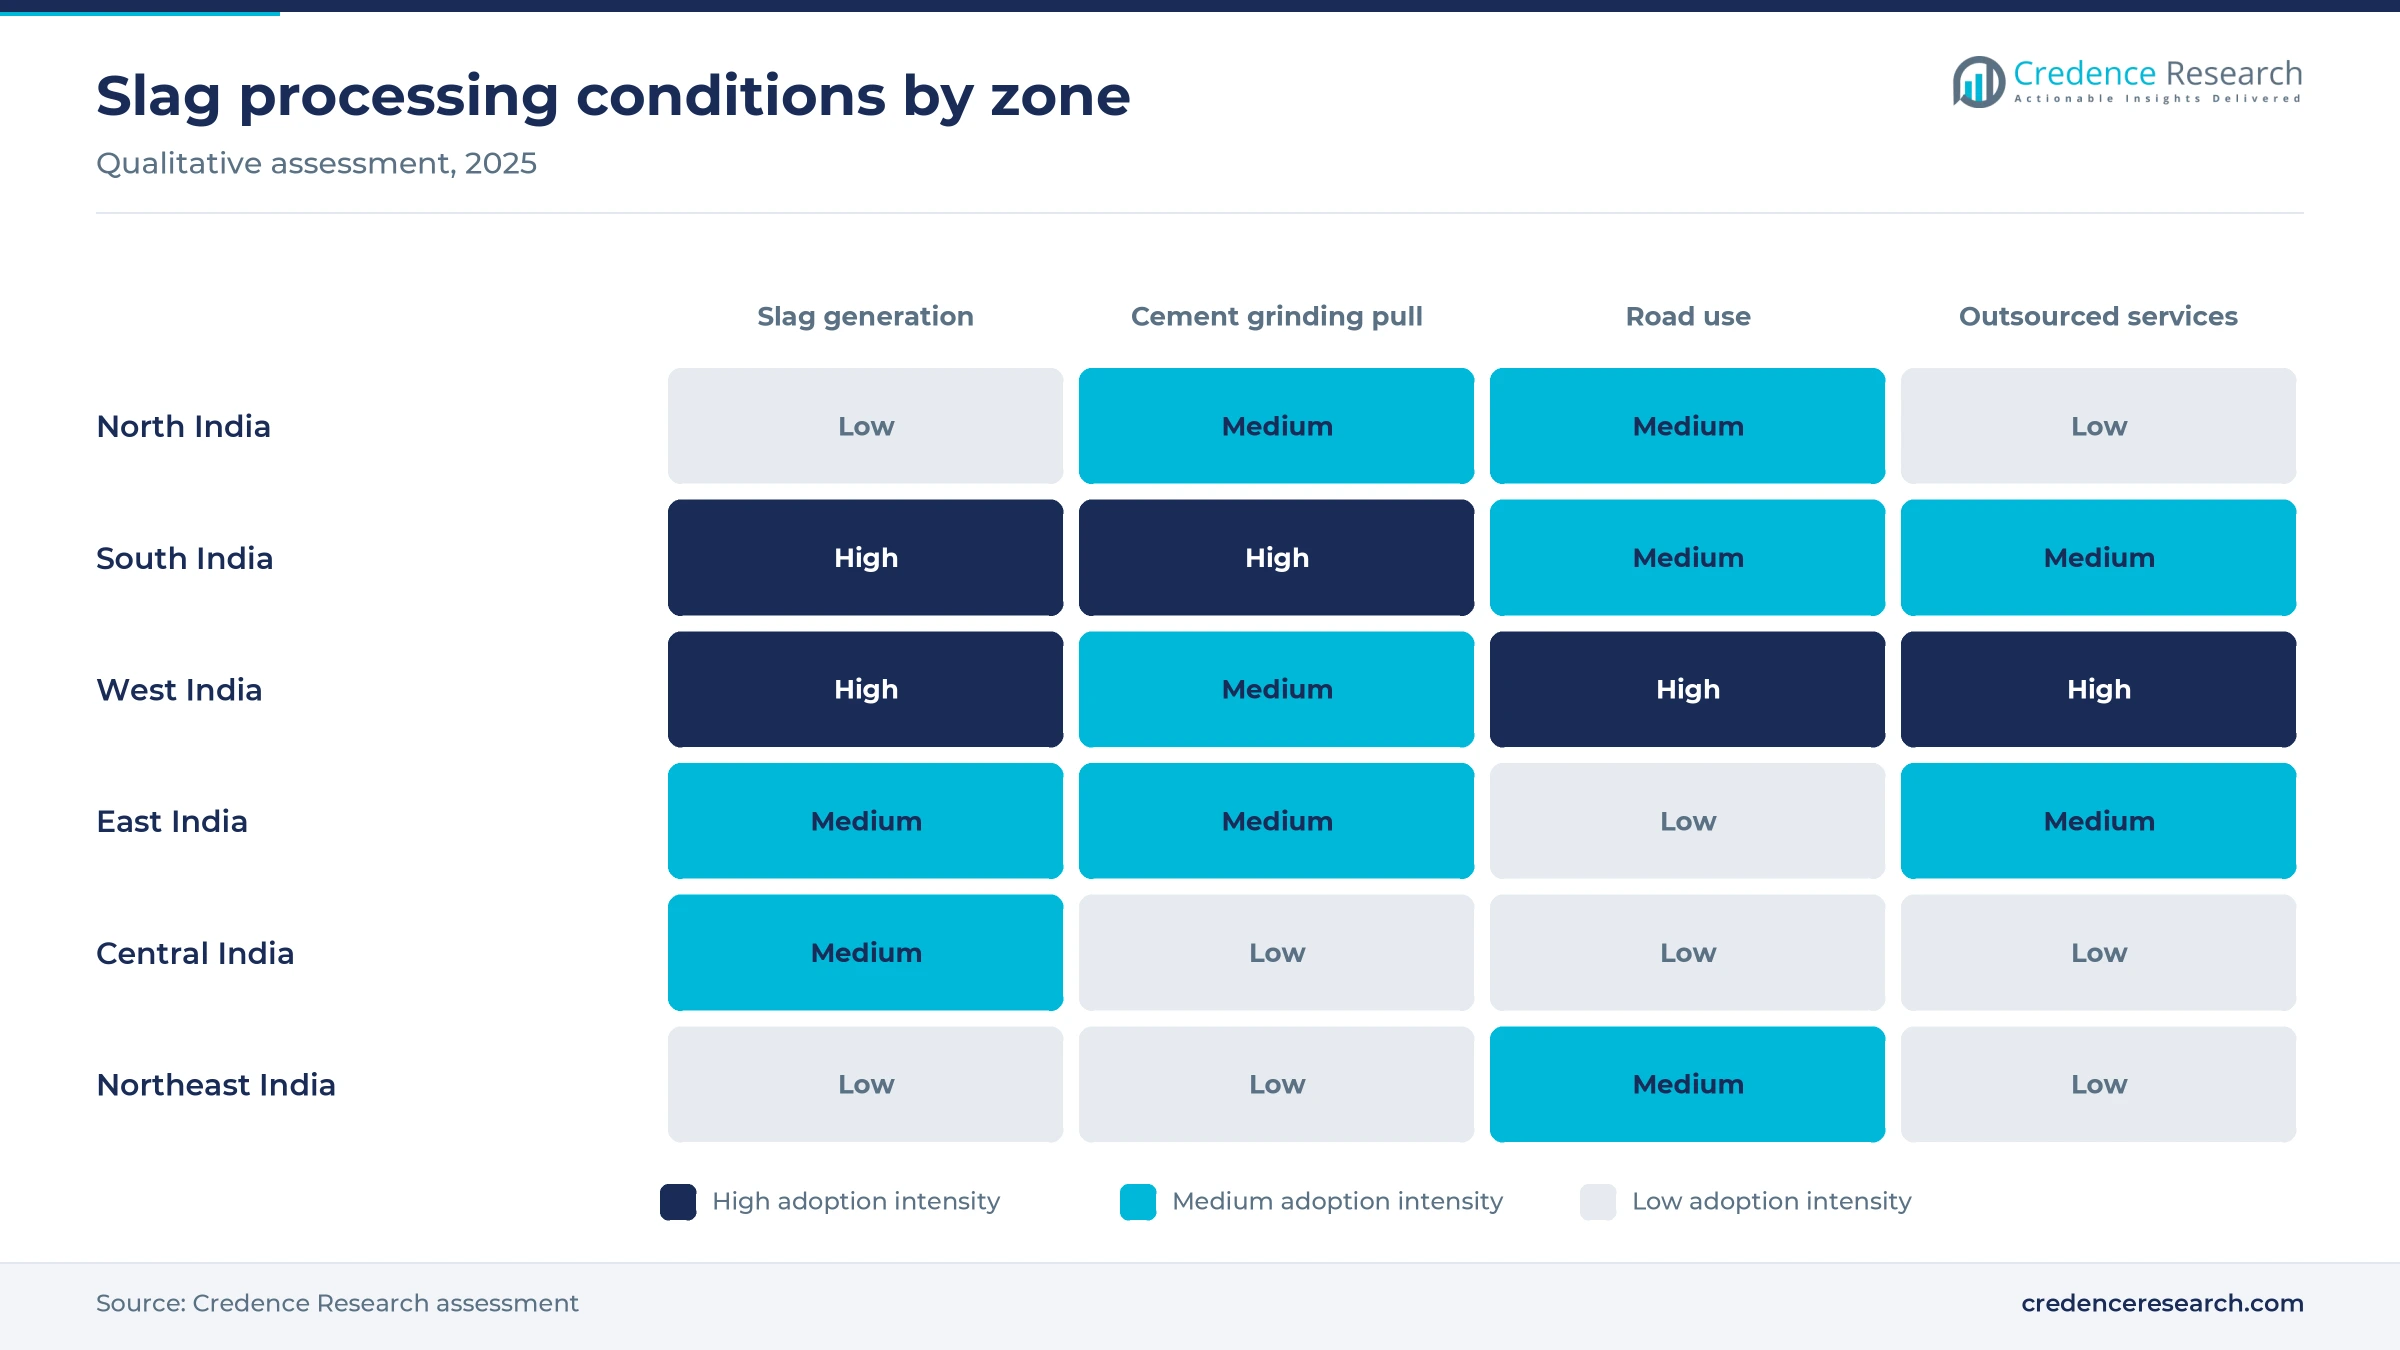
West India held 34.0% of 2025 value and grows at 4.91% a year, the largest base in the country. AM/NS India generates about 1.70 million metric tons of steel slag a year at Hazira in Gujarat and sells it as AM/NS Aakar for roads in Surat. In Maharashtra, JSW Steel turned about 80,000 metric tons of CONARC slag from Dolvi into an NH-66 road section, and Harsco handles slag at the same plant. Slag here competes directly with quarried construction aggregates for highway work.
South India grows on Vijayanagar slag and cement units
South India held 32.0% of 2025 value and grows at 4.71% a year, the second-largest zone. JSW Steel's Vijayanagar works in Karnataka used 25,039 metric tons of LD slag in place of limestone in its blast furnaces, according to its 2024-25 annual report. JSW Cement had 11 million metric tons a year of grinding capacity in the south in March 2025, its IPO details show. At Visakhapatnam, RINL used only 19.18% of its LD slag in 2017, which leaves room for more processing.
North India gains as new cement grinding units arrive
North India held 20.0% of 2025 value and grows at 5.31% a year, a little faster than the national rate. The zone has fewer integrated mills, so processed slag moves in by rail for cement and road use. JSW Cement plans new plants in Rajasthan, Punjab and Uttar Pradesh, according to its IPO details published by Upstox, which would add slag grinding close to northern buyers. Highway building in the region adds demand for processed slag aggregates.
East India builds on Kalinganagar and farm product sales
East India held 8.0% of 2025 value and grows at 5.31% a year. Harsco won metal recovery and slag sales services at Tata Steel's Kalinganagar plant in Odisha in May 2017, including the job of developing slag sales in the region. JSW Cement had 5.10 million metric tons a year of grinding capacity in the east in March 2025. Tata Steel sells its Dhurvi Gold crop nutrient in Bihar, West Bengal and Odisha, which opens farm outlets for slag.
Central India rises with Bhilai slag and new plants
Central India held 5.0% of 2025 value and grows at 5.41% a year, among the faster zones. SAIL's Bhilai Steel Plant in Chhattisgarh is the main slag source, and SAIL used 88.47% of its BF slag against 57.55% of its LD slag, the Indian Bureau of Mines reported. JSW Cement plans a new plant in Madhya Pradesh, according to its IPO details, which would add a nearby buyer for granulated slag from the zone.
Northeast India starts from border road projects
Northeast India held 1.0% of 2025 value and grows at 6.01% a year, the fastest rate of any zone. Tata Steel sent 1,200 metric tons of Tata Aggreto to the Border Roads Organisation for Project Arunank in Arunachal Pradesh in November 2022, Maritime Gateway reported. Union minister Jitendra Singh said in July 2023 that the slag was supplied free of cost and moved by Indian Railways from Jamshedpur. Growth stays small in absolute terms because the zone has no integrated steel plant.
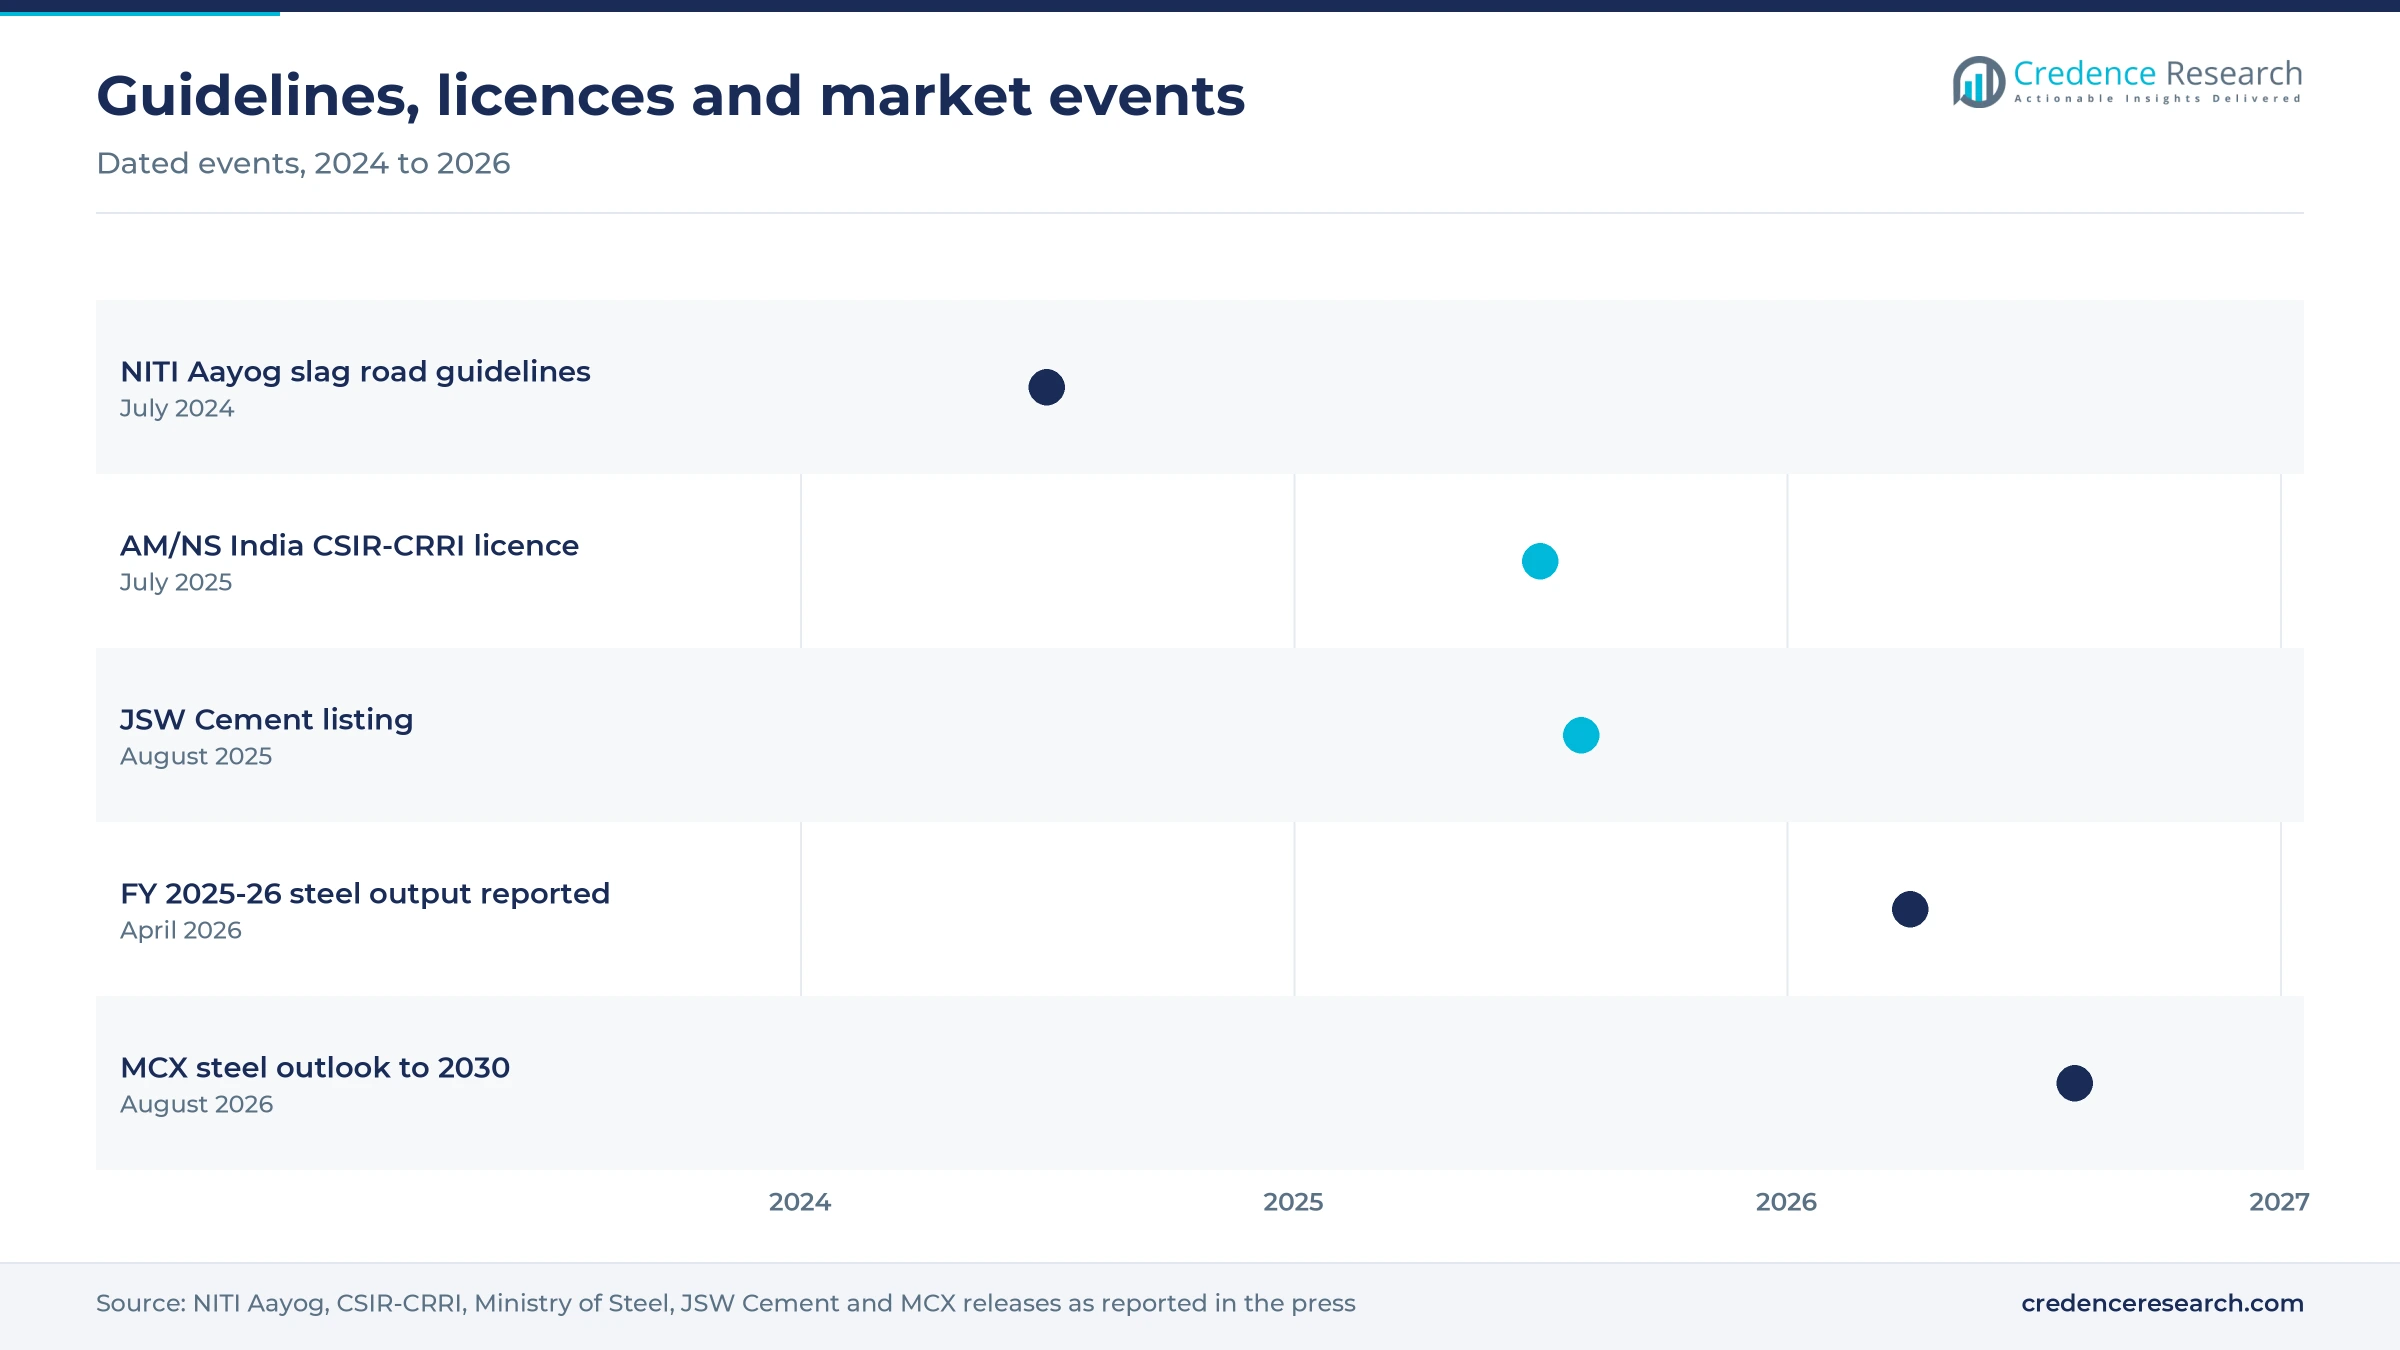
Guidelines, licences and listings, 2024 to 2026
| Development | Status and market relevance |
|---|---|
| In July 2024, NITI Aayog released guidelines promoting processed steel slag aggregates in road construction, with a framework for safe handling and storage. | Issued; guides road agencies and steel mills |
| In July 2025, AM/NS India became the first company to license CSIR-CRRI technology for processed EAF steel slag aggregates at Hazira. | Licensed; product sold as AM/NS Aakar from about 1.70 million metric tons of slag a year |
| In August 2025, JSW Cement listed on BSE and NSE after an IPO, as the largest GGBS maker in India with about 84% of the market in FY25. | Listed; grinding capacity planned to rise to 41.85 million metric tons a year |
| In April 2026, the Ministry of Steel reported that FY 2025-26 crude steel output rose 10.7% on the year. | Reported; capacity of about 220 million metric tons against 300 million by 2030 |
| In August 2026, an MCX report projected the blast furnace share of Indian steel output rising from 42% to 56% by 2030. | Published; implies more blast furnace slag for granulation |
Granulation, metal recovery and ageing set slag quality
- In-line granulation quenches molten blast furnace slag with water into glassy sand for GGBS, and Tata Steel granulates all of its BF slag this way.
- Magnetic separation pulls entrained metal out of crushed steel slag before screening, so mills recover iron and sell cleaner aggregates.
- Accelerated ageing uses wet and dry cycles or steam to hydrate free lime in weeks rather than the one to two years of open-yard weathering.
- Slag-to-nutrient processing turns basic oxygen furnace slag into crop supplements such as Dhurvi Gold, made at a 25,000-ton-a-year plant.
Need a Custom Version of This Report?
Tailor the scope, geography, or segments to your exact requirements.
- Custom geography or segment scope
- Direct access to our analyst team
Mills and mill service firms compete for slag value
Competition in Indian steel slag processing turns on who controls the slag at the mill gate. Integrated producers such as Tata Steel, SAIL, JSW Steel and AM/NS India run most granulation and crushing in house and increasingly sell branded products, from Tata Aggreto to AM/NS Aakar. Mill service firms compete for outsourced work, and Harsco, now Enviri, announced a 10-year contract in January 2019, starting that September, for under-furnace digging, ladle wrecking and hot slag transport at JSW Steel's Dolvi plant. JSW Cement sits on the buying side as the largest GGBS maker, with about 84% of the market in FY25. Smaller crushers and traders bid for LD slag lots from public sector plants. Winners combine steady access to slag, approval under CSIR-CRRI and IRC norms, and contracts with road or cement buyers within an economic freight distance.
Companies profiled and their roles in this market
| Company | Type | Role in the market |
|---|---|---|
| Enviri (Harsco) | Mill services provider | Slag handling at JSW Steel Dolvi; metal recovery and slag sales at Tata Steel Kalinganagar |
| Tata Steel | Integrated steelmaker | In-line BF slag granulation; Tata Aggreto, Tata Nirman and Dhurvi Gold slag products |
| JSW Cement | GGBS producer and buyer | About 84% of the GGBS market in FY25; 5.18 million metric tons of GGBS sold |
| SAIL | Integrated steelmaker | 88.47% BF slag and 57.55% LD slag use; Bokaro slag pilot with Ram Charan Company |
| AM/NS India | Integrated steelmaker | First CSIR-CRRI slag aggregate licensee; AM/NS Aakar from Hazira |
| JSW Steel | Integrated steelmaker | CONARC slag for the NH-66 road section; LD slag reuse at Vijayanagar |
Processors with road and cement offtake will gain share
Credence Research's view is that processors with assured road and cement offtake will take share as the market grows from USD 300.0 million in 2025. Tonnage will rise faster than value, because steel output keeps climbing toward 300 million metric tons of capacity by 2030 while blast furnace slag is already granulated at most integrated mills. Road aggregates are the fastest-growing use, and Indian slag aggregates will be judged against Asia Pacific construction aggregates on price and specification. Outsourced service contracts gain share as mills focus capital and staff on steelmaking itself.
Mill output data and slag yields anchor the estimates
The report uses 2025 as the base year and forecasts to 2035. Market values come from the Credence Research model, built from estimates of slag generated by Indian iron and steel plants, the share processed and the value added per metric ton by granulation, crushing, metal recovery, weathering and handling services. Regional, slag type, use and model splits are Credence Research estimates. Inputs include Ministry of Steel and Joint Plant Committee output data, Indian Bureau of Mines slag data, Indian Roads Congress and CSIR-CRRI publications, IEA analysis, company filings and announcements, and press reports. The report did not conduct interviews or surveys and relies only on published sources.
Road aggregates carry processing growth through 2035
Through 2035 the steel slag processing market grows at a 5.00% CAGR to reach USD 488.7 million, as new blast furnaces and steel melt shops add slag and road agencies take more processed aggregates. The IEA notes that steel demand and production in India are set to rise faster than in any other single large economy. West India keeps the lead on Dolvi and Hazira, while Northeast and Central India grow fastest from small bases. By 2035, steel (LD) slag takes a larger share of value as ageing and metal recovery spread.
Frequently Asked Questions
How big is the India steel slag processing market?
Which region leads the market?
Which slag type holds the largest share?
Which use grows fastest?
How much slag does India generate?
Which companies are active in the market?
What limits the use of LD slag in roads?
How is slag used in agriculture?
Table of Content
Chapter 1 Market Segmentation
- 1.1 Segmentation Framework
- 1.1.1 Product and Service Classification
- 1.1.2 Application and End-Use Classification
- 1.1.3 Technology and Solution Classification
- 1.1.4 Customer and Distribution Channel Classification
- 1.1.5 Geographic Segmentation
- 1.1.6 Market Segment Definitions and Boundaries
- 1.2 By Slag Type
- 1.2.1 BF Slag
- 1.2.2 Steel (LD) Slag
- 1.3 By Use
- 1.3.1 Cement
- 1.3.2 Road Aggregates
- 1.3.3 Fertilizer
- 1.4 By Model
- 1.4.1 In-House
- 1.4.2 Outsourced
Chapter 2 Introduction
- 2.1 Report Objectives and Scope
- 2.2 Product Definition and Industry Terminology
- 2.3 Market Inclusions and Exclusions
- 2.4 Research Process
- 2.4.1 Primary Research and Expert Interviews
- 2.4.2 Secondary Research and Source Review
- 2.4.3 Top-Down and Bottom-Up Estimation
- 2.4.4 Data Triangulation and Verification
- 2.5 Market Size Measurement Basis
- 2.5.1 2025: USD 300.0 million → 2035: USD 488.7 million
- 2.6 Historical and Forecast Reference Periods
- 2.6.1 Historical Period: 2018-2025
- 2.6.2 Base Year: 2025
- 2.6.3 Forecast Period: 2025-2035
- 2.7 Research Assumptions and Limitations
Chapter 3 Executive Summary
- 3.1 Market Snapshot and Key Findings
- 3.2 Base-Year Market Size, 2025
- 3.3 Forecast Market Size, 2035
- 3.4 Revenue and Volume Growth Outlook
- 3.5 Key Demand and Supply Indicators
- 3.6 Leading Market Segments
- 3.7 Fastest-Growing Market Opportunities
- 3.8 Regional Performance Highlights
- 3.9 Technology and Industry Transformation
- 3.10 Competitive Landscape Summary
- 3.11 Analyst View and Strategic Implications
Chapter 4 India Steel Slag Processing Market Trends and Developments
- 4.1 Historical Industry Development, 2018-2025
- 4.2 Recent Market Trends and Developments
- 4.3 Demand and Customer Behavior Trends
- 4.4 Technology and Product Innovation
- 4.5 Artificial Intelligence, Automation and Digitalization
- 4.6 Local Manufacturing and Supply Chain Realignment
- 4.7 Industry Partnerships, Mergers and Acquisitions
- 4.8 Sustainability and Circular Economy Developments
- 4.9 Government and Private Sector Investment Trends
- 4.10 Emerging Business Models and Commercialization
- 4.11 Industry Developments and Announcements
Chapter 5 India Steel Slag Processing Market Production, Supply and Demand Analysis
- 5.1 Demand Trend and Consumption Analysis, 2018-2025
- 5.2 Demand Forecast, 2025-2035
- 5.3 Production and Output Trend, 2018-2025
- 5.4 Production and Output Forecast, 2025-2035
- 5.5 Installed Capacity and Capacity Utilization
- 5.6 Company-Wise Production Plants and Statistics
- 5.6.1 Installed Production Capacity
- 5.6.2 Actual Production
- 5.6.3 Planned Capacity and Expansion Targets
- 5.7 Supply Chain Structure and Procurement Trends
- 5.8 Supply-Demand Gap and Bottlenecks
- 5.9 Import Dependence and Sourcing Structure
- 5.10 Contract Manufacturing and Outsourcing
- 5.11 Regional Supply and Demand Concentration
Chapter 6 India Steel Slag Processing Market Pricing Analysis
- 6.1 Pricing Structure and Measurement
- 6.2 Historical Pricing Trends, 2018-2025
- 6.3 Pricing Outlook, 2025-2035
- 6.4 Average Selling Price and Unit Economics
- 6.5 Pricing by Product and Market Segment
- 6.6 Geographic Pricing Differences
- 6.7 Key Input, Energy, Labor and Logistics Costs
- 6.8 Contract Pricing and Purchasing Models
- 6.9 Pricing Sensitivity and Competitive Positioning
- 6.10 Price, Margin and Profitability Implications
Chapter 7 India Steel Slag Processing Market Dynamics
- 7.1 Market Growth Drivers
- 7.1.1 Demand-Side Drivers
- 7.1.2 Technology and Innovation Drivers
- 7.1.3 Infrastructure and Investment Drivers
- 7.1.4 Regulatory and Policy Drivers
- 7.2 Market Restraints
- 7.2.1 Cost and Affordability Constraints
- 7.2.2 Technology and Adoption Barriers
- 7.2.3 Supply Chain and Operational Constraints
- 7.3 Market Challenges
- 7.3.1 Competitive Pressure and Margin Erosion
- 7.3.2 Skills, Infrastructure and Implementation Gaps
- 7.4 Emerging Market Opportunities
- 7.5 Market Dynamics Impact and Time-Horizon Assessment
Chapter 8 India Steel Slag Processing Value Chain Analysis
- 8.1 Industry Value Chain Overview
- 8.2 Upstream Suppliers and Critical Inputs
- 8.3 Technology and Component Providers
- 8.4 Manufacturing or Service Delivery
- 8.5 Distribution, Channel Partners and Integrators
- 8.6 Downstream Applications and End Users
- 8.7 Value Addition and Profit Pools
- 8.8 Vertical Integration and Outsourcing
- 8.9 Supplier Concentration and Risk
- 8.10 Supply Chain Localization and Resilience
Chapter 9 India Steel Slag Processing Market Regulations and Policies
- 9.1 Relevant Laws, Standards and Compliance Frameworks
- 9.2 Product, Service, Safety and Quality Requirements
- 9.3 Government Policies, Incentives and Subsidies
- 9.4 Imports, Exports and Trade Barriers
- 9.5 Public Procurement and Local Content Requirements
- 9.6 Environmental and Sustainability Compliance
- 9.7 Upcoming Policy Changes and Market Implications
Chapter 10 India Steel Slag Processing Market Hotspots and Opportunities
- 10.1 Market Opportunity Mapping and Growth Hotspots
- 10.2 High-Growth Applications and Customer Groups
- 10.3 Underserved Markets and White-Space Opportunities
- 10.4 Emerging Technology and Product Opportunities
- 10.5 New Capacity and Investment Hotspots
- 10.6 Market Entry and Expansion Opportunities
- 10.7 Distribution and Partnership Opportunities
- 10.8 Near-Term and Long-Term Commercial Potential
- 10.9 Opportunity Attractiveness and Execution Risks
Chapter 11 India Steel Slag Processing Market Outlook, 2025-2035
- 11.1 Market Size and Analysis
- 11.1.1 Revenue (Market Measurement: 2025: USD 300.0 million → 2035: USD 488.7 million)
- 11.1.2 Market Volume and Quantity Sold
- 11.1.3 Historical Market Size, 2018-2025
- 11.1.4 Base-Year Market Size, 2025
- 11.2 Market Forecast, 2025-2035
- 11.2.1 Revenue Forecast to 2035
- 11.2.2 Volume Forecast to 2035
- 11.2.3 CAGR and Year-on-Year Growth
- 11.2.4 Incremental Revenue Opportunity
- 11.3 Forecast Assumptions and Scenario Analysis
- 11.3.1 Base-Case Forecast
- 11.3.2 Optimistic and Conservative Scenarios
- 11.3.3 Technology, Pricing and Policy Sensitivities
- 11.4 Market Attractiveness and Growth Outlook
Chapter 12 India Steel Slag Processing Market Segmentation and Outlook
- 12.1 Segmentation Summary and Market Shares, 2025
- 12.2 Largest and Fastest-Growing Segments
- 12.3 By Slag Type - Market Size and Forecast, 2025-2035
- 12.3.1 Segment Definition and Scope
- 12.3.2 Historical Market Size, 2018-2025
- 12.3.3 Revenue Forecast, 2025-2035
- 12.3.4 Volume Forecast, 2025-2035
- 12.3.5 Base-Year Market Share, 2025
- 12.3.6 Segment CAGR and Growth Drivers
- 12.3.7 Subsegment Market Size and Forecast
- 12.3.7.1 BF Slag
- 12.3.7.2 Steel (LD) Slag
- 12.3.8 Subsegment Pricing and Adoption Trends
- 12.3.9 Leading Suppliers and Competition
- 12.3.10 Regional Demand and Opportunities
- 12.4 By Use - Market Size and Forecast, 2025-2035
- 12.4.1 Segment Definition and Scope
- 12.4.2 Historical Market Size, 2018-2025
- 12.4.3 Revenue Forecast, 2025-2035
- 12.4.4 Volume Forecast, 2025-2035
- 12.4.5 Base-Year Market Share, 2025
- 12.4.6 Segment CAGR and Growth Drivers
- 12.4.7 Subsegment Market Size and Forecast
- 12.4.7.1 Cement
- 12.4.7.2 Road Aggregates
- 12.4.7.3 Fertilizer
- 12.4.8 Subsegment Pricing and Adoption Trends
- 12.4.9 Leading Suppliers and Competition
- 12.4.10 Regional Demand and Opportunities
- 12.5 By Model - Market Size and Forecast, 2025-2035
- 12.5.1 Segment Definition and Scope
- 12.5.2 Historical Market Size, 2018-2025
- 12.5.3 Revenue Forecast, 2025-2035
- 12.5.4 Volume Forecast, 2025-2035
- 12.5.5 Base-Year Market Share, 2025
- 12.5.6 Segment CAGR and Growth Drivers
- 12.5.7 Subsegment Market Size and Forecast
- 12.5.7.1 In-House
- 12.5.7.2 Outsourced
- 12.5.8 Subsegment Pricing and Adoption Trends
- 12.5.9 Leading Suppliers and Competition
- 12.5.10 Regional Demand and Opportunities
- 12.6 Segment Growth Comparison
- 12.7 Segment Attractiveness and Priority Matrix
Chapter 13 India Steel Slag Processing Geographic Market Outlook, 2025-2035
- 13.1 Domestic Market Distribution and Demand Clusters
- 13.2 State- or Province-Wise Market Size and Forecast, 2025-2035
- 13.3 City and Metropolitan Market Outlook
- 13.4 Industrial, Manufacturing and Commercial Clusters
- 13.5 Geographic Concentration of Key End Users
- 13.6 Local Pricing and Purchasing Differences
- 13.7 Domestic Production Facilities and Capacity Map
- 13.8 Local Infrastructure and Project Pipeline
- 13.9 State-Level Policy and Incentive Differences
- 13.10 Subnational Investment Hotspots and Opportunities
- 13.11 Distribution and Logistics Networks
- 13.12 Domestic Competitive Footprint
Chapter 14 India Steel Slag Processing Technology, Innovation and Sustainability Outlook
- 14.1 Technology Landscape and Maturity
- 14.2 Product, Process and Service Innovation
- 14.3 AI, Automation and Digital Tools in the Industry
- 14.4 Technology Adoption and Performance Benchmarking
- 14.5 Innovation Pipeline and R&D Investment
- 14.6 Patent and Intellectual Property Trends
- 14.7 Energy Efficiency and Resource Management
- 14.8 Sustainability, Recycling and Circularity
- 14.9 Technology Roadmap, 2025-2035
- 14.10 Risks of Obsolescence and Technology Substitution
Chapter 15 India Steel Slag Processing Market Key Strategic Imperatives
- 15.1 Growth and Market Entry Priorities
- 15.2 High-Return Products and Segments
- 15.3 Pricing, Profitability and Cost Optimization
- 15.4 Technology Investment and Product Differentiation
- 15.5 Supply Chain Localization and Resilience
- 15.6 Distribution and Customer Acquisition
- 15.7 Partnership, Acquisition and Capacity Strategy
- 15.8 Regional Expansion Priorities
- 15.9 Short-, Medium- and Long-Term Actions
Chapter 16 Competition Outlook
- 16.1 Industry Competition Characteristics
- 16.2 Market Structure and Concentration
- 16.3 Market Share and Competitive Positioning, 2025
- 16.4 Company-Wise Revenue and Product Benchmarking
- 16.5 Production and Service Capacity Benchmarking
- 16.6 Technology, Pricing and Differentiation
- 16.7 Regional Footprint and Distribution Strength
- 16.8 Mergers, Acquisitions and Strategic Alliances
- 16.9 New Entrants and Competitive Threats
- 16.10 Porter's Five Forces and Industry Attractiveness
- 16.11 Competitive Outlook, 2025-2035
Chapter 17 Company Profiles
- 17.1 Company Coverage and Selection Criteria
- 17.2 Enviri (Harsco)
- 17.2.1 Business Description
- 17.2.2 Company Ownership and Geographic Presence
- 17.2.3 Product and Service Portfolio
- 17.2.4 Manufacturing and Operating Footprint
- 17.2.5 Production Capacity and Expansion Plans
- 17.2.6 Financial Performance and Investment
- 17.2.7 Market Share and Competitive Position
- 17.2.8 Technology and Innovation Capabilities
- 17.2.9 Strategic Alliances or Partnerships
- 17.2.10 Recent Developments
- 17.2.11 Growth Strategy and Outlook
- 17.3 Tata Steel
- 17.4 JSW Cement
- 17.5 SAIL
- 17.6 AM/NS India
- 17.7 JSW Steel
- 17.8 Other Relevant Market Participants
Note: Every listed company is profiled on the structure shown under the first company. The company list is preliminary and may change based on research findings, market developments, data availability and client requirements.
Chapter 18 Disclaimer
- 18.1 Research and Forecast Disclaimer
- 18.2 Data Source and Estimation Limitations
Note: The depth of individual sections depends on data availability for this market. Volume, capacity, trade and other unit-based metrics are included where applicable.

