
Factory output, highways and tax rules lift truck volumes
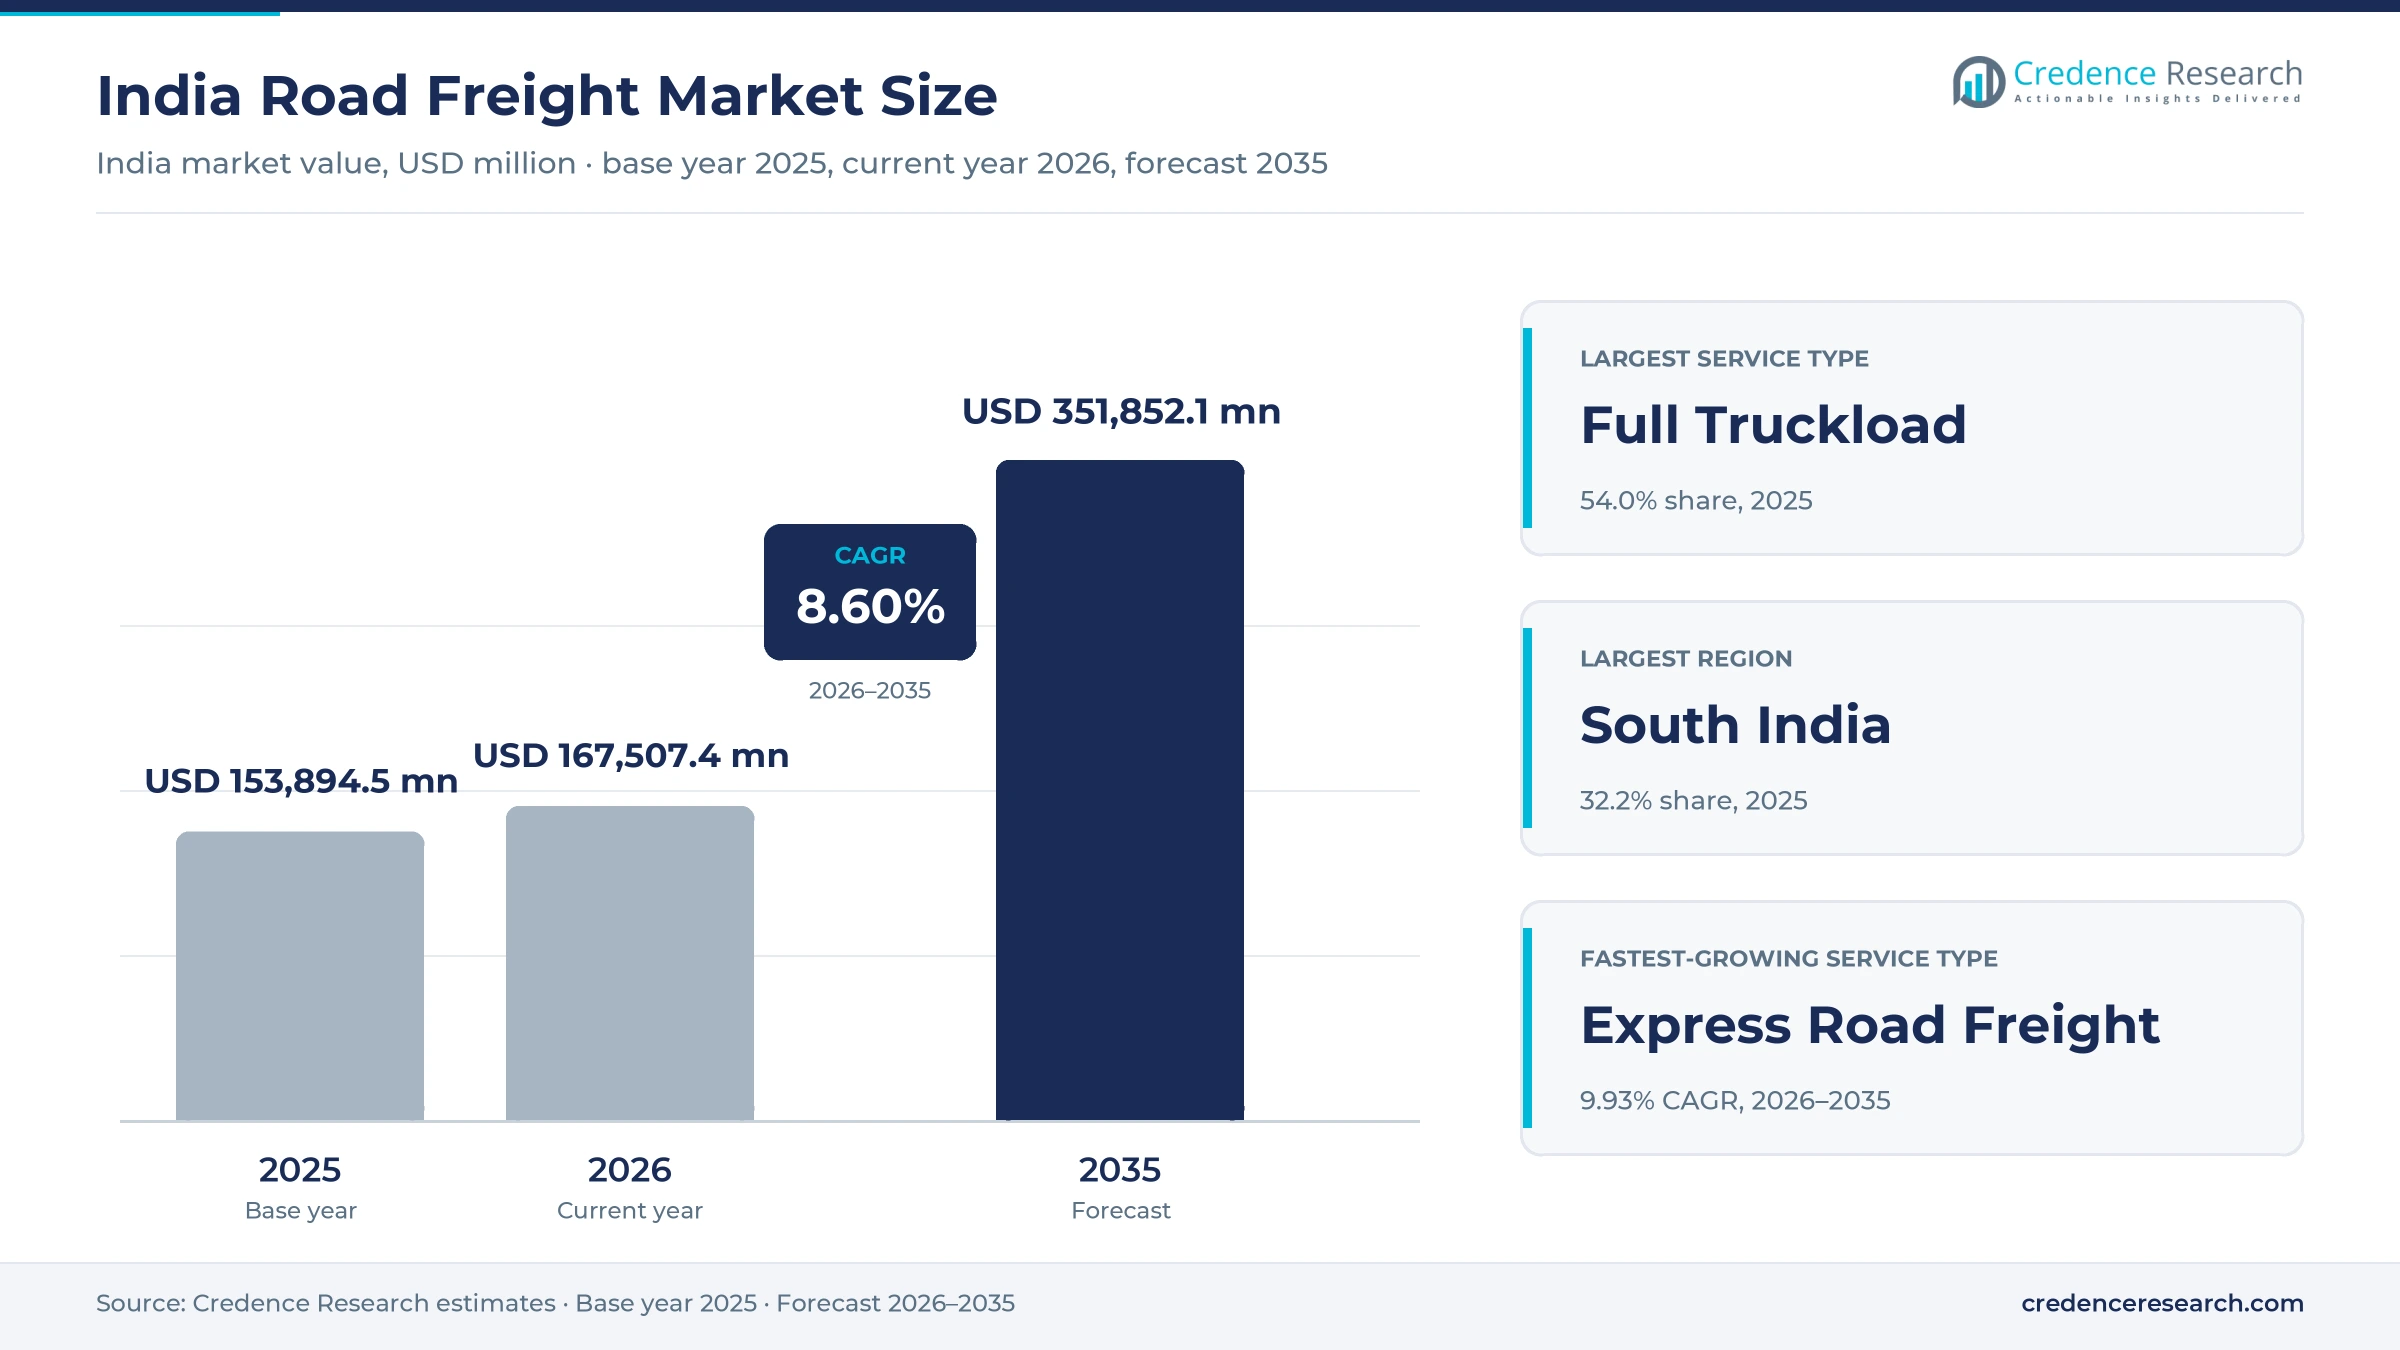
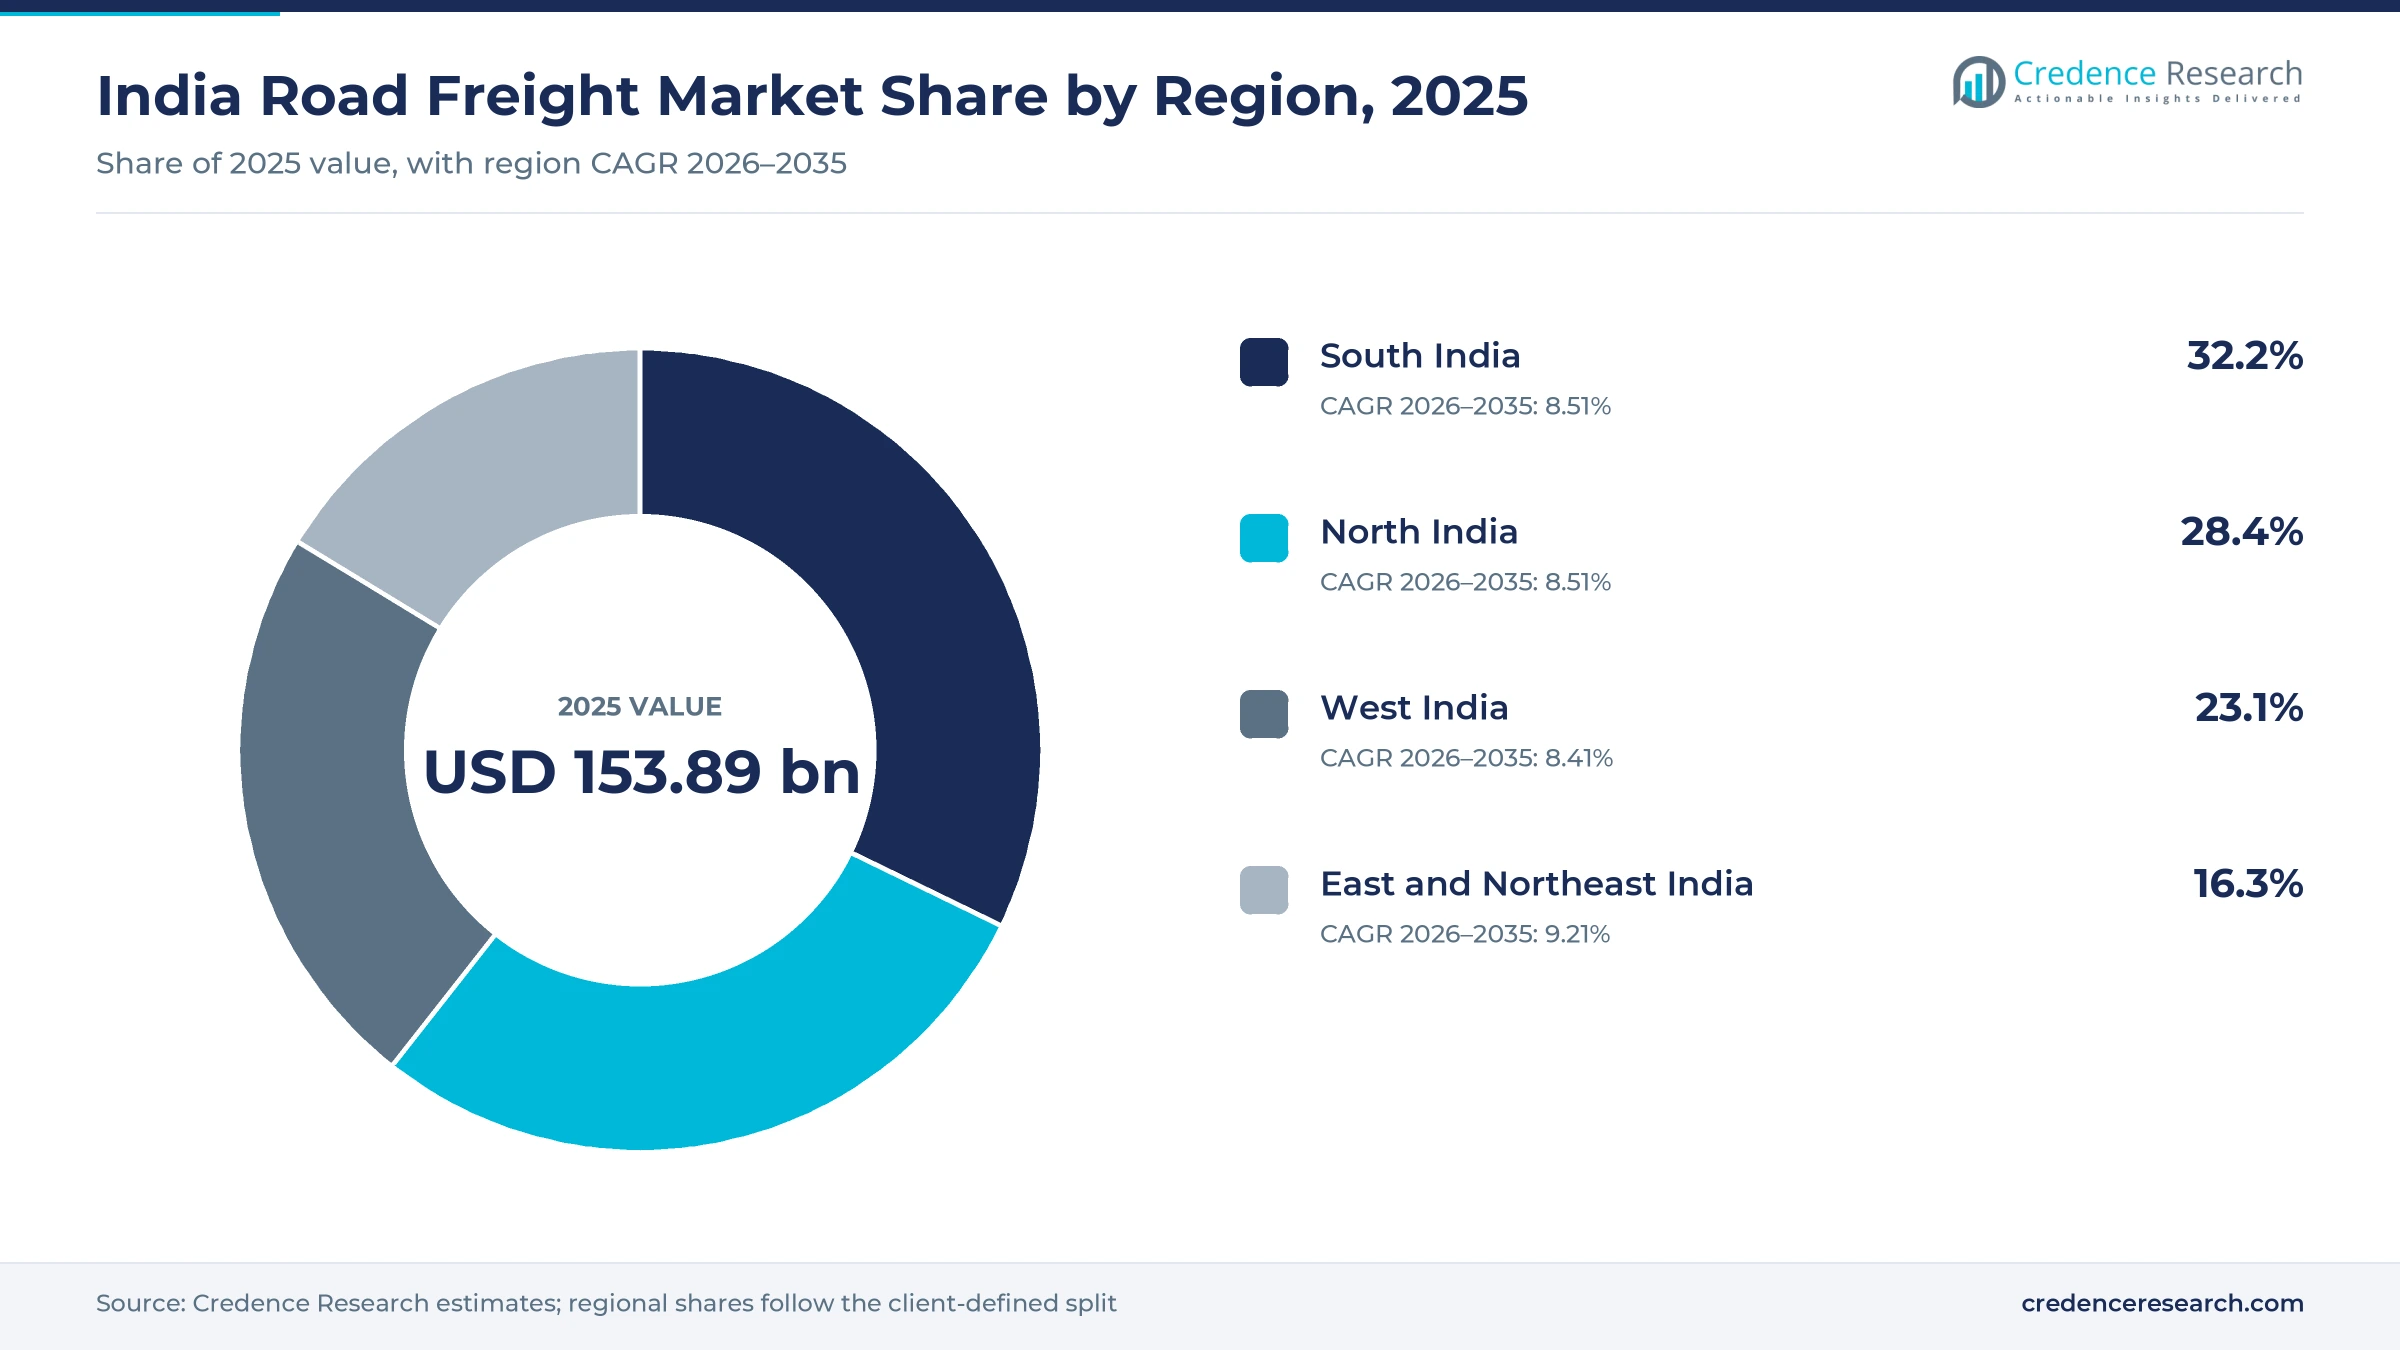
The India road freight market was valued at USD 153.89 billion in 2025 and is projected to increase from USD 167.51 billion in 2026 to USD 351.85 billion by 2035, registering a CAGR of 8.60% during 2026–2035. Demand comes from factories that move raw materials and components between plants, consumer goods companies that supply depots and stores, farms that send produce to cities, and online sellers that ship parcels across the country. South India held the largest regional share, 32.2% in 2025, because its automotive, electronics and port-linked industries generate dense long-haul and intercity traffic. East and Northeast India is the fastest-growing region at 9.21% a year, as new bridges, highways and logistics parks connect the zone to national markets. In turn, the goods and services tax on trucks and delivery vans fell from 28% to 18% after the council meeting of Sept. 3, 2025, which lowers the cost of adding fleet capacity.
Which truck haulage services and shippers does the estimate cover?
The estimate measures the value of freight services sold to shippers for moving goods by road within India and across its land borders. It counts full truckload and part truckload haulage, express road services and specialized haulage for heavy, oversized or temperature-sensitive cargo, whether the carrier owns the trucks or hires them.
The estimate excludes rail, air, coastal and inland waterway freight, passenger transport and the sale of vehicles themselves. The value chain runs from shippers and freight brokers through fleet owners and contract carriers to warehouses, distributors and final consignees in every state.
India Road Freight Market Insights
- The India road freight market was valued at USD 153.89 billion in 2025 and is projected to reach USD 351.85 billion by 2035, registering a CAGR of 8.60% during 2026–2035.
- South India held a 32.2% share of 2025 value, because its factories and ports generate the densest intercity truck traffic.
- Full truckload services led with a 54.0% share of 2025 value, because bulk industrial and consumer goods move in dedicated vehicles.
- The goods and services tax on trucks and delivery vans fell from 28% to 18% after the council meeting of Sept. 3, 2025.
- Delhivery raised its holding in Ecom Express to 99.87% on July 23, 2025, which consolidated two large express networks under one operator.
Full truckloads lead while express networks grow fastest
Why do full truckload services hold the largest share?
Based on service type, the market is categorized into full truckload, part truckload, express road freight and specialized haulage. Full Truckload led with a 54.0% share of 2025 value, because steel, cement, auto parts and consumer goods move in dedicated vehicles between plants and depots. Express Road Freight grows fastest at 9.93% a year, as online sellers and small manufacturers need scheduled, tracked deliveries to thousands of towns.
How do heavy trucks and tractor-trailers split haulage value?
Based on mode of transport, the market is categorized into light commercial vehicles, medium commercial vehicles, heavy commercial vehicles and tractor-trailers. Heavy Commercial Vehicles led with a 46.0% share of 2025 value, because multi-axle rigid trucks carry most intercity loads. Tractor-Trailers grow fastest at 9.33% a year, as new expressways and logistics parks favor larger loads over longer distances.
Which shipper industries generate the most truck freight?
Based on end-use industry, the market is categorized into manufacturing, FMCG and retail, agriculture and food, construction and mining, and e-commerce. Manufacturing led with a 31.0% share of 2025 value, because factories ship inputs and finished goods by road throughout the year. E-Commerce grows fastest at 10.49% a year, as online orders spread from large cities to smaller towns.
Why do contracted fleets carry the largest share of value?
Based on business model, the market is categorized into asset-owned fleet, contracted fleet, broker-led aggregation and digital freight marketplace. Contracted Fleet led with a 41.0% share of 2025 value, because large shippers sign fixed lanes with carriers that hire attached trucks. Digital Freight Marketplace grows fastest at 10.96% a year, as small shippers book loads and track trucks through apps.
| Segment Group | Leading Sub-segment | Share, 2025 | Fastest-growing Sub-segment | CAGR, 2026–2035 |
|---|---|---|---|---|
| By Service Type | Full Truckload | 54.0% | Express Road Freight | 9.93% |
| By Mode of Transport | Heavy Commercial Vehicles | 46.0% | Tractor-Trailers | 9.33% |
| By End-Use Industry | Manufacturing | 31.0% | E-Commerce | 10.49% |
| By Business Model | Contracted Fleet | 41.0% | Digital Freight Marketplace | 10.96% |
Request a Free Sample
Fill in your details and we'll send you a free sample report.
- Sample data tables & charts
- Research methodology
Industrial growth, highways and digital records drive demand
How does industrial and consumer growth lift truck freight?
Industrial and consumer growth lifts truck freight, because factories, retailers and farms move most of their goods by road between plants, depots and stores. India's real gross domestic product grew 7.6% in 2025, up from 7.1% in 2024, according to the World Bank. Manufacturing value added reached 13.5% of gross domestic product in 2025, which keeps raw material and component flows rising. Domestic sales of commercial vehicles hit a record 1.08 million units in fiscal 2026, up 12.6% on the year, as fleet owners added capacity. As a result, manufacturing shippers hold 31.0% of 2025 value, while full truckload services remain the backbone of bulk industrial lanes.
Why does highway and multimodal investment speed up haulage?
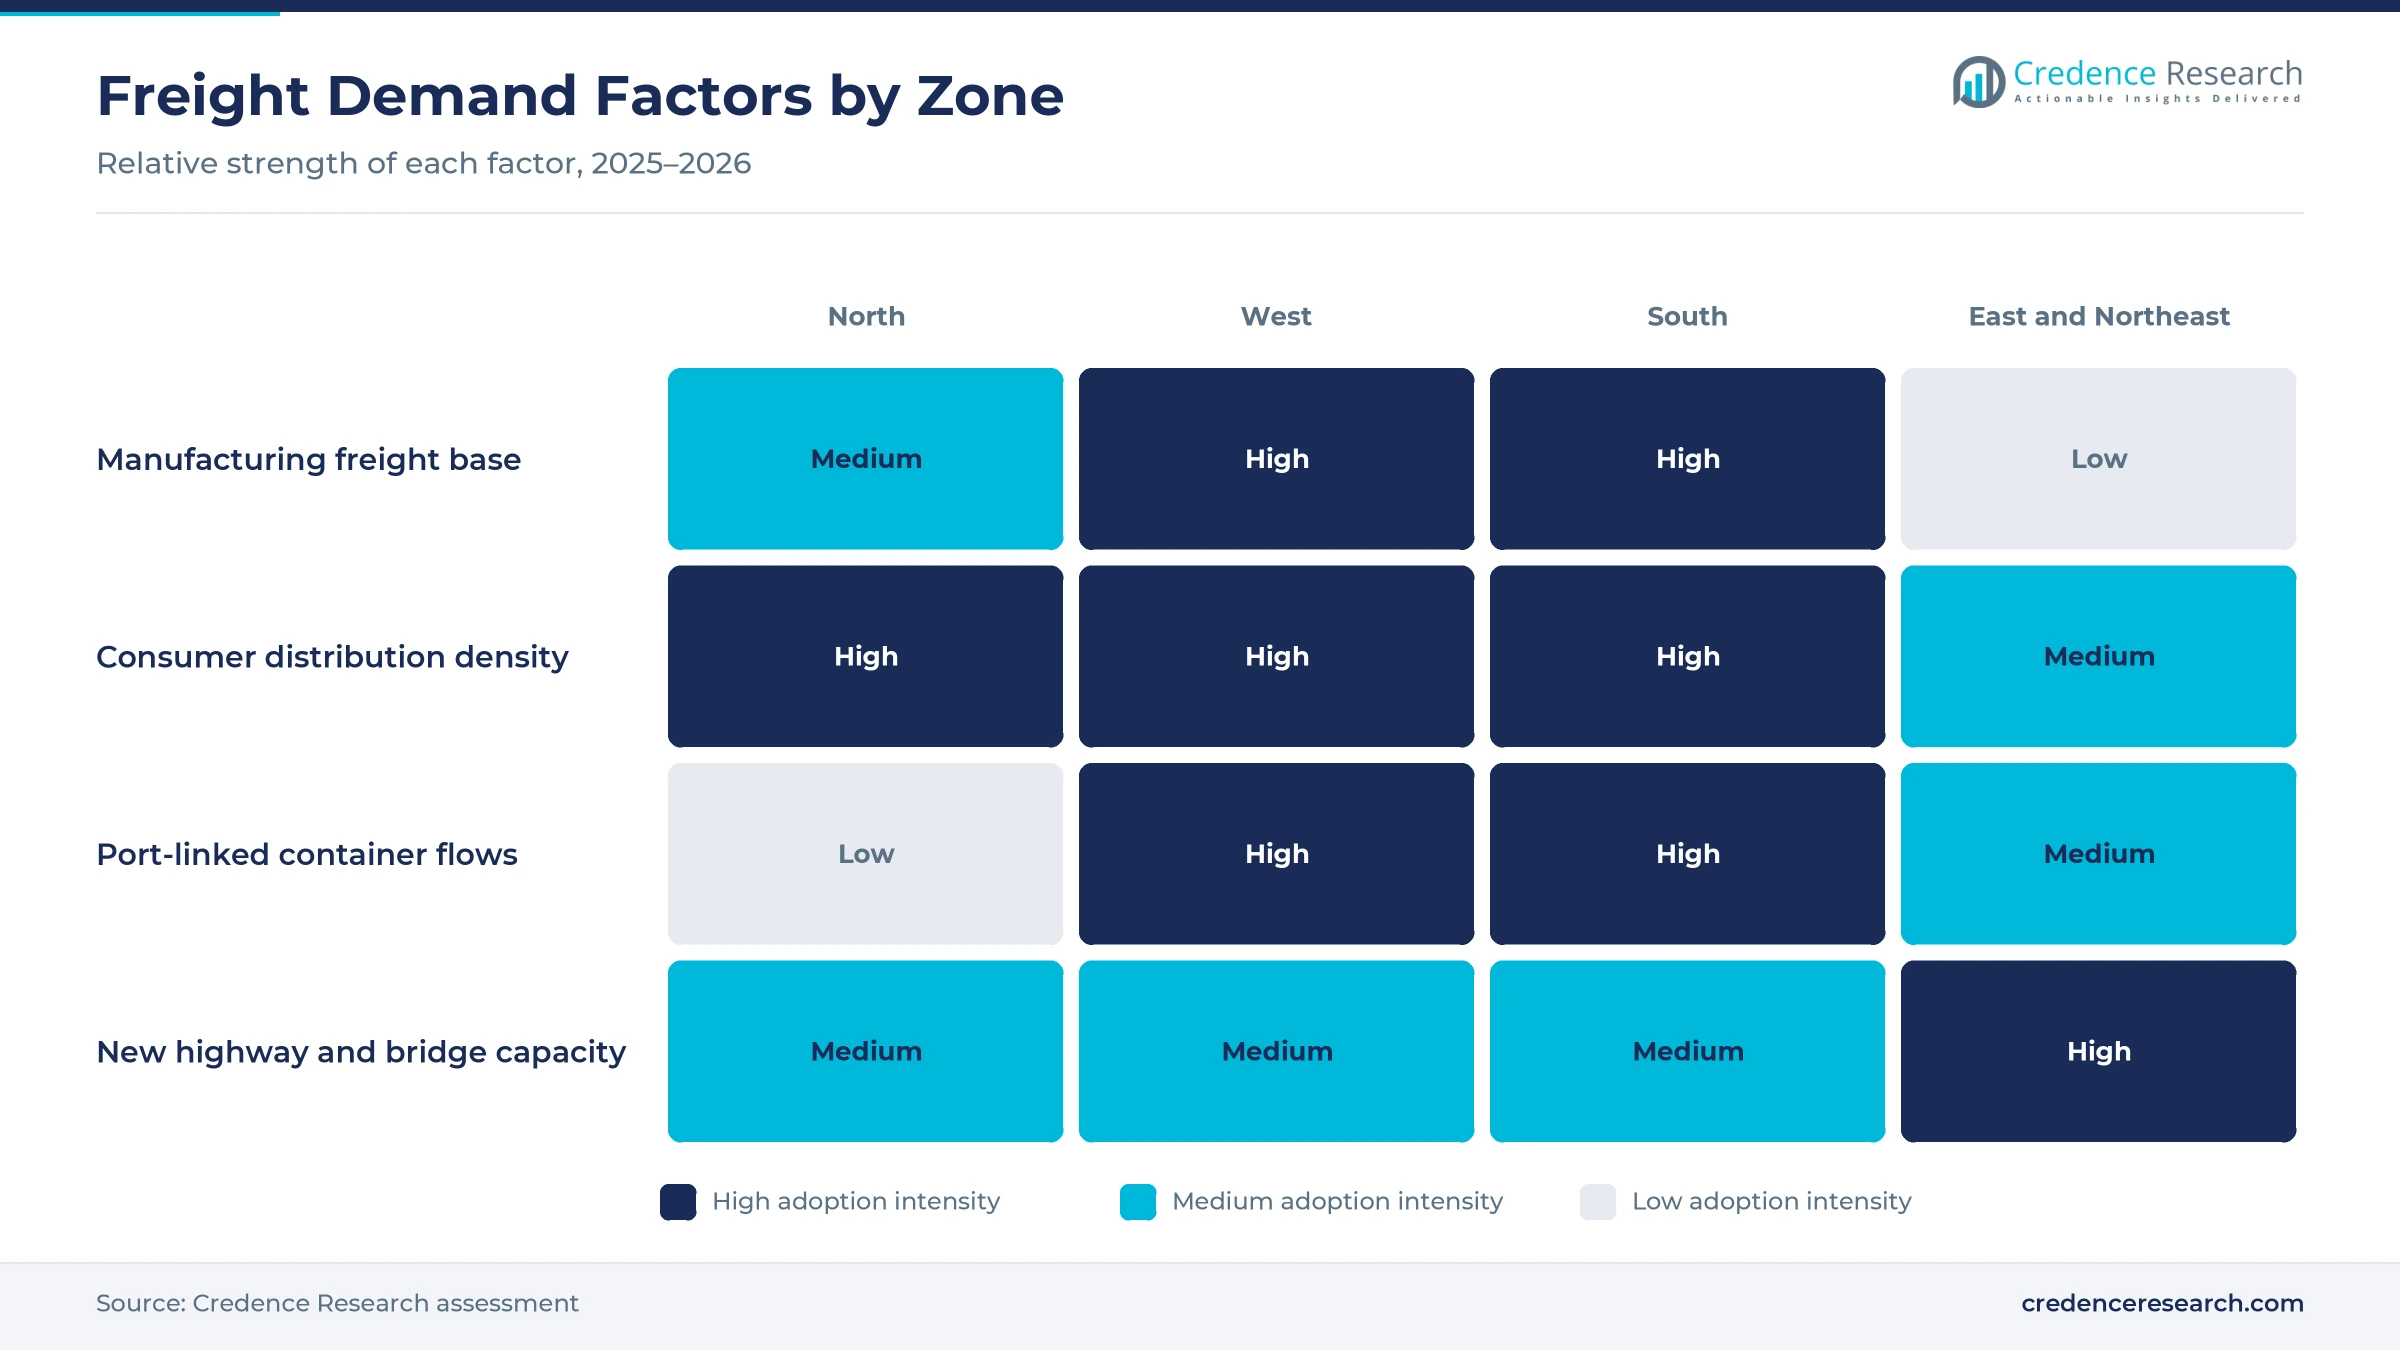
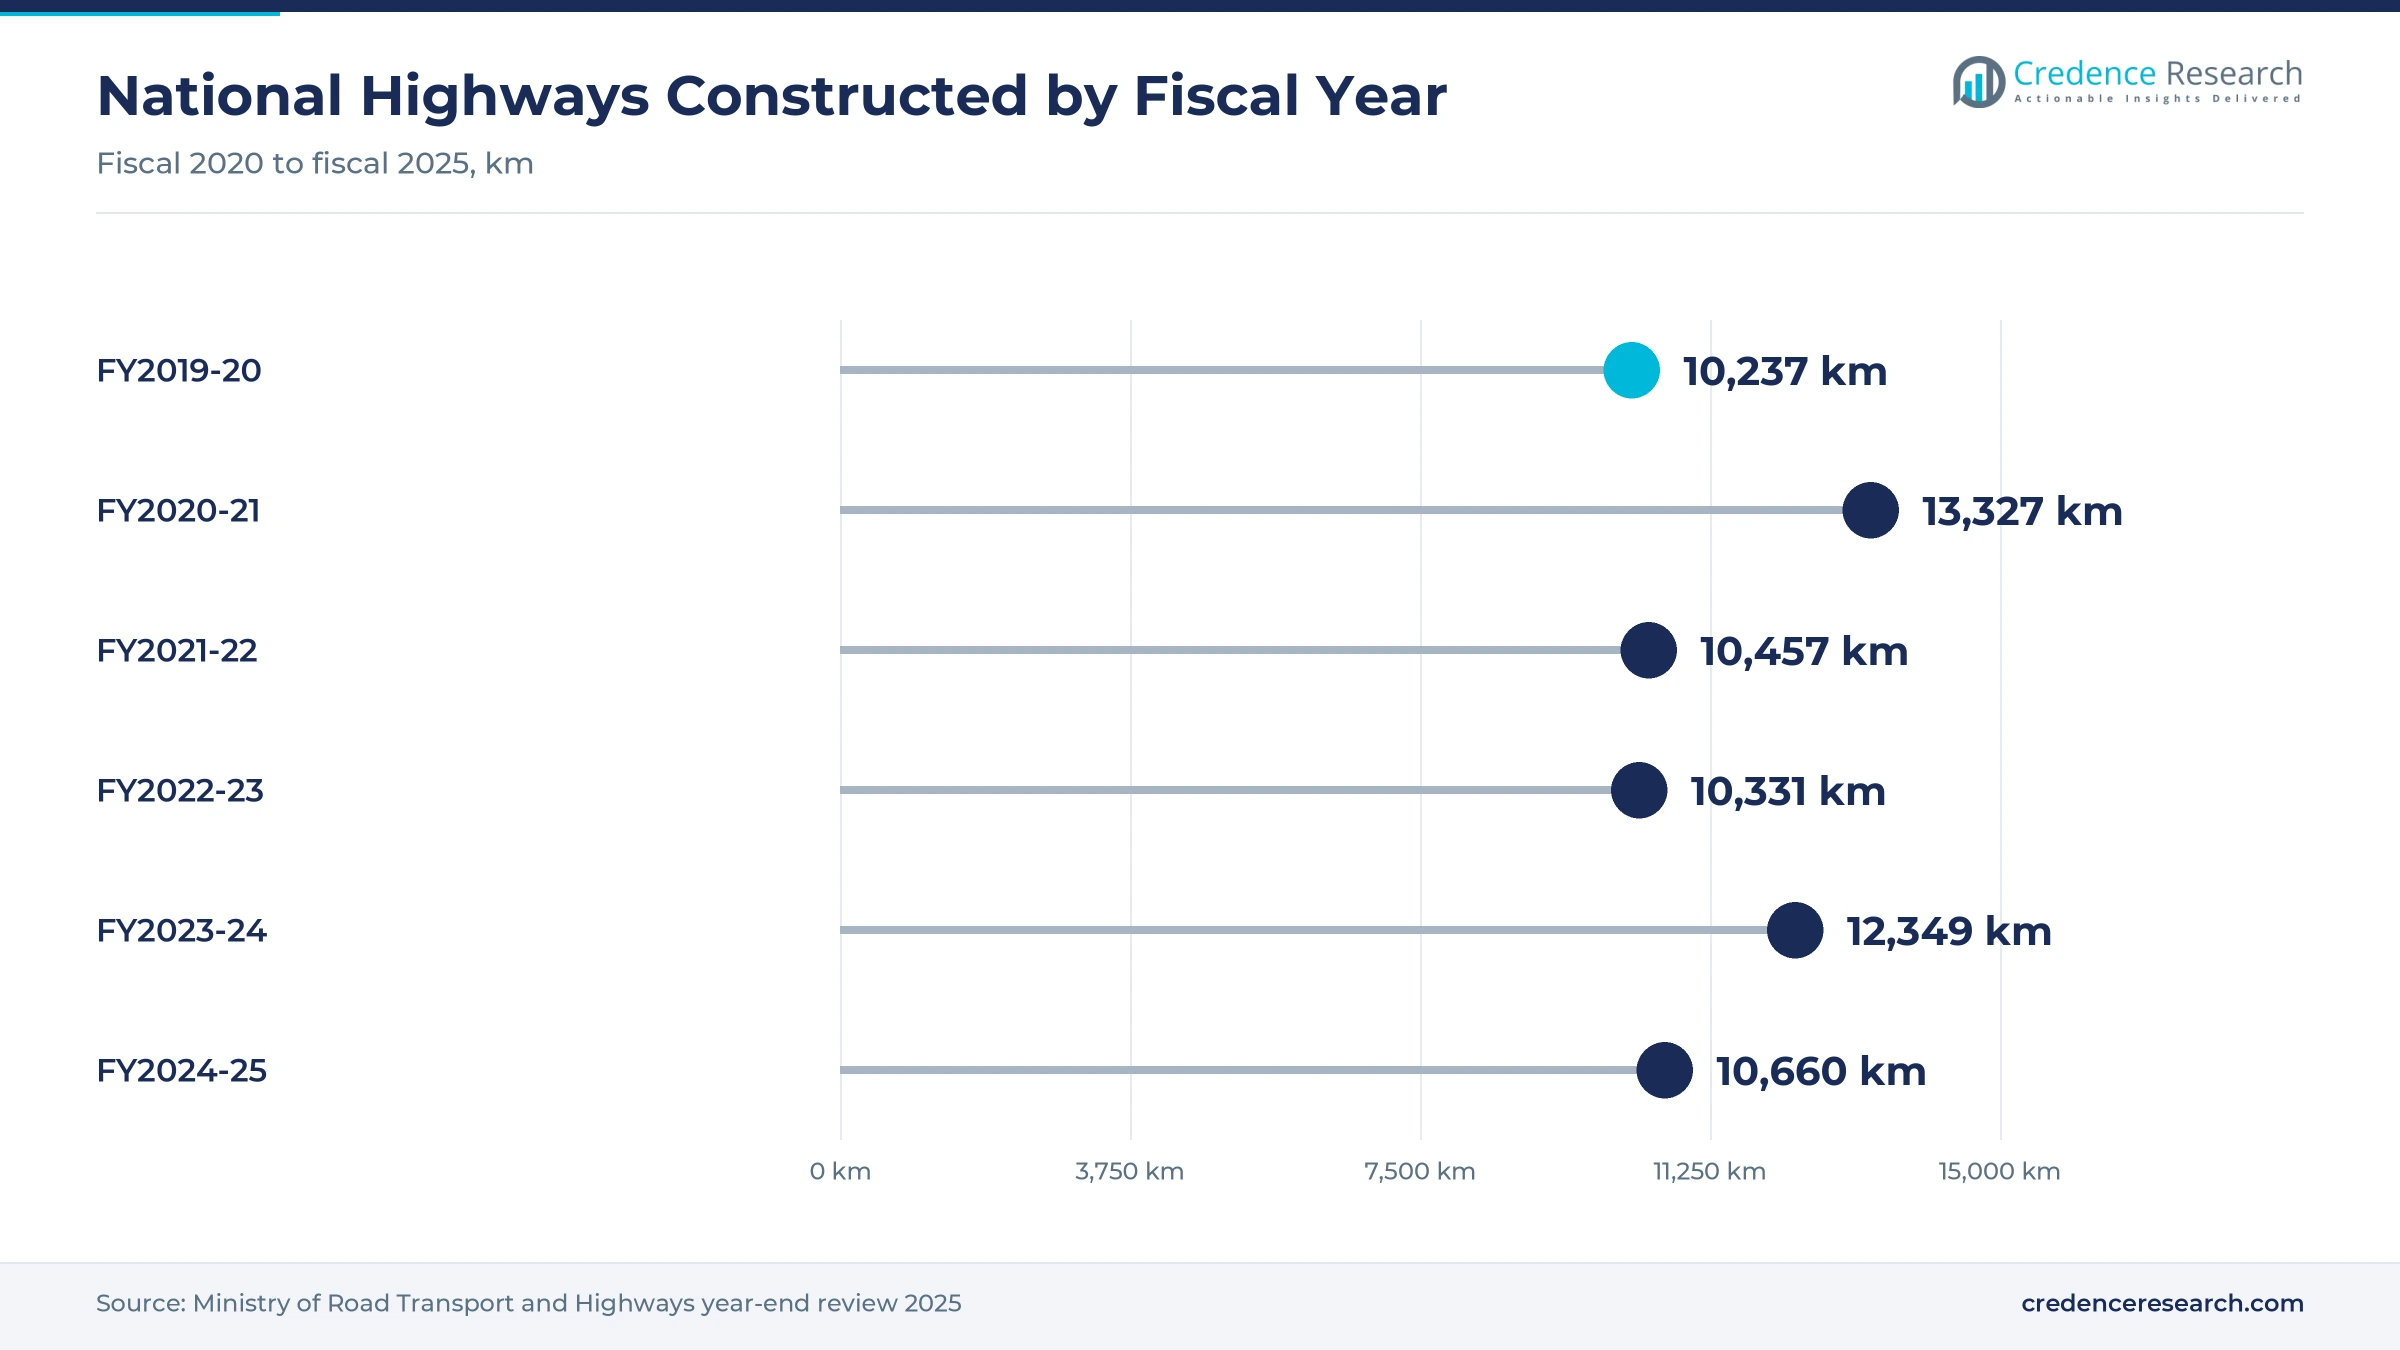
Highway and multimodal infrastructure investment speeds up haulage, because wider and access-controlled roads let trucks cover longer distances each day. The national highway network grew from 91,287 km in 2014 to 146,560 km in 2025, according to the road ministry's year-end review reported by India Shipping News. Highways of four lanes and above rose to 43,512 km, while operational high-speed corridors reached 3,052 km. The ministry built 10,660 km of national highways in fiscal 2025, beating its target of 10,421 km. In turn, tractor-trailers grow at 9.33% a year, the fastest vehicle rate, as long-haul operators move heavier loads onto new expressways.
How do digital compliance rules formalize truck freight?
Digital compliance rules formalize truck freight, because electronic documents make every taxable consignment visible to tax authorities, shippers and carriers. Taxpayers generated a record 140.6 million e-way bills in March 2026, up 13% year on year, as reported by Swarajya. The previous peak of 138.39 million came in December 2025, which shows sustained growth in recorded goods movement. More than 117.3 million FASTags had been issued by November 2025, and electronic toll collection averaged INR 184 crore a day. As a result, contracted fleets hold 41.0% of 2025 value, because large shippers prefer carriers with clean compliance records and digital proof of delivery.
Why do tax relief and lower logistics costs support fleets?
Tax relief and lower logistics costs support fleet expansion, because cheaper vehicles and clearer cost data help truck owners plan new capacity. The goods and services tax on trucks and delivery vans fell from 28% to 18% after the council meeting of Sept. 3, 2025, according to a Press Information Bureau factsheet. A government-commissioned study released on Sept. 25, 2025, put national logistics costs at 7.97% of gross domestic product in 2023-24. The same study found that fuel makes up 42.1% of road freight expenses, which makes newer and more efficient trucks attractive. In turn, carriers renew older vehicles faster, while light commercial vehicles serving city distribution gain from lower purchase prices.
Express consolidation, cashless tolls and logistics parks
Why is the rise of express networks consolidating parcel haulage?
The rise of express networks is consolidating parcel haulage, because shippers want scheduled and tracked deliveries across thousands of towns. Delhivery completed the purchase of the remaining shares of Ecom Express on July 23, 2025, raising its holding to 99.87%, according to its stock exchange filing. The total consideration was about INR 1,369 crore, which brought a large online retail network under one operator. TCI Express handled more than one million metric tons of cargo in fiscal 2026 through over 40,000 pickup and delivery locations. As a result, express road freight grows at 9.93% a year, the fastest service rate, and feeds last-mile delivery in smaller cities.
How is the shift to electronic tolling changing truck operations?
The shift to electronic tolling is changing truck operations, because cashless lanes cut queues and give fleets accurate trip cost data. FASTag became mandatory for goods vehicles from Jan. 1, 2021, and every fee plaza lane became an electronic lane in February 2021. National highway user fees rose to INR 61,408 crore in fiscal 2025 from INR 55,882 crore a year earlier, as tolled length reached 52,748 km. Electronic toll transactions averaged about 12 million a day on national highway plazas in fiscal 2026 through November. In turn, fleet operators combine toll, fuel and trip data in one system, which sharpens pricing for third-party logistics contracts.
Can multimodal logistics parks open new consolidation hubs?
Multimodal logistics parks can open new consolidation hubs, because they combine rail sidings, warehouses and truck terminals at one site. The road ministry plans 35 parks with about INR 46,000 crore of investment and capacity to handle around 700 million metric tons of cargo. The ministry awarded parks at Jogighopa in Assam, Mappedu near Chennai, Pithampur near Indore, Dabbaspete near Bangalore and Jalna in Maharashtra. Bids were invited for Anantapur, Pune and Nashik, while feasibility studies are under way for Patna, Jammu, Coimbatore and Hyderabad. As a result, carriers that run feeder and distribution trucks around these hubs can win longer contracts with manufacturers and retailers.
Is there room for digital freight platforms to fill idle trucks?
Digital freight platforms have room to fill idle trucks, because small fleet owners still find many loads through brokers and informal networks. The 2025 logistics cost study found that firms with turnover below INR 5 crore spend about 17% of output value on logistics, against about 7.6% for large firms. That gap gives smaller shippers a strong reason to use platforms that show rates and track vehicles. E-way bill volumes reached 140.6 million in March 2026, which creates digital records that platforms can use to verify loads. In turn, digital freight marketplaces grow at 10.96% a year, the fastest business model rate, as MSME shippers adopt app-based booking.
Fuel costs, fragmented fleets and rail competition weigh
How does fuel price exposure squeeze carrier margins?
Fuel price exposure squeezes carrier margins, because fuel makes up 42.1% of road freight expenses according to the 2025 logistics cost study. Small fleet owners feel this most, since they lack bulk fuel contracts and cannot pass costs on quickly. As a result, spot rates swing with diesel prices and contract disputes rise. Carriers respond with fuel escalation clauses, telematics that track mileage and trials of gas and electric trucks on short routes.
Why does fragmented truck ownership limit service quality?
Fragmented truck ownership limits service quality, because many trucks belong to small operators who work through brokers on spot loads. This structure leads to empty return trips, uneven vehicle standards and weak tracking for shippers. In turn, large shippers spend more time managing many vendors on each lane. Organized carriers respond by signing attached owners under contracted fleet models, which adds capacity while keeping service standards consistent.
How does rail competition pressure long-haul bulk lanes?
Rail competition pressures long-haul bulk lanes, because rail costs about INR 1.96 per ton-km, the cheapest mode in the 2025 logistics cost study. Coal, cement, steel and container shippers on long corridors can move loads away from trucks when rail capacity improves. As a result, road carriers face rate pressure on long bulk routes. Truck operators respond by focusing on first-mile and last-mile legs, time-sensitive cargo and multimodal contracts.
Why do driver availability and road safety constrain fleets?
Driver availability and road safety constrain fleet use, because long-haul driving means long periods away from home and high accident exposure. Fleet owners struggle to run trucks on double shifts when experienced drivers are scarce. In turn, vehicle utilization falls and insurance costs rise for carriers. Operators respond with relay driving at hubs, driver training and the wayside amenities the road ministry plans every 40 to 60 km along national highways.
Southern states lead as the east and northeast grow fastest
| Region | Value, 2025 (USD billion) | Share, 2025 | CAGR, 2026–2035 |
|---|---|---|---|
| South India | 49.55 | 32.2% | 8.51% |
| North India | 43.71 | 28.4% | 8.51% |
| West India | 35.55 | 23.1% | 8.41% |
| East and Northeast India | 25.08 | 16.3% | 9.21% |
Why do southern states generate the most truck freight?
South India held a 32.2% share of 2025 value and grows at 8.51% a year, because Tamil Nadu, Karnataka, Andhra Pradesh and Telangana combine automotive, electronics and port-linked manufacturing. Multimodal logistics parks at Mappedu near Chennai and Dabbaspete near Bangalore have been awarded, which adds consolidation capacity near the two largest southern hubs. In August 2025, the government launched 29 national highway projects covering 272 km in Andhra Pradesh. As a result, the zone keeps the largest share of full truckload and express volume.
How does the northern consumption belt sustain demand?
North India held a 28.4% share of 2025 value and grows at 8.51% a year, because the Delhi region, Punjab, Haryana and Uttar Pradesh combine dense consumer markets with large farm output. The Delhi section of the Dwarka Expressway, 10.1 km long, was inaugurated on Aug. 17, 2025. Haryana inaugurated the 14.4 km Rewari Bypass in April 2025, which eases freight movement around a busy junction. In turn, the zone leads in FMCG distribution and agricultural haulage.
What drives demand in the western industrial states?
West India held a 23.1% share of 2025 value and grows at 8.41% a year, because Maharashtra and Gujarat host large chemical, automotive and port clusters. The road ministry awarded a logistics park at Jalna in Maharashtra and invited bids for parks at Pune and Nashik. The Delhi-Mumbai Expressway raised INR 50,125 crore through securitization, which supports completion of the corridor. As a result, long-haul container and chemical haulage from western ports keeps growing.
How do new bridges push the east and northeast ahead?
East and Northeast India held a 16.3% share of 2025 value and grows fastest at 9.21% a year, because new roads and bridges link the zone to national markets. The 8.15 km Aunta-Simaria bridge in Bihar and the 7.2 km Kona Expressway in West Bengal were inaugurated on Aug. 22, 2025. A logistics park at Jogighopa in Assam has been awarded, and VRL Logistics is targeting 80 to 100 new branches a year with a focus on the northeast.
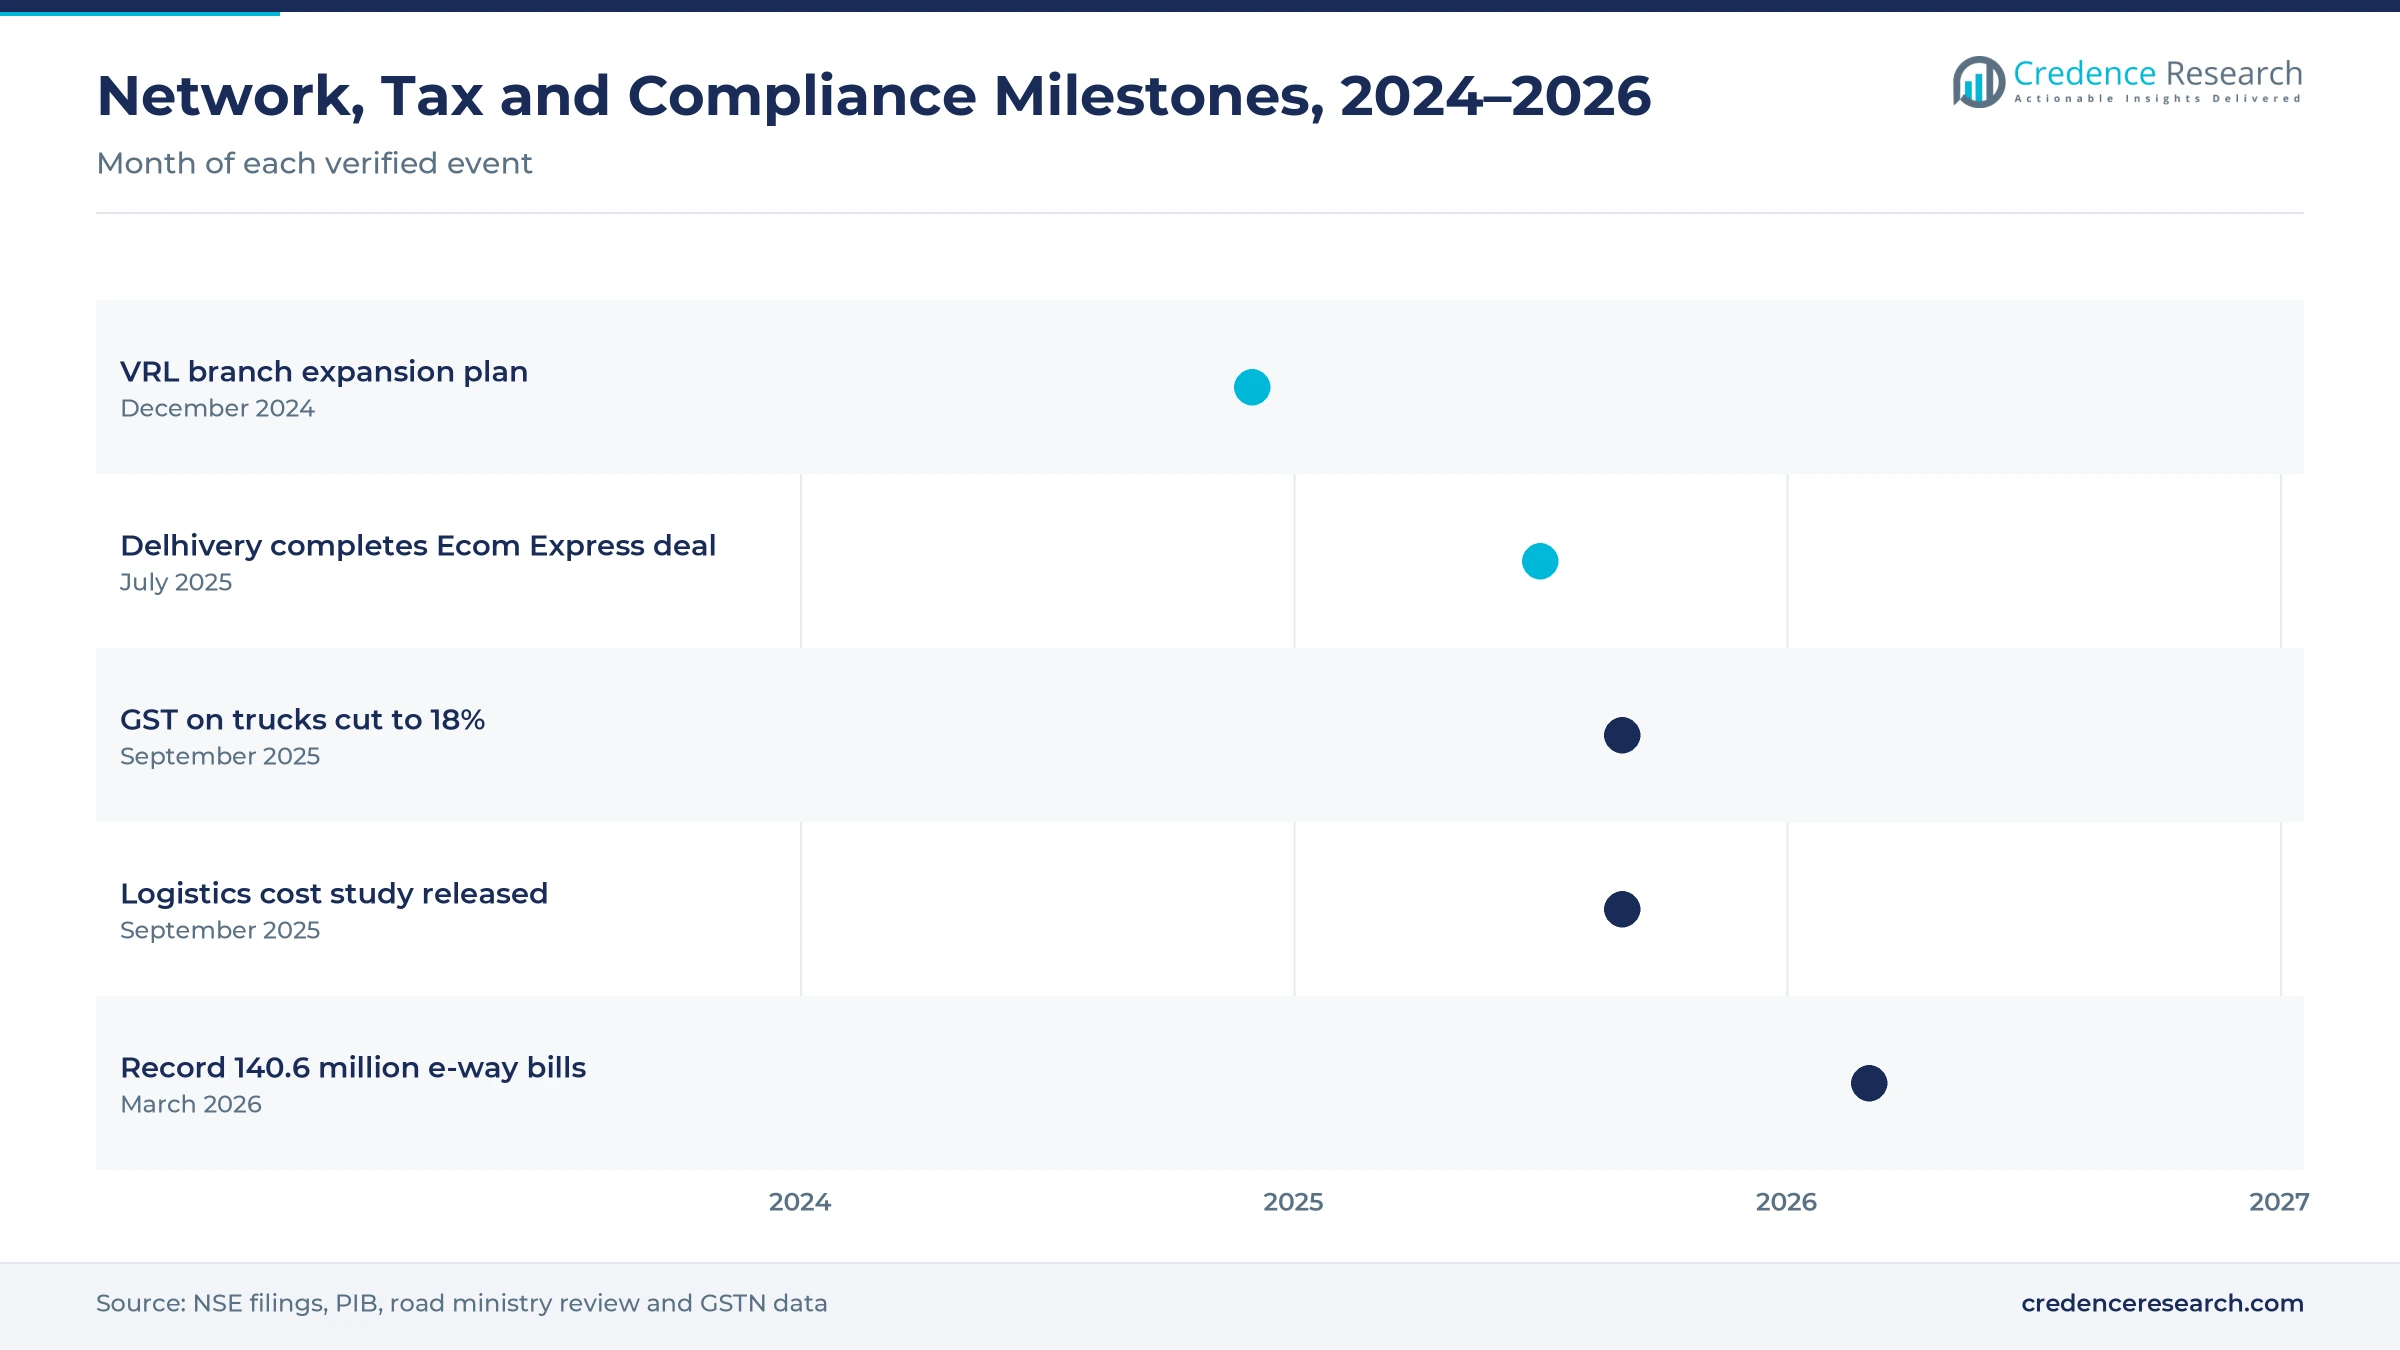
Acquisitions, tax relief and record e-way bills, 2024–2026
| Development | Status and market relevance |
|---|---|
| In December 2024, VRL Logistics was reported to be targeting 80 to 100 new branches a year, with a focus on northeast India. | Extends part truckload coverage into under-served states |
| In July 2025, Delhivery completed the purchase of the remaining shares of Ecom Express, raising its holding to 99.87%. | Consolidated two large express networks |
| In September 2025, the GST Council cut the goods and services tax on trucks and delivery vans from 28% to 18%. | Lowers fleet acquisition costs for carriers |
| In September 2025, a government-commissioned study put national logistics costs at 7.97% of gross domestic product in 2023-24. | Gives shippers and carriers an official cost baseline |
| In March 2026, taxpayers generated a record 140.6 million e-way bills, up 13% year on year. | Confirms rising recorded goods movement by road |
Telematics, electronic documents and route planning advance
- Telematics and GPS tracking give fleet owners live vehicle location, fuel use and driver behavior, which helps them cut empty running and share accurate arrival times with shippers.
- Electronic e-way bills and FASTag link each consignment and toll crossing to digital records, which speeds checks at state borders and gives carriers precise trip cost data.
- Route planning and load matching software combines orders, vehicle capacity and traffic data, which helps express carriers plan multi-stop runs for online retail parcels and helps platforms fill return trips.
Need a Custom Version of This Report?
Tailor the scope, geography, or segments to your exact requirements.
- Custom geography or segment scope
- Direct access to our analyst team
Express networks and contract carriers compete for shippers
Competition is split between national express networks, part truckload specialists, diversified contract logistics groups and thousands of small fleet owners working through brokers. Delhivery raised its holding in Ecom Express to 99.87% on July 23, 2025, which added a large online retail delivery network. TCI Express handled more than one million metric tons of cargo in fiscal 2026 through over 40,000 pickup and delivery locations. VRL Logistics targets 80 to 100 new branches a year, while Allcargo Gati serves about 19,800 PIN codes across 735 districts. In its July 2026 shareholder presentation, Mahindra Logistics reported about 400,000 sq ft of facilities in Guwahati and Agartala and inducted 50 car carriers. Rivals compete on network reach, transit time, tracking, pricing and compliance. Because large shippers consolidate vendors, carriers with national coverage and digital systems are gaining share.
Which carriers lead truck haulage in India?
| Company | Type | Role in the market |
|---|---|---|
| Delhivery Limited | Express and part truckload network | Raised its Ecom Express holding to 99.87% in July 2025 |
| TCI Express Limited | Surface express specialist | More than one million metric tons handled in fiscal 2026 |
| VRL Logistics Limited | Part truckload specialist | Targets 80 to 100 new branches a year |
| Allcargo Gati Limited | Express distribution network | Serves about 19,800 PIN codes across 735 districts |
| Mahindra Logistics Limited | Integrated contract logistics | Added facilities in Guwahati and Agartala |
Credence Research view on Indian trucking demand
Credence Research's view is that Indian truck haulage will keep growing faster than the wider economy because highways, tax compliance and online retail all push more goods onto organized carriers. Full truckload services remain the largest value pool, while express networks and digital platforms add the fastest growth. Lower vehicle taxes and a clear national cost baseline help fleets invest. Carriers that combine national reach, contracted capacity and strong digital systems should gain share fastest across the India road freight base over the next decade.
How the national truck haulage estimate was built
The report uses 2025 as the base year on a calendar basis, and market values come from the Credence Research model. That model combines World Bank output data, road ministry network and toll statistics, e-way bill volumes, commercial vehicle sales, a government-commissioned logistics cost study and company filings. Segment splits and zone growth rates are Credence Research estimates, while zone shares follow the client-defined split. Sources used are official statistics, government releases, exchange filings and company announcements, and no interviews or surveys were used.
Express loads and digital freight platforms lead to 2035
Truck freight value is expected to reach USD 351.85 billion by 2035, an 8.60% CAGR during 2026–2035, as manufacturing, consumption and online retail keep goods moving by road. Growth should come from express services, tractor-trailers on new expressways and digital freight platforms. Stable diesel prices and steady highway building would support margins, while faster rail freight growth would slow long-haul bulk lanes. Carriers with national networks, contracted capacity and digital tools are expected to gain the most as India road freight volumes formalize.
Frequently Asked Questions
How big is the India road freight market?
Which service type leads Indian truck haulage value?
Which region leads the Indian market?
How did the 2025 tax change affect truck buyers?
How many e-way bills were generated in March 2026?
Which business model is growing fastest?
Who are the leading companies in the Indian market?
What are the main challenges for truck operators?
Table of Content
Chapter 1 Market Segmentation
- 1.1 Segmentation Framework
- 1.1.1 Product and Service Classification
- 1.1.2 Application and End-Use Classification
- 1.1.3 Technology and Solution Classification
- 1.1.4 Customer and Distribution Channel Classification
- 1.1.5 Geographic Segmentation
- 1.1.6 Market Segment Definitions and Boundaries
- 1.2 By Service Type
- 1.2.1 Full Truckload
- 1.2.2 Part Truckload
- 1.2.3 Express Road Freight
- 1.2.4 Specialized Haulage
- 1.3 By Mode of Transport
- 1.3.1 Light Commercial Vehicles
- 1.3.2 Medium Commercial Vehicles
- 1.3.3 Heavy Commercial Vehicles
- 1.3.4 Tractor-Trailers
- 1.4 By End-Use Industry
- 1.4.1 Manufacturing
- 1.4.2 FMCG and Retail
- 1.4.3 Agriculture and Food
- 1.4.4 Construction and Mining
- 1.4.5 E-Commerce
- 1.5 By Business Model
- 1.5.1 Asset-Owned Fleet
- 1.5.2 Contracted Fleet
- 1.5.3 Broker-Led Aggregation
- 1.5.4 Digital Freight Marketplace
Chapter 2 Introduction
- 2.1 Report Objectives and Scope
- 2.2 Product Definition and Industry Terminology
- 2.3 Market Inclusions and Exclusions
- 2.4 Research Process
- 2.4.1 Primary Research and Expert Interviews
- 2.4.2 Secondary Research and Source Review
- 2.4.3 Top-Down and Bottom-Up Estimation
- 2.4.4 Data Triangulation and Verification
- 2.5 Market Size Measurement Basis
- 2.5.1 2025: USD 153.89 billion → 2035: USD 351.85 billion
- 2.6 Historical and Forecast Reference Periods
- 2.6.1 Historical Period: 2018-2025
- 2.6.2 Base Year: 2025
- 2.6.3 Forecast Period: 2025-2035
- 2.7 Research Assumptions and Limitations
Chapter 3 Executive Summary
- 3.1 Market Snapshot and Key Findings
- 3.2 Base-Year Market Size, 2025
- 3.3 Forecast Market Size, 2035
- 3.4 Revenue and Volume Growth Outlook
- 3.5 Key Demand and Supply Indicators
- 3.6 Leading Market Segments
- 3.7 Fastest-Growing Market Opportunities
- 3.8 Regional Performance Highlights
- 3.9 Technology and Industry Transformation
- 3.10 Competitive Landscape Summary
- 3.11 Analyst View and Strategic Implications
Chapter 4 India Road Freight Market Trends and Developments
- 4.1 Historical Industry Development, 2018-2025
- 4.2 Recent Market Trends and Developments
- 4.3 Demand and Customer Behavior Trends
- 4.4 Technology and Product Innovation
- 4.5 Artificial Intelligence, Automation and Digitalization
- 4.6 Local Manufacturing and Supply Chain Realignment
- 4.7 Industry Partnerships, Mergers and Acquisitions
- 4.8 Sustainability and Circular Economy Developments
- 4.9 Government and Private Sector Investment Trends
- 4.10 Emerging Business Models and Commercialization
- 4.11 Industry Developments and Announcements
Chapter 5 India Road Freight Market Production, Supply and Demand Analysis
- 5.1 Demand Trend and Consumption Analysis, 2018-2025
- 5.2 Demand Forecast, 2025-2035
- 5.3 Production and Output Trend, 2018-2025
- 5.4 Production and Output Forecast, 2025-2035
- 5.5 Installed Capacity and Capacity Utilization
- 5.6 Company-Wise Production Plants and Statistics
- 5.6.1 Installed Production Capacity
- 5.6.2 Actual Production
- 5.6.3 Planned Capacity and Expansion Targets
- 5.7 Supply Chain Structure and Procurement Trends
- 5.8 Supply-Demand Gap and Bottlenecks
- 5.9 Import Dependence and Sourcing Structure
- 5.10 Contract Manufacturing and Outsourcing
- 5.11 Regional Supply and Demand Concentration
Chapter 6 India Road Freight Market Pricing Analysis
- 6.1 Pricing Structure and Measurement
- 6.2 Historical Pricing Trends, 2018-2025
- 6.3 Pricing Outlook, 2025-2035
- 6.4 Average Selling Price and Unit Economics
- 6.5 Pricing by Product and Market Segment
- 6.6 Geographic Pricing Differences
- 6.7 Key Input, Energy, Labor and Logistics Costs
- 6.8 Contract Pricing and Purchasing Models
- 6.9 Pricing Sensitivity and Competitive Positioning
- 6.10 Price, Margin and Profitability Implications
Chapter 7 India Road Freight Market Dynamics
- 7.1 Market Growth Drivers
- 7.1.1 Demand-Side Drivers
- 7.1.2 Technology and Innovation Drivers
- 7.1.3 Infrastructure and Investment Drivers
- 7.1.4 Regulatory and Policy Drivers
- 7.2 Market Restraints
- 7.2.1 Cost and Affordability Constraints
- 7.2.2 Technology and Adoption Barriers
- 7.2.3 Supply Chain and Operational Constraints
- 7.3 Market Challenges
- 7.3.1 Competitive Pressure and Margin Erosion
- 7.3.2 Skills, Infrastructure and Implementation Gaps
- 7.4 Emerging Market Opportunities
- 7.5 Market Dynamics Impact and Time-Horizon Assessment
Chapter 8 India Road Freight Value Chain Analysis
- 8.1 Industry Value Chain Overview
- 8.2 Upstream Suppliers and Critical Inputs
- 8.3 Technology and Component Providers
- 8.4 Manufacturing or Service Delivery
- 8.5 Distribution, Channel Partners and Integrators
- 8.6 Downstream Applications and End Users
- 8.7 Value Addition and Profit Pools
- 8.8 Vertical Integration and Outsourcing
- 8.9 Supplier Concentration and Risk
- 8.10 Supply Chain Localization and Resilience
Chapter 9 India Road Freight Market Regulations and Policies
- 9.1 Relevant Laws, Standards and Compliance Frameworks
- 9.2 Product, Service, Safety and Quality Requirements
- 9.3 Government Policies, Incentives and Subsidies
- 9.4 Imports, Exports and Trade Barriers
- 9.5 Public Procurement and Local Content Requirements
- 9.6 Environmental and Sustainability Compliance
- 9.7 Upcoming Policy Changes and Market Implications
Chapter 10 India Road Freight Market Hotspots and Opportunities
- 10.1 Market Opportunity Mapping and Growth Hotspots
- 10.2 High-Growth Applications and Customer Groups
- 10.3 Underserved Markets and White-Space Opportunities
- 10.4 Emerging Technology and Product Opportunities
- 10.5 New Capacity and Investment Hotspots
- 10.6 Market Entry and Expansion Opportunities
- 10.7 Distribution and Partnership Opportunities
- 10.8 Near-Term and Long-Term Commercial Potential
- 10.9 Opportunity Attractiveness and Execution Risks
Chapter 11 India Road Freight Market Outlook, 2025-2035
- 11.1 Market Size and Analysis
- 11.1.1 Revenue (Market Measurement: 2025: USD 153.89 billion → 2035: USD 351.85 billion)
- 11.1.2 Market Volume and Quantity Sold
- 11.1.3 Historical Market Size, 2018-2025
- 11.1.4 Base-Year Market Size, 2025
- 11.2 Market Forecast, 2025-2035
- 11.2.1 Revenue Forecast to 2035
- 11.2.2 Volume Forecast to 2035
- 11.2.3 CAGR and Year-on-Year Growth
- 11.2.4 Incremental Revenue Opportunity
- 11.3 Forecast Assumptions and Scenario Analysis
- 11.3.1 Base-Case Forecast
- 11.3.2 Optimistic and Conservative Scenarios
- 11.3.3 Technology, Pricing and Policy Sensitivities
- 11.4 Market Attractiveness and Growth Outlook
Chapter 12 India Road Freight Market Segmentation and Outlook
- 12.1 Segmentation Summary and Market Shares, 2025
- 12.2 Largest and Fastest-Growing Segments
- 12.3 By Service Type - Market Size and Forecast, 2025-2035
- 12.3.1 Segment Definition and Scope
- 12.3.2 Historical Market Size, 2018-2025
- 12.3.3 Revenue Forecast, 2025-2035
- 12.3.4 Volume Forecast, 2025-2035
- 12.3.5 Base-Year Market Share, 2025
- 12.3.6 Segment CAGR and Growth Drivers
- 12.3.7 Subsegment Market Size and Forecast
- 12.3.7.1 Full Truckload
- 12.3.7.2 Part Truckload
- 12.3.7.3 Express Road Freight
- 12.3.7.4 Specialized Haulage
- 12.3.8 Subsegment Pricing and Adoption Trends
- 12.3.9 Leading Suppliers and Competition
- 12.3.10 Regional Demand and Opportunities
- 12.4 By Mode of Transport - Market Size and Forecast, 2025-2035
- 12.4.1 Segment Definition and Scope
- 12.4.2 Historical Market Size, 2018-2025
- 12.4.3 Revenue Forecast, 2025-2035
- 12.4.4 Volume Forecast, 2025-2035
- 12.4.5 Base-Year Market Share, 2025
- 12.4.6 Segment CAGR and Growth Drivers
- 12.4.7 Subsegment Market Size and Forecast
- 12.4.7.1 Light Commercial Vehicles
- 12.4.7.2 Medium Commercial Vehicles
- 12.4.7.3 Heavy Commercial Vehicles
- 12.4.7.4 Tractor-Trailers
- 12.4.8 Subsegment Pricing and Adoption Trends
- 12.4.9 Leading Suppliers and Competition
- 12.4.10 Regional Demand and Opportunities
- 12.5 By End-Use Industry - Market Size and Forecast, 2025-2035
- 12.5.1 Segment Definition and Scope
- 12.5.2 Historical Market Size, 2018-2025
- 12.5.3 Revenue Forecast, 2025-2035
- 12.5.4 Volume Forecast, 2025-2035
- 12.5.5 Base-Year Market Share, 2025
- 12.5.6 Segment CAGR and Growth Drivers
- 12.5.7 Subsegment Market Size and Forecast
- 12.5.7.1 Manufacturing
- 12.5.7.2 FMCG and Retail
- 12.5.7.3 Agriculture and Food
- 12.5.7.4 Construction and Mining
- 12.5.7.5 E-Commerce
- 12.5.8 Subsegment Pricing and Adoption Trends
- 12.5.9 Leading Suppliers and Competition
- 12.5.10 Regional Demand and Opportunities
- 12.6 By Business Model - Market Size and Forecast, 2025-2035
- 12.6.1 Segment Definition and Scope
- 12.6.2 Historical Market Size, 2018-2025
- 12.6.3 Revenue Forecast, 2025-2035
- 12.6.4 Volume Forecast, 2025-2035
- 12.6.5 Base-Year Market Share, 2025
- 12.6.6 Segment CAGR and Growth Drivers
- 12.6.7 Subsegment Market Size and Forecast
- 12.6.7.1 Asset-Owned Fleet
- 12.6.7.2 Contracted Fleet
- 12.6.7.3 Broker-Led Aggregation
- 12.6.7.4 Digital Freight Marketplace
- 12.6.8 Subsegment Pricing and Adoption Trends
- 12.6.9 Leading Suppliers and Competition
- 12.6.10 Regional Demand and Opportunities
- 12.7 Segment Growth Comparison
- 12.8 Segment Attractiveness and Priority Matrix
Chapter 13 India Road Freight End-Use and Application Market Outlook
- 13.1 End-Use Industry and Customer Demand Structure
- 13.2 Leading Applications and Customer Groups
- 13.3 End-Use Market Size, Share and Forecast
- 13.4 Major End-Use Industry Deep Dives
- 13.4.1 Customer Requirements and Use Cases
- 13.4.2 Demand and Replacement Cycles
- 13.4.3 Technical and Regulatory Considerations
- 13.4.4 Purchasing and Procurement Models
- 13.4.5 Leading Vendors and Distribution Channels
- 13.4.6 Forecast and Commercial Opportunities
- 13.5 Emerging Applications and Cross-Segment Demand
- 13.6 End-Use Industry Investment Priorities
Chapter 14 India Road Freight Geographic Market Outlook, 2025-2035
- 14.1 Domestic Market Distribution and Demand Clusters
- 14.2 State- or Province-Wise Market Size and Forecast, 2025-2035
- 14.3 City and Metropolitan Market Outlook
- 14.4 Industrial, Manufacturing and Commercial Clusters
- 14.5 Geographic Concentration of Key End Users
- 14.6 Local Pricing and Purchasing Differences
- 14.7 Domestic Production Facilities and Capacity Map
- 14.8 Local Infrastructure and Project Pipeline
- 14.9 State-Level Policy and Incentive Differences
- 14.10 Subnational Investment Hotspots and Opportunities
- 14.11 Distribution and Logistics Networks
- 14.12 Domestic Competitive Footprint
Chapter 15 India Road Freight Technology, Innovation and Sustainability Outlook
- 15.1 Technology Landscape and Maturity
- 15.2 Product, Process and Service Innovation
- 15.3 AI, Automation and Digital Tools in the Industry
- 15.4 Technology Adoption and Performance Benchmarking
- 15.5 Innovation Pipeline and R&D Investment
- 15.6 Patent and Intellectual Property Trends
- 15.7 Energy Efficiency and Resource Management
- 15.8 Sustainability, Recycling and Circularity
- 15.9 Technology Roadmap, 2025-2035
- 15.10 Risks of Obsolescence and Technology Substitution
Chapter 16 India Road Freight Market Key Strategic Imperatives
- 16.1 Growth and Market Entry Priorities
- 16.2 High-Return Products and Segments
- 16.3 Pricing, Profitability and Cost Optimization
- 16.4 Technology Investment and Product Differentiation
- 16.5 Supply Chain Localization and Resilience
- 16.6 Distribution and Customer Acquisition
- 16.7 Partnership, Acquisition and Capacity Strategy
- 16.8 Regional Expansion Priorities
- 16.9 Short-, Medium- and Long-Term Actions
Chapter 17 Competition Outlook
- 17.1 Industry Competition Characteristics
- 17.2 Market Structure and Concentration
- 17.3 Market Share and Competitive Positioning, 2025
- 17.4 Company-Wise Revenue and Product Benchmarking
- 17.5 Production and Service Capacity Benchmarking
- 17.6 Technology, Pricing and Differentiation
- 17.7 Regional Footprint and Distribution Strength
- 17.8 Mergers, Acquisitions and Strategic Alliances
- 17.9 New Entrants and Competitive Threats
- 17.10 Porter's Five Forces and Industry Attractiveness
- 17.11 Competitive Outlook, 2025-2035
Chapter 18 Company Profiles
- 18.1 Company Coverage and Selection Criteria
- 18.2 Delhivery Limited
- 18.2.1 Business Description
- 18.2.2 Company Ownership and Geographic Presence
- 18.2.3 Product and Service Portfolio
- 18.2.4 Manufacturing and Operating Footprint
- 18.2.5 Production Capacity and Expansion Plans
- 18.2.6 Financial Performance and Investment
- 18.2.7 Market Share and Competitive Position
- 18.2.8 Technology and Innovation Capabilities
- 18.2.9 Strategic Alliances or Partnerships
- 18.2.10 Recent Developments
- 18.2.11 Growth Strategy and Outlook
- 18.3 Transport Corporation of India Limited
- 18.4 VRL Logistics Limited
- 18.5 TCI Express Limited
- 18.6 Allcargo Gati Limited
- 18.7 CJ Darcl Logistics Limited
- 18.8 Safexpress Private Limited
- 18.9 V-Trans (India) Limited
- 18.10 Om Logistics Limited
- 18.11 Mahindra Logistics Limited
- 18.12 Other Relevant Market Participants
Note: Every listed company is profiled on the structure shown under the first company. The company list is preliminary and may change based on research findings, market developments, data availability and client requirements.
Chapter 19 Disclaimer
- 19.1 Research and Forecast Disclaimer
- 19.2 Data Source and Estimation Limitations
Note: The depth of individual sections depends on data availability for this market. Volume, capacity, trade and other unit-based metrics are included where applicable.

