
Market Overview
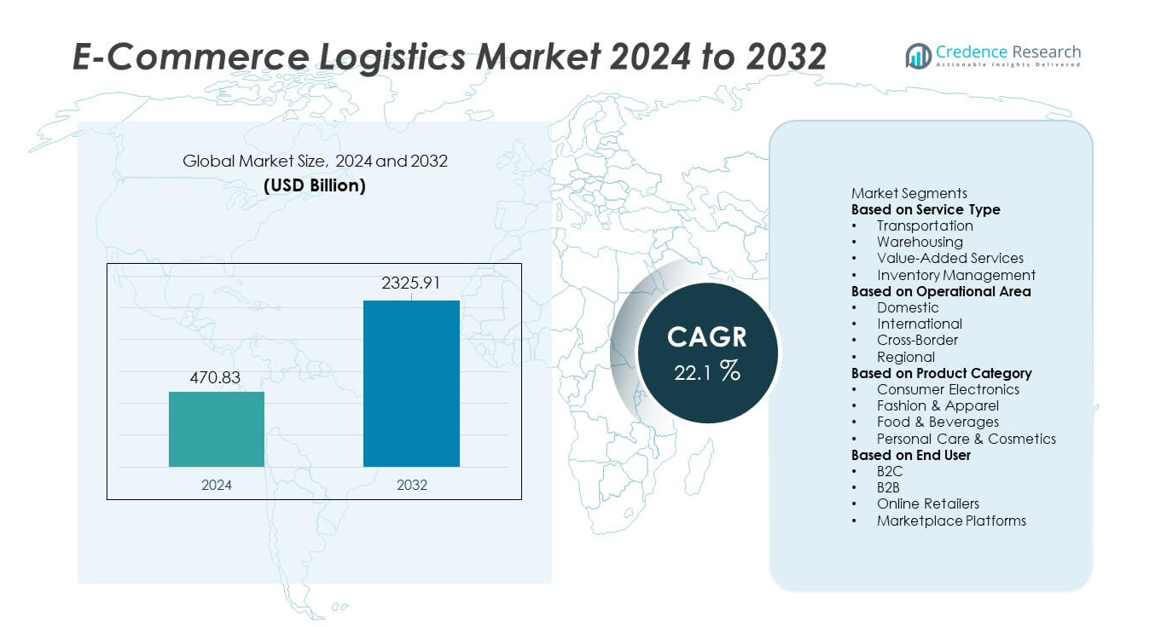
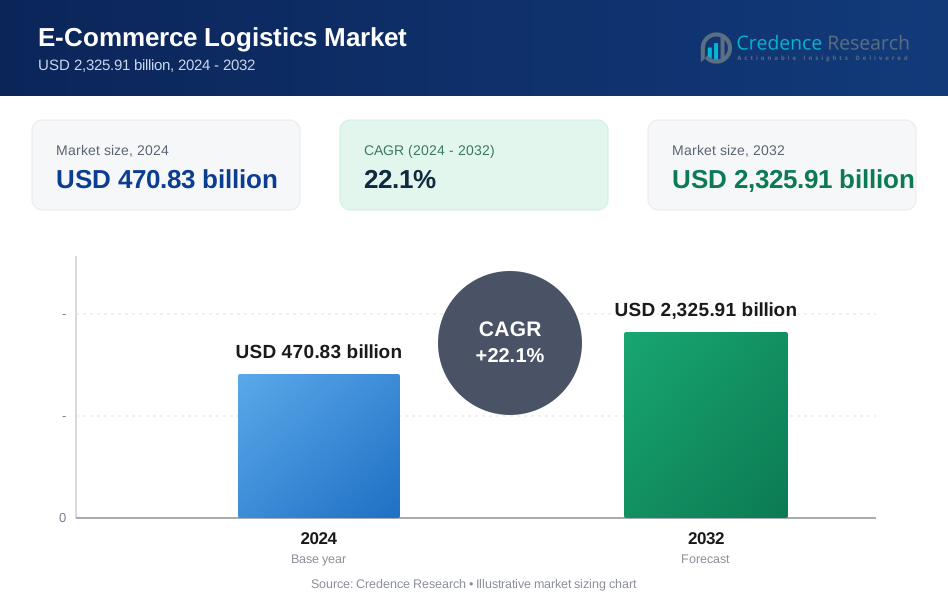
The e-commerce logistics market reached USD 470.83 billion in 2024 and is projected to grow to USD 2,325.91 billion by 2032, reflecting a strong CAGR of 22.1% during the forecast period.
| REPORT ATTRIBUTE | DETAILS |
|---|---|
| Historical Period | 2020-2023 |
| Base Year | 2024 |
| Forecast Period | 2025-2032 |
| E-Commerce Logistics Market Size 2024 | USD 470.83 billion |
| E-Commerce Logistics Market, CAGR | 22.1% |
| E-Commerce Logistics Market Size 2032 | USD 2,325.91 billion |
The e-commerce logistics market is shaped by major players such as Kenco Group, Inc., Aramex International, CEVA Logistics, XPO Logistics Plc., Clipper Logistics Plc., DHL International GmbH, Agility Public Warehousing Company K.S.C.P., Gati Limited, FedEx Corporation, and United Parcel Service, Inc., all of which expand their networks through automation, advanced warehousing, and strong last-mile delivery capabilities. These companies invest in digital tracking, cross-border fulfillment, and scalable distribution hubs to meet rising online order volumes. Regionally, North America leads the market with 34% share, supported by strong e-commerce maturity, while Asia Pacific holds 31% share, driven by rapid digital adoption and large consumer bases.
Market Insights
- The e-commerce logistics market reached USD 470.83 billion in 2024 and will grow at a CAGR of 22.1% through 2032, supported by rising online shopping volumes and faster delivery expectations.
- Strong market drivers include expanding e-commerce penetration, increasing demand for same-day and next-day delivery, and rapid investment in automated fulfillment centers and advanced transportation networks.
- Key trends include the rise of cross-border e-commerce, growth of sustainable delivery solutions, and increased adoption of automation, robotics, and real-time tracking systems by major players such as DHL, FedEx, UPS, and CEVA Logistics.
- Market restraints include high operational costs, last-mile delivery challenges, and infrastructure limitations that affect delivery speed and scalability in several developing regions.
- Regionally, North America leads with 34% share, followed by Asia Pacific at 31% and Europe at 27%. Segment-wise, transportation holds 54% share, domestic operations account for 68%, and fashion & apparel leads product categories with 32% share.
Market Segmentation Analysis:
By Service Type
Transportation dominates the segment with 54% share, driven by rising parcel volumes, expanding last-mile delivery needs, and rapid order fulfillment expectations across major e-commerce platforms. Companies invest heavily in express delivery networks, route optimization systems, and real-time shipment tracking to improve speed and reliability. Warehousing grows steadily with increasing demand for fulfillment centers, cold-chain storage, and automated sorting systems. Value-added services such as packaging, labeling, and reverse logistics expand as retailers prioritize seamless customer experiences. Inventory management strengthens as brands adopt digital tools to improve stock accuracy and reduce operational delays.
- For instance, UPS utilizes an extensive automated sorting system in its Louisville hub, Worldport, that raises the facility's parcel handling capacity to approximately 416,000 to 420,000 packages per hour.
By Operational Area
Domestic logistics leads the segment with 68% share, supported by fast-growing same-day and next-day delivery demand and the rising penetration of online retail in urban and semi-urban regions. Companies prioritize domestic networks to reduce shipping costs and improve delivery speed. International logistics continues to grow as cross-border e-commerce expands, driven by global marketplaces and affordable international shipping options. Regional and cross-border segments benefit from free-trade zones, improved customs processing, and increasing global brand penetration. Investment in local distribution hubs and automated delivery systems strengthens domestic leadership in this segment.
- For instance, Delhivery expanded its domestic reach to over 18,700 PIN codes and deployed 24 automated sortation units across India, supporting higher daily throughput.
By Product Category
Fashion and apparel hold the largest share at 32%, driven by high purchase frequency, strong online adoption, and demand for fast delivery and convenient returns. Consumer electronics follow, supported by rising sales of smartphones, accessories, and home devices that require secure and timely shipment. Food and beverages expand rapidly with the growth of quick-commerce platforms and cold-chain capabilities. Personal care and cosmetics benefit from subscription models and demand for premium packaged goods. Increasing digital buying behavior, improved logistics infrastructure, and stronger omnichannel integration continue to shape growth across all product categories.
Key Growth Driver
Rapid Expansion of Online Shopping and Digital Commerce
The surge in online shopping strongly accelerates demand for e-commerce logistics as consumers shift toward digital marketplaces for convenience and wider product choices. Retailers expand fulfillment centers, last-mile networks, and express delivery capabilities to manage rising order volumes. Increased smartphone usage and seamless payment gateways further fuel online transactions. The growth of marketplace platforms and direct-to-consumer models strengthens the need for reliable logistics infrastructure. As consumers expect faster and more transparent deliveries, e-commerce expansion remains a primary driver shaping long-term logistics demand.
- For instance, Amazon operates more than 1,300 fulfillment centers worldwide and has deployed over one million robotic units to improve processing speed and efficiency.
Rising Demand for Last-Mile Delivery and Same-Day Services
Last-mile delivery becomes a critical focus as customers seek faster shipping and flexible delivery options. Companies invest in micro-fulfillment centers, automated sorting, and route optimization tools to improve delivery efficiency. Urban congestion encourages adoption of electric delivery vans, drones, and alternative mobility solutions. Retailers also partner with third-party logistics providers to expand geographic reach and manage peak-season demand. As ultra-fast delivery becomes a competitive advantage, last-mile innovation continues to drive strong growth in the e-commerce logistics market.
- For instance, Meituan in China operates a low-altitude logistics network combining autonomous ground vehicles and drones in specific business districts and industrial parks, with its drone service enabling average delivery times of about 15 minutes within a 3 km radius on approved low-altitude routes.
Adoption of Automation and Smart Warehouse Technologies
Automation transforms e-commerce logistics through robotics, AI-driven inventory systems, and advanced warehouse management solutions. These technologies reduce manual errors, accelerate picking and packing processes, and improve storage efficiency. Companies adopt automated guided vehicles, smart conveyors, and predictive analytics to optimize operations. High order volumes and fluctuating demand patterns increase the need for scalable and efficient warehouse systems. As digital transformation accelerates, automated infrastructure becomes essential for maintaining delivery speed, cost efficiency, and competitive performance.
Key Trend & Opportunity
Growth of Cross-Border E-Commerce and Global Fulfillment Networks
Cross-border e-commerce grows as consumers purchase international products through global marketplaces offering competitive prices and broader assortments. Logistics providers expand international shipping routes, customs clearance solutions, and global fulfillment centers to support rising demand. Free-trade agreements and streamlined documentation enhance cross-border efficiency. Retailers use multi-node distribution systems to reduce transit time and improve inventory availability. As global online shopping continues to rise, cross-border fulfillment presents major opportunities for logistics providers to scale operations and enter new markets.
- For instance, during its 2023 shopping festival, Cainiao reinforced its logistics timeliness and efficiency by expanding its consolidation and distribution warehouses, adding thousands of China-Hong Kong direct truck delivery trips, and operating 24/7 central warehouse operations.
Expansion of Sustainable and Green Logistics Solutions
E-commerce companies adopt sustainable logistics practices to reduce carbon emissions and meet environmental goals. Electric delivery vehicles, energy-efficient warehouses, route optimization tools, and recyclable packaging support greener operations. Consumers increasingly prefer eco-friendly brands, encouraging retailers to adopt low-impact delivery options. Governments introduce incentives and regulations that promote cleaner transportation fleets and waste reduction. As sustainability becomes a competitive differentiator, green logistics creates new opportunities for service innovation and long-term market leadership.
- For instance, Walmart expanded its sustainability program by operating nearly 1,300 electric vehicle fast-charging stations at over 280 U.S. facilities as of April 2023, and later began deploying thousands of electric vans for last-mile deliveries. The company aims to own and operate a nationwide network of at least 10,000 chargers by 2030.
Key Challenge
High Operational Costs and Pressure on Profit Margins
Rising transportation costs, fuel price fluctuations, and labor shortages create significant financial pressure for logistics providers. Last-mile delivery is cost-intensive due to high drop density, urban congestion, and increasing customer expectations for fast delivery. Managing returns inflates operational burdens, especially in fashion and consumer goods. Companies must balance cost efficiency with service quality while investing in automation and digital tools. These factors make cost control a major challenge across the e-commerce logistics sector.
Capacity Constraints and Infrastructure Limitations
Rapid e-commerce growth strains existing logistics infrastructure, leading to bottlenecks in warehousing, transportation, and last-mile delivery. High seasonal demand spikes create capacity shortages and operational delays. Urban areas face congestion issues, limiting delivery efficiency. In developing regions, inadequate road networks and limited warehouse automation slow fulfillment speeds. Providers must expand capacity, upgrade technology, and optimize network planning to overcome these constraints. Managing infrastructure gaps while maintaining delivery speed remains a key challenge in sustaining market growth.
Regional Analysis
North America
North America holds 34% share of the e-commerce logistics market, supported by strong online shopping adoption, advanced transport infrastructure, and high demand for express delivery services. The United States leads the region with extensive fulfillment networks, widespread same-day delivery options, and strong investment in warehouse automation. E-commerce giants expand micro-fulfillment centers and last-mile capabilities to meet rising order volumes. Canada contributes through growing online retail usage and increased cross-border shipments. High digital literacy, reliable payment systems, and rising omnichannel retail strategies continue to strengthen North America’s leadership in the global e-commerce logistics landscape.
Europe
Europe commands 27% share, driven by strong e-commerce penetration, well-developed transport systems, and supportive regulations for cross-border trade. Countries such as Germany, the United Kingdom, and France lead the market with advanced warehousing, dense parcel networks, and rising demand for fast and flexible delivery services. Retailers adopt automation and green logistics solutions to improve operational efficiency and reduce emissions. The region also benefits from integrated customs processes that support seamless international shipments. Growth in online fashion, electronics, and grocery segments continues to push demand for efficient logistics operations across Europe.
Asia Pacific
Asia Pacific leads growth momentum with 31% share, driven by rapidly expanding online retail, increasing smartphone usage, and strong manufacturing and export activity. China and India dominate due to high order volumes, rising digital payments, and large-scale logistics infrastructure investments. Southeast Asian markets show fast adoption of e-commerce platforms and last-mile delivery services. Companies expand fulfillment centers and use automation to handle peak demand. The rise of quick-commerce and cross-border trade further boosts logistics requirements. Asia Pacific remains one of the strongest and fastest-growing regions in the global e-commerce logistics market.
Latin America
Latin America holds 5% share, supported by rising e-commerce participation, expanding digital payment usage, and improved logistics infrastructure in major countries such as Brazil and Mexico. Growing online retail adoption drives demand for advanced warehousing and faster parcel delivery services. Retailers invest in last-mile operations, regional distribution hubs, and cross-border logistics partnerships to improve accessibility. Despite challenges such as uneven infrastructure and high delivery costs in remote areas, increasing financial inclusion and mobile commerce expansion support steady market growth across the region.
Middle East & Africa
The Middle East and Africa account for 3% share, driven by rising adoption of online shopping, growing urban populations, and expanding digital payment ecosystems. Gulf countries, particularly the UAE and Saudi Arabia, lead with advanced logistics hubs, free-trade zones, and strong demand for premium delivery options. Africa shows gradual growth supported by improving internet access, rising e-commerce participation, and investment in transport networks. Companies expand fulfillment centers and last-mile solutions to reach underserved locations. Despite infrastructural challenges, growing digitalization and retail modernization continue to support long-term market development.
Market Segmentations:
By Service Type
- Transportation
- Warehousing
- Value-Added Services
- Inventory Management
By Operational Area
- Domestic
- International
- Cross-Border
- Regional
By Product Category
- Consumer Electronics
- Fashion & Apparel
- Food & Beverages
- Personal Care & Cosmetics
By End User
- B2C
- B2B
- Online Retailers
- Marketplace Platforms
By Geography
- North America
- U.S.
- Canada
- Mexico
- Europe
- Germany
- France
- U.K.
- Italy
- Spain
- Rest of Europe
- Asia Pacific
- China
- Japan
- India
- South Korea
- South-east Asia
- Rest of Asia Pacific
- Latin America
- Brazil
- Argentina
- Rest of Latin America
- Middle East & Africa
- GCC Countries
- South Africa
- Rest of the Middle East and Africa
Competitive Landscape
Competitive landscape analysis shows a strong presence of major players such as Kenco Group, Inc., Aramex International, CEVA Logistics, XPO Logistics Plc., Clipper Logistics Plc., DHL International GmbH, Agility Public Warehousing Company K.S.C.P., Gati Limited, FedEx Corporation, and United Parcel Service, Inc. These companies strengthen their market position through extensive transportation networks, advanced warehousing capabilities, and continuous investment in automation and digital tracking technologies. Leading players focus on expanding last-mile delivery services, integrating route optimization tools, and enhancing cross-border fulfillment to support rising e-commerce demand. Strategic partnerships with online retailers, marketplace platforms, and technology providers help improve delivery speed and operational efficiency. Sustainability initiatives, including electric fleets and greener packaging solutions, also gain prominence in competitive strategies. As online shopping volumes surge, differentiation increasingly relies on fast delivery performance, scalable fulfillment solutions, and strong technological innovation across the logistics value chain.
Key Player Analysis
- Kenco Group, Inc.
- Aramex International
- CEVA Logistics
- XPO Logistics Plc.
- Clipper Logistics Plc.
- DHL International GmbH
- Agility Public Warehousing Company K.S.C.P.
- Gati Limited
- FedEx Corporation
- United Parcel Service, Inc.
Recent Developments
- In September 2025, Aramex International emphasised that e-commerce logistics now centres on speed, accuracy, technology, and sustainability — rethinking fulfilment to meet modern online-shopping demands.
- In May 2025, Kenco Group, Inc. acquired the 3PL arm of Ontario-based Drexel Industries. The acquisition added four physical locations and about 100 employees, broadening Kenco’s Canadian footprint
Report Coverage
The research report offers an in-depth analysis based on Service Type, Operational Area, Product Category, End User and Geography. It details leading market players, providing an overview of their business, product offerings, investments, revenue streams, and key applications. Additionally, the report includes insights into the competitive environment, SWOT analysis, current market trends, as well as the primary drivers and constraints. Furthermore, it discusses various factors that have driven market expansion in recent years. The report also explores market dynamics, regulatory scenarios, and technological advancements that are shaping the industry. It assesses the impact of external factors and global economic changes on market growth. Lastly, it provides strategic recommendations for new entrants and established companies to navigate the complexities of the market.
Future Outlook
- The market will expand as online shopping accelerates across all major regions.
- Same-day and next-day delivery services will become standard across leading platforms.
- Automation and robotics will reshape fulfillment centers and improve processing speed.
- Cross-border e-commerce growth will increase demand for global shipping and customs solutions.
- Electric vehicles and green logistics will gain traction as sustainability becomes a priority.
- Micro-fulfillment centers will support faster delivery in densely populated urban areas.
- AI-driven route optimization will reduce delivery times and improve cost efficiency.
- Reverse logistics operations will expand to manage the rising volume of online returns.
- Partnerships between retailers and logistics providers will strengthen to enhance capacity and reliability.
- Predictive analytics will improve demand planning and enable more efficient inventory placement.
Request a Free Sample
Fill in your details and we'll send you a free sample report.
- Sample data tables & charts
- Research methodology
Need a Custom Version of This Report?
Tailor the scope, geography, or segments to your exact requirements.
- Custom geography or segment scope
- Direct access to our analyst team
Frequently Asked Questions
What is the current market size for the E-Commerce Logistics market, and what is its projected size in 2032?
At what Compound Annual Growth Rate is the E-Commerce Logistics market projected to grow between 2025 and 2032?
What are the critical drivers for the growth of the e-commerce logistics market?
What are the primary factors fueling the growth of the E-Commerce Logistics market?
who are the leading companies in the E-Commerce Logistics market?
Table of Content
Chapter 1. Report Introduction
- 1.1 Report Description & Purpose
- 1.1.1 Report Title & Market Definition
- 1.1.2 Unique Selling Propositions (USP) & Key Differentiators
- 1.1.3 Value Proposition for Stakeholders
- 1.2 Research Objectives
- 1.2.1 Market Sizing Objectives (Volume & Revenue)
- 1.2.2 Segmentation Objectives
- 1.2.3 Competitive Intelligence Objectives
- 1.2.4 Forecast & Scenario Objectives
- 1.3 Report Scope
- 1.3.1 E-Commerce Logistics Scope – Types & Subtypes Covered
- 1.3.2 Geographic Scope – Regions & Countries Covered
- 1.3.3 Historical Period, Base Year & Forecast Period (2024; forecast to 2032)
- 1.3.4 Inclusions & Exclusions
- 1.4 HS Code & Classification Framework
- 1.5 Currency, Units & Pricing Basis
- 1.6 Target Stakeholders
- 1.7 Limitations & Assumptions
Chapter 2. Executive Summary
- 2.1 Global E-Commerce Logistics Market Snapshot
- 2.1.1 Market Size – Historical (2024) & Forecast (2024-2032) (2024: USD 470.83 billion → 2032: USD 2,325.91 billion)
- 2.1.2 Volume & Revenue – Global Totals
- 2.1.3 Key Market Highlights – Top Five Facts
- 2.2 E-Commerce Logistics Market Segmentation Snapshot
- 2.2.1 Market Split by Region – 2024 vs. 2032
- 2.3 Competitive Snapshot
- 2.3.1 Top 10 Players by Revenue Share – 2024
- 2.3.2 Top 10 Players by Volume Share – 2024
- 2.3.3 Recent Strategic Developments (18-Month Summary)
- 2.4 Key Investment Highlights & Strategic Conclusions
Chapter 3. E-Commerce Logistics Market Dynamics & Industry Analysis
- 3.1 Market Overview & Context
- 3.1.1 E-Commerce Logistics Market Position in the Broader Automotive Value Chain
- 3.1.2 OEM vs. Replacement Market Dynamics
- 3.1.3 Market Maturity & Development Stage by Region
- 3.2 E-Commerce Logistics Market Drivers
- 3.3 E-Commerce Logistics Market Restraints & Challenges
- 3.4 E-Commerce Logistics Market Opportunities
- 3.5 Porter's Five Forces Analysis
- 3.5.1 Threat of New Entrants
- 3.5.2 Bargaining Power of Suppliers
- 3.5.3 Bargaining Power of Buyers
- 3.5.4 Threat of Substitutes
- 3.5.5 Competitive Rivalry – Intensity Assessment
- 3.6 E-Commerce Logistics Value Chain Analysis
- 3.6.1 Upstream – Raw Material/Input Suppliers
- 3.6.1.1 Raw Material/Input 1
- 3.6.1.2 Raw Material/Input 2
- 3.6.1.3 Raw Material/Input 3
- 3.6.2 Midstream – Production/Manufacturing/Service Delivery
- 3.6.2.1 Production/Process Overview
- 3.6.2.2 Key Facility Locations & Capacity by Manufacturer
- 3.6.3 Downstream – Distribution & End Consumer
- 3.6.3.1 Primary Channel – B2B/OEM
- 3.6.3.2 Secondary Channels – Dealer, Retail, Online, Direct
- 3.6.4 Value Chain Profitability Analysis
- 3.6.1 Upstream – Raw Material/Input Suppliers
- 3.7 PESTEL Analysis
- 3.7.1 Political Factors
- 3.7.2 Economic Factors
- 3.7.3 Social Factors
- 3.7.4 Technological Factors
- 3.7.5 Environmental Factors
- 3.7.6 Legal Factors
- 3.8 E-Commerce Logistics Supply Chain Analysis
- 3.8.1 Raw Material/Input Supply Risk Assessment
- 3.8.2 Manufacturing Concentration Risk (Geographic Exposure)
- 3.8.3 Trade Disruption Impact Analysis
- 3.9 Regulatory & Policy Landscape
Note: The regulatory and policy landscape section covers regulations based on their applicability to the market, E-Commerce Logistics category, geography, and scope of the study. Only regulatory frameworks with a material impact on operations, compliance, trade, sustainability, or market access are analyzed in detail.
Chapter 4. Key Investment Pockets & Opportunity Analysis
- 4.1 E-Commerce Logistics Market Attractiveness Analysis
- 4.1.1 By Region – Investment Attractiveness Matrix (Volume × CAGR)
- 4.2 Absolute Revenue Growth Opportunity
- 4.2.1 By Region – Absolute USD Growth Through 2032
- 4.3 Incremental Volume Opportunity
- 4.3.1 By Region – Incremental Volume Through 2032
- 4.3.2 Segment – Incremental Volume
- 4.4 Emerging Submarket Opportunity Deep Dive (Subject to Applicability)
- 4.5 Emerging Market Opportunity Scorecards
- 4.5.1 United States
- 4.5.2 Europe
- 4.5.3 Asia
- 4.5.4 Middle East & Africa
Note: Emerging Market Opportunity Scorecards will be included based on relevance and strategic importance. Regions listed are indicative and may vary depending on data availability and market dynamics.
Chapter 5. E-Commerce Logistics Import-Export Analysis & Trade Flows
- 5.1 Global Trade Overview
- 5.1.1 Global Export Value by Country (2024)
- 5.1.2 Global Export Volume by Country (2024)
- 5.1.3 Global Import Value by Country (2024)
- 5.1.4 Global Import Volume by Country (2024)
- 5.1.5 Net Trade Balance by Country (2024)
- 5.2 Export Analysis – Segment
- 5.2.1 Type 1 (HS Code)
- 5.2.2 Type 2 (HS Code)
- 5.2.3 Type 3 (HS Code)
- 5.2.4 Type 4 (HS Code)
- 5.2.5 Type 5 (HS Code)
- 5.3 Import Analysis – Segment
- 5.3.1 Type 1 (HS Code)
- 5.3.2 Type 2 (HS Code)
- 5.3.3 Type 3 (HS Code)
- 5.3.4 Type 4 (HS Code)
- 5.3.5 Type 5 (HS Code)
- 5.4 Average Unit Trade Prices
- 5.4.1 Average Export Price – Segment & Country
- 5.4.2 Average Import Price – Segment & Source Country
- 5.4.3 Price Trends (2024)
- 5.5 Key Trade Route Analysis
- 5.5.1 Trade Route 1
- 5.5.2 Trade Route 2
- 5.5.3 Trade Route 3
- 5.5.4 Trade Route 4
- 5.5.5 Trade Route 5
- 5.6 Trade Policy Impact Assessment
- 5.6.1 US Anti-Dumping & Section 301 Tariffs
- 5.6.2 EU Customs Union Impact
- 5.6.3 Major Free Trade Agreements
- 5.6.4 USMCA Rules of Origin
Note: Trade policy analysis will be included only where relevant to the E-Commerce Logistics market.
Chapter 6. Competitive Landscape & Company Benchmarking
- 6.1 E-Commerce Logistics Market Concentration & Structure
- 6.1.1 Herfindahl-Hirschman Index (HHI) – vs. 2024
- 6.1.2 Tier 1, Tier 2 & Tier 3 Market Structure
- 6.1.3 Global, Regional & Local Player Dynamics
- 6.2 E-Commerce Logistics Market Share Analysis – 2024
- 6.2.1 Global Revenue Share by Company
- 6.2.2 Global Volume Share by Company
- 6.2.3 Regional Revenue Share
- 6.2.4 Market Share Evolution ( vs. 2024)
- 6.2.5 OEM Segment Share by Company
- 6.2.6 Replacement Segment Share by Company
- 6.3 Production/Delivery Capacity & Facility Analysis
- 6.3.1 Global Installed Capacity
- 6.3.2 Capacity Utilization Rates
- 6.3.3 Production/Output Volume
- 6.3.4 Facility Locations & Capacity Map
- 6.3.5 Planned Capacity Additions
- 6.4 E-Commerce Logistics Competitive Benchmarking Matrix
- 6.4.1 Revenue, Volume, CAGR & Profitability Comparison
- 6.4.2 Channel Revenue Mix
- 6.4.3 Geographic Revenue Exposure
- 6.4.4 R&D Intensity
- 6.4.5 Sustainability Maturity
- 6.5 Strategic Developments in E-Commerce Logistics (Last 24 Months)
- 6.5.1 Mergers, Acquisitions & Divestments
- 6.5.2 New E-Commerce Logistics Launches
- 6.5.3 Facility Expansions
- 6.5.4 Strategic Alliances, Joint Ventures & Partnerships
- 6.5.5 Distribution Expansion & Market Entry
- 6.5.6 Sustainability & ESG Initiatives
- 6.6 Competitive Strategy Mapping
- 6.6.1 Leader, Challenger, Follower & Niche Classification
- 6.6.2 Pricing Strategy Comparison
- 6.6.3 Channel Strategy Matrix
Note: Strategic developments are included based on their materiality and the availability of reliable information.
Chapter 7. Global E-Commerce Logistics Market – By Distribution Channel
- 7.1 Segment Overview
- 7.1.1 Volume & Revenue Split by Channel (2024 & 2032)
- 7.1.2 Channel Mix Evolution (2024-2032)
Chapter 8. Regional Market Analysis – Global Overview
- 8.1 Global Regional Overview
- 8.1.1 Regional Volume Share
- 8.1.2 Regional Revenue Share
- 8.1.3 Regional Volume by Region
- 8.1.4 Regional Revenue by Region
- 8.1.5 Regional Forecast Through 2032
- 8.2 Cross-Regional Segment Analysis
- 8.2.1 By Distribution Channel
- 8.2.2 By Brand/Price Tier
Chapter 9. North America E-Commerce Logistics Market
- 9.1 United States
- 9.2 Canada
- 9.3 Mexico
Chapter 10. Europe E-Commerce Logistics Market
- 10.1 Germany
- 10.2 France
- 10.3 Italy
- 10.4 United Kingdom
- 10.5 Spain
- 10.6 Poland
- 10.7 Russia
- 10.8 Netherlands
- 10.9 Belgium
- 10.10 Sweden
- 10.11 Denmark
- 10.12 Norway
- 10.13 Rest of Europe
Chapter 11. Asia Pacific E-Commerce Logistics Market
- 11.1 China
- 11.2 India
- 11.3 Japan
- 11.4 South Korea
- 11.5 Thailand
- 11.6 Indonesia
- 11.7 Vietnam
- 11.8 Malaysia
- 11.9 Australia
- 11.10 Rest of Asia Pacific
Chapter 12. Latin America E-Commerce Logistics Market
- 12.1 Brazil
- 12.2 Argentina
- 12.3 Colombia
- 12.4 Chile
- 12.5 Rest of Latin America
Chapter 13. Middle East E-Commerce Logistics Market
- 13.1 Saudi Arabia
- 13.2 United Arab Emirates
- 13.3 Turkey
- 13.4 Israel
- 13.5 Iran
- 13.6 Rest of the Middle East
Chapter 14. Africa E-Commerce Logistics Market
- 14.1 South Africa
- 14.2 Egypt
- 14.3 Nigeria
- 14.4 Morocco
- 14.5 Rest of Africa
Chapter 15. E-Commerce Logistics Company Profiles
- 15.1 [Company 01]
- 15.1.1 Company Overview
- 15.1.2 Key Management Personnel
- 15.1.3 Products & Services Portfolio
- 15.1.4 Financial Performance
- 15.1.5 Key Market Focus & Geographic Presence
- 15.1.6 Recent Developments & Strategic Initiatives
Note: The company profile list is preliminary and may change based on research findings, market developments, data availability, and client requirements.
Chapter 16. Appendices
- Appendix A – List of Abbreviations & Acronyms
- Appendix B – Industry Classification Code Reference – Full Series
- Appendix C – Production & Capacity Data Tables
- Appendix D – End-Use & Demand Base Tables
- Appendix E – Consumption & Replacement Rate Assumptions
- Appendix F – ASP Reference Tables
- Appendix G – Manufacturing & Facility Database
- Appendix H – Import-Export Data Tables
- Appendix I – Regulatory Summary Tables
- Appendix J – Primary Research Participant List (Anonymized)
- Appendix K – Primary Research Questionnaire Framework
- Appendix L – Data Sources & Bibliography
- Appendix M – Market Size Divergence & Source Comparison
Chapter 17. Research Methodology
- 17.1 Research Framework & Philosophy
- 17.2 Secondary Research – Sources, Hierarchy & Data Extraction
- 17.3 Data Modeling – Bottom-Up & Top-Down Market Sizing
- 17.4 Primary Research – Stakeholder Framework, LOI & Sample Sizes
- 17.5 Forecast Methodology – Regression, Scenario & Sensitivity Analysis
- 17.6 Quality Control – Four-Layer Validation Framework
- 17.7 Limitations & Standard Assumptions
- 17.8 Disclaimer
