
Online discovery and halal trust shape everyday beauty spend
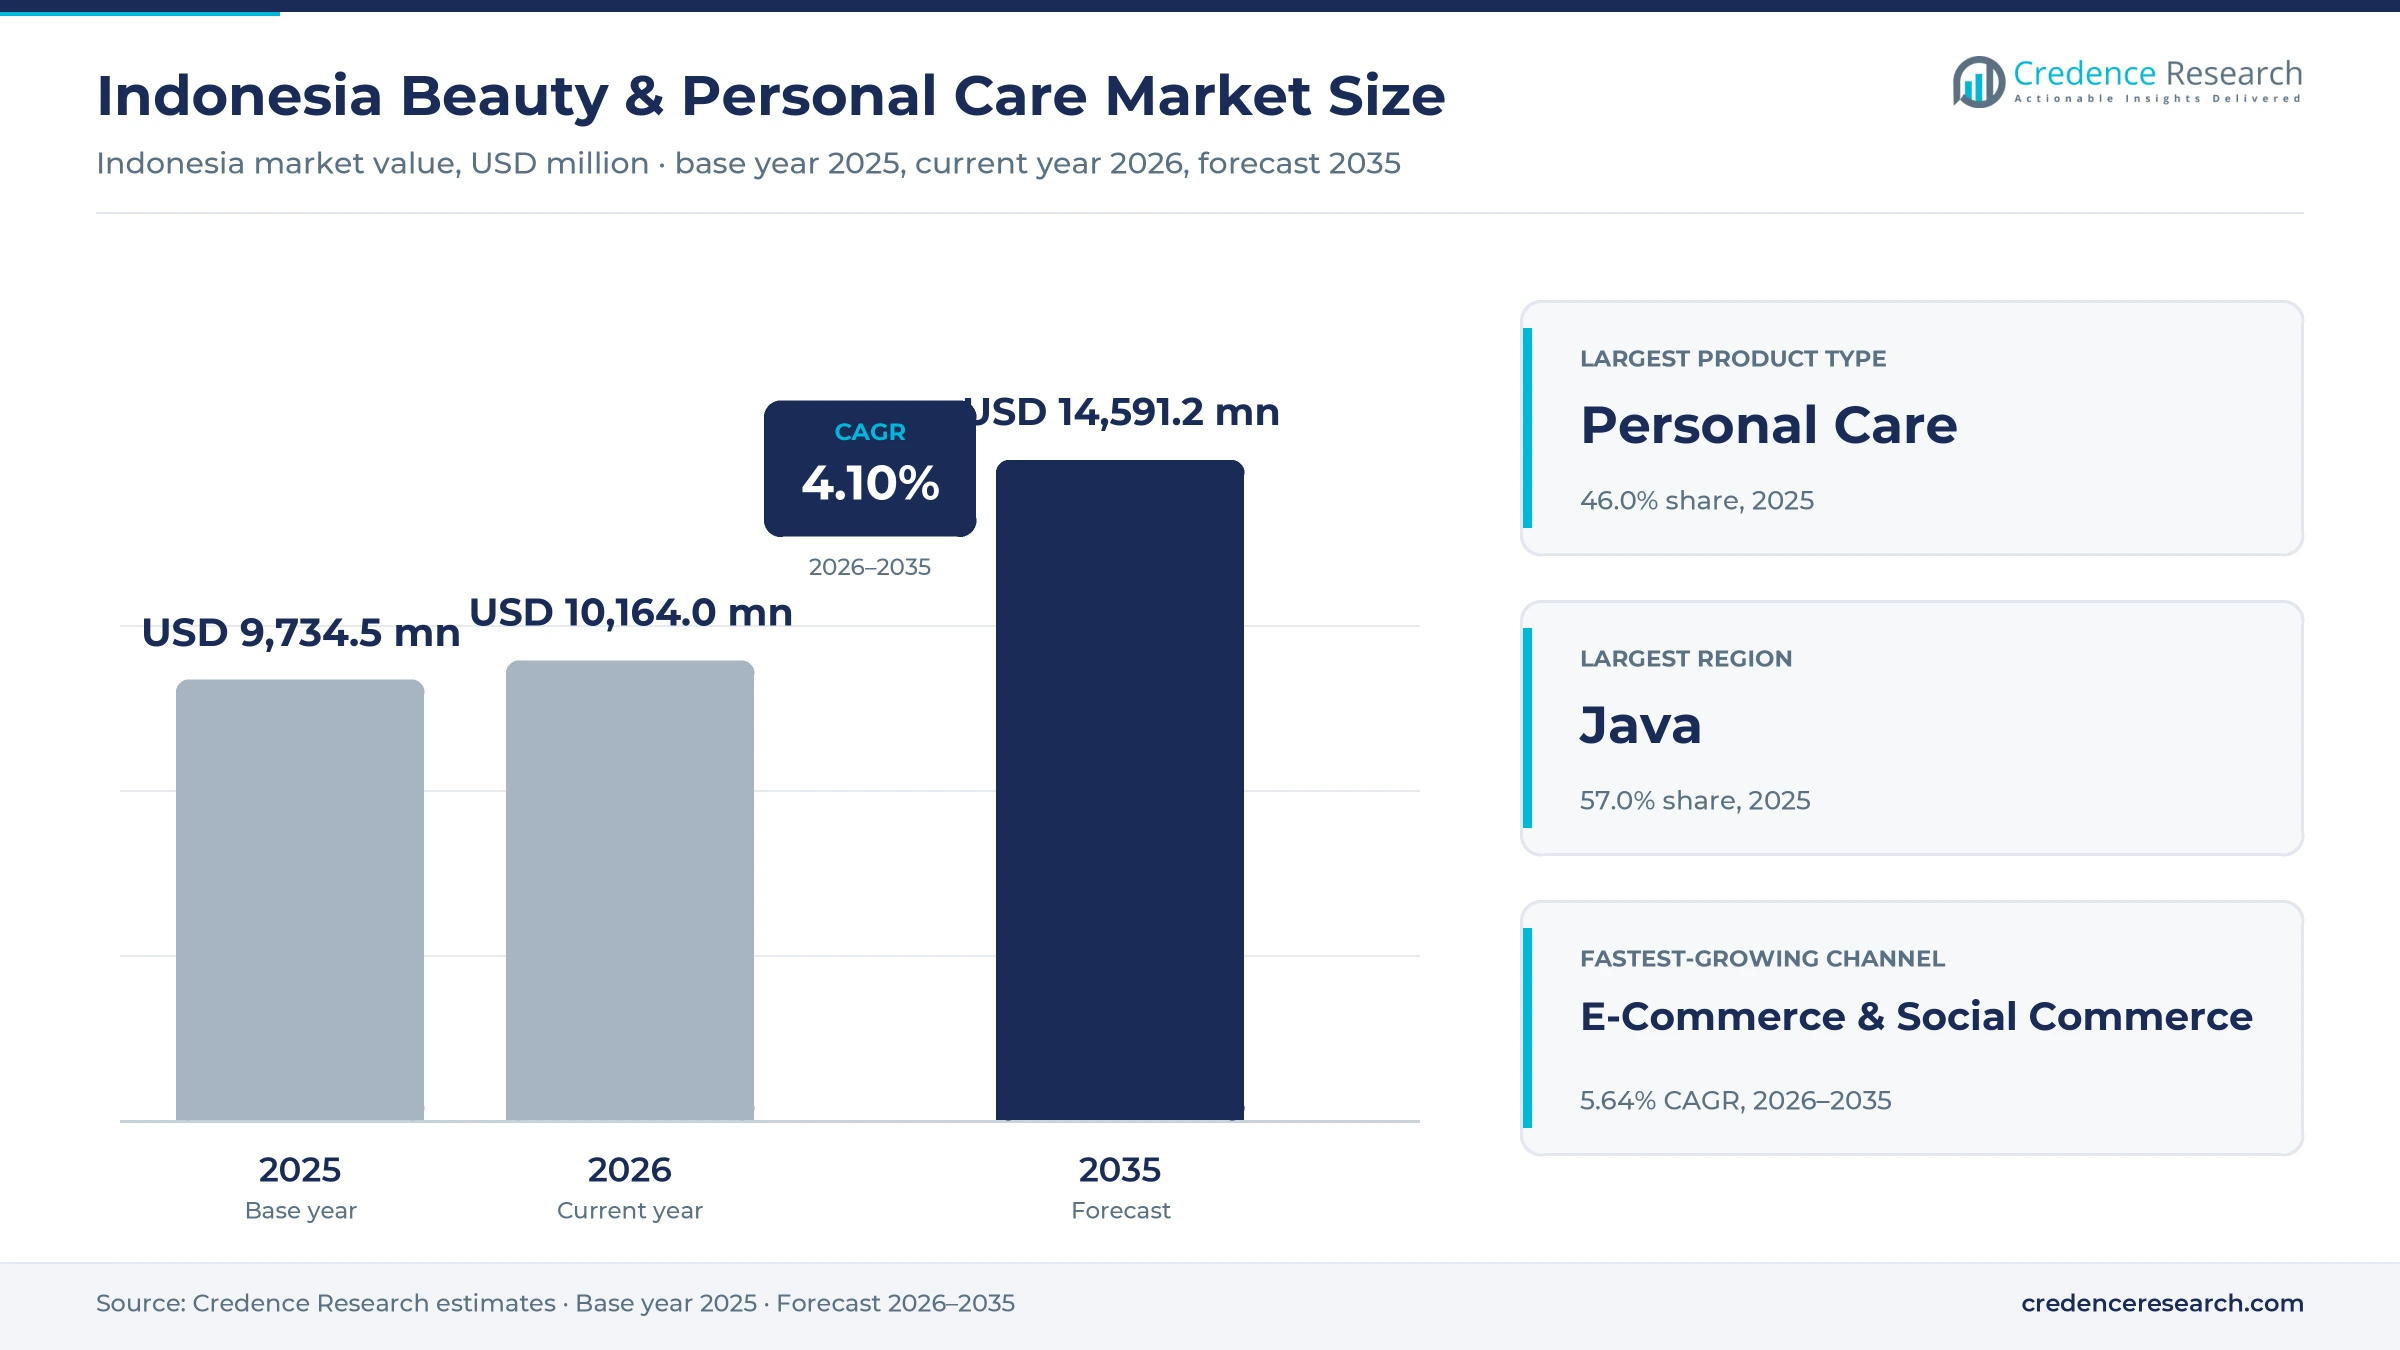
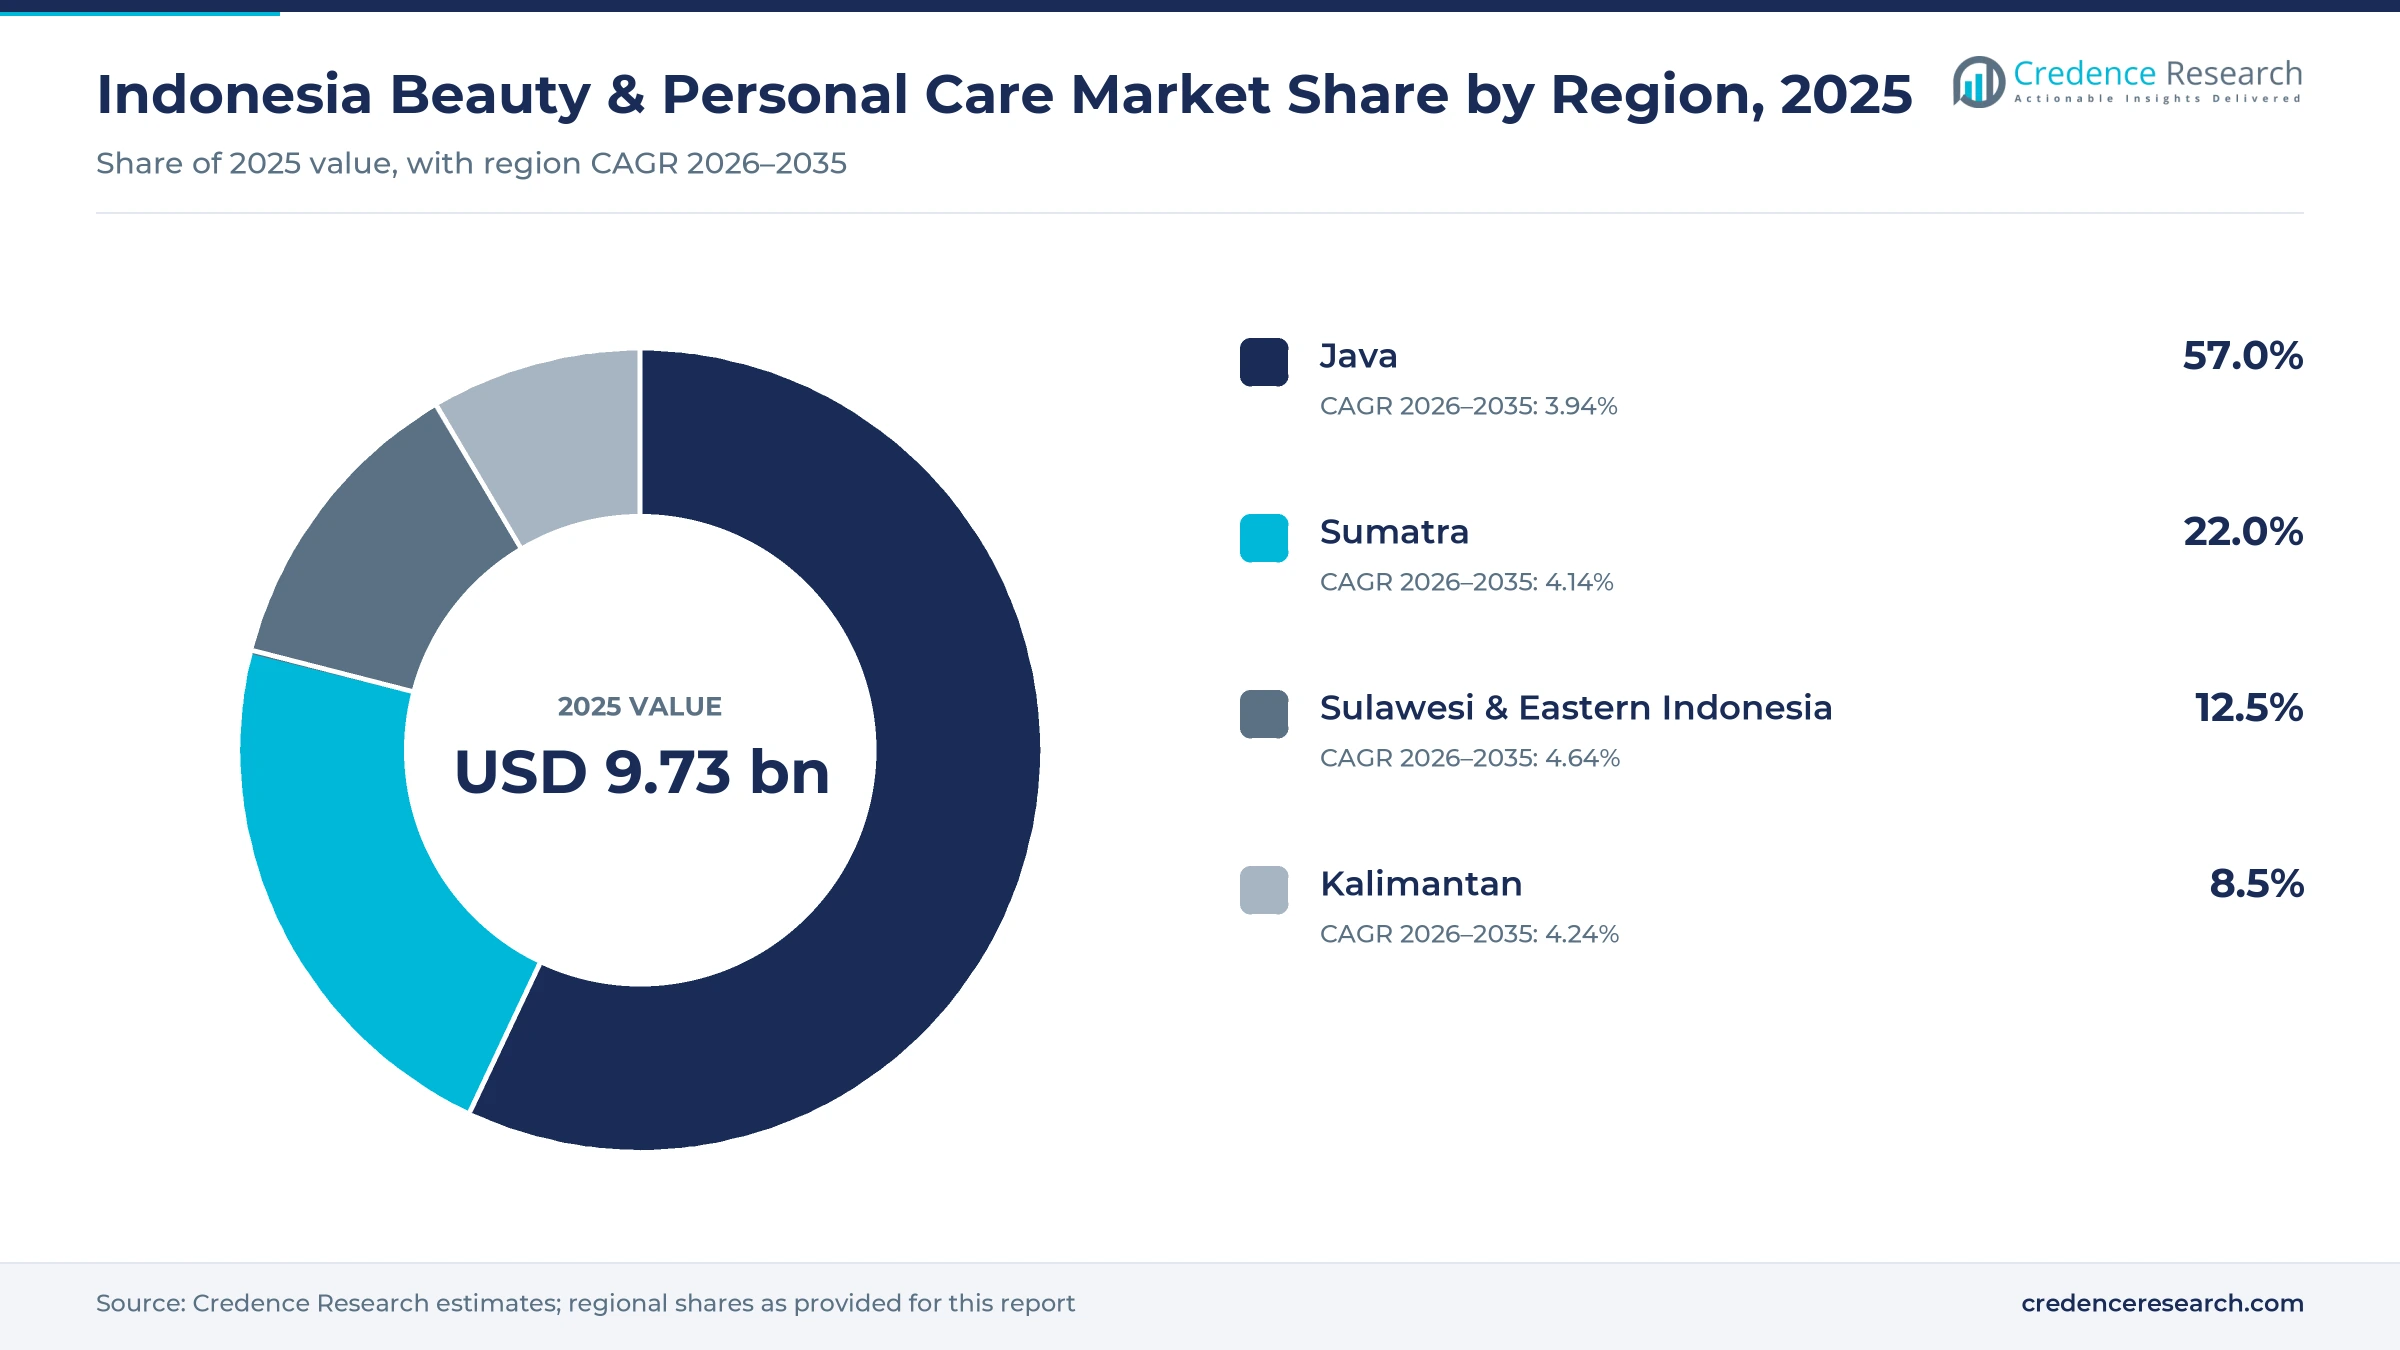
The Indonesia beauty and personal care market was valued at USD 9.73 billion in 2025 and is projected to increase from USD 10.16 billion in 2026 to USD 14.59 billion by 2035, registering a CAGR of 4.10% during 2026–2035. Demand comes from a young, mostly Muslim population that buys soap, shampoo, skin care and makeup every month, and from fast growth in online discovery through marketplaces and social commerce. Java held the largest regional share, 57.0% in 2025, because most cosmetic factories, modern retailers and online shoppers sit on the island. Sulawesi and eastern Indonesia grow fastest at 4.64% a year, helped by the fastest regional economic growth in Sulawesi. All cosmetics distributed in Indonesia must carry halal certification from Oct. 17, 2026, which raises compliance work for importers and gives certified local brands a clear trust signal.
Which hygiene, skin care, makeup and fragrance products are counted?
The estimate measures retail sales value of beauty and personal care products in Indonesia, including personal care such as bath, hair, oral and deodorant products, skin care, color cosmetics and fragrances. It covers products sold through online marketplaces, social commerce, beauty and brand stores, supermarkets, minimarkets and pharmacies. Rupiah sales are translated into U.S. dollars at each year’s average exchange rate.
The estimate excludes salon and spa service fees, prescription dermatology drugs, beauty devices and professional products sold only to salons. It also excludes nutricosmetic supplements and other beauty products taken by mouth. The value chain runs from imported and local ingredient suppliers through brand owners and contract manufacturers to distributors, retailers, online sellers and households.
Indonesia Beauty & Personal Care Market Insights
- The Indonesia beauty and personal care market was valued at USD 9.73 billion in 2025 and is projected to reach USD 14.59 billion by 2035, registering a CAGR of 4.10% during 2026–2035.
- Java accounted for 57.0% of 2025 sales, since its cities combine the densest supermarket networks, most factories and the heaviest online buying.
- Personal care led with 46.0% of 2025 value, as households buy soap, shampoo, toothpaste and deodorant in every income group.
- From Oct. 17, 2026, every cosmetic product distributed in Indonesia needs a halal certificate, giving an edge to makers that finished certification early.
- E-commerce and social commerce grow fastest at 5.64% a year during 2026–2035, as more than 229 million internet users discover brands online.
Daily hygiene products and grocery shelves lead value
Why does personal care lead beauty spending?
Based on product type, the market is categorized into personal care, skin care, color cosmetics and fragrances. Personal Care led with 46.0% of 2025 value, because nearly every household buys soap, shampoo, toothpaste and deodorant each month. Skin Care grows fastest at 4.73% a year, as young buyers add cleansers, serums, moisturizers and sunscreen to daily routines.
How do price tiers shape buying decisions?
Based on price tier, the market is categorized into economy, mass, masstige and premium products. Mass products led with 40.0% of 2025 value, because local and multinational brands sell trusted formulas at prices most families can afford. Masstige products grow fastest at 5.02% a year, as urban buyers pay more for local brands with visible actives, halal labels and creator reviews.
Which channels sell most beauty products?
Based on distribution channel, the market is categorized into e-commerce and social commerce, beauty specialty and brand stores, modern grocery and pharmacies and drugstores. Modern Grocery led with 50.0% of 2025 value, because families buy hygiene products during regular supermarket and minimarket trips. E-Commerce & Social Commerce grows fastest at 5.64% a year, as live streaming and creator content push new launches.
| Segment Group | Leading Sub-segment | Share, 2025 | Fastest-growing Sub-segment | CAGR, 2026–2035 |
|---|---|---|---|---|
| By Product Type | Personal Care | 46.0% | Skin Care | 4.73% |
| By Price Tier | Mass | 40.0% | Masstige | 5.02% |
| By Distribution Channel | Modern Grocery | 50.0% | E-Commerce & Social Commerce | 5.64% |
Request a Free Sample
Fill in your details and we'll send you a free sample report.
- Sample data tables & charts
- Research methodology
Digital reach, local factories and halal rules lift sales
How do digital discovery and online payments widen reach?
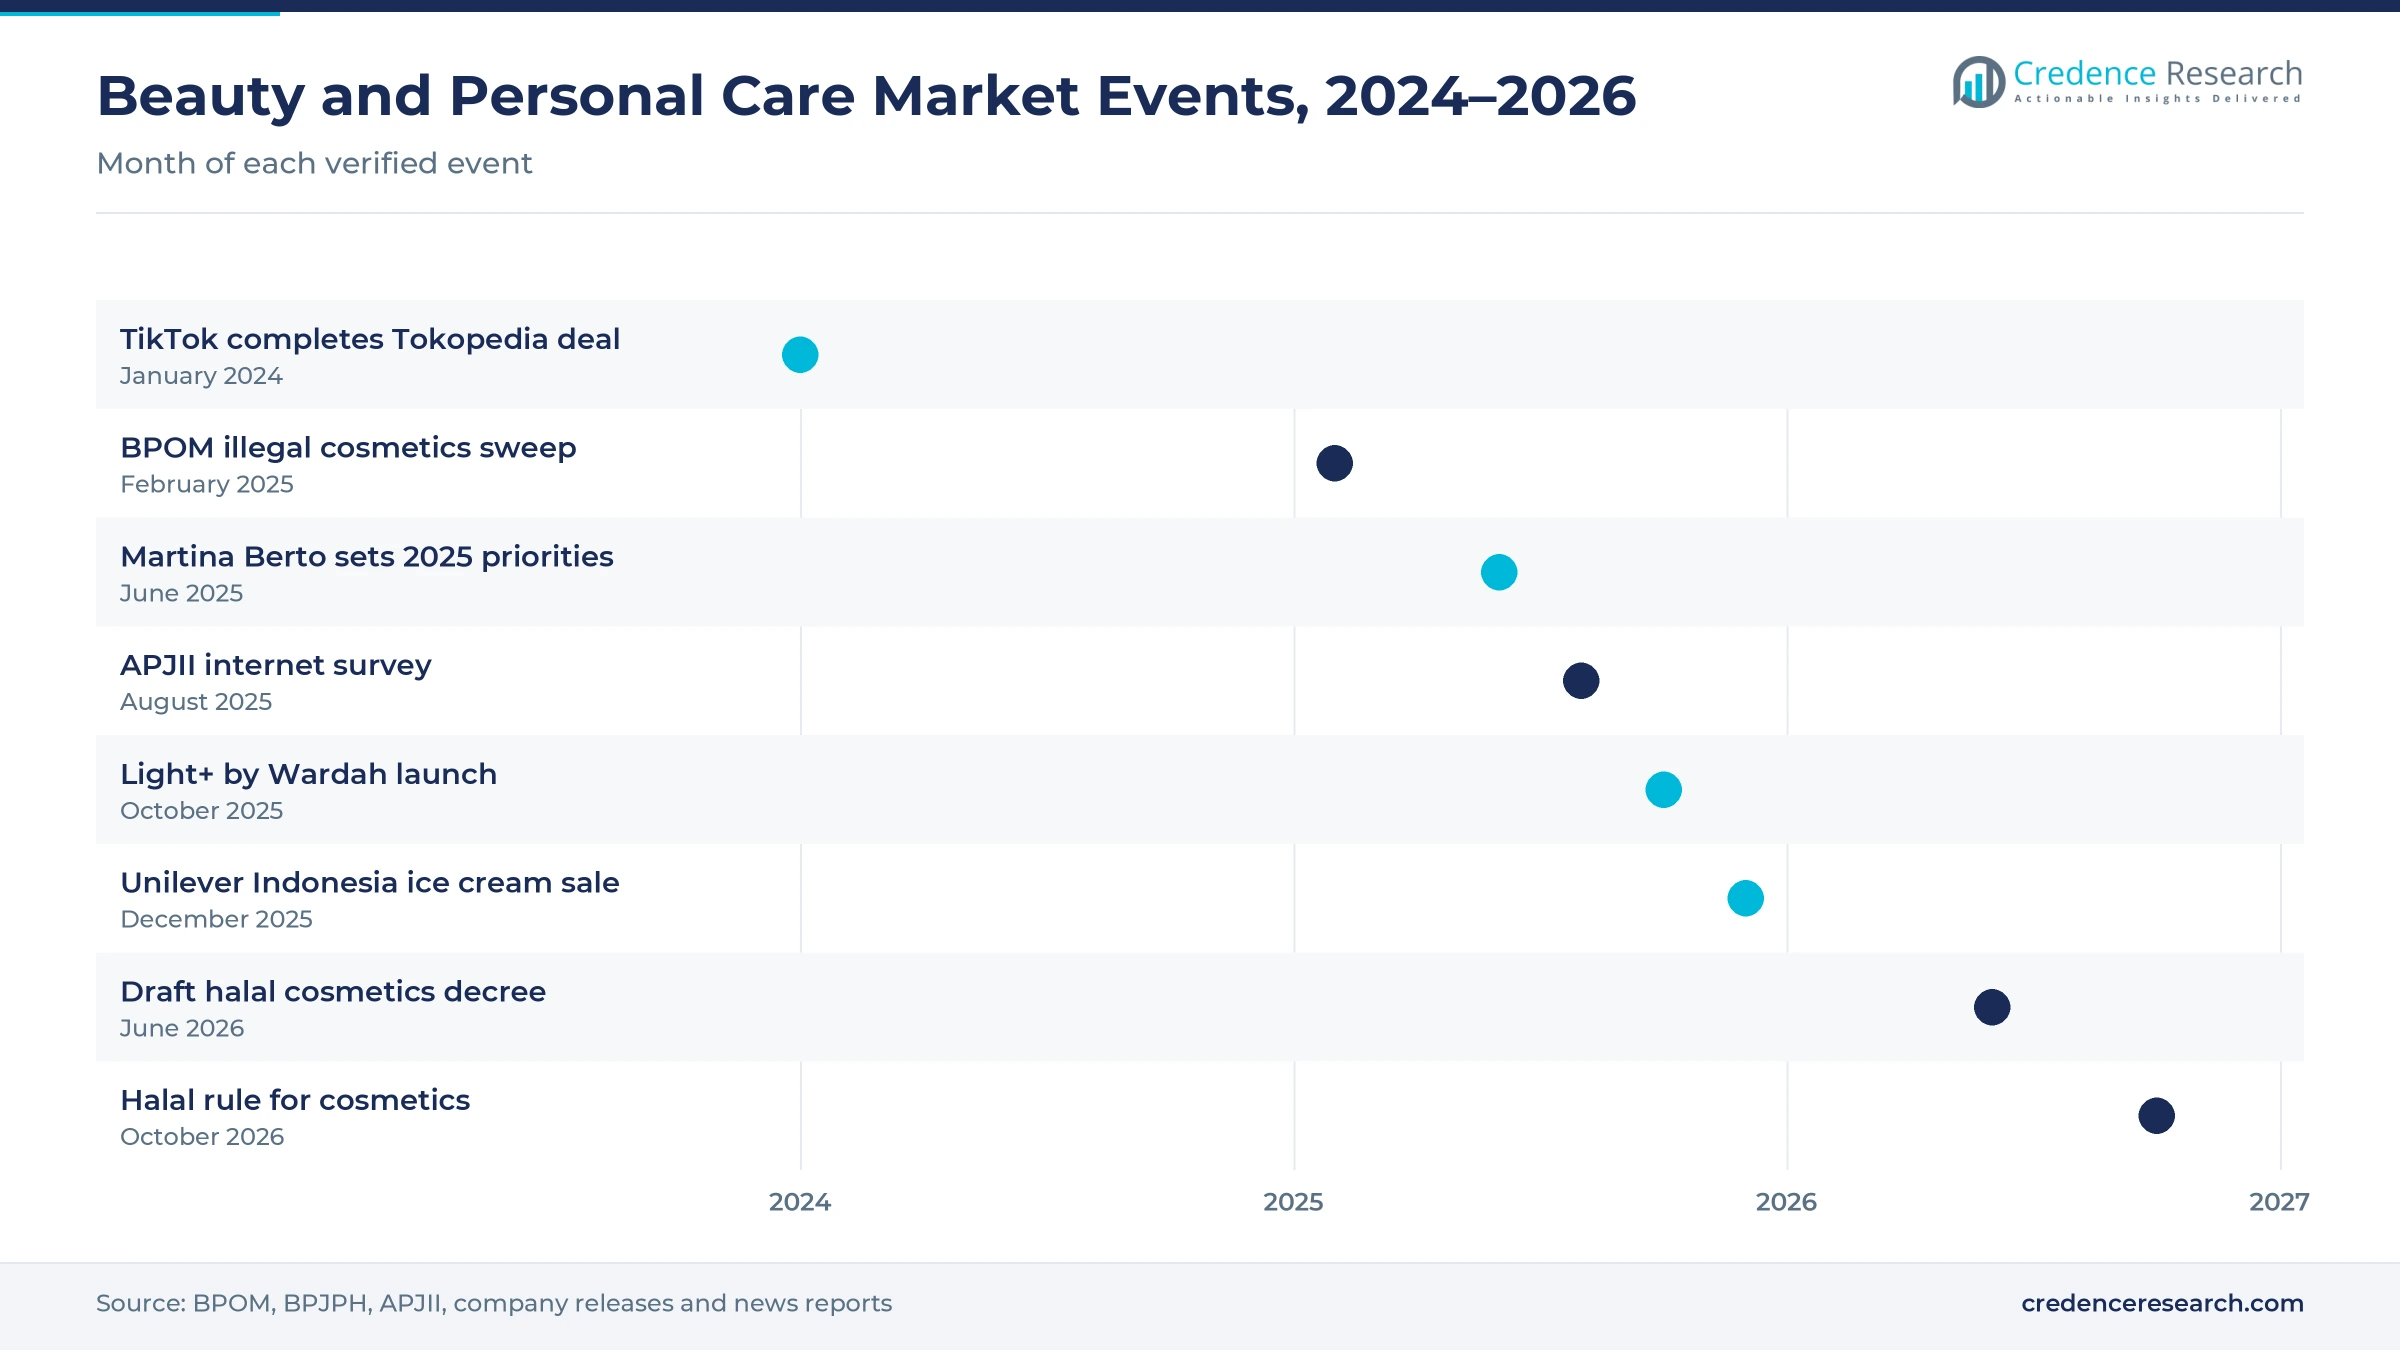
Digital discovery and online transactions widen reach for beauty brands, because shoppers now compare ingredients, halal labels and prices on their phones before buying. Indonesia had 229.43 million internet users in 2025, a penetration rate of 80.66% of a population of about 284 million, according to an APJII survey. TikTok completed its $840 million investment in Tokopedia on Jan. 31, 2024, taking a 75.01% stake and merging shopping with short video. Martina Berto also named live streaming and omnichannel sales on TikTok Shop, Shopee and Tokopedia as 2025 priorities. As a result, e-commerce and social commerce grow fastest at 5.64% a year through 2035.
Why does local manufacturing expand product choice?
Local manufacturing expands product choice, because domestic producers can launch new formulas, shades and pack sizes quickly. The number of cosmetic manufacturers in Indonesia rose from 1,292 in 2024 to more than 1,500 by the end of 2025, and about 90% are small and medium firms, according to BPOM data reported by Industry.co.id. Cosmetic exports also rose from USD 417 million in 2024 to USD 473.8 million in 2025. ParagonCorp launched Light+ by Wardah in October 2025, a halal skin care and makeup line built with input from 1,000 young Indonesians. In turn, skin care grows at 4.73% a year, faster than any other product type.
How does halal assurance build consumer trust?
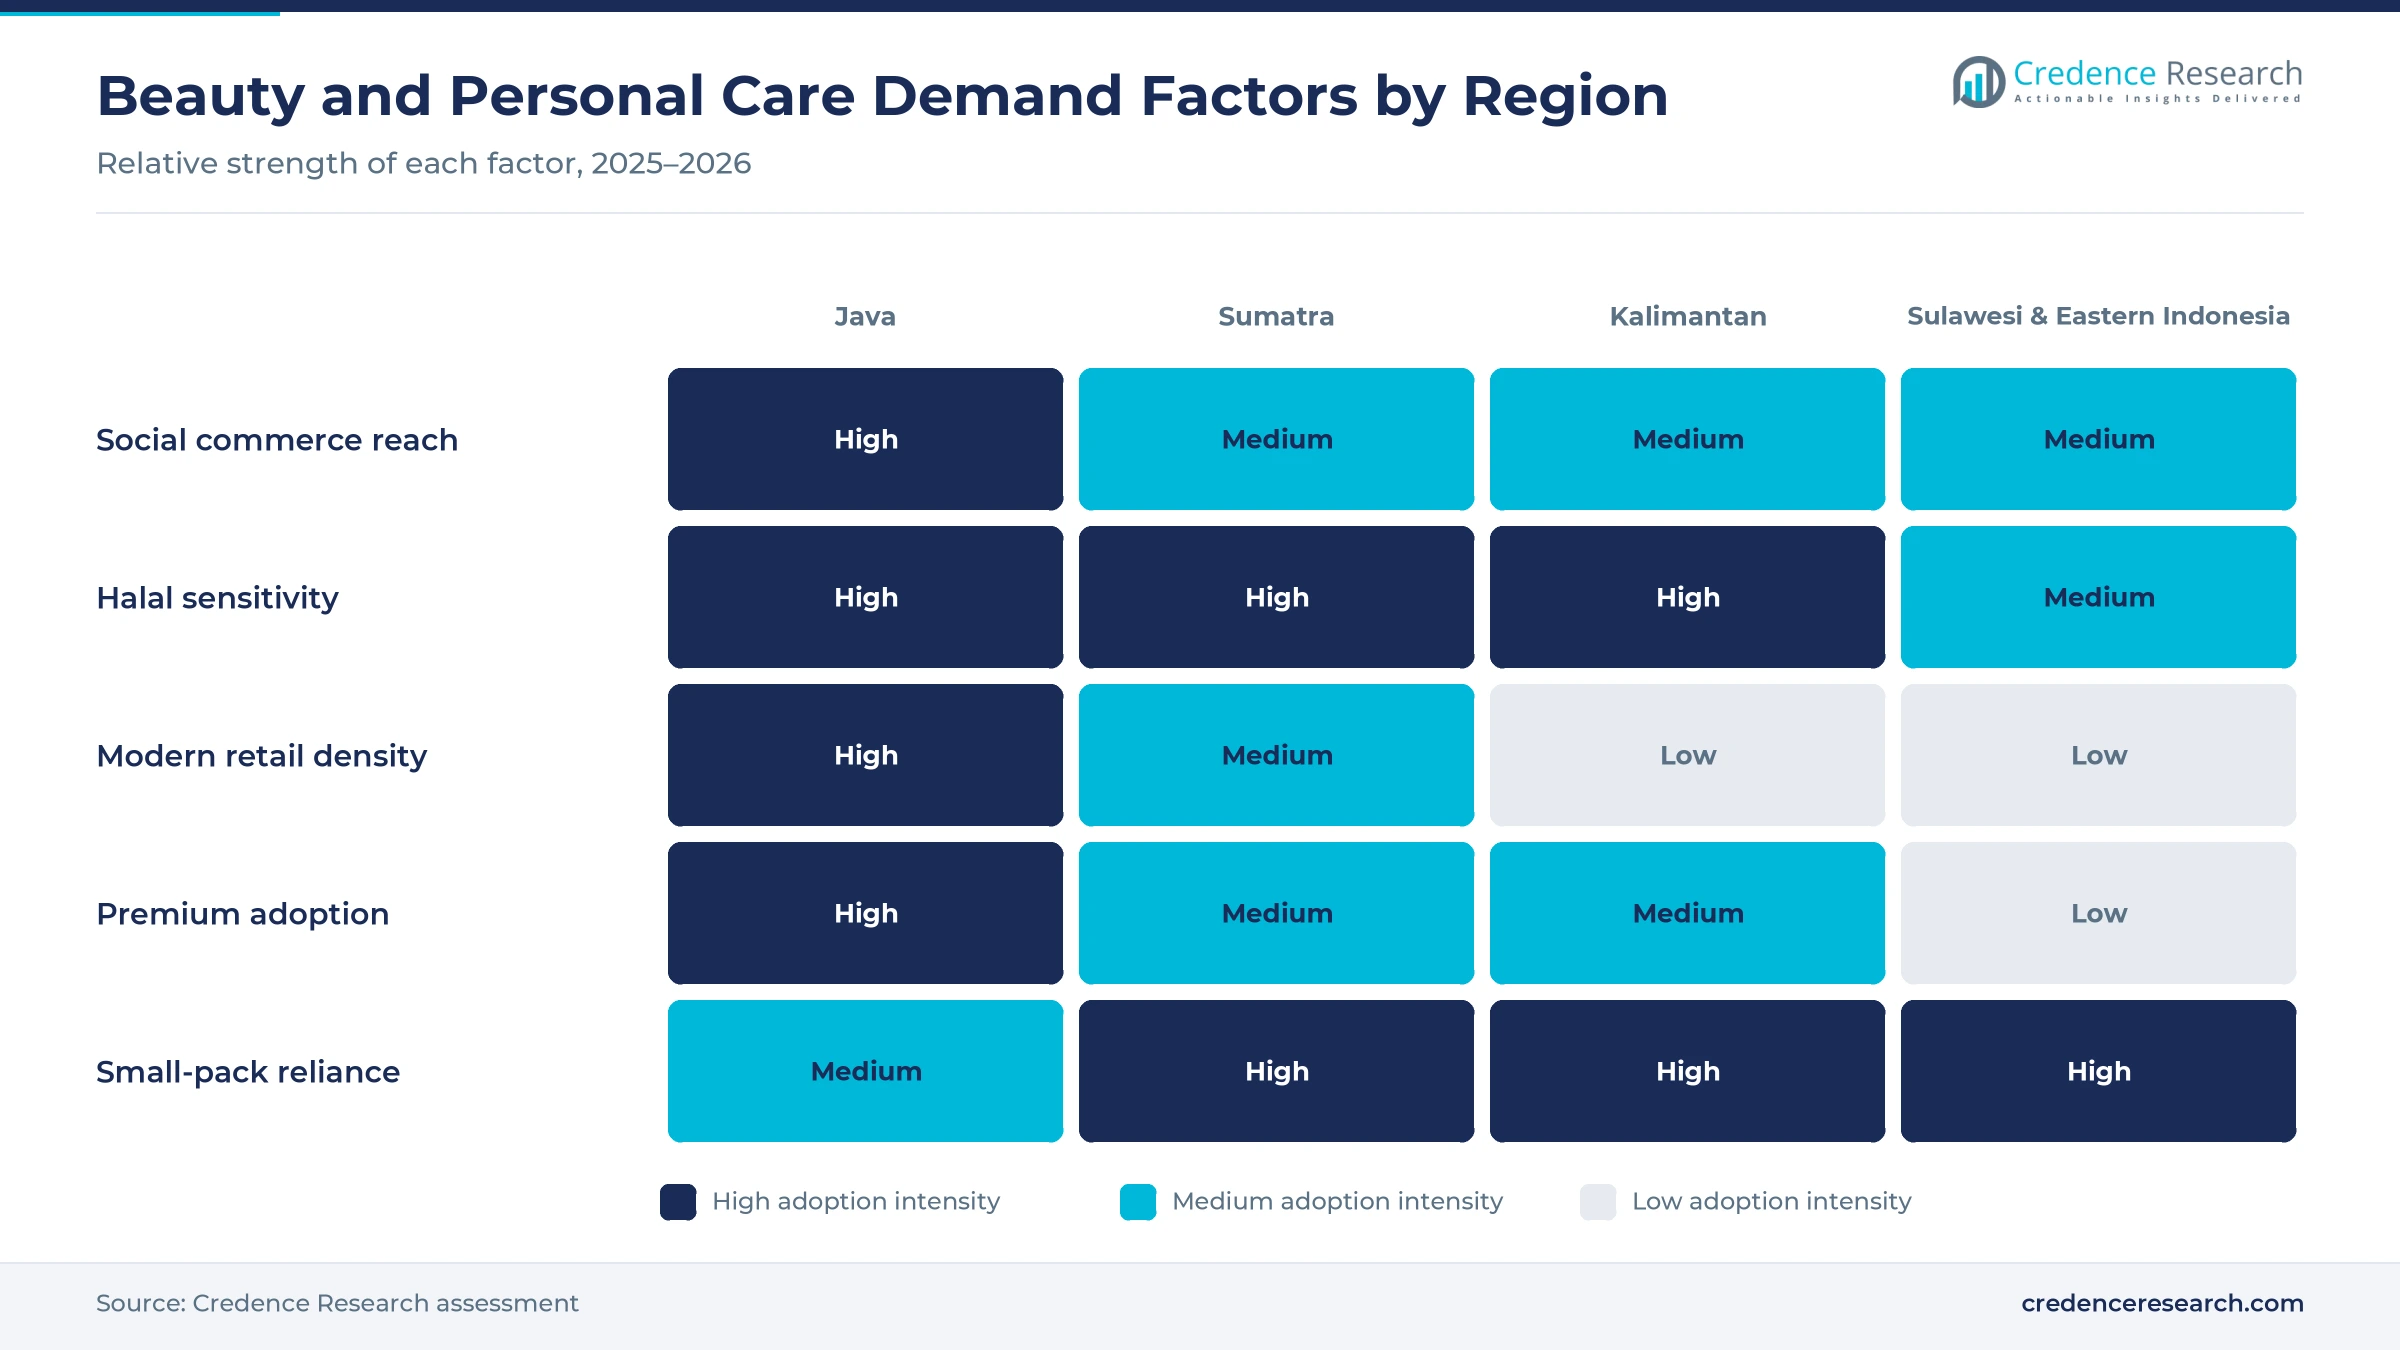
Halal assurance builds consumer trust, because Muslim shoppers use the label to judge both religious compliance and product safety. All cosmetics distributed in Indonesia must hold halal certification from Oct. 17, 2026, according to Personal Care Insights. A draft decree asks each company to adopt a written halal policy and appoint a dedicated halal supervisor, while plant-derived ingredients are presumed halal. About 85% to 90% of cosmetic raw materials are still imported, according to LPPOM, so supplier documents become a key compliance task. Kao has already released a halal-certified Biore Breeze deodorant in Indonesia. Therefore, certified brands gain shelf trust as the deadline arrives.
Why does steady household spending support trading up?
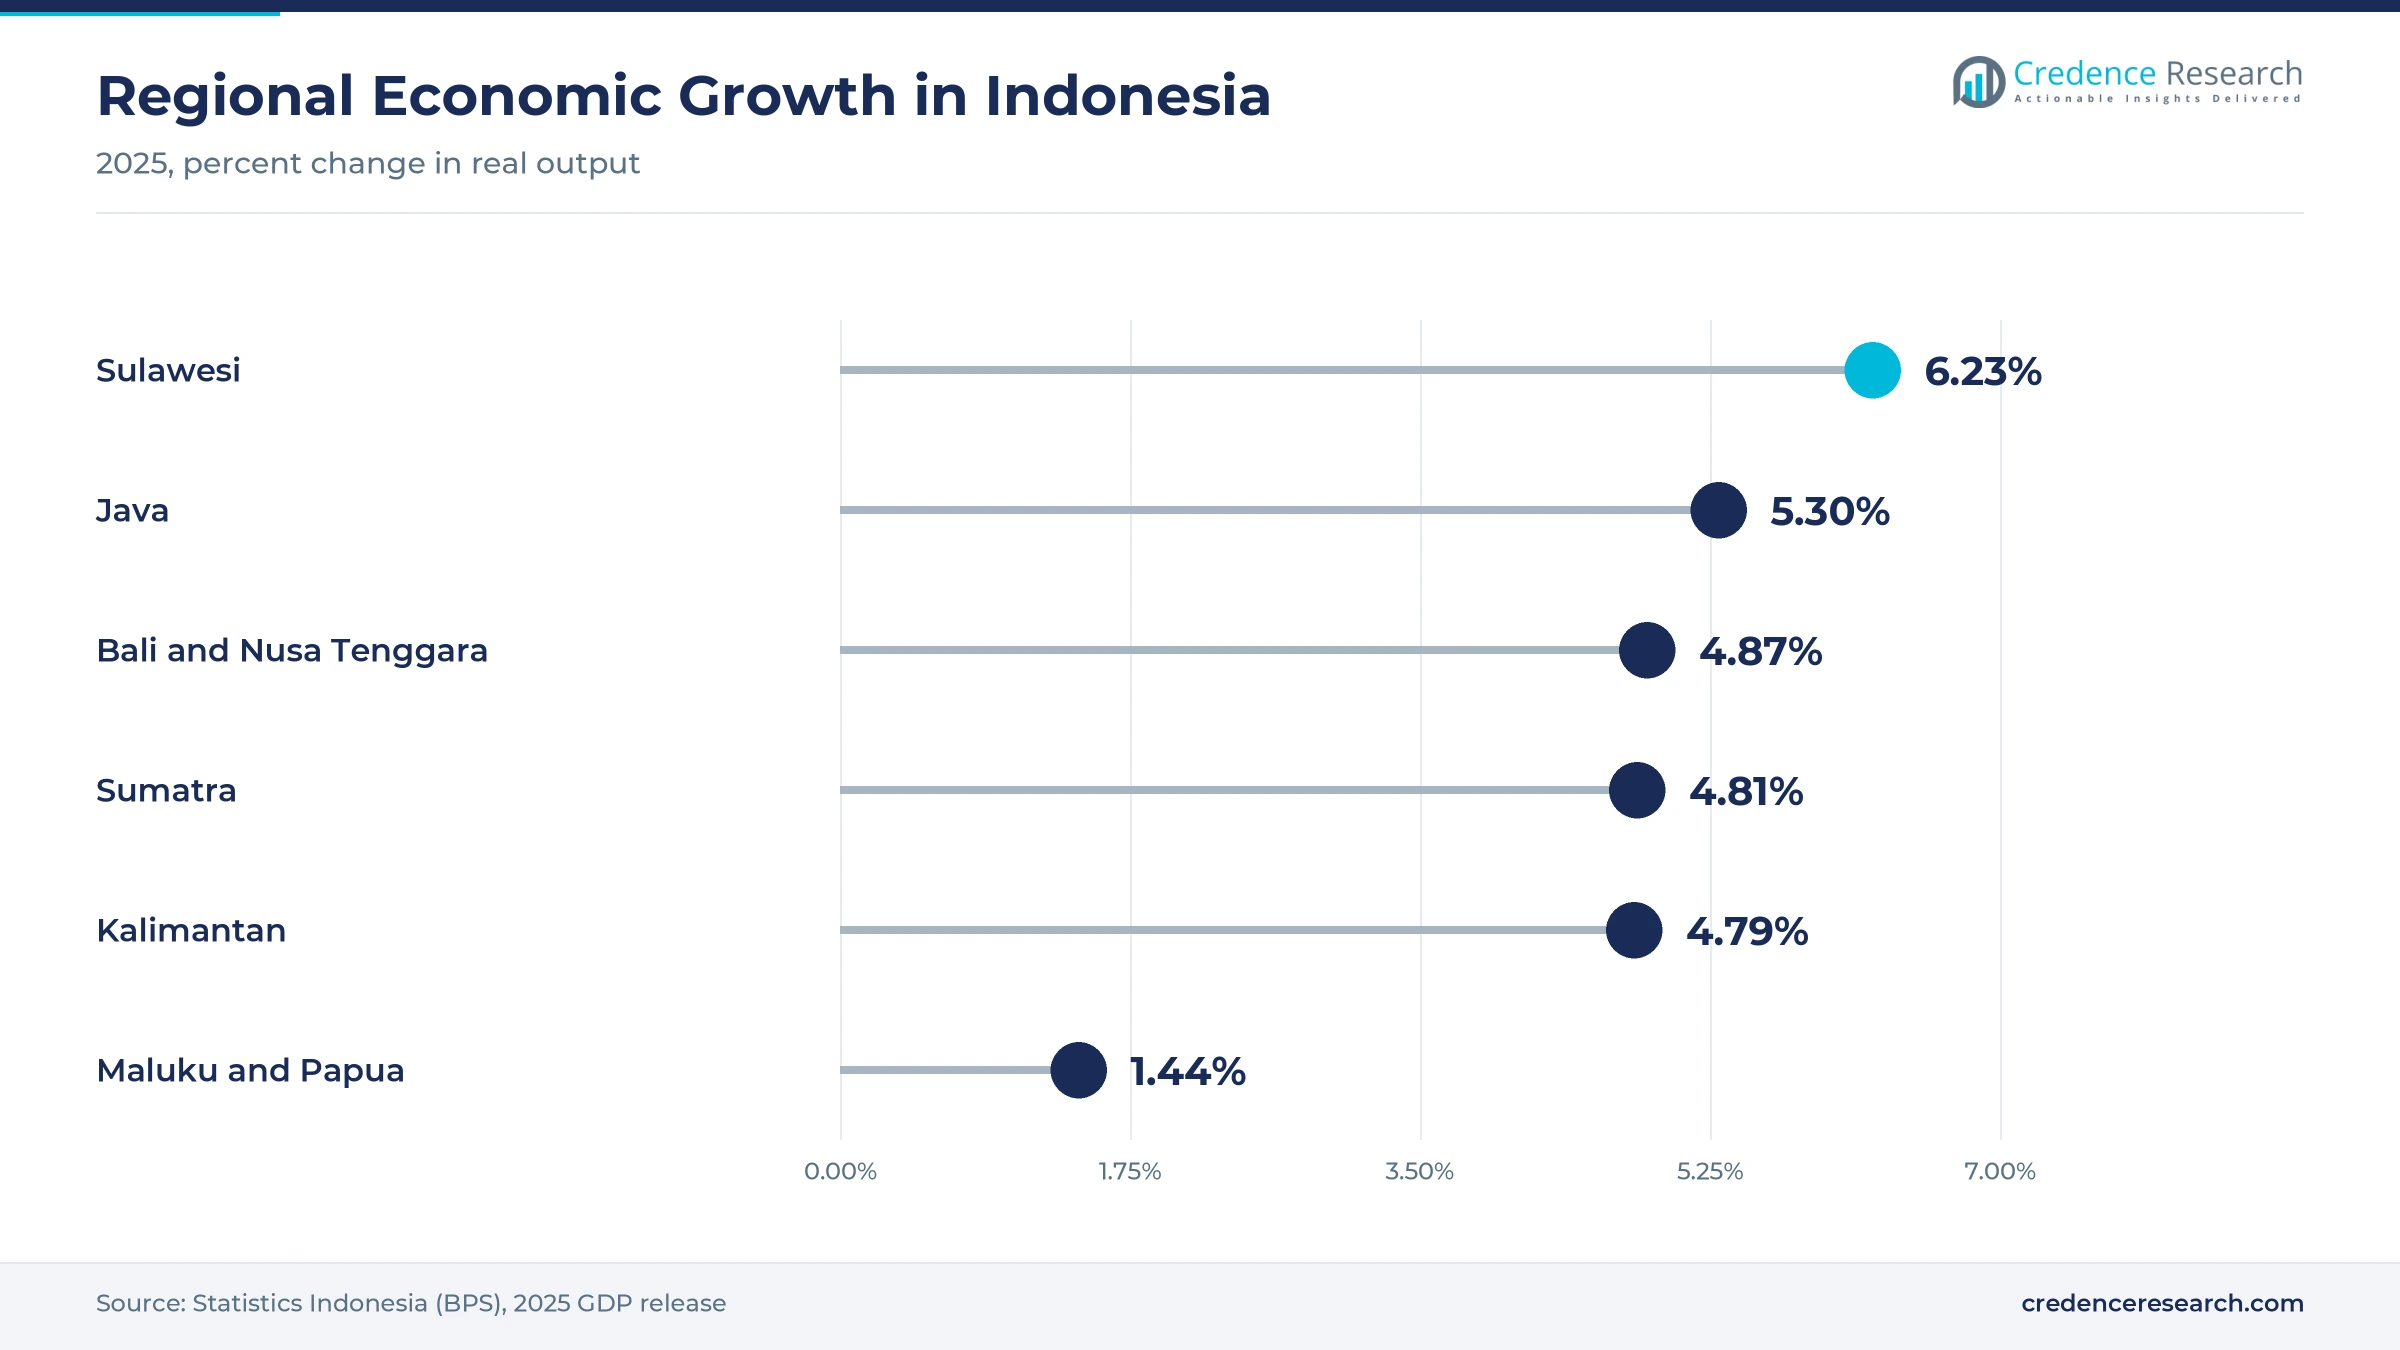
Steady household spending supports trading up, because more families can add skin care, makeup or fragrance to basic hygiene purchases. Household final consumption in Indonesia grew 5.11% in 2024 and 4.98% in 2025, according to World Bank data. The national economy grew 5.11% in 2025, while Sulawesi posted the fastest regional growth at 6.23%, according to Statistics Indonesia. Java also accelerated from 4.92% in 2024 to 5.30% in 2025, which supports spending in the largest consumer base. Consequently, masstige products grow at 5.02% a year through 2035, faster than the economy and mass tiers, as urban shoppers trade up to local brands with visible actives.
Youth lines, halal exports and live selling reshape demand
How is the shift to youth-focused local brands playing out?
Beauty brands are shifting toward youth-focused local lines, because Gen Z buyers start skin routines early and follow creators closely. ParagonCorp unveiled Light+ by Wardah during Youth Pledge Day in October 2025, a line shaped by input from 1,000 young Indonesians. The halal line sits beside Wardah, Emina and Make Over in the group. Martina Berto also set natural, halal-certified product innovation as a 2025 focus for Sariayu, Biokos and Rudy Hadisuwarno Cosmetics, and planned to lift marketing spending from 18.20% to 21.65% of sales. As a result, local brands keep launching barrier care, sunscreen and lip products for young buyers, and skin care gains share across every region through 2035. Indonesia’s 229.43 million internet users also give these youth launches a fast route to buyers through creator content.
Why is the rise of compliance-driven retail changing shelves?
Compliance-driven retail is rising, because regulators are removing unregistered products from both stores and online platforms. BPOM found illegal cosmetics worth more than Rp31.7 billion in a Feb. 10 to 18, 2025, nationwide sweep, more than 10 times the value found in 2024. Officials inspected 709 sites and found 340 of them, or 48%, did not comply, while 60% of the illegal products were imports that went viral online. BPOM later seized over 2 million unregistered units across 956 product lines worth about Rp27.6 billion, most sold through e-commerce. Products with banned or hazardous ingredients made up 17.4% of the illegal items found in that sweep. In turn, platforms and retailers increasingly favor registered, halal-certified brands with clean records.
Can halal-certified exports open new markets?
Halal-certified exports offer a clear opening, because Indonesian brands can sell the same certified formulas to Muslim buyers abroad. Cosmetic exports rose about 14% to USD 473.8 million in 2025, which shows that overseas demand is already growing. Martina Berto named natural and halal-certified products as a 2025 priority for its legacy brands. Demand for halal cosmetics in other Muslim-majority markets can therefore favor brands that certify early under the Oct. 17, 2026 rule. Kao also plans to produce halal sunscreen locally in 2027, which adds export-ready capacity in a fast-growing product type. Brands with more than 1,500 local factories to choose from can also use contract makers to scale export orders.
Is there room for refill packs and men's grooming?
Refill packs and men's grooming offer a second opening, because value-seeking buyers want lower cost per use and men are adding more products to daily routines. Sachets and refill pouches already let economy buyers try shampoo, skin care and makeup in small doses, which matters in a country of about 284 million people with wide income gaps. Suppliers of cosmetic packaging can offer lighter pouches and recyclable bottles to local brands that face halal and cost pressure. Demand for men's grooming products such as facial wash, deodorant and hair styling is also growing in cities. With internet penetration at 80.66% in 2025, brands that pair small packs with online bundles can widen reach in Sulawesi and eastern Indonesia, where few beauty stores operate outside the main cities.
Illegal imports, imported inputs and price pressure weigh
How do unregistered imports undercut local brands?
Cheap unregistered imports pull shoppers away from licensed brands, since sellers skip BPOM registration, safety tests and halal audits. Most of the goods seized in 2026 came in through unofficial channels and were sold on marketplaces without distribution permits. Licensed local makers therefore lose volume in the economy tier and must spend more to prove that their products are safe. Marketplace takedowns, shared product databases and simple label checks for shoppers can limit the damage.
Why do imported raw materials raise compliance costs?
Dependence on foreign ingredients makes halal compliance expensive, since every emulsifier, fragrance and active must arrive with valid certificates from its supplier. Smaller makers often lack staff to chase these papers across many overseas vendors before October 2026. Some may drop products or reformulate in a hurry, which can thin shelves for a while. Pooled certification help from industry groups and more domestic ingredient output would ease this burden over the next few years.
How does price competition squeeze margins?
Price competition squeezes margins, because more than 1,500 manufacturers and many online sellers compete for the same shoppers. Flash sales and platform fees push brands to discount during major shopping days. In turn, smaller brands struggle to fund marketing and new product development. Brands with loyal followers, clear claims, efficient factories and strong retail ties are better placed to protect margins through the forecast period, while weaker sellers may exit or merge.
Do fast-changing trends raise inventory risk?
Fast-changing trends raise inventory risk, because viral products can lose appeal within weeks once creators move on to new launches. Brands that over-produce face markdowns and expired stock, while those that under-produce miss short demand peaks. Therefore, smaller batch production, closer data sharing with platforms and flexible contract manufacturing help brands match supply to demand without heavy write-offs at the end of each season.
Java leads while the eastern islands grow fastest
| Region | Value, 2025 (USD billion) | Share, 2025 | CAGR, 2026–2035 |
|---|---|---|---|
| Java | 5.55 | 57.0% | 3.94% |
| Sumatra | 2.14 | 22.0% | 4.14% |
| Sulawesi & Eastern Indonesia | 1.22 | 12.5% | 4.64% |
| Kalimantan | 0.83 | 8.5% | 4.24% |
Why does Java lead beauty spending?
Java held 57.0% of 2025 value and grows at 3.94% a year, because the island hosts the largest cities, most cosmetic factories and the densest modern retail. Java grew 5.30% in 2025, up from 4.92% in 2024, according to Statistics Indonesia. L’Oréal opened a 66,000 square meter factory at the Jababeka Industrial Estate in West Java in November 2012, and many local brands also produce on the island, which keeps launches close to Java buyers.
How does Sumatra add steady volume?
Sumatra held 22.0% of 2025 value and grows at 4.14% a year, because large Muslim populations in Medan, Palembang and Padang buy halal hygiene and skin care products. Sumatra grew 4.81% in 2025, up from 4.45% in 2024. Supermarkets and minimarkets sell most hygiene products in the region, while online marketplaces help local brands reach smaller towns. Halal labels carry strong weight with buyers across the island’s Muslim-majority provinces, which favors certified local brands.
Why are Sulawesi and the eastern islands growing fastest?
Sulawesi and eastern Indonesia held 12.5% of 2025 value and grow fastest at 4.64% a year. Sulawesi posted the fastest regional economic growth at 6.23% in 2025, which lifts spending in Makassar, Manado and smaller cities. Online orders and small packs reach islands that have few beauty stores, while Bali tourism supports demand for fragrances and body care. However, longer shipping routes raise delivery costs, so brands often rely on regional distributors and marketplace warehouses.
What shapes Kalimantan demand?
Kalimantan held 8.5% of 2025 value and grows at 4.24% a year, because mining and plantation incomes support spending in Balikpapan, Banjarmasin and Pontianak. Growth slowed to 4.79% in 2025 from 5.52% in 2024, which keeps buyers price-conscious. Supermarkets in larger cities carry most hygiene products, while online orders reach towns with few stores.
Platform deals, launches and halal rules mark 2024–2026
| Development | Status and market relevance |
|---|---|
| In January 2024, TikTok completed its $840 million investment in Tokopedia, taking a 75.01% stake in the marketplace. | Strengthens social commerce reach for beauty brands |
| In February 2025, BPOM found illegal cosmetics worth more than Rp31.7 billion in a nationwide inspection sweep. | Raises pressure on unregistered imports sold online |
| In October 2025, ParagonCorp launched Light+ by Wardah, a halal skin care and makeup line for young buyers. | Expands youth-focused local brand choice |
| In December 2025, Unilever Indonesia completed the sale of its ice cream business to The Magnum Ice Cream Indonesia. | Sharpens its focus on home and personal care categories |
| In June 2026, details of a draft BPJPH decree set halal rules for cosmetics ahead of the Oct. 17, 2026 deadline. | Requires halal policies, supervisors and ingredient records |
Halal systems, live commerce and actives change products
- Digital halal records link each ingredient batch to its supplier certificate, which speeds BPJPH audits and lets brands answer shopper questions quickly.
- Live commerce tools let brands demonstrate shades, textures and results in real time on TikTok Shop, Shopee and Tokopedia, which shortens the path from discovery to purchase.
- Dermatology-led actives such as niacinamide, ceramides and sunscreen filters give local brands clear claims that compete with imported products and nutricosmetics aimed at skin health.
- Refill and small-pack formats lower cost per use and plastic use, which helps brands reach economy buyers and remote islands.
Need a Custom Version of This Report?
Tailor the scope, geography, or segments to your exact requirements.
- Custom geography or segment scope
- Direct access to our analyst team
Local halal pioneers and multinationals share the shelf
Competition is led by domestic halal pioneers and multinational groups, with strong challenges from digital-first local labels. ParagonCorp sells Wardah, Emina and Make Over and launched Light+ by Wardah in 2025. Unilever Indonesia competes in hair, skin, oral and body care and completed the sale of its ice cream business in December 2025. L’Oréal produces at its large Jababeka factory in West Java, while Kao sells halal-certified Biore products. Martina Berto builds on herbal heritage through Sariayu and Biokos, and Mandom, Kino, Lion Wings, Victoria Care and Beauty Haul compete across hygiene, grooming and makeup. Brands compete on halal status, price per use, creator marketing, shade range and reach on social commerce platforms. Companies with local factories and certified supply chains are best placed as the 2026 halal deadline takes effect.
Companies profiled and their roles in this market
| Company | Type | Role in the market |
|---|---|---|
| PT Paragon Technology and Innovation | Domestic company | Sells Wardah, Emina and Make Over; launched Light+ by Wardah in October 2025 |
| PT Unilever Indonesia Tbk | Multinational subsidiary | Completed the sale of its ice cream business in December 2025 |
| L’Oréal Indonesia | Multinational subsidiary | Runs a 66,000 square meter factory at Jababeka, West Java |
| PT Martina Berto Tbk | Domestic company | Sells Sariayu and Biokos; set live streaming and halal priorities for 2025 |
| PT Kao Indonesia | Multinational subsidiary | Released halal-certified Biore Breeze deodorant; plans local halal sunscreen |
Credence Research view on halal-led steady growth
Credence Research expects Indonesian beauty and personal care to grow at a steady pace, as daily hygiene buying gives the market a stable floor while skin care and masstige lines add value on top. Personal care already holds 46.0% of 2025 value in this broad market. Enforcement against illegal goods and the October 2026 halal rule should shift sales toward licensed makers with clean supply records. Even so, rupiah swings raise the cost of imported inputs, and intense discounting on marketplaces keeps margins thin. Brands that build loyal online communities and produce locally are best placed to gain share.
How the beauty and personal care estimate was built
Credence Research built the estimate bottom-up for 2025, its base year, in USD million at current prices. The model multiplies households and individual users by product use rates and average shelf prices for each product type, then checks the result against household spending trends. Regional shares follow the split set for this report, while product, price tier and channel splits are Credence Research estimates. Inputs came from Statistics Indonesia, BPOM and BPJPH notices, World Bank data, company releases and press coverage, with no interviews or surveys.
Halal compliance and online reach set the path to 2035
By 2035 the market should reach USD 14.59 billion, a 4.10% CAGR during 2026–2035, with growth spread across daily hygiene, skin care and makeup. Sulawesi and the eastern islands and marketplace selling are set to gain the most, though Java will still account for most sales. Halal-certified local brands with their own factories should take share from unlicensed imports. Skin care and masstige lines will lift average spend per shopper. However, a sharp fall in the rupiah or slower household spending would push more buyers back to economy packs.
Frequently Asked Questions
How big is the Indonesia beauty and personal care market?
Which region leads beauty and personal care sales in Indonesia?
Which region grows fastest?
When does halal certification become mandatory for cosmetics?
Which product type holds the largest share?
Which sales channel grows fastest?
Who are the leading beauty and personal care companies in Indonesia?
What are the main risks to growth?
Table of Content
Chapter 1 Market Segmentation
- 1.1 Segmentation Framework
- 1.1.1 Product and Service Classification
- 1.1.2 Application and End-Use Classification
- 1.1.3 Technology and Solution Classification
- 1.1.4 Customer and Distribution Channel Classification
- 1.1.5 Geographic Segmentation
- 1.1.6 Market Segment Definitions and Boundaries
- 1.2 By Product Type
- 1.2.1 Personal Care
- 1.2.2 Skin Care
- 1.2.3 Color Cosmetics
- 1.2.4 Fragrances
- 1.3 By Price Tier
- 1.3.1 Economy
- 1.3.2 Mass
- 1.3.3 Masstige
- 1.3.4 Premium
Chapter 2 Introduction
- 2.1 Report Objectives and Scope
- 2.2 Product Definition and Industry Terminology
- 2.3 Market Inclusions and Exclusions
- 2.4 Research Process
- 2.4.1 Primary Research and Expert Interviews
- 2.4.2 Secondary Research and Source Review
- 2.4.3 Top-Down and Bottom-Up Estimation
- 2.4.4 Data Triangulation and Verification
- 2.5 Market Size Measurement Basis
- 2.5.1 2025: USD 9.73 billion → 2035: USD 14.59 billion
- 2.6 Historical and Forecast Reference Periods
- 2.6.1 Historical Period: 2018-2025
- 2.6.2 Base Year: 2025
- 2.6.3 Forecast Period: 2025-2035
- 2.7 Research Assumptions and Limitations
Chapter 3 Executive Summary
- 3.1 Market Snapshot and Key Findings
- 3.2 Base-Year Market Size, 2025
- 3.3 Forecast Market Size, 2035
- 3.4 Revenue and Volume Growth Outlook
- 3.5 Key Demand and Supply Indicators
- 3.6 Leading Market Segments
- 3.7 Fastest-Growing Market Opportunities
- 3.8 Regional Performance Highlights
- 3.9 Technology and Industry Transformation
- 3.10 Competitive Landscape Summary
- 3.11 Analyst View and Strategic Implications
Chapter 4 Indonesia Beauty & Personal Care Market Trends and Developments
- 4.1 Historical Industry Development, 2018-2025
- 4.2 Recent Market Trends and Developments
- 4.3 Demand and Customer Behavior Trends
- 4.4 Technology and Product Innovation
- 4.5 Artificial Intelligence, Automation and Digitalization
- 4.6 Local Manufacturing and Supply Chain Realignment
- 4.7 Industry Partnerships, Mergers and Acquisitions
- 4.8 Sustainability and Circular Economy Developments
- 4.9 Government and Private Sector Investment Trends
- 4.10 Emerging Business Models and Commercialization
- 4.11 Industry Developments and Announcements
Chapter 5 Indonesia Beauty & Personal Care Market Production, Supply and Demand Analysis
- 5.1 Demand Trend and Consumption Analysis, 2018-2025
- 5.2 Demand Forecast, 2025-2035
- 5.3 Production and Output Trend, 2018-2025
- 5.4 Production and Output Forecast, 2025-2035
- 5.5 Installed Capacity and Capacity Utilization
- 5.6 Company-Wise Production Plants and Statistics
- 5.6.1 Installed Production Capacity
- 5.6.2 Actual Production
- 5.6.3 Planned Capacity and Expansion Targets
- 5.7 Supply Chain Structure and Procurement Trends
- 5.8 Supply-Demand Gap and Bottlenecks
- 5.9 Import Dependence and Sourcing Structure
- 5.10 Contract Manufacturing and Outsourcing
- 5.11 Regional Supply and Demand Concentration
Chapter 6 Indonesia Beauty & Personal Care Market Pricing Analysis
- 6.1 Pricing Structure and Measurement
- 6.2 Historical Pricing Trends, 2018-2025
- 6.3 Pricing Outlook, 2025-2035
- 6.4 Average Selling Price and Unit Economics
- 6.5 Pricing by Product and Market Segment
- 6.6 Geographic Pricing Differences
- 6.7 Key Input, Energy, Labor and Logistics Costs
- 6.8 Contract Pricing and Purchasing Models
- 6.9 Pricing Sensitivity and Competitive Positioning
- 6.10 Price, Margin and Profitability Implications
Chapter 7 Indonesia Beauty & Personal Care Market Dynamics
- 7.1 Market Growth Drivers
- 7.1.1 Demand-Side Drivers
- 7.1.2 Technology and Innovation Drivers
- 7.1.3 Infrastructure and Investment Drivers
- 7.1.4 Regulatory and Policy Drivers
- 7.2 Market Restraints
- 7.2.1 Cost and Affordability Constraints
- 7.2.2 Technology and Adoption Barriers
- 7.2.3 Supply Chain and Operational Constraints
- 7.3 Market Challenges
- 7.3.1 Competitive Pressure and Margin Erosion
- 7.3.2 Skills, Infrastructure and Implementation Gaps
- 7.4 Emerging Market Opportunities
- 7.5 Market Dynamics Impact and Time-Horizon Assessment
Chapter 8 Indonesia Beauty & Personal Care Value Chain Analysis
- 8.1 Industry Value Chain Overview
- 8.2 Upstream Suppliers and Critical Inputs
- 8.3 Technology and Component Providers
- 8.4 Manufacturing or Service Delivery
- 8.5 Distribution, Channel Partners and Integrators
- 8.6 Downstream Applications and End Users
- 8.7 Value Addition and Profit Pools
- 8.8 Vertical Integration and Outsourcing
- 8.9 Supplier Concentration and Risk
- 8.10 Supply Chain Localization and Resilience
Chapter 9 Indonesia Beauty & Personal Care Market Regulations and Policies
- 9.1 Relevant Laws, Standards and Compliance Frameworks
- 9.2 Product, Service, Safety and Quality Requirements
- 9.3 Government Policies, Incentives and Subsidies
- 9.4 Imports, Exports and Trade Barriers
- 9.5 Public Procurement and Local Content Requirements
- 9.6 Environmental and Sustainability Compliance
- 9.7 Upcoming Policy Changes and Market Implications
Chapter 10 Indonesia Beauty & Personal Care Market Hotspots and Opportunities
- 10.1 Market Opportunity Mapping and Growth Hotspots
- 10.2 High-Growth Applications and Customer Groups
- 10.3 Underserved Markets and White-Space Opportunities
- 10.4 Emerging Technology and Product Opportunities
- 10.5 New Capacity and Investment Hotspots
- 10.6 Market Entry and Expansion Opportunities
- 10.7 Distribution and Partnership Opportunities
- 10.8 Near-Term and Long-Term Commercial Potential
- 10.9 Opportunity Attractiveness and Execution Risks
Chapter 11 Indonesia Beauty & Personal Care Market Outlook, 2025-2035
- 11.1 Market Size and Analysis
- 11.1.1 Revenue (Market Measurement: 2025: USD 9.73 billion → 2035: USD 14.59 billion)
- 11.1.2 Market Volume and Quantity Sold
- 11.1.3 Historical Market Size, 2018-2025
- 11.1.4 Base-Year Market Size, 2025
- 11.2 Market Forecast, 2025-2035
- 11.2.1 Revenue Forecast to 2035
- 11.2.2 Volume Forecast to 2035
- 11.2.3 CAGR and Year-on-Year Growth
- 11.2.4 Incremental Revenue Opportunity
- 11.3 Forecast Assumptions and Scenario Analysis
- 11.3.1 Base-Case Forecast
- 11.3.2 Optimistic and Conservative Scenarios
- 11.3.3 Technology, Pricing and Policy Sensitivities
- 11.4 Market Attractiveness and Growth Outlook
Chapter 12 Indonesia Beauty & Personal Care Market Segmentation and Outlook
- 12.1 Segmentation Summary and Market Shares, 2025
- 12.2 Largest and Fastest-Growing Segments
- 12.3 By Product Type - Market Size and Forecast, 2025-2035
- 12.3.1 Segment Definition and Scope
- 12.3.2 Historical Market Size, 2018-2025
- 12.3.3 Revenue Forecast, 2025-2035
- 12.3.4 Volume Forecast, 2025-2035
- 12.3.5 Base-Year Market Share, 2025
- 12.3.6 Segment CAGR and Growth Drivers
- 12.3.7 Subsegment Market Size and Forecast
- 12.3.7.1 Personal Care
- 12.3.7.2 Skin Care
- 12.3.7.3 Color Cosmetics
- 12.3.7.4 Fragrances
- 12.3.8 Subsegment Pricing and Adoption Trends
- 12.3.9 Leading Suppliers and Competition
- 12.3.10 Regional Demand and Opportunities
- 12.4 By Price Tier - Market Size and Forecast, 2025-2035
- 12.4.1 Segment Definition and Scope
- 12.4.2 Historical Market Size, 2018-2025
- 12.4.3 Revenue Forecast, 2025-2035
- 12.4.4 Volume Forecast, 2025-2035
- 12.4.5 Base-Year Market Share, 2025
- 12.4.6 Segment CAGR and Growth Drivers
- 12.4.7 Subsegment Market Size and Forecast
- 12.4.7.1 Economy
- 12.4.7.2 Mass
- 12.4.7.3 Masstige
- 12.4.7.4 Premium
- 12.4.8 Subsegment Pricing and Adoption Trends
- 12.4.9 Leading Suppliers and Competition
- 12.4.10 Regional Demand and Opportunities
- 12.5 Segment Growth Comparison
- 12.6 Segment Attractiveness and Priority Matrix
Chapter 13 Indonesia Beauty & Personal Care Geographic Market Outlook, 2025-2035
- 13.1 Domestic Market Distribution and Demand Clusters
- 13.2 State- or Province-Wise Market Size and Forecast, 2025-2035
- 13.3 City and Metropolitan Market Outlook
- 13.4 Industrial, Manufacturing and Commercial Clusters
- 13.5 Geographic Concentration of Key End Users
- 13.6 Local Pricing and Purchasing Differences
- 13.7 Domestic Production Facilities and Capacity Map
- 13.8 Local Infrastructure and Project Pipeline
- 13.9 State-Level Policy and Incentive Differences
- 13.10 Subnational Investment Hotspots and Opportunities
- 13.11 Distribution and Logistics Networks
- 13.12 Domestic Competitive Footprint
Chapter 14 Indonesia Beauty & Personal Care Technology, Innovation and Sustainability Outlook
- 14.1 Technology Landscape and Maturity
- 14.2 Product, Process and Service Innovation
- 14.3 AI, Automation and Digital Tools in the Industry
- 14.4 Technology Adoption and Performance Benchmarking
- 14.5 Innovation Pipeline and R&D Investment
- 14.6 Patent and Intellectual Property Trends
- 14.7 Energy Efficiency and Resource Management
- 14.8 Sustainability, Recycling and Circularity
- 14.9 Technology Roadmap, 2025-2035
- 14.10 Risks of Obsolescence and Technology Substitution
Chapter 15 Indonesia Beauty & Personal Care Market Key Strategic Imperatives
- 15.1 Growth and Market Entry Priorities
- 15.2 High-Return Products and Segments
- 15.3 Pricing, Profitability and Cost Optimization
- 15.4 Technology Investment and Product Differentiation
- 15.5 Supply Chain Localization and Resilience
- 15.6 Distribution and Customer Acquisition
- 15.7 Partnership, Acquisition and Capacity Strategy
- 15.8 Regional Expansion Priorities
- 15.9 Short-, Medium- and Long-Term Actions
Chapter 16 Competition Outlook
- 16.1 Industry Competition Characteristics
- 16.2 Market Structure and Concentration
- 16.3 Market Share and Competitive Positioning, 2025
- 16.4 Company-Wise Revenue and Product Benchmarking
- 16.5 Production and Service Capacity Benchmarking
- 16.6 Technology, Pricing and Differentiation
- 16.7 Regional Footprint and Distribution Strength
- 16.8 Mergers, Acquisitions and Strategic Alliances
- 16.9 New Entrants and Competitive Threats
- 16.10 Porter's Five Forces and Industry Attractiveness
- 16.11 Competitive Outlook, 2025-2035
Chapter 17 Company Profiles
- 17.1 Company Coverage and Selection Criteria
- 17.2 PT Paragon Technology and Innovation
- 17.2.1 Business Description
- 17.2.2 Company Ownership and Geographic Presence
- 17.2.3 Product and Service Portfolio
- 17.2.4 Manufacturing and Operating Footprint
- 17.2.5 Production Capacity and Expansion Plans
- 17.2.6 Financial Performance and Investment
- 17.2.7 Market Share and Competitive Position
- 17.2.8 Technology and Innovation Capabilities
- 17.2.9 Strategic Alliances or Partnerships
- 17.2.10 Recent Developments
- 17.2.11 Growth Strategy and Outlook
- 17.3 PT Unilever Indonesia Tbk
- 17.4 L’Oréal Indonesia
- 17.5 PT Martina Berto Tbk
- 17.6 PT Kao Indonesia
- 17.7 PT Mandom Indonesia Tbk
- 17.8 PT Kino Indonesia Tbk
- 17.9 PT Lion Wings
- 17.10 PT Beauty Haul Indonesia
- 17.11 PT Victoria Care Indonesia Tbk
- 17.12 Other Relevant Market Participants
Note: Every listed company is profiled on the structure shown under the first company. The company list is preliminary and may change based on research findings, market developments, data availability and client requirements.
Chapter 18 Disclaimer
- 18.1 Research and Forecast Disclaimer
- 18.2 Data Source and Estimation Limitations
Note: The depth of individual sections depends on data availability for this market. Volume, capacity, trade and other unit-based metrics are included where applicable.

