
Renovation and household upgrading carry furniture demand
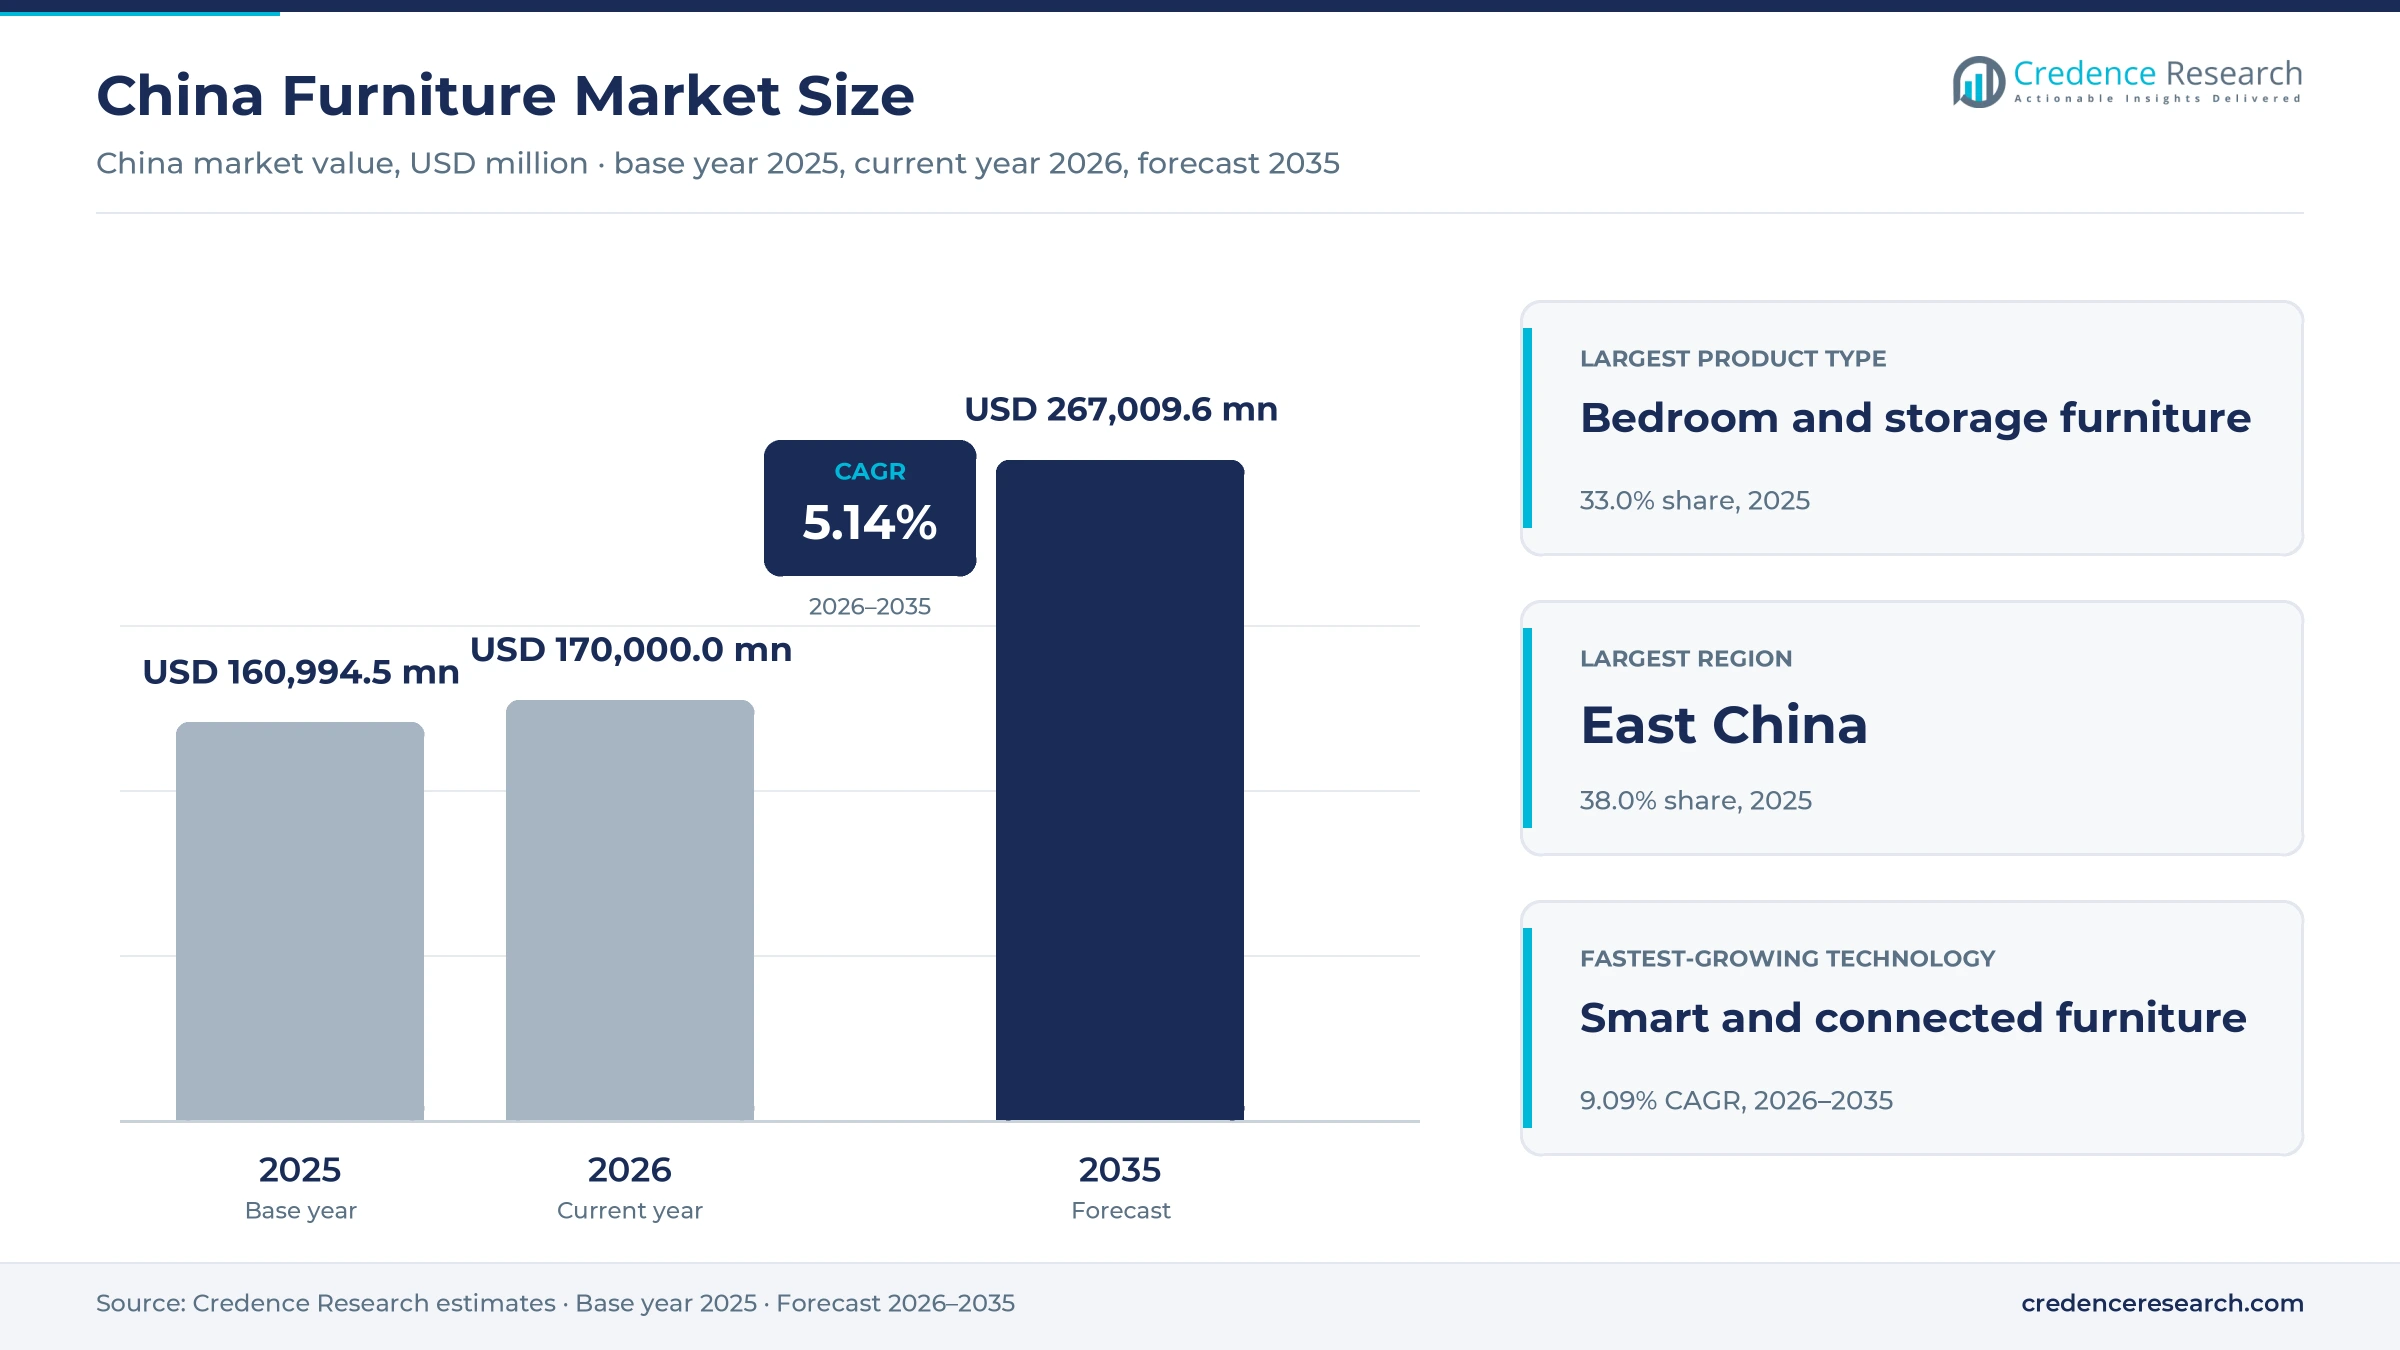
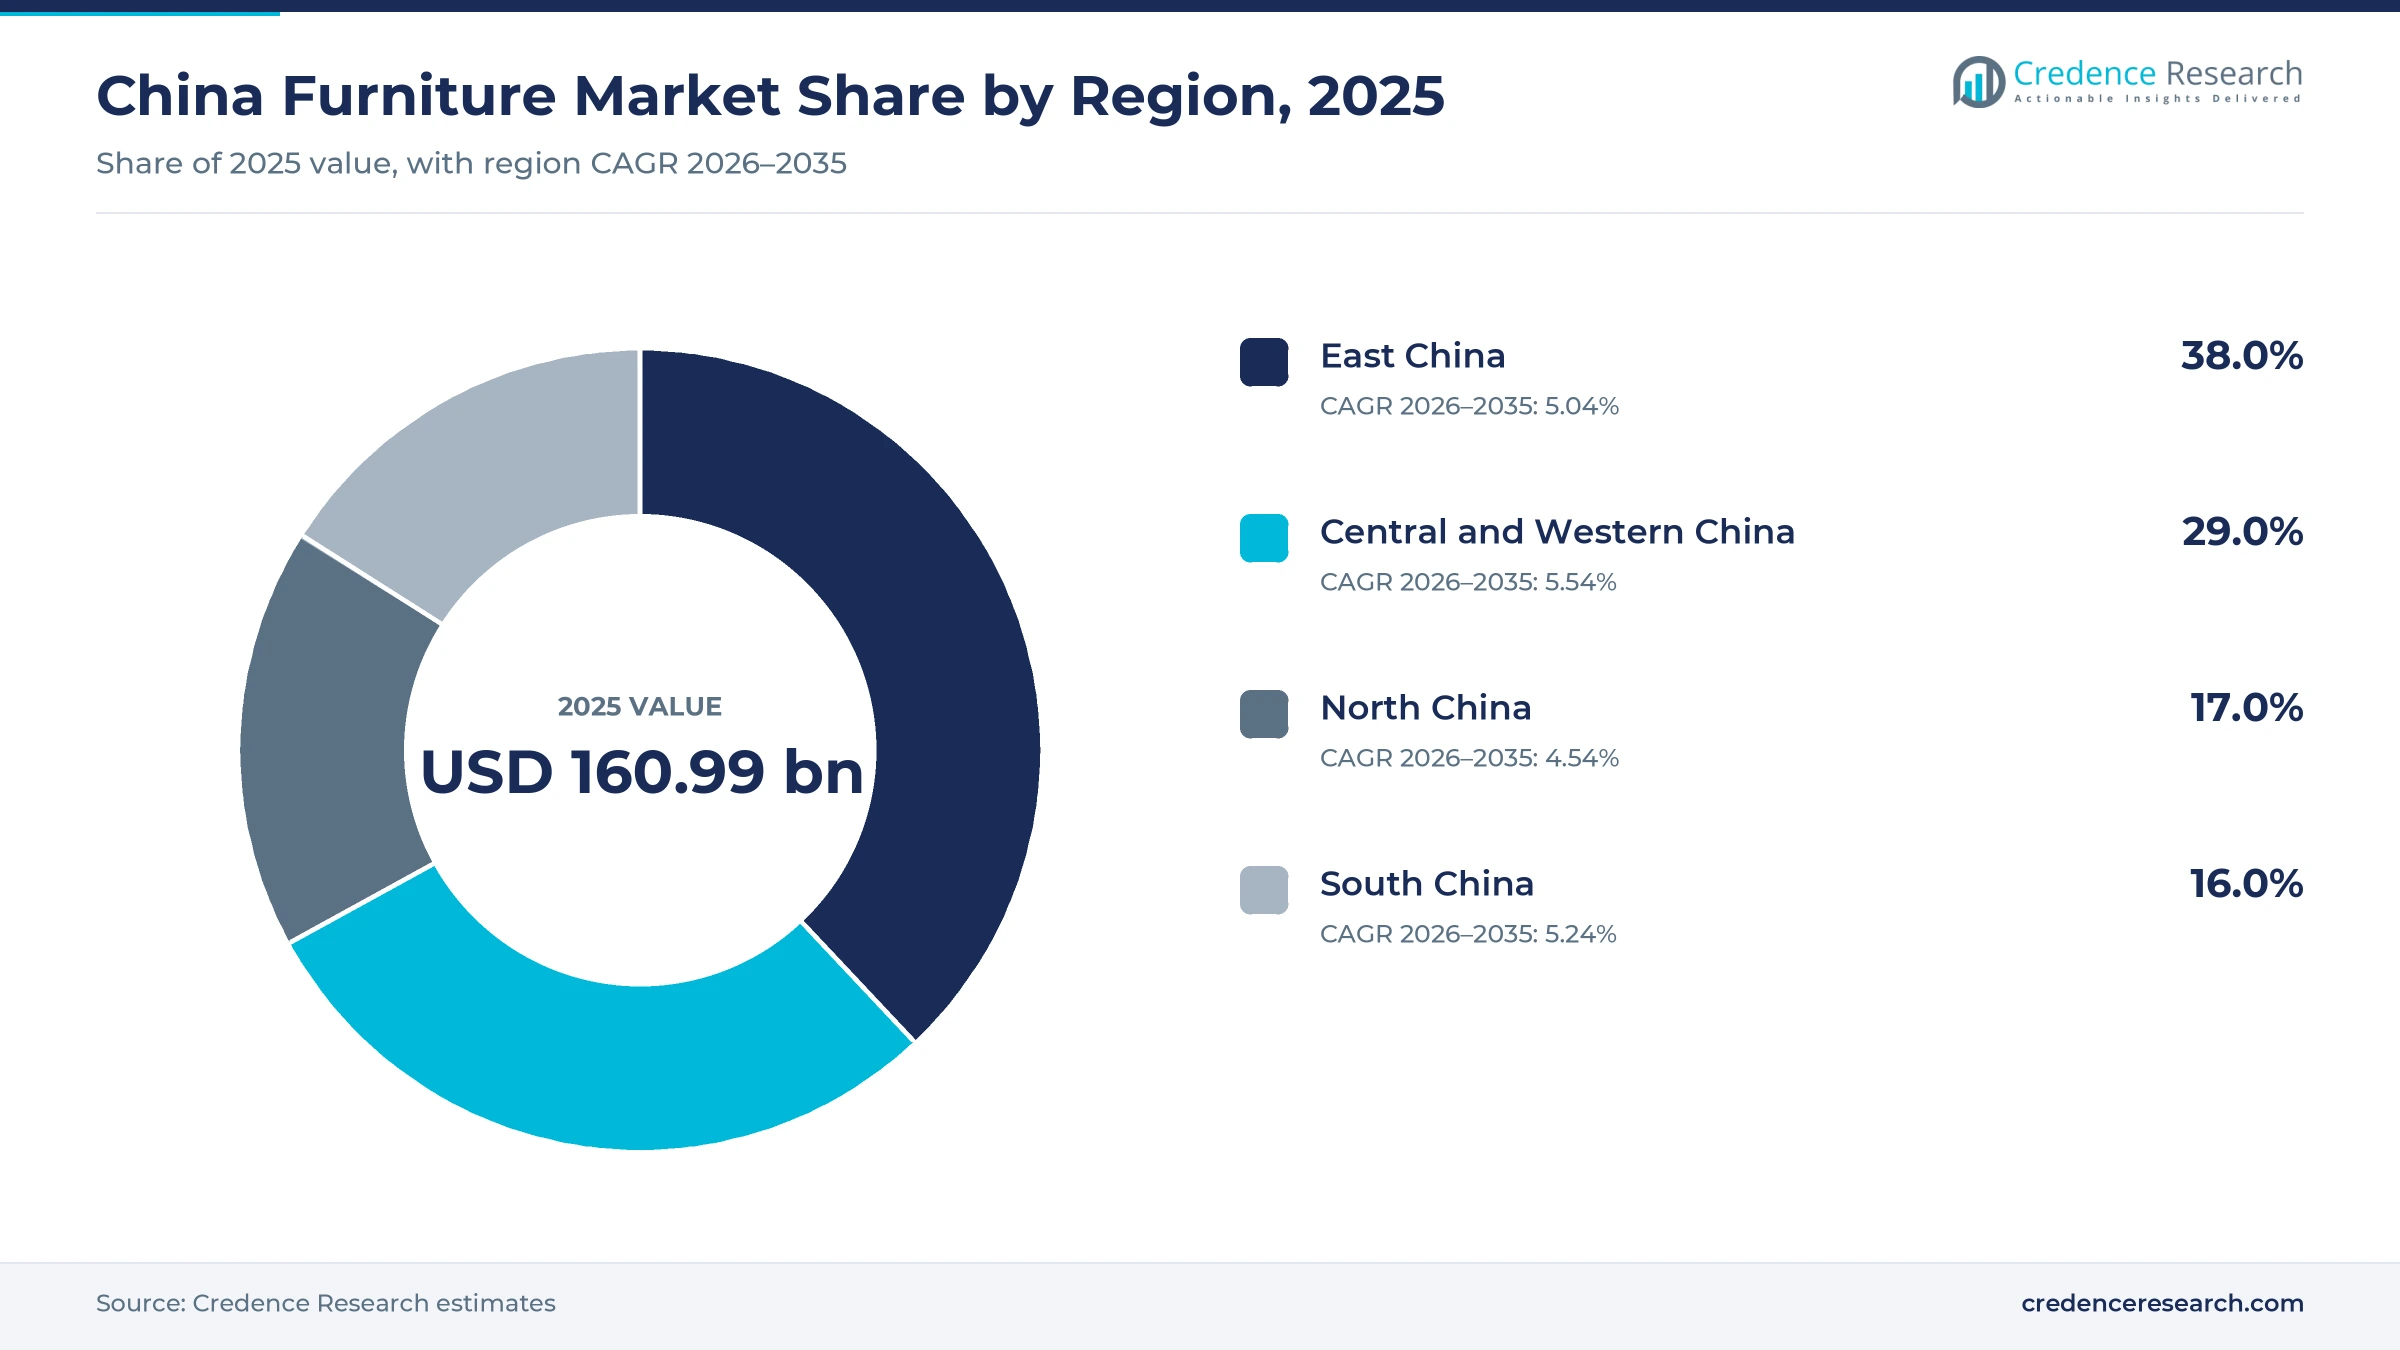
The China furniture market was valued at USD 160.99 billion in 2025 and is projected to increase from USD 170.00 billion in 2026 to USD 267.01 billion by 2035, registering a CAGR of 5.14% during 2026–2035. Demand comes from households replacing worn pieces, owners renovating older homes, developers fitting new units and companies, hotels and institutions buying contract furniture. East China held the largest regional share, 38.0% in 2025, because the Yangtze River Delta combines high incomes, dense cities and a large base of furniture makers. Central and Western China is the fastest-growing region at 5.54% a year, as inland urbanization and rising incomes widen the buyer base. In turn, national trade-in subsidies lifted furniture sales sharply in 2025, while digital design tools are moving buyers toward customized whole-home packages rather than single pieces.
Which furniture and buyers are counted in the estimate?
The estimate measures spending in China on seating and upholstered pieces, bedroom and storage units, kitchen and dining furniture, and office and contract furniture, sold as finished or customized products. It covers purchases by households, property developers, interior contractors, companies, institutions and hospitality operators. Values are stated in USD million at current prices and include sales through brand stores, furniture malls, online platforms and direct projects.
The estimate excludes mattresses sold without frames, home textiles, lighting, flooring, built-in appliances and furniture made for export. The value chain runs from panel, timber and hardware suppliers through factories and customization plants to dealers, platforms and installers that deliver to homes and buildings in every province.
China Furniture Market Insights
- The China furniture market was valued at USD 160.99 billion in 2025 and is projected to reach USD 267.01 billion by 2035, at a 5.14% CAGR during 2026–2035.
- East China held a 38.0% share of 2025 value, because the Yangtze River Delta combines high incomes, dense cities and furniture making.
- Bedroom and storage furniture led product types with a 33.0% share of 2025 value, as customized wardrobes anchor most renovation projects.
- Retail sales of furniture by larger enterprises rose 14.6% in 2025 under trade-in subsidies, before easing in 2026 as support shifted to other goods.
- Smart and connected furniture grows fastest among technologies at 9.09% a year during 2026–2035, as sensor-equipped sofas and beds spread.
Bedroom storage leads while smart pieces gain fastest
Why do bedroom and storage pieces lead spending?
Based on product type, the market is categorized into seating and upholstered furniture, bedroom and storage furniture, kitchen and dining furniture, and office and contract furniture. Bedroom and Storage Furniture led with a 33.0% share of 2025 value, because customized wardrobes and beds anchor most home renovation budgets. Seating and Upholstered Furniture grows fastest at 5.42% a year, as motorized sofas and recliners win urban buyers.
How much spending comes from homes?
Based on application, the market is categorized into residential interiors, corporate workspaces, hospitality and leisure, and healthcare and education facilities. Residential Interiors led with a 72.0% share of 2025 value, because households buy most furniture during moves, renovations and replacements. Healthcare and Education Facilities grow fastest at 6.32% a year, as elderly care and campus projects expand.
How fast are smart and custom pieces gaining?
Based on technology, the market is categorized into conventional fixed furniture, modular and ready-to-assemble furniture, smart and connected furniture, and digitally customized furniture. Conventional Fixed Furniture led with a 46.0% share of 2025 value, because most sofas, tables and beds still ship as standard pieces. Smart and Connected Furniture grows fastest at 9.09% a year as sensors and motors enter living rooms.
Are buyers leaving furniture malls for online stores?
Based on distribution channel, the market is categorized into brand-owned stores, furniture malls and dealers, e-commerce platforms and direct project sales. Furniture Malls and Dealers led with a 35.0% share of 2025 value, because buyers still want to see and test large pieces. E-Commerce Platforms grow fastest at 6.77% a year as online design and delivery improve.
| Segment Group | Leading Sub-segment | Share, 2025 | Fastest-growing Sub-segment | CAGR, 2026–2035 |
|---|---|---|---|---|
| By Product Type | Bedroom and Storage Furniture | 33.0% | Seating and Upholstered Furniture | 5.42% |
| By Application | Residential Interiors | 72.0% | Healthcare and Education Facilities | 6.32% |
| By Technology | Conventional Fixed Furniture | 46.0% | Smart and Connected Furniture | 9.09% |
| By Distribution Channel | Furniture Malls and Dealers | 35.0% | E-Commerce Platforms | 6.77% |
Request a Free Sample
Fill in your details and we'll send you a free sample report.
- Sample data tables & charts
- Research methodology
Trade-in support, urban incomes and new channels lift sales
How did replacement and renovation support lift sales?
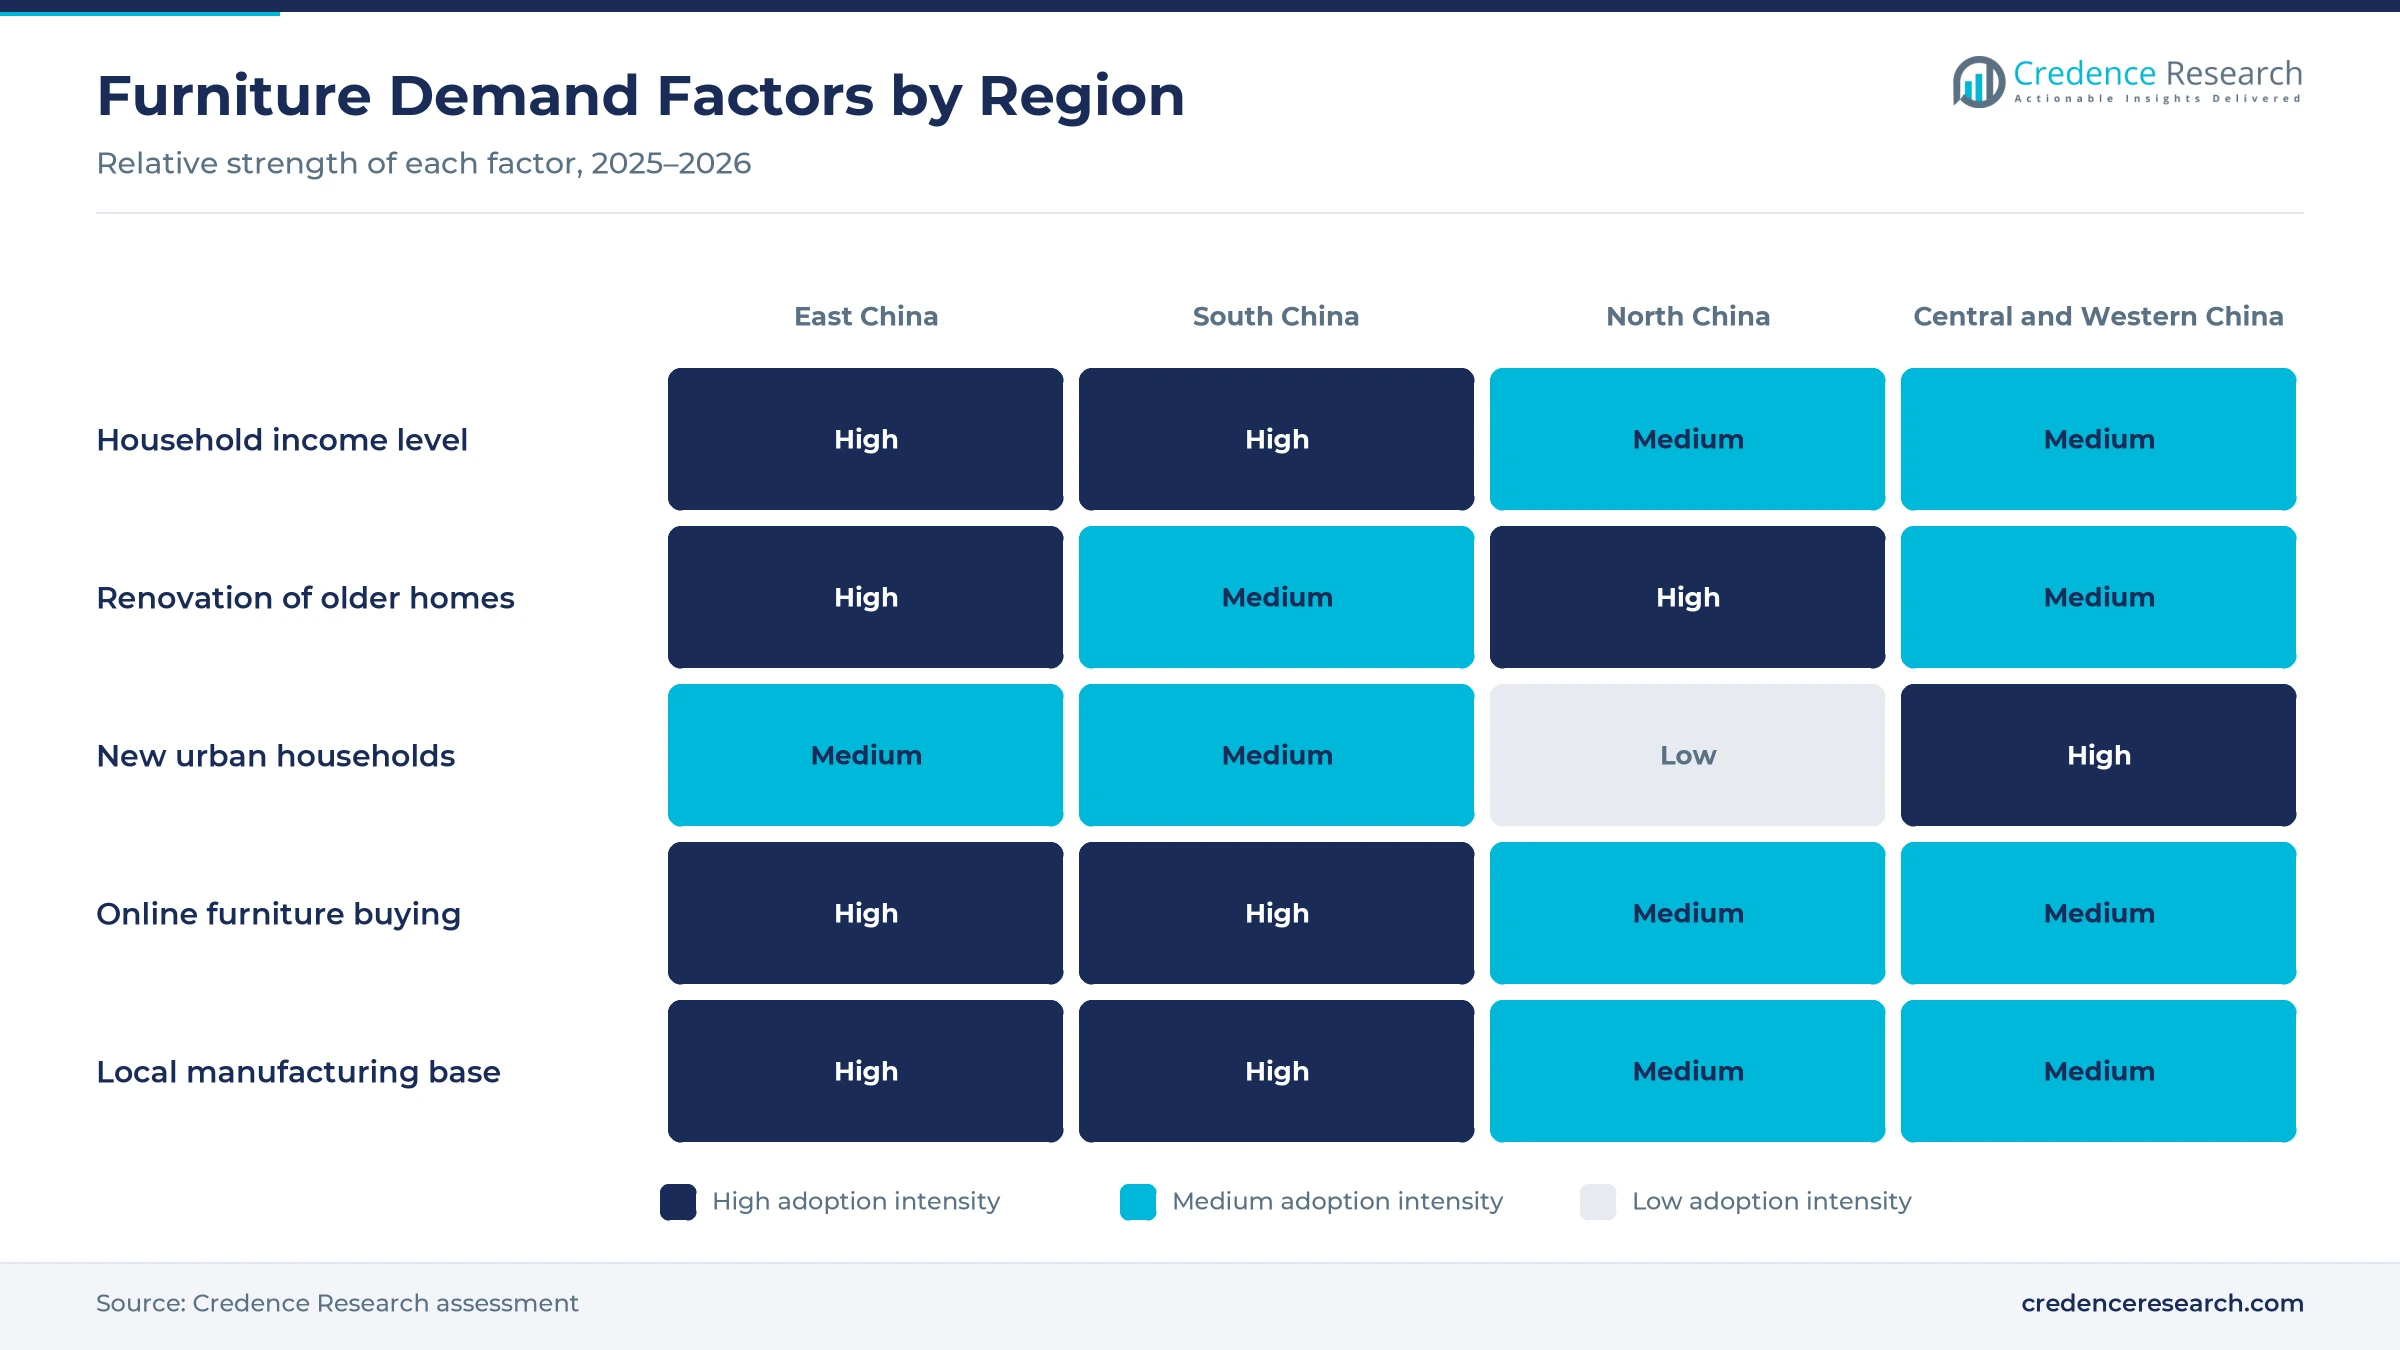
Replacement and renovation support lifted sales, because subsidies pulled forward purchases that households had delayed during the property slowdown. Trade-in programs benefited 366 million purchases in 2025 and supported sales worth 2.61 trillion yuan, according to a commerce ministry briefing. Retail sales of furniture by enterprises above designated size rose 14.6% in 2025, according to the national statistics communique. Monthly growth reached 25.6% in May 2025 at the peak of local subsidy spending. Work also started on 27 thousand old urban residential compounds in 2025, benefiting 4.99 million households. As a result, bedroom and storage furniture held a 33.0% share of 2025 value.
Why does urban household upgrading sustain demand?
Urban household upgrading sustains demand, because city families replace basic pieces with larger, better-made furniture as incomes rise. The urbanization rate of permanent residents reached 67.89% at the end of 2025, up 0.89 percentage points in a year. Per capita disposable income of urban households reached 56,502 yuan in 2025, up 4.3%, and rose a further 4.5% in the first three quarters of 2026. Spending on household facilities, articles and services reached 1,281 yuan per person in those three quarters, up 4.7%. Consequently, residential interiors held a 72.0% share of 2025 value, and spending on wider home furnishings rises with it.
How do omnichannel selling and product mix raise value?
Omnichannel selling and a richer product mix raise value, because buyers now design rooms online and finish the purchase in a store or at home. Online retail sales of physical goods reached 26.1% of total retail sales in 2025, which pulls furniture brands onto platforms. IKEA launched a flagship store on JD and plans about ten smaller urban stores over two years, according to national press reports. OPPEIN said in April 2026 that its AI design platform completes a design and quotation in about 30 minutes, according to a company release. In turn, e-commerce platforms grow fastest among channels at 6.77% a year.
Why does an aging population add new furniture needs?
An aging population adds new furniture needs, because older residents want beds, chairs and storage that are easier to use. People aged 60 and above numbered 323.38 million at the end of 2025, or 23.0% of the population. Shanghai continued its trade-in program in January 2025 with home furnishings and seniors-friendly products among eligible categories, according to the city government. The national 2026 program also expanded to smart home products, including elder-friendly home products. As a result, healthcare and education facilities grow fastest among applications at 6.32% a year, led by elderly care and assisted living projects.
Custom whole-home design and smart seating reshape buying
Why is digitally customized whole-home design rising?
Digitally customized whole-home design is rising, because buyers want wardrobes, cabinets and storage built to the exact size of each room. OPPEIN completed its intelligent manufacturing project in April 2026, with five production bases covering more than 3 million square meters and capacity for 25,000 cabinets a day. Its domestic orders now reach customers in about seven days, and it passed 50 million orders in early 2025. Each panel carries a QR code that tells factory machines how to cut and drill it. Consequently, custom plants in East China and South China win renovation orders that standard pieces cannot fit, and digitally customized furniture gains share from conventional products across most large cities.
How fast is smart seating and sleep furniture spreading?
Smart seating and sleep furniture is spreading quickly, because sensors and motors turn sofas and beds into comfort and health devices. KUKA Home introduced a Hertz S9 smart sofa and a Lunar Aura M8 Plus smart mattress at a Hangzhou event on March 19, 2026, both controlled through a mini program. Sleemon unveiled its aise smart mattress series in 2024, which received the highest L4 certification for smart mattresses in China. The national 2026 trade-in program also covers smart home products for households. In turn, smart and connected furniture grows fastest among technologies at 9.09% a year, alongside wider demand for sensor-equipped sofas and beds.
Can small urban stores open a clear retail opening?
Small urban stores open a clear retail opening, because buyers in dense cities will not travel to distant big-box sites for every purchase. IKEA began closing seven large stores in China from Feb. 2, 2026, including Shanghai Baoshan, Guangzhou Panyu, Tianjin and Harbin. It scheduled a smaller Dongguan store for February 2026 and a Tongzhou store in Beijing for April. Furniture malls and dealers still led channels with a 35.0% share of 2025 value, so compact formats can win share from them. As a result, brands that pair small showrooms with online design and fast delivery gain city buyers, including for ready-to-assemble pieces.
Where do inland provinces create a furniture opening?
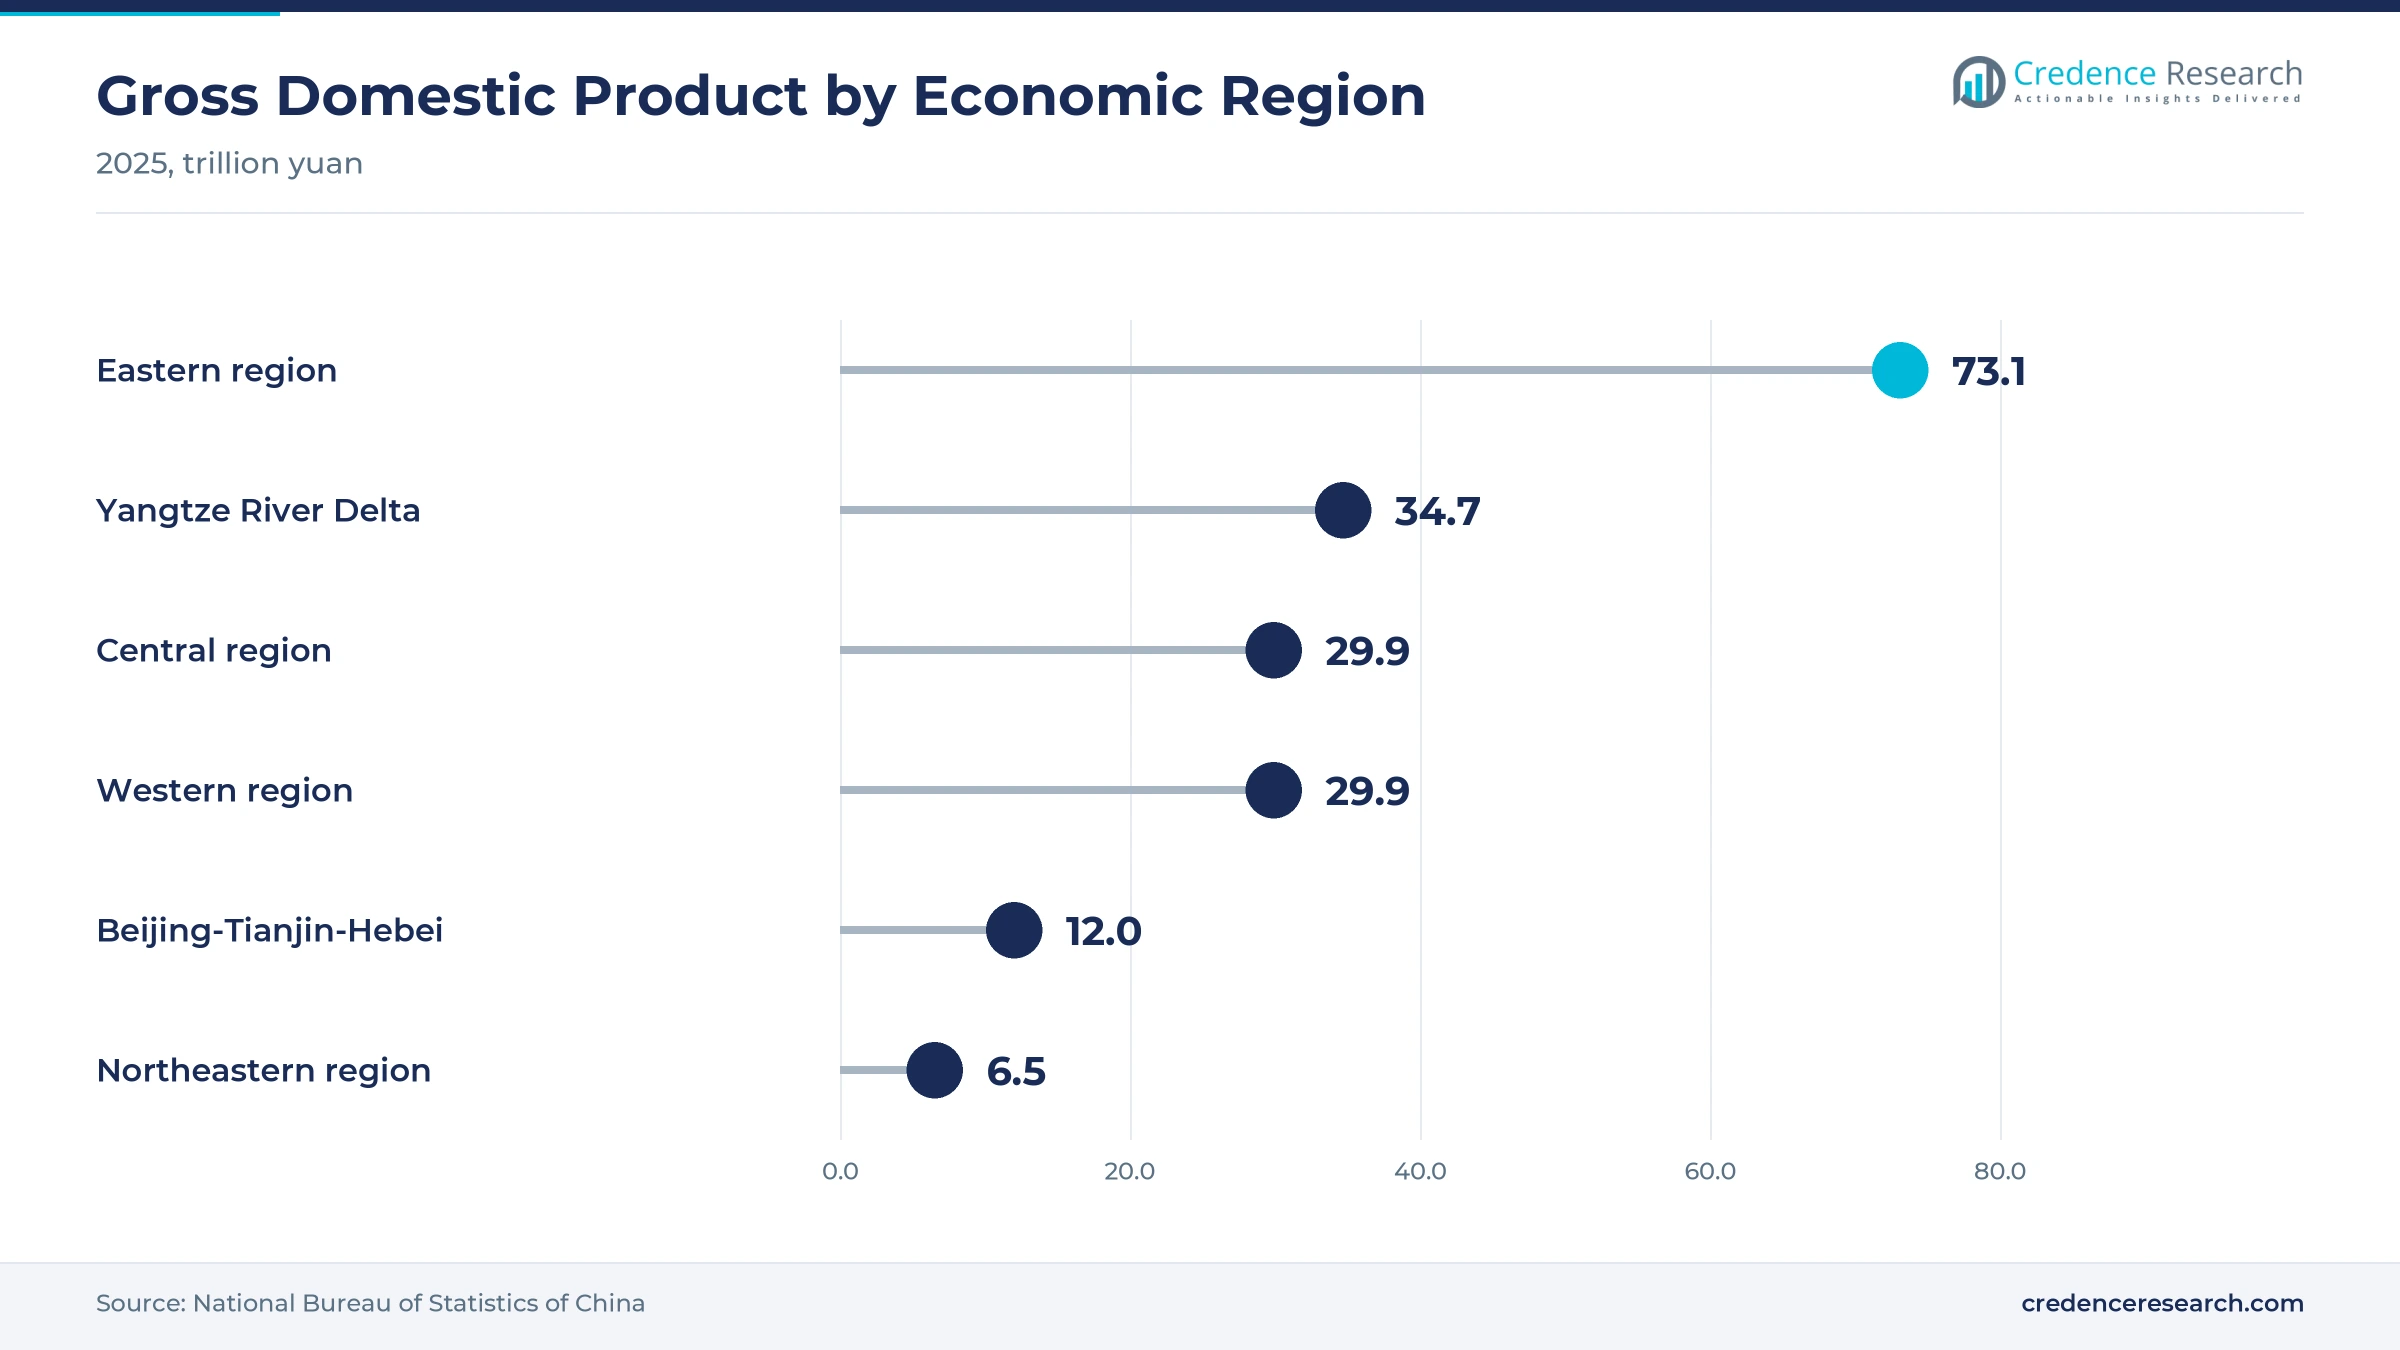
Inland provinces create a clear opening, because faster economic growth and later urbanization leave many homes still to furnish. The central region produced 29,910.8 billion yuan of output in 2025, up 5.2%, and the western region 29,875.0 billion yuan, up 5.1%, both faster than the eastern region. Provinces such as Sichuan, Henan and Hubei each produced more than 6 trillion yuan of output in 2025, which creates large new consumer bases. IKEA is also moving toward smaller, cheaper store formats that suit cities without room for a large warehouse site. Consequently, brands that extend dealer networks into these provinces gain first-time buyers furnishing new homes.
Property slump, subsidy fade and exports weigh on makers
How does the property slump reduce new-home demand?
The property slump reduces new-home demand, because fewer completed homes mean fewer full fit-outs. Investment in real estate development fell 20.6% in the first nine months of 2026, and residential floor space sold fell 13.8%. As a result, developers order less furniture for finished units and households delay moves. Makers respond by focusing on renovation, replacement and resale homes, where buyers still upgrade rooms without buying a new apartment.
Why could fading subsidies slow 2026 sales?
Fading subsidies could slow sales, because 2025 trade-in support pulled forward purchases that would otherwise have come later. Retail sales of furniture by larger enterprises fell 4.7% in the first nine months of 2026, after a 14.6% rise in 2025. The 2026 program allocated 62.5 billion yuan in advance, focused on vehicles, appliances and digital products. Brands respond with their own discounts, renovation bundles and financing to keep demand moving.
What pressure do export markets place on makers?
Export markets place pressure on makers, because exports of furniture and parts fell 5.6% in 2025. The United States imposed 25% tariffs on upholstered wooden furniture and kitchen cabinets from Oct. 14, 2025, with increases delayed to Jan. 1, 2027. In turn, factories redirect capacity to the home market, which intensifies price competition. Makers respond by moving up to branded, customized products where margins are less exposed.
Can furniture malls adapt to changing shopping habits?
Furniture malls struggle to adapt to changing shopping habits, because younger buyers research and often buy online before visiting a store. Large stores also carry high rent and staffing costs when traffic falls. Consequently, some operators close big sites and dealers lose foot traffic. Mall owners respond by adding design studios, renovation services and live-streaming sales so that visits turn into orders.
East China leads while inland provinces gain fastest
| Region | Value, 2025 (USD billion) | Share, 2025 | CAGR, 2026–2035 |
|---|---|---|---|
| East China | 61.18 | 38.0% | 5.04% |
| Central and Western China | 46.69 | 29.0% | 5.54% |
| North China | 27.37 | 17.0% | 4.54% |
| South China | 25.76 | 16.0% | 5.24% |
High incomes and dense cities keep East China ahead
East China held a 38.0% share of 2025 value and grows at 5.04% a year. The Yangtze River Delta produced 34,659.5 billion yuan of output in 2025, up 5.4%, and Jiangsu and Zhejiang rank among the largest provincial economies. Shanghai kept home furnishings in its 2025 trade-in program, which supported city sales. However, IKEA closures in Shanghai Baoshan, Nantong, Xuzhou and Ningbo show buyers moving from big stores toward online and smaller formats.
Manufacturing scale supports South China
South China held a 16.0% share of 2025 value and grows at 5.24% a year. Guangdong was the largest provincial economy in 2025 at 14.58 trillion yuan, and it hosts dense furniture clusters around Foshan, Dongguan and Guangzhou. OPPEIN, based in Guangzhou, runs custom plants that deliver domestic orders in about seven days. In turn, IKEA chose Dongguan for one of its first smaller China stores in February 2026.
Capital region projects anchor North China
North China held a 17.0% share of 2025 value and grows at 4.54% a year. The Beijing-Tianjin-Hebei region produced 11,991.8 billion yuan of output in 2025, up 5.4%, while the northeastern provinces grew a slower 4.1%. Office, campus and hospital projects around the capital lift demand for workplace seating and desks. However, IKEA closures in Tianjin and Harbin show weaker store traffic in older northern cities.
Why does central and Western China grow fastest?
Central and Western China held a 29.0% share of 2025 value and grows fastest at 5.54% a year. Both the central and western regions grew faster than the east in 2025, and inland provinces now rank among the largest regional economies in the country. Many households there are still furnishing first homes after moving to cities. As a result, dealer networks and online platforms add buyers faster here than in coastal regions.
Subsidies, store changes and smart launches, 2025–2026
| Development | Status and market relevance |
|---|---|
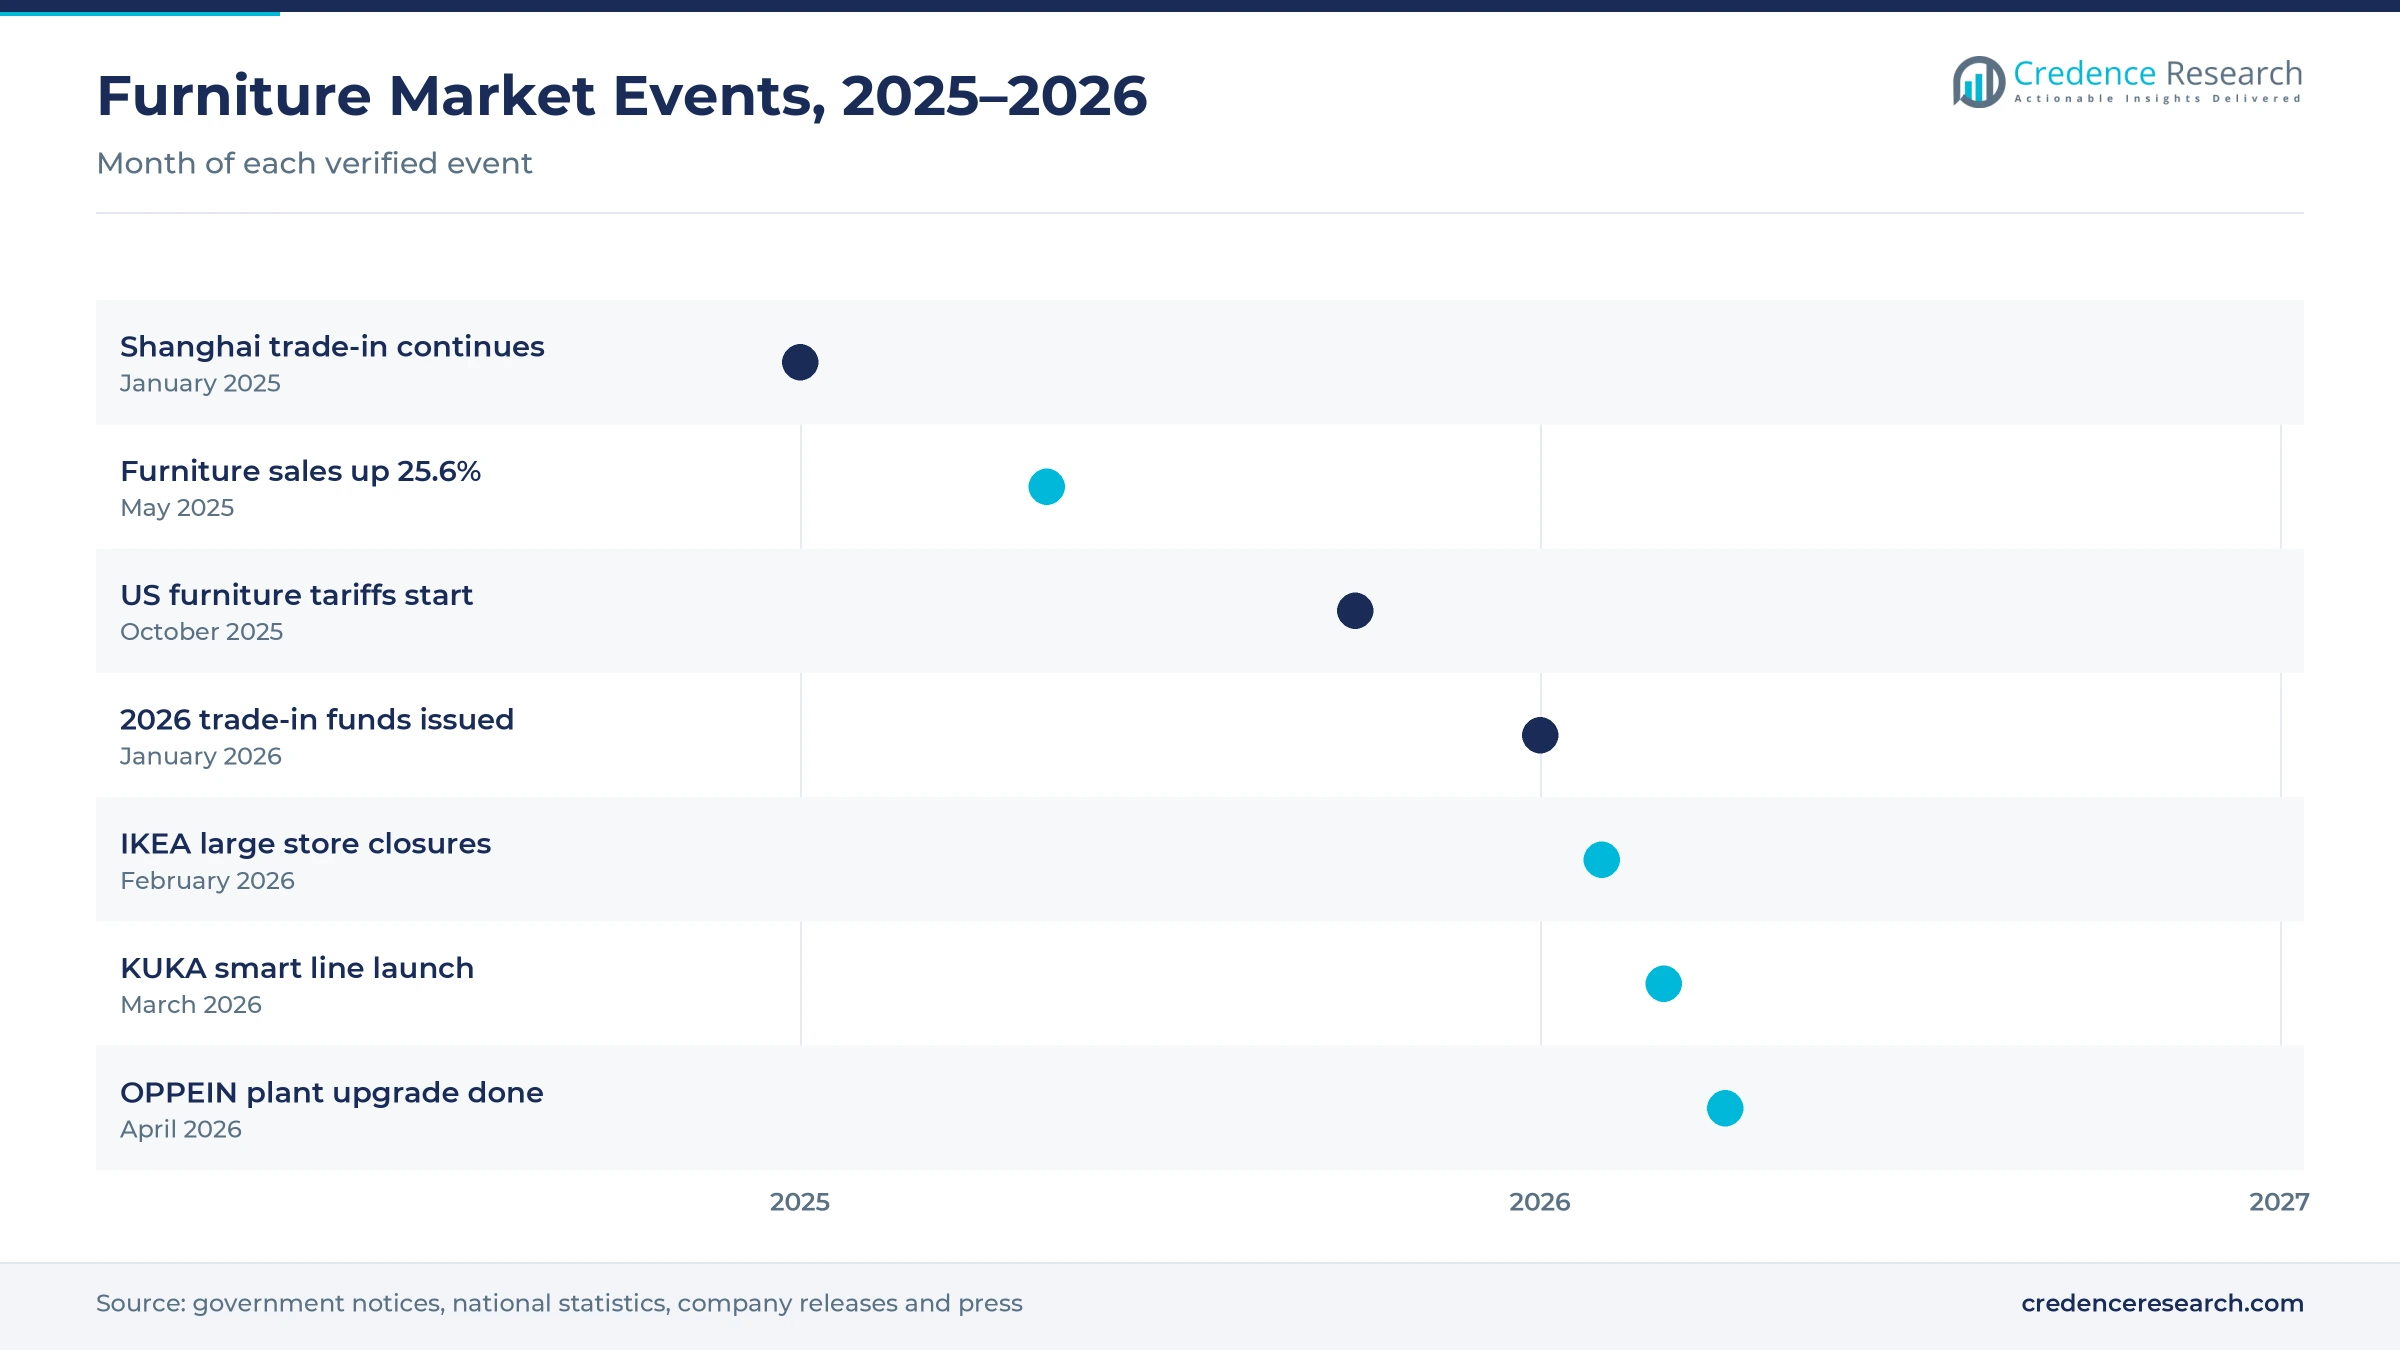
| In January 2025, Shanghai announced its trade-in program would continue with home furnishings and seniors-friendly products eligible. | Supported 2025 furniture sales |
| In October 2025, the United States introduced 25% tariffs on upholstered wooden furniture and kitchen cabinets. | Pushes export capacity toward the home market |
| In February 2026, IKEA began closing seven large China stores while opening smaller urban formats. | Signals shift away from big-box retail |
| In March 2026, KUKA Home unveiled a smart sofa, smart mattress and smart recliner line in Hangzhou. | Expands smart seating and sleep choice |
| In April 2026, OPPEIN announced completion of its intelligent manufacturing project across five bases. | Speeds customized whole-home delivery |
Fixed, modular, smart and custom pieces compete
- Conventional fixed furniture still covers most sofas, tables and beds, because standard designs ship fast and suit buyers replacing single pieces.
- Modular and ready-to-assemble furniture packs flat and ships cheaply, which suits renters and young buyers in smaller city apartments.
- Smart and connected furniture adds motors, sensors and app control to sofas and beds, which raises the price of each piece sold.
- Digitally customized furniture turns room measurements into factory instructions, so wardrobes and cabinets fit each home exactly.
Need a Custom Version of This Report?
Tailor the scope, geography, or segments to your exact requirements.
- Custom geography or segment scope
- Direct access to our analyst team
Custom specialists and sofa brands compete on design
Competition runs between custom whole-home specialists, upholstery and sleep brands, and international retailers. OPPEIN, founded in Guangzhou in 1994, completed an intelligent manufacturing project in April 2026 with five bases and capacity for 25,000 cabinets a day. KUKA Home, based in Hangzhou, launched a smart sofa and mattress line in March 2026 and runs 16 manufacturing bases worldwide. Sleemon, founded in 1984 and the first Chinese mattress maker to list, works with BrainCo on an AI mattress. IKEA is closing seven large stores and opening smaller city formats alongside a JD flagship. Companies compete on design software, delivery speed, dealer reach and product features rather than on price alone, while high-end home pieces form a separate premium tier.
Which suppliers have verified activity in China this year?
| Company | Type | Role in the market |
|---|---|---|
| OPPEIN Home Group Inc. | Custom whole-home maker | Intelligent manufacturing project completed in April 2026 |
| KUKA Home | Upholstery and smart furniture brand | Smart sofa and mattress line launched in Hangzhou, March 2026 |
| Sleemon Co., Ltd. | Sleep products brand | aise smart mattress series with L4 certification |
| IKEA | International retailer | Seven large stores closing from February 2026, smaller formats opening |
Credence Research sees upgrading outlast the subsidy
Credence Research's view is that China furniture spending will keep rising through 2035, because renovation, replacement and household upgrading outlast the end of trade-in subsidies. Bedroom and storage furniture should keep the largest share, while smart pieces and online channels add value fastest. East China will stay the largest region, although Central and Western China gains share as inland cities grow. However, the property slump, export pressure and weaker 2026 sales will reward brands with design software, fast delivery and strong dealer networks.
Household spending and project demand anchor the model
The report uses 2025 as the base year, with values in USD million at current prices. Market values come from the Credence Research model, which combines household furniture spending, renovation and new-home activity, contract project demand and average prices by product type. The row named the four regions without shares, so regional shares and growth rates are Credence Research estimates based on official 2025 provincial and regional output, as are the splits by product type, application, technology and channel. Sources used are official statistics, government notices, company releases and trade press, and no interviews or surveys were used.
Replacement buying shapes furniture demand through 2035
The China furniture market is expected to reach USD 267.01 billion by 2035, a 5.14% CAGR during 2026–2035, as renovation, replacement and urban upgrading keep households buying. Spending is projected to rise from USD 170.00 billion in 2026 even as trade-in support shifts to other goods. Growth should be strongest in smart pieces, online channels and Central and Western China, while East China keeps the largest regional share. In contrast, a weak property market and export pressure could slow growth in some years.
Frequently Asked Questions
How big is the China furniture market?
Which region leads demand?
Which region grows fastest?
Which product type holds the largest share?
Which technology grows fastest?
How did trade-in subsidies affect furniture sales?
Who are the leading companies in this market?
What are the main risks to growth?
Table of Content
Chapter 1 Market Segmentation
- 1.1 Segmentation Framework
- 1.1.1 Product and Service Classification
- 1.1.2 Application and End-Use Classification
- 1.1.3 Technology and Solution Classification
- 1.1.4 Customer and Distribution Channel Classification
- 1.1.5 Geographic Segmentation
- 1.1.6 Market Segment Definitions and Boundaries
- 1.2 By Product Type
- 1.2.1 Seating and Upholstered Furniture
- 1.2.2 Bedroom and Storage Furniture
- 1.2.3 Kitchen and Dining Furniture
- 1.2.4 Office and Contract Furniture
- 1.3 By Application
- 1.3.1 Residential Interiors
- 1.3.2 Corporate Workspaces
- 1.3.3 Hospitality and Leisure
- 1.3.4 Healthcare and Education Facilities
- 1.4 By Technology
- 1.4.1 Conventional Fixed Furniture
- 1.4.2 Modular and Ready-to-Assemble Furniture
- 1.4.3 Smart and Connected Furniture
- 1.4.4 Digitally Customized Furniture
Chapter 2 Introduction
- 2.1 Report Objectives and Scope
- 2.2 Product Definition and Industry Terminology
- 2.3 Market Inclusions and Exclusions
- 2.4 Research Process
- 2.4.1 Primary Research and Expert Interviews
- 2.4.2 Secondary Research and Source Review
- 2.4.3 Top-Down and Bottom-Up Estimation
- 2.4.4 Data Triangulation and Verification
- 2.5 Market Size Measurement Basis
- 2.5.1 2025: USD 160.99 billion → 2035: USD 267.01 billion
- 2.6 Historical and Forecast Reference Periods
- 2.6.1 Historical Period: 2018-2025
- 2.6.2 Base Year: 2025
- 2.6.3 Forecast Period: 2025-2035
- 2.7 Research Assumptions and Limitations
Chapter 3 Executive Summary
- 3.1 Market Snapshot and Key Findings
- 3.2 Base-Year Market Size, 2025
- 3.3 Forecast Market Size, 2035
- 3.4 Revenue and Volume Growth Outlook
- 3.5 Key Demand and Supply Indicators
- 3.6 Leading Market Segments
- 3.7 Fastest-Growing Market Opportunities
- 3.8 Regional Performance Highlights
- 3.9 Technology and Industry Transformation
- 3.10 Competitive Landscape Summary
- 3.11 Analyst View and Strategic Implications
Chapter 4 China Furniture Market Trends and Developments
- 4.1 Historical Industry Development, 2018-2025
- 4.2 Recent Market Trends and Developments
- 4.3 Demand and Customer Behavior Trends
- 4.4 Technology and Product Innovation
- 4.5 Artificial Intelligence, Automation and Digitalization
- 4.6 Local Manufacturing and Supply Chain Realignment
- 4.7 Industry Partnerships, Mergers and Acquisitions
- 4.8 Sustainability and Circular Economy Developments
- 4.9 Government and Private Sector Investment Trends
- 4.10 Emerging Business Models and Commercialization
- 4.11 Industry Developments and Announcements
Chapter 5 China Furniture Market Production, Supply and Demand Analysis
- 5.1 Demand Trend and Consumption Analysis, 2018-2025
- 5.2 Demand Forecast, 2025-2035
- 5.3 Production and Output Trend, 2018-2025
- 5.4 Production and Output Forecast, 2025-2035
- 5.5 Installed Capacity and Capacity Utilization
- 5.6 Company-Wise Production Plants and Statistics
- 5.6.1 Installed Production Capacity
- 5.6.2 Actual Production
- 5.6.3 Planned Capacity and Expansion Targets
- 5.7 Supply Chain Structure and Procurement Trends
- 5.8 Supply-Demand Gap and Bottlenecks
- 5.9 Import Dependence and Sourcing Structure
- 5.10 Contract Manufacturing and Outsourcing
- 5.11 Regional Supply and Demand Concentration
Chapter 6 China Furniture Market Pricing Analysis
- 6.1 Pricing Structure and Measurement
- 6.2 Historical Pricing Trends, 2018-2025
- 6.3 Pricing Outlook, 2025-2035
- 6.4 Average Selling Price and Unit Economics
- 6.5 Pricing by Product and Market Segment
- 6.6 Geographic Pricing Differences
- 6.7 Key Input, Energy, Labor and Logistics Costs
- 6.8 Contract Pricing and Purchasing Models
- 6.9 Pricing Sensitivity and Competitive Positioning
- 6.10 Price, Margin and Profitability Implications
Chapter 7 China Furniture Market Dynamics
- 7.1 Market Growth Drivers
- 7.1.1 Demand-Side Drivers
- 7.1.2 Technology and Innovation Drivers
- 7.1.3 Infrastructure and Investment Drivers
- 7.1.4 Regulatory and Policy Drivers
- 7.2 Market Restraints
- 7.2.1 Cost and Affordability Constraints
- 7.2.2 Technology and Adoption Barriers
- 7.2.3 Supply Chain and Operational Constraints
- 7.3 Market Challenges
- 7.3.1 Competitive Pressure and Margin Erosion
- 7.3.2 Skills, Infrastructure and Implementation Gaps
- 7.4 Emerging Market Opportunities
- 7.5 Market Dynamics Impact and Time-Horizon Assessment
Chapter 8 China Furniture Value Chain Analysis
- 8.1 Industry Value Chain Overview
- 8.2 Upstream Suppliers and Critical Inputs
- 8.3 Technology and Component Providers
- 8.4 Manufacturing or Service Delivery
- 8.5 Distribution, Channel Partners and Integrators
- 8.6 Downstream Applications and End Users
- 8.7 Value Addition and Profit Pools
- 8.8 Vertical Integration and Outsourcing
- 8.9 Supplier Concentration and Risk
- 8.10 Supply Chain Localization and Resilience
Chapter 9 China Furniture Market Regulations and Policies
- 9.1 Relevant Laws, Standards and Compliance Frameworks
- 9.2 Product, Service, Safety and Quality Requirements
- 9.3 Government Policies, Incentives and Subsidies
- 9.4 Imports, Exports and Trade Barriers
- 9.5 Public Procurement and Local Content Requirements
- 9.6 Environmental and Sustainability Compliance
- 9.7 Upcoming Policy Changes and Market Implications
Chapter 10 China Furniture Market Hotspots and Opportunities
- 10.1 Market Opportunity Mapping and Growth Hotspots
- 10.2 High-Growth Applications and Customer Groups
- 10.3 Underserved Markets and White-Space Opportunities
- 10.4 Emerging Technology and Product Opportunities
- 10.5 New Capacity and Investment Hotspots
- 10.6 Market Entry and Expansion Opportunities
- 10.7 Distribution and Partnership Opportunities
- 10.8 Near-Term and Long-Term Commercial Potential
- 10.9 Opportunity Attractiveness and Execution Risks
Chapter 11 China Furniture Market Outlook, 2025-2035
- 11.1 Market Size and Analysis
- 11.1.1 Revenue (Market Measurement: 2025: USD 160.99 billion → 2035: USD 267.01 billion)
- 11.1.2 Market Volume and Quantity Sold
- 11.1.3 Historical Market Size, 2018-2025
- 11.1.4 Base-Year Market Size, 2025
- 11.2 Market Forecast, 2025-2035
- 11.2.1 Revenue Forecast to 2035
- 11.2.2 Volume Forecast to 2035
- 11.2.3 CAGR and Year-on-Year Growth
- 11.2.4 Incremental Revenue Opportunity
- 11.3 Forecast Assumptions and Scenario Analysis
- 11.3.1 Base-Case Forecast
- 11.3.2 Optimistic and Conservative Scenarios
- 11.3.3 Technology, Pricing and Policy Sensitivities
- 11.4 Market Attractiveness and Growth Outlook
Chapter 12 China Furniture Market Segmentation and Outlook
- 12.1 Segmentation Summary and Market Shares, 2025
- 12.2 Largest and Fastest-Growing Segments
- 12.3 By Product Type - Market Size and Forecast, 2025-2035
- 12.3.1 Segment Definition and Scope
- 12.3.2 Historical Market Size, 2018-2025
- 12.3.3 Revenue Forecast, 2025-2035
- 12.3.4 Volume Forecast, 2025-2035
- 12.3.5 Base-Year Market Share, 2025
- 12.3.6 Segment CAGR and Growth Drivers
- 12.3.7 Subsegment Market Size and Forecast
- 12.3.7.1 Seating and Upholstered Furniture
- 12.3.7.2 Bedroom and Storage Furniture
- 12.3.7.3 Kitchen and Dining Furniture
- 12.3.7.4 Office and Contract Furniture
- 12.3.8 Subsegment Pricing and Adoption Trends
- 12.3.9 Leading Suppliers and Competition
- 12.3.10 Regional Demand and Opportunities
- 12.4 By Application - Market Size and Forecast, 2025-2035
- 12.4.1 Segment Definition and Scope
- 12.4.2 Historical Market Size, 2018-2025
- 12.4.3 Revenue Forecast, 2025-2035
- 12.4.4 Volume Forecast, 2025-2035
- 12.4.5 Base-Year Market Share, 2025
- 12.4.6 Segment CAGR and Growth Drivers
- 12.4.7 Subsegment Market Size and Forecast
- 12.4.7.1 Residential Interiors
- 12.4.7.2 Corporate Workspaces
- 12.4.7.3 Hospitality and Leisure
- 12.4.7.4 Healthcare and Education Facilities
- 12.4.8 Subsegment Pricing and Adoption Trends
- 12.4.9 Leading Suppliers and Competition
- 12.4.10 Regional Demand and Opportunities
- 12.5 By Technology - Market Size and Forecast, 2025-2035
- 12.5.1 Segment Definition and Scope
- 12.5.2 Historical Market Size, 2018-2025
- 12.5.3 Revenue Forecast, 2025-2035
- 12.5.4 Volume Forecast, 2025-2035
- 12.5.5 Base-Year Market Share, 2025
- 12.5.6 Segment CAGR and Growth Drivers
- 12.5.7 Subsegment Market Size and Forecast
- 12.5.7.1 Conventional Fixed Furniture
- 12.5.7.2 Modular and Ready-to-Assemble Furniture
- 12.5.7.3 Smart and Connected Furniture
- 12.5.7.4 Digitally Customized Furniture
- 12.5.8 Subsegment Pricing and Adoption Trends
- 12.5.9 Leading Suppliers and Competition
- 12.5.10 Regional Demand and Opportunities
- 12.6 Segment Growth Comparison
- 12.7 Segment Attractiveness and Priority Matrix
Chapter 13 China Furniture End-Use and Application Market Outlook
- 13.1 End-Use Industry and Customer Demand Structure
- 13.2 Leading Applications and Customer Groups
- 13.3 End-Use Market Size, Share and Forecast
- 13.4 Major End-Use Industry Deep Dives
- 13.4.1 Customer Requirements and Use Cases
- 13.4.2 Demand and Replacement Cycles
- 13.4.3 Technical and Regulatory Considerations
- 13.4.4 Purchasing and Procurement Models
- 13.4.5 Leading Vendors and Distribution Channels
- 13.4.6 Forecast and Commercial Opportunities
- 13.5 Emerging Applications and Cross-Segment Demand
- 13.6 End-Use Industry Investment Priorities
Chapter 14 China Furniture Geographic Market Outlook, 2025-2035
- 14.1 Domestic Market Distribution and Demand Clusters
- 14.2 State- or Province-Wise Market Size and Forecast, 2025-2035
- 14.3 City and Metropolitan Market Outlook
- 14.4 Industrial, Manufacturing and Commercial Clusters
- 14.5 Geographic Concentration of Key End Users
- 14.6 Local Pricing and Purchasing Differences
- 14.7 Domestic Production Facilities and Capacity Map
- 14.8 Local Infrastructure and Project Pipeline
- 14.9 State-Level Policy and Incentive Differences
- 14.10 Subnational Investment Hotspots and Opportunities
- 14.11 Distribution and Logistics Networks
- 14.12 Domestic Competitive Footprint
Chapter 15 China Furniture Technology, Innovation and Sustainability Outlook
- 15.1 Technology Landscape and Maturity
- 15.2 Product, Process and Service Innovation
- 15.3 AI, Automation and Digital Tools in the Industry
- 15.4 Technology Adoption and Performance Benchmarking
- 15.5 Innovation Pipeline and R&D Investment
- 15.6 Patent and Intellectual Property Trends
- 15.7 Energy Efficiency and Resource Management
- 15.8 Sustainability, Recycling and Circularity
- 15.9 Technology Roadmap, 2025-2035
- 15.10 Risks of Obsolescence and Technology Substitution
Chapter 16 China Furniture Market Key Strategic Imperatives
- 16.1 Growth and Market Entry Priorities
- 16.2 High-Return Products and Segments
- 16.3 Pricing, Profitability and Cost Optimization
- 16.4 Technology Investment and Product Differentiation
- 16.5 Supply Chain Localization and Resilience
- 16.6 Distribution and Customer Acquisition
- 16.7 Partnership, Acquisition and Capacity Strategy
- 16.8 Regional Expansion Priorities
- 16.9 Short-, Medium- and Long-Term Actions
Chapter 17 Competition Outlook
- 17.1 Industry Competition Characteristics
- 17.2 Market Structure and Concentration
- 17.3 Market Share and Competitive Positioning, 2025
- 17.4 Company-Wise Revenue and Product Benchmarking
- 17.5 Production and Service Capacity Benchmarking
- 17.6 Technology, Pricing and Differentiation
- 17.7 Regional Footprint and Distribution Strength
- 17.8 Mergers, Acquisitions and Strategic Alliances
- 17.9 New Entrants and Competitive Threats
- 17.10 Porter's Five Forces and Industry Attractiveness
- 17.11 Competitive Outlook, 2025-2035
Chapter 18 Company Profiles
- 18.1 Company Coverage and Selection Criteria
- 18.2 IKEA
- 18.2.1 Business Description
- 18.2.2 Company Ownership and Geographic Presence
- 18.2.3 Product and Service Portfolio
- 18.2.4 Manufacturing and Operating Footprint
- 18.2.5 Production Capacity and Expansion Plans
- 18.2.6 Financial Performance and Investment
- 18.2.7 Market Share and Competitive Position
- 18.2.8 Technology and Innovation Capabilities
- 18.2.9 Strategic Alliances or Partnerships
- 18.2.10 Recent Developments
- 18.2.11 Growth Strategy and Outlook
- 18.3 OPPEIN Home Group Inc.
- 18.4 KUKA Home
- 18.5 Suofeiya Home Collection Co., Ltd.
- 18.6 Man Wah Holdings Limited
- 18.7 Sleemon Co., Ltd.
- 18.8 Qumei Home Furnishings Group Co., Ltd.
- 18.9 ZBOM Home Collection Co., Ltd.
- 18.10 GoldenHome Living Co., Ltd.
- 18.11 Quanyou Furniture Co., Ltd.
- 18.12 Other Relevant Market Participants
Note: Every listed company is profiled on the structure shown under the first company. The company list is preliminary and may change based on research findings, market developments, data availability and client requirements.
Chapter 19 Disclaimer
- 19.1 Research and Forecast Disclaimer
- 19.2 Data Source and Estimation Limitations
Note: The depth of individual sections depends on data availability for this market. Volume, capacity, trade and other unit-based metrics are included where applicable.

