
Phones, e-wallets and dark stores move baskets online
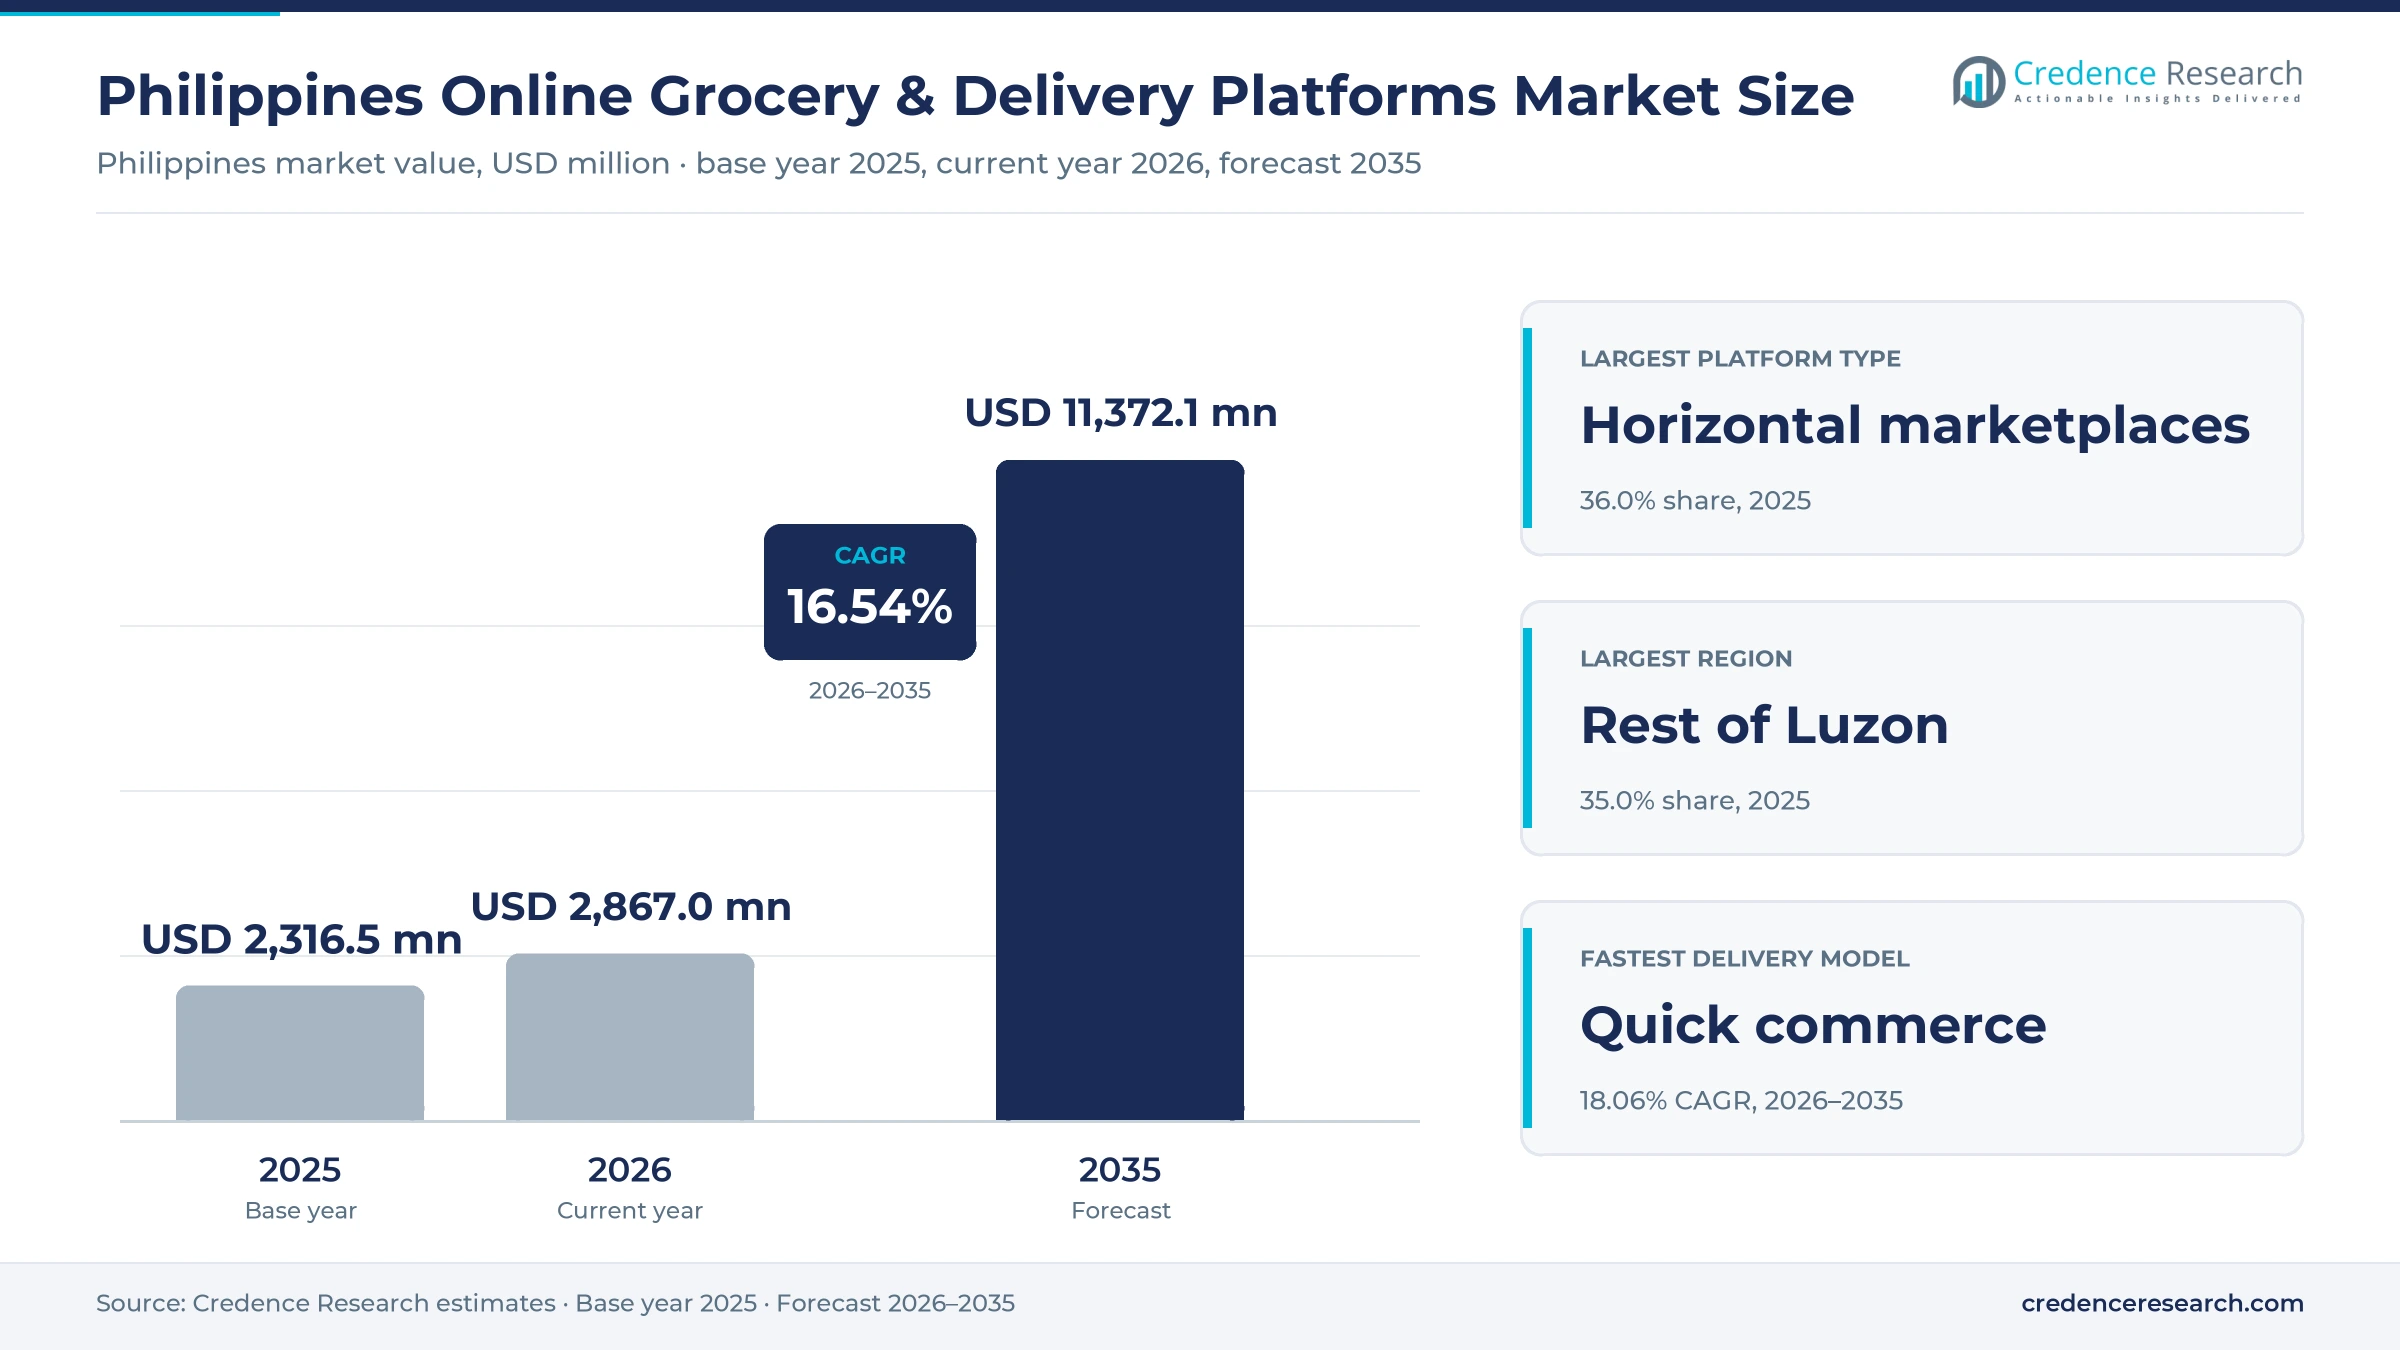
The Philippines online grocery and delivery platforms market was valued at USD 2.32 billion in 2025 and is projected to increase from USD 2.87 billion in 2026 to USD 11.37 billion by 2035, registering a CAGR of 16.54% during 2026–2035. Demand comes from households that order rice, canned goods, fresh produce and household items through marketplaces, super-app marts and supermarket apps, and from merchants that pay commissions, fees and advertising to reach them. Rest of Luzon held the largest regional share, 35.0% in 2025, because CALABARZON, Central Luzon and other provinces around the capital hold the largest population and a growing hub network. Mindanao is the fastest-growing region at 17.18% a year, as platforms extend service to Davao and other cities. In turn, foodpanda expanded its pandamart network to 23 hubs in July 2026, which shows how dark stores are moving beyond the capital.
Which digital grocery orders does the estimate cover?
The estimate measures the value that online grocery and delivery platforms earn in the Philippines from grocery and household orders, including merchant commissions, delivery and service fees, retail media and membership income. It covers horizontal marketplaces, super-app marts, dedicated online grocers and retailer-owned apps across quick, same-day, scheduled and click-and-collect models.
The estimate excludes restaurant meal delivery, in-store supermarket sales, sari-sari store wholesale orders and pure parcel delivery for non-grocery goods. The value chain runs from food makers and supermarkets through platforms, dark stores and rider fleets to households that pay by wallet, card, bank transfer or cash.
Philippines Online Grocery & Delivery Platforms Market Insights
- The Philippines online grocery and delivery platforms market was valued at USD 2.32 billion in 2025 and is projected to reach USD 11.37 billion by 2035, registering a CAGR of 16.54% during 2026–2035.
- Rest of Luzon held a 35.0% share of 2025 value, because CALABARZON alone counted 16,933,234 residents in the 2024 Census of Population.
- Horizontal marketplaces led with a 36.0% share of 2025 value, because they combine wide grocery ranges, vouchers and nationwide shipping.
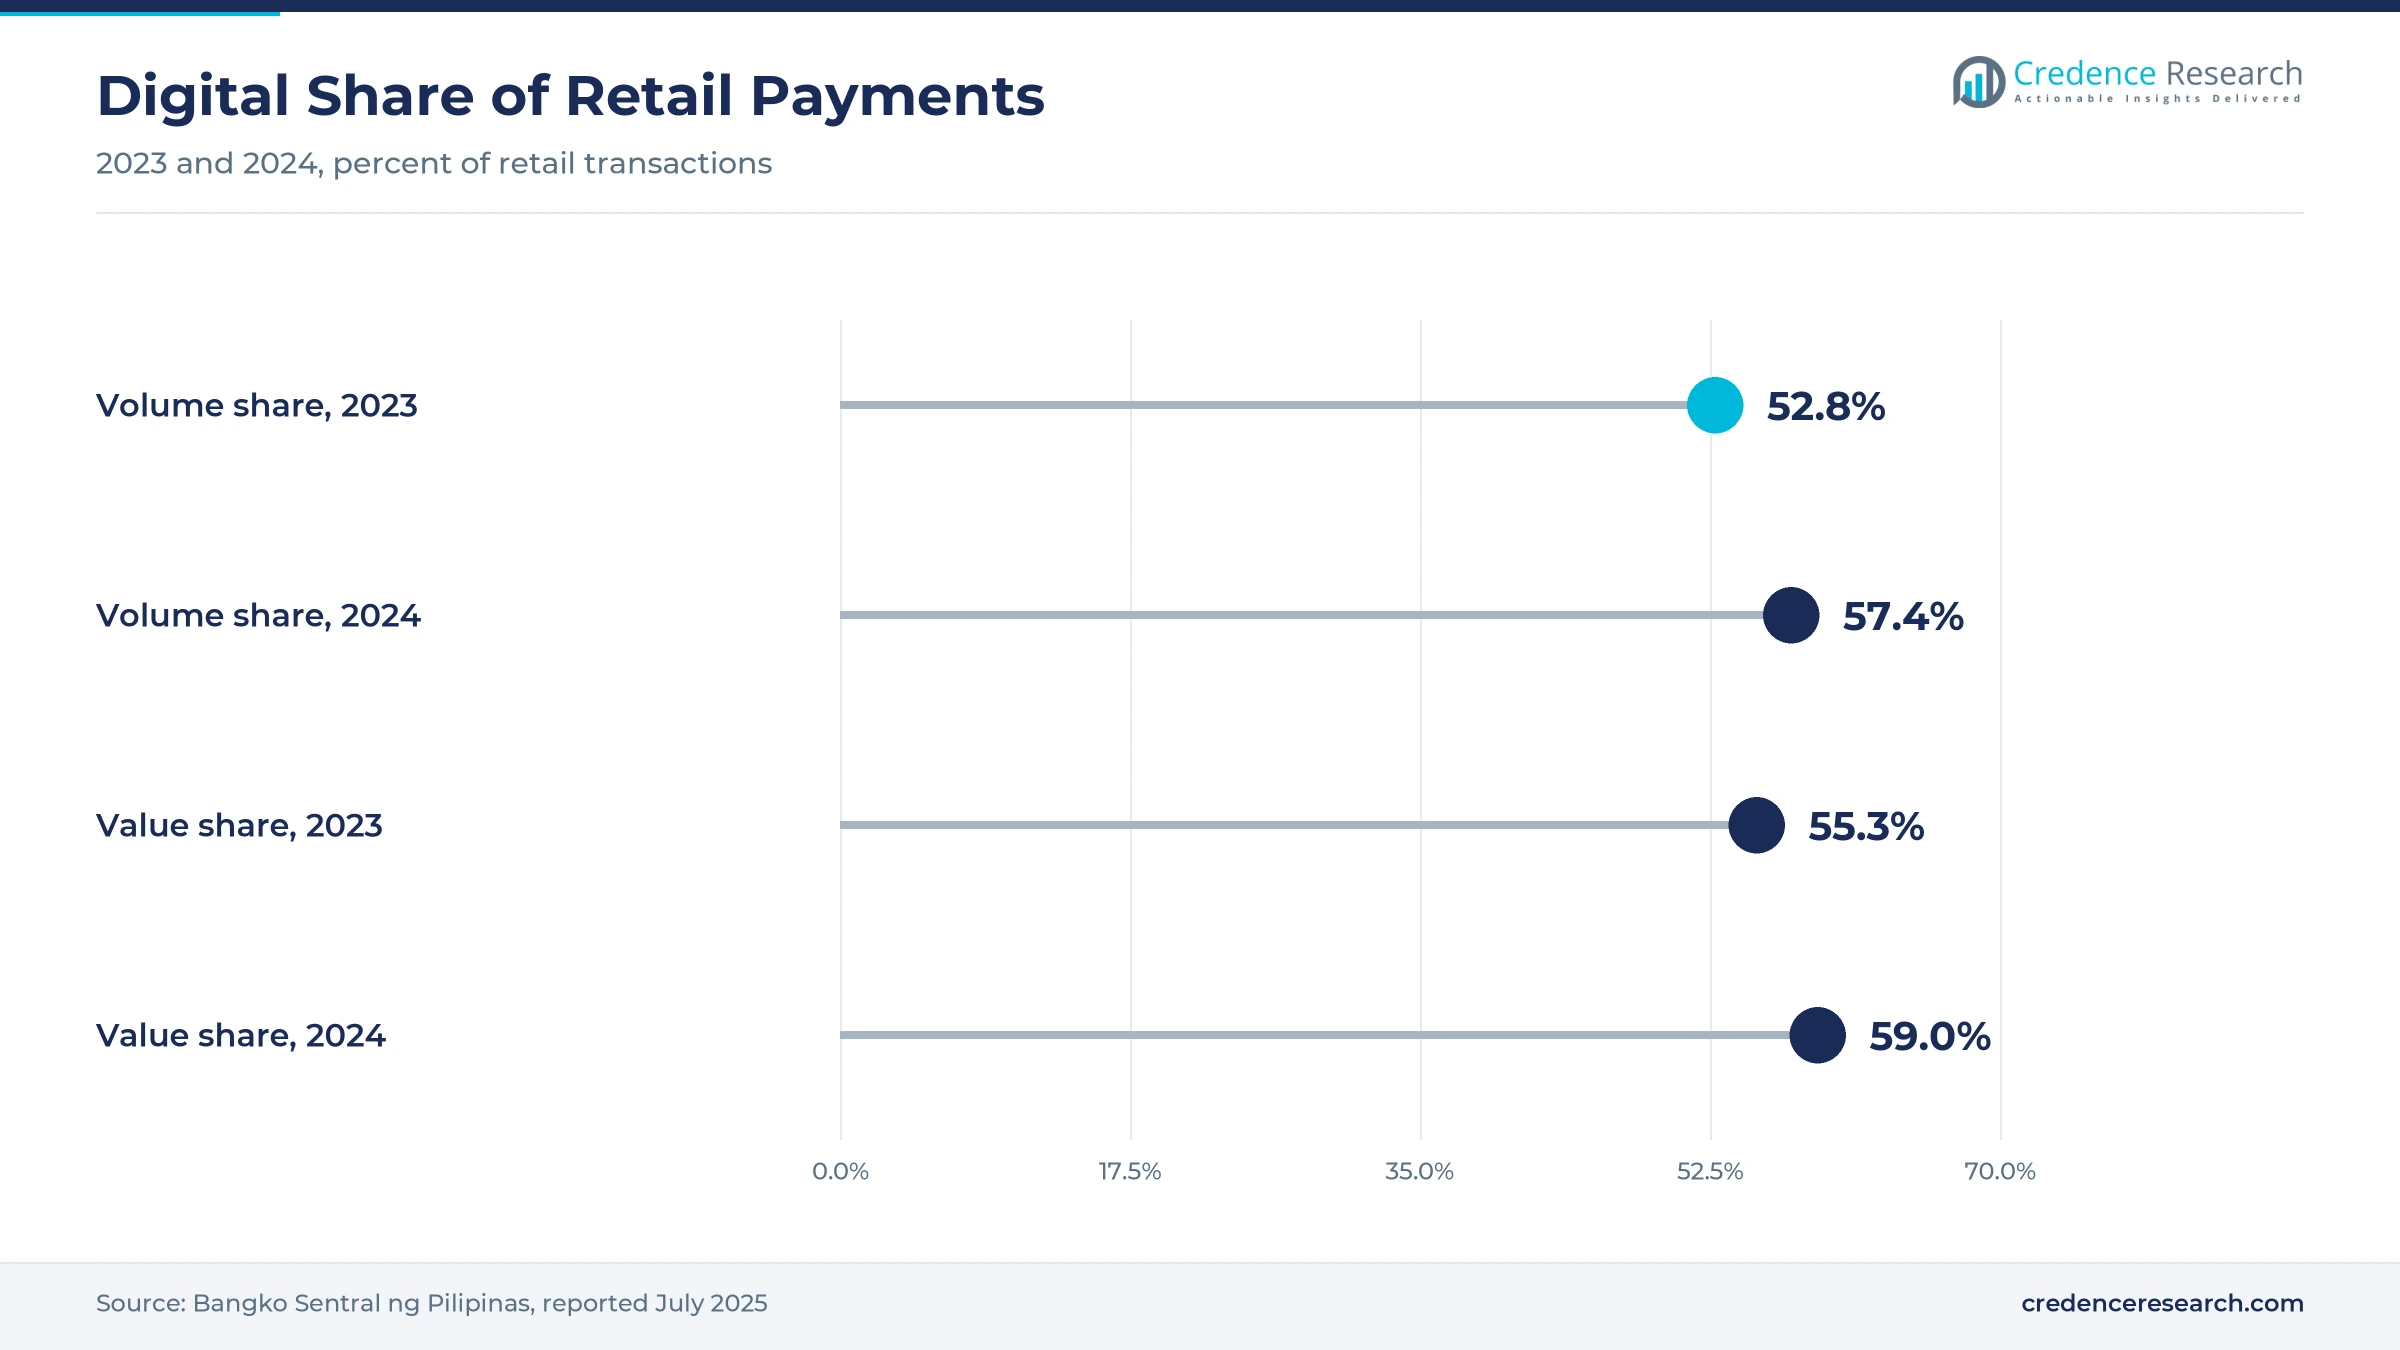
- Digital payments made up 57.4% of retail transaction volume in 2024, up from 52.8% in 2023, according to the Bangko Sentral ng Pilipinas.
- Under-30-minute quick commerce grows fastest at 18.06% a year during 2026–2035, as dark stores promise delivery in 25 to 35 minutes.
Marketplaces lead while super-app marts grow fastest
Why do horizontal marketplaces hold the most value?
Based on platform type, the market is categorized into horizontal marketplaces, on-demand super-app marts, dedicated online grocers and retailer-owned e-commerce. Horizontal Marketplaces led with a 36.0% share of 2025 value, because shoppers already use them for packaged goods with vouchers and free shipping. On-Demand Super-App Mart grow fastest at 17.44% a year, as foodpanda and Grab add dark stores and cities.
How fast do Filipino shoppers want their baskets?
Based on delivery model, the market is categorized into under-30-minute quick commerce, same-day on-demand, scheduled delivery and click-and-collect. Scheduled Delivery led with a 38.0% share of 2025 value, because marketplaces ship bulk staples over several days. Under-30-Minute Quick Commerce grows fastest at 18.06% a year, as round-the-clock dark stores serve top-up orders within half an hour.
Which grocery categories fill the most baskets?
Based on product category, the market is categorized into staples and packaged food, fresh produce and dairy, meat and seafood, and household and personal care. Staples and Packaged Food led with a 42.0% share of 2025 value, because rice, canned goods, bread and soft drinks top online orders. Fresh Produce and Dairy grow fastest at 17.30% a year, as chilled hubs carry full supermarket ranges.
How do shoppers pay for online groceries?
Based on payment method, the market is categorized into digital wallets, cards, cash on delivery and bank and QR payments. Digital Wallets led with a 45.0% share of 2025 value, because tens of millions of users already keep balances in mobile wallets. Bank and QR Payments grow fastest at 17.73% a year, as merchants adopt the national QR standard.
| Segment Group | Leading Sub-segment | Share, 2025 | Fastest-growing Sub-segment | CAGR, 2026–2035 |
|---|---|---|---|---|
| By Platform Type | Horizontal Marketplaces | 36.0% | On-Demand Super-App Mart | 17.44% |
| By Delivery Model | Scheduled Delivery | 38.0% | Under-30-Minute Quick Commerce | 18.06% |
| By Product Category | Staples and Packaged Food | 42.0% | Fresh Produce and Dairy | 17.30% |
| By Payment Method | Digital Wallets | 45.0% | Bank and QR Payments | 17.73% |
Request a Free Sample
Fill in your details and we'll send you a free sample report.
- Sample data tables & charts
- Research methodology
Mobile reach, e-wallets and local hubs expand orders
How does mobile-first reach expand grocery demand?
Mobile-first consumer reach expands addressable grocery demand, because most Filipino shoppers now discover, compare and buy goods on phone apps. The Philippine Statistics Authority valued the digital economy at P2.74 trillion in 2025, or 9.8% of GDP, with e-commerce at P880.46 billion. The 2024 Census of Population counted 112,729,484 residents, which gives platforms a large and young customer base. Urban residents made up 55.8% of the population in 2025, according to the World Bank, concentrating demand in dense cities where riders can reach many homes quickly during each delivery shift. As a result, horizontal marketplaces hold 36.0% of 2025 value, because app shoppers buy staples alongside other goods.
Why do digital payments reduce checkout friction?
Digital payments reduce grocery checkout friction, because shoppers can pay instantly without keeping cash for riders. Digital payments made up 57.4% of retail transaction volume and 59% of value in 2024, up from 52.8% and 55.3% in 2023, according to Bangko Sentral ng Pilipinas data. GCash recorded 39.1 million monthly active users and 56.7 million daily average transactions in 2025, according to Mynt. Merchant adoption of the national QR standard also rose 148.7% in 2024, giving small stores a cheap way to accept digital payment. In turn, digital wallets hold 45.0% of 2025 value, as mobile wallets replace cash for repeat baskets.
How do hyperlocal fulfillment networks improve availability?
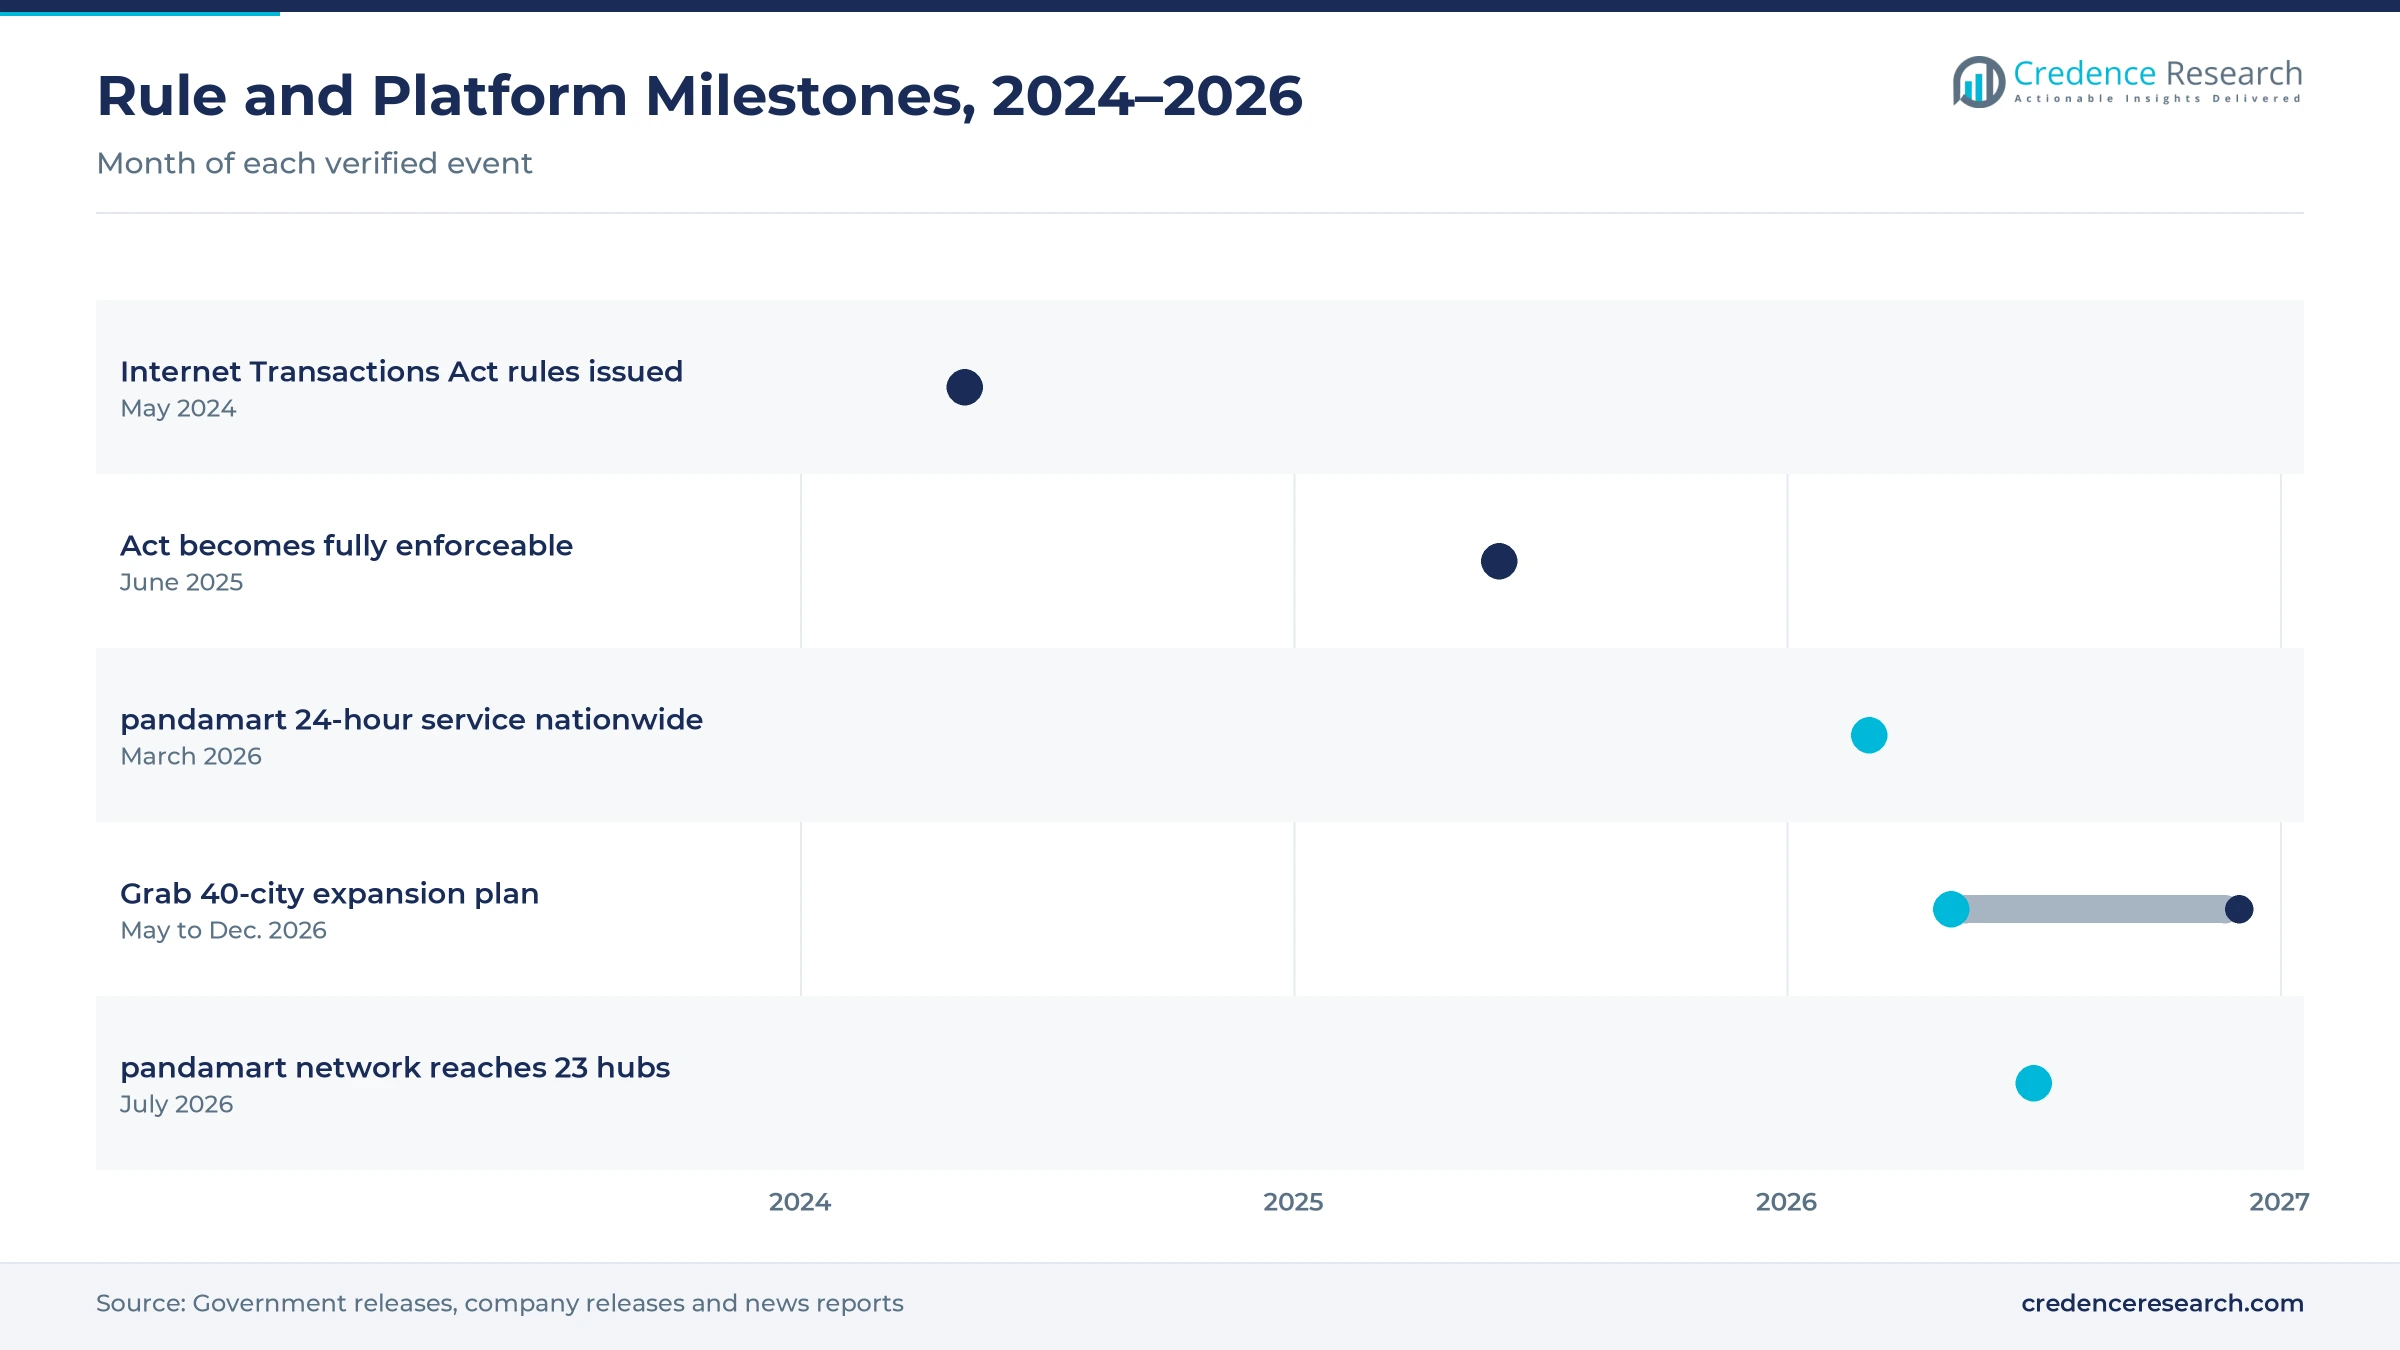
Hyperlocal fulfillment networks improve delivery availability, because dark stores keep stock close to homes and cut wait times. foodpanda opened pandamart hubs in Calamba and Caloocan in July 2026, bringing its network to 23 sites with typical delivery of 25 to 35 minutes, according to Newsbytes.PH. The hubs run around the clock and serve households across Luzon, Metro Cebu and Davao with full supermarket ranges. Grab Philippines also announced plans in May 2026 to expand to 40 additional cities, starting with delivery services. As a result, under-30-minute quick commerce grows at 18.06% a year, as more dark stores open outside the capital.
Why do stronger e-commerce rules build shopper trust?
Stronger e-commerce rules build shopper trust, because buyers order more food online when they can rely on clear prices, refunds and seller details. The government issued the implementing rules of the Internet Transactions Act on May 24, 2024, and the law became fully enforceable on June 20, 2025, according to the Daily Tribune. Platforms may share liability with sellers that fail to act on illicit listings, and every online merchant must disclose price, brand, condition and contact details. The trade department is also developing a Philippine e-commerce trustmark for verified sellers. In turn, retailer-owned e-commerce and marketplaces gain repeat grocery orders from cautious first-time buyers.
Round-the-clock hubs and social selling reshape baskets
How is the shift to round-the-clock hubs changing service?
The shift to round-the-clock hubs is changing service, because shoppers now expect to order groceries at any hour. foodpanda launched 24-hour pandamart service nationwide on March 24, 2026, covering Metro Manila, Baguio, Cebu and Davao with a full supermarket range. The network reached 23 hubs by July 2026, including new sites in Calamba and Caloocan. Delivery from these hubs typically takes 25 to 35 minutes, which suits top-up baskets of bread, drinks, produce and household items bought late at night. As a result, on-demand super-app marts grow at 17.44% a year, as quick commerce moves from a niche to a habit.
Why is the rise of social selling notable?
The rise of social selling is notable, because shoppers increasingly buy packaged food and household goods from live streams and short videos. TikTok Shop said local sellers saw sales rise by more than 200% in 2025, and local product sales under its campaign rose more than 230%. More than 25,000 entrepreneurs joined its seller training programs that year. Lazada also introduced LazMallOne in November 2022, letting shoppers combine orders from several brands into one delivery with next-day service in Greater Manila. In turn, horizontal marketplaces keep the largest share of value, as video selling feeds steady orders for packaged staples, snacks and personal care goods from small local brands.
Can wallet and QR checkout replace cash baskets?
Wallet and QR checkout can replace cash baskets, because cash on delivery still raises rider risk, change shortages and failed orders. foodpanda reported that cash accounted for 51% of its orders and online payments for 49% in data released in January 2025. Merchant payments made up 66.4% of digital payment volume in 2024, which shows that shoppers already pay stores digitally. QR merchant adoption also rose 148.7% that year, which lets riders and stores accept payment by scanning a code. As a result, bank and QR payments grow fastest at 17.73% a year, as platforms link checkout to national payment rails.
Is there room to grow outside Metro Manila?
Cities outside Metro Manila offer room to grow, because many provincial households still shop only in wet markets and supermarkets. Grab Philippines announced in May 2026 that it would expand to 40 additional cities, rolling out delivery services first. foodpanda already runs 23 pandamart hubs, with sites in Cavite, Laguna, Batangas, Bulacan, Pampanga, Benguet, Metro Cebu and Davao. CALABARZON counted 16,933,234 residents in the 2024 census, more than any other region. In turn, Mindanao grows faster than every other zone, as platforms bring fast delivery to Davao and nearby cities where many households are still new to online grocery orders.
Cold chain gaps, traffic and cash returns pressure margins
How do cold chain gaps limit fresh baskets?
Cold chain gaps limit fresh baskets, because many provincial hubs and riders lack chilled storage for meat, seafood and dairy. As a result, platforms restrict fresh ranges outside large cities and face more spoilage claims. Operators respond with chilled dark stores, insulated bags and shorter delivery windows, which keep products safe and reduce refunds. This barrier is easing as chilled hub networks spread into more provinces each year, although remote islands still lag behind.
Why do traffic and island logistics raise costs?
Traffic and island logistics raise costs, because congested cities slow riders and inter-island shipping adds days to marketplace deliveries. In turn, platforms pay more per order in Metro Manila and struggle to promise fast service in remote provinces. Operators respond with local hubs, batching software and partner couriers, which shorten routes and cut cost per delivery. This cost pressure favors platforms with dense local networks that can spread rider costs across many daily orders.
How does cash on delivery pressure margins?
Cash on delivery pressures margins, because riders must carry change and some buyers refuse orders at the door. As a result, platforms absorb failed delivery costs, cash handling risk and slower settlement for merchants. Operators respond with wallet discounts, QR payment at the door and limits on cash orders for repeat refusers, which shift more baskets to digital payment. This risk is shrinking as wallets spread to more provincial households and small merchants across the country.
Why do thin grocery margins strain platforms?
Thin grocery margins strain platforms, because staples carry low markups while delivery fees must stay low to keep shoppers. In turn, platforms spend heavily on vouchers and rider pay without large profits per basket. Operators respond with retail media, sponsored listings and paid memberships, which add income beyond commissions and fees. This constraint pushes platforms to build advertising and subscription revenue that supports lower delivery fees for regular shoppers.
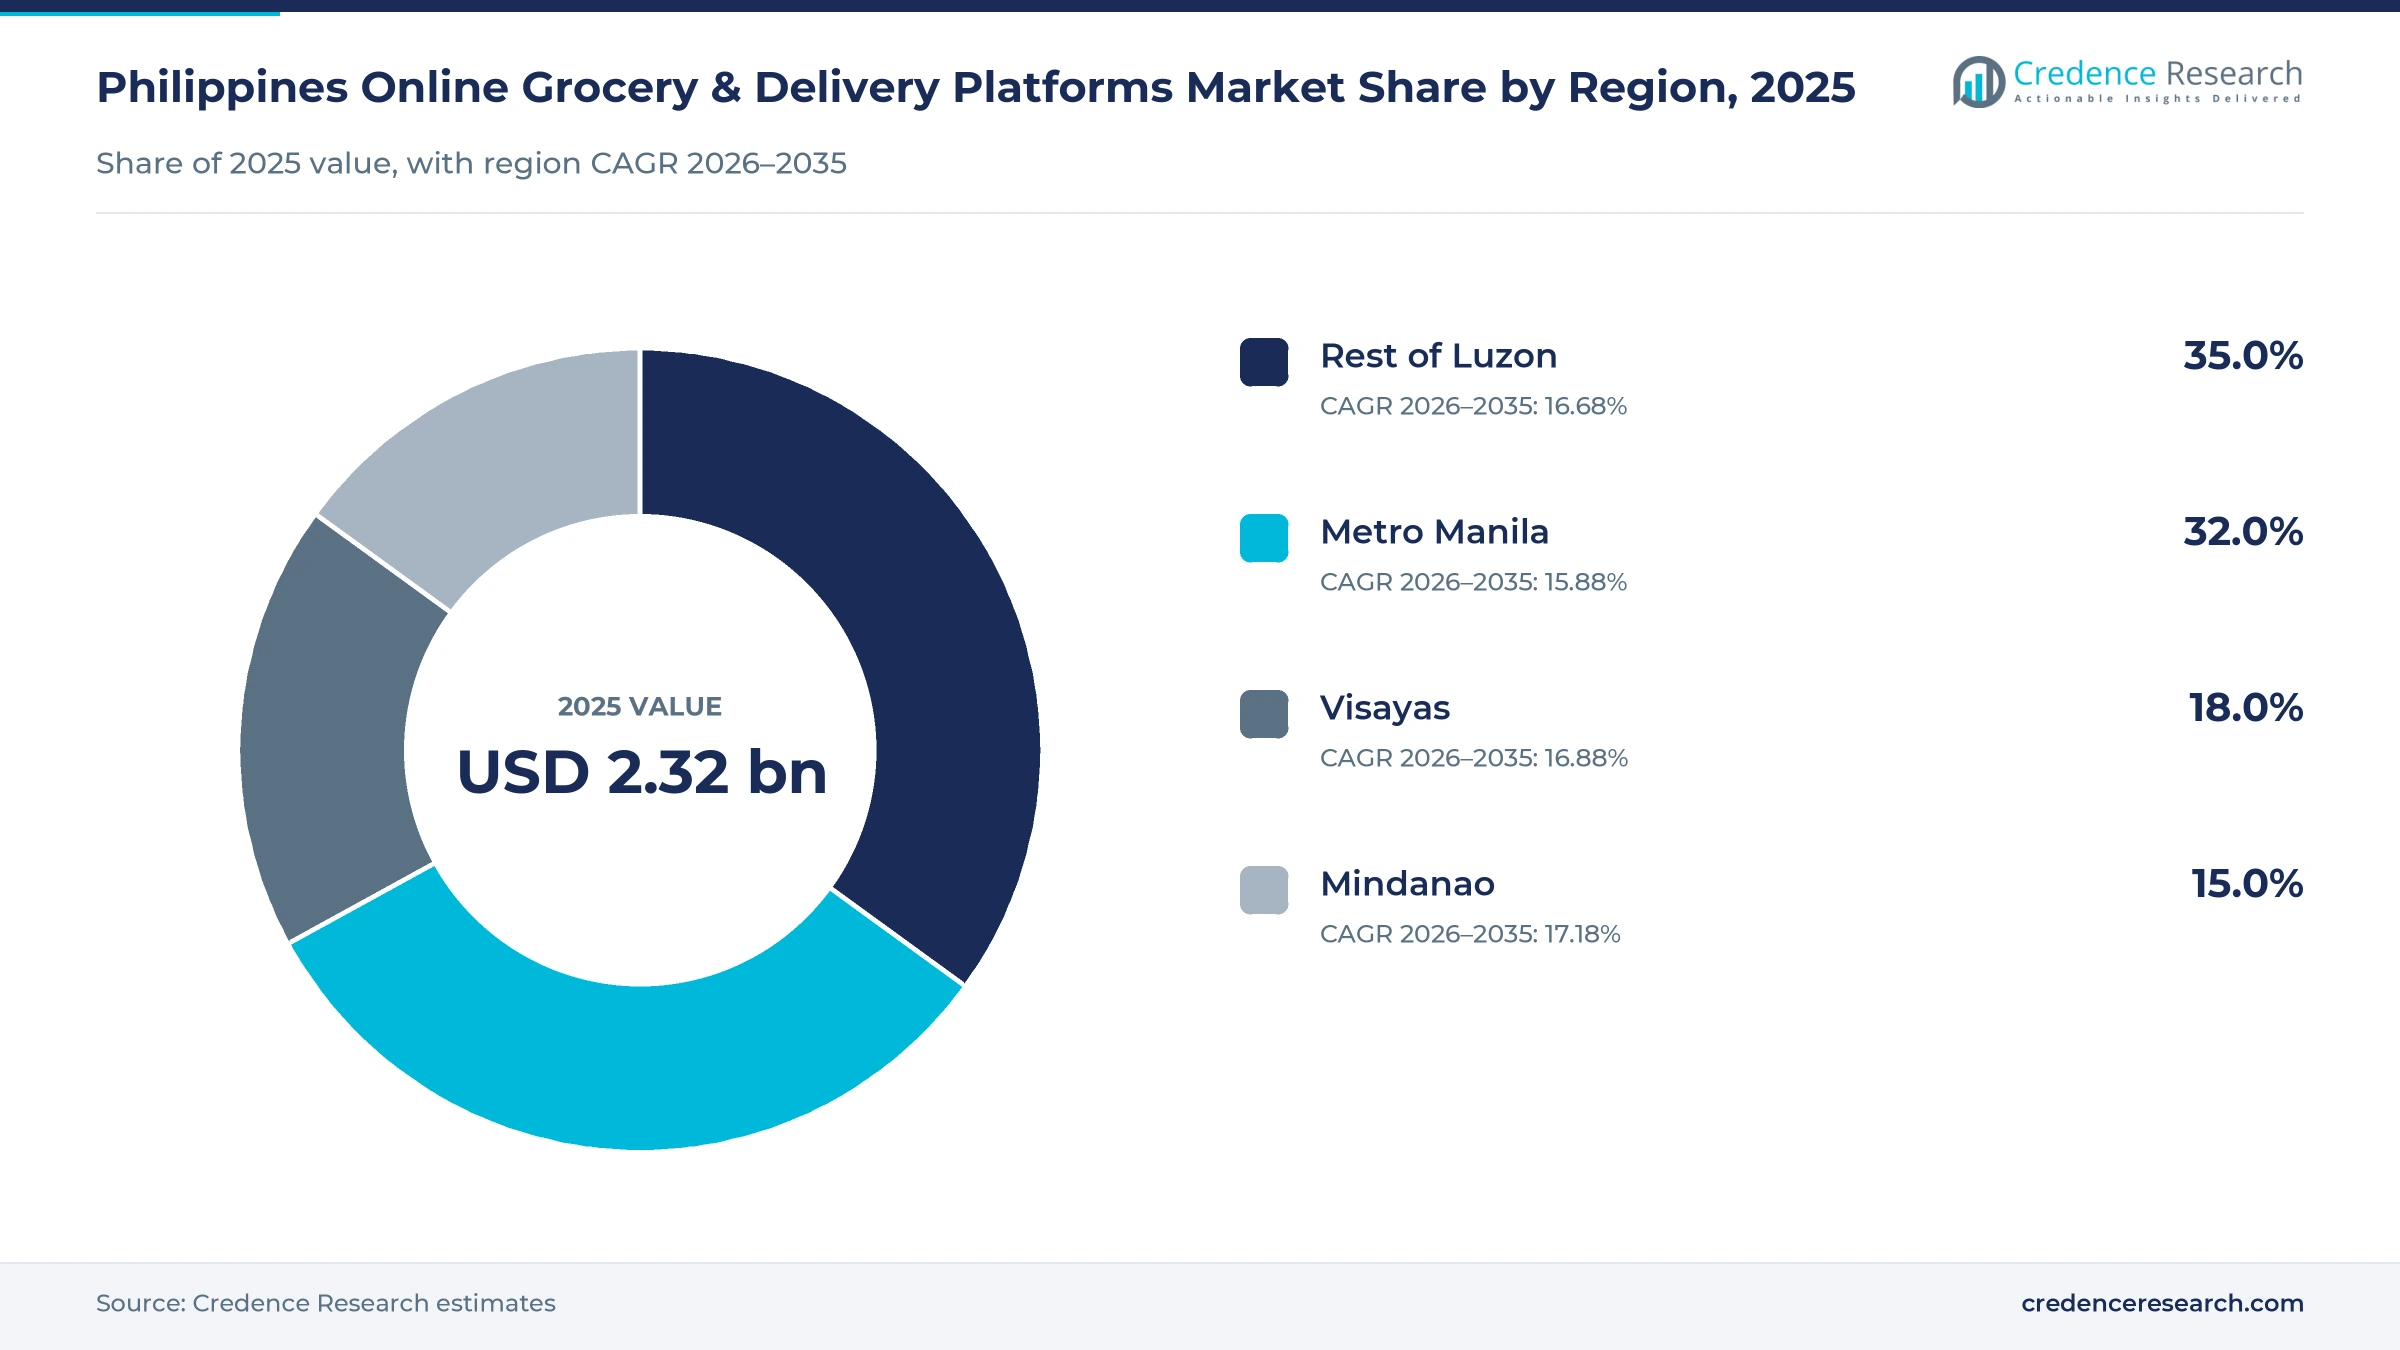
Rest of Luzon leads while Mindanao grows fastest
| Region | Value, 2025 (USD billion) | Share, 2025 | CAGR, 2026–2035 |
|---|---|---|---|
| Rest of Luzon | 0.81 | 35.0% | 16.68% |
| Metro Manila | 0.74 | 32.0% | 15.88% |
| Visayas | 0.42 | 18.0% | 16.88% |
| Mindanao | 0.35 | 15.0% | 17.18% |
Why does the rest of Luzon hold the top share?
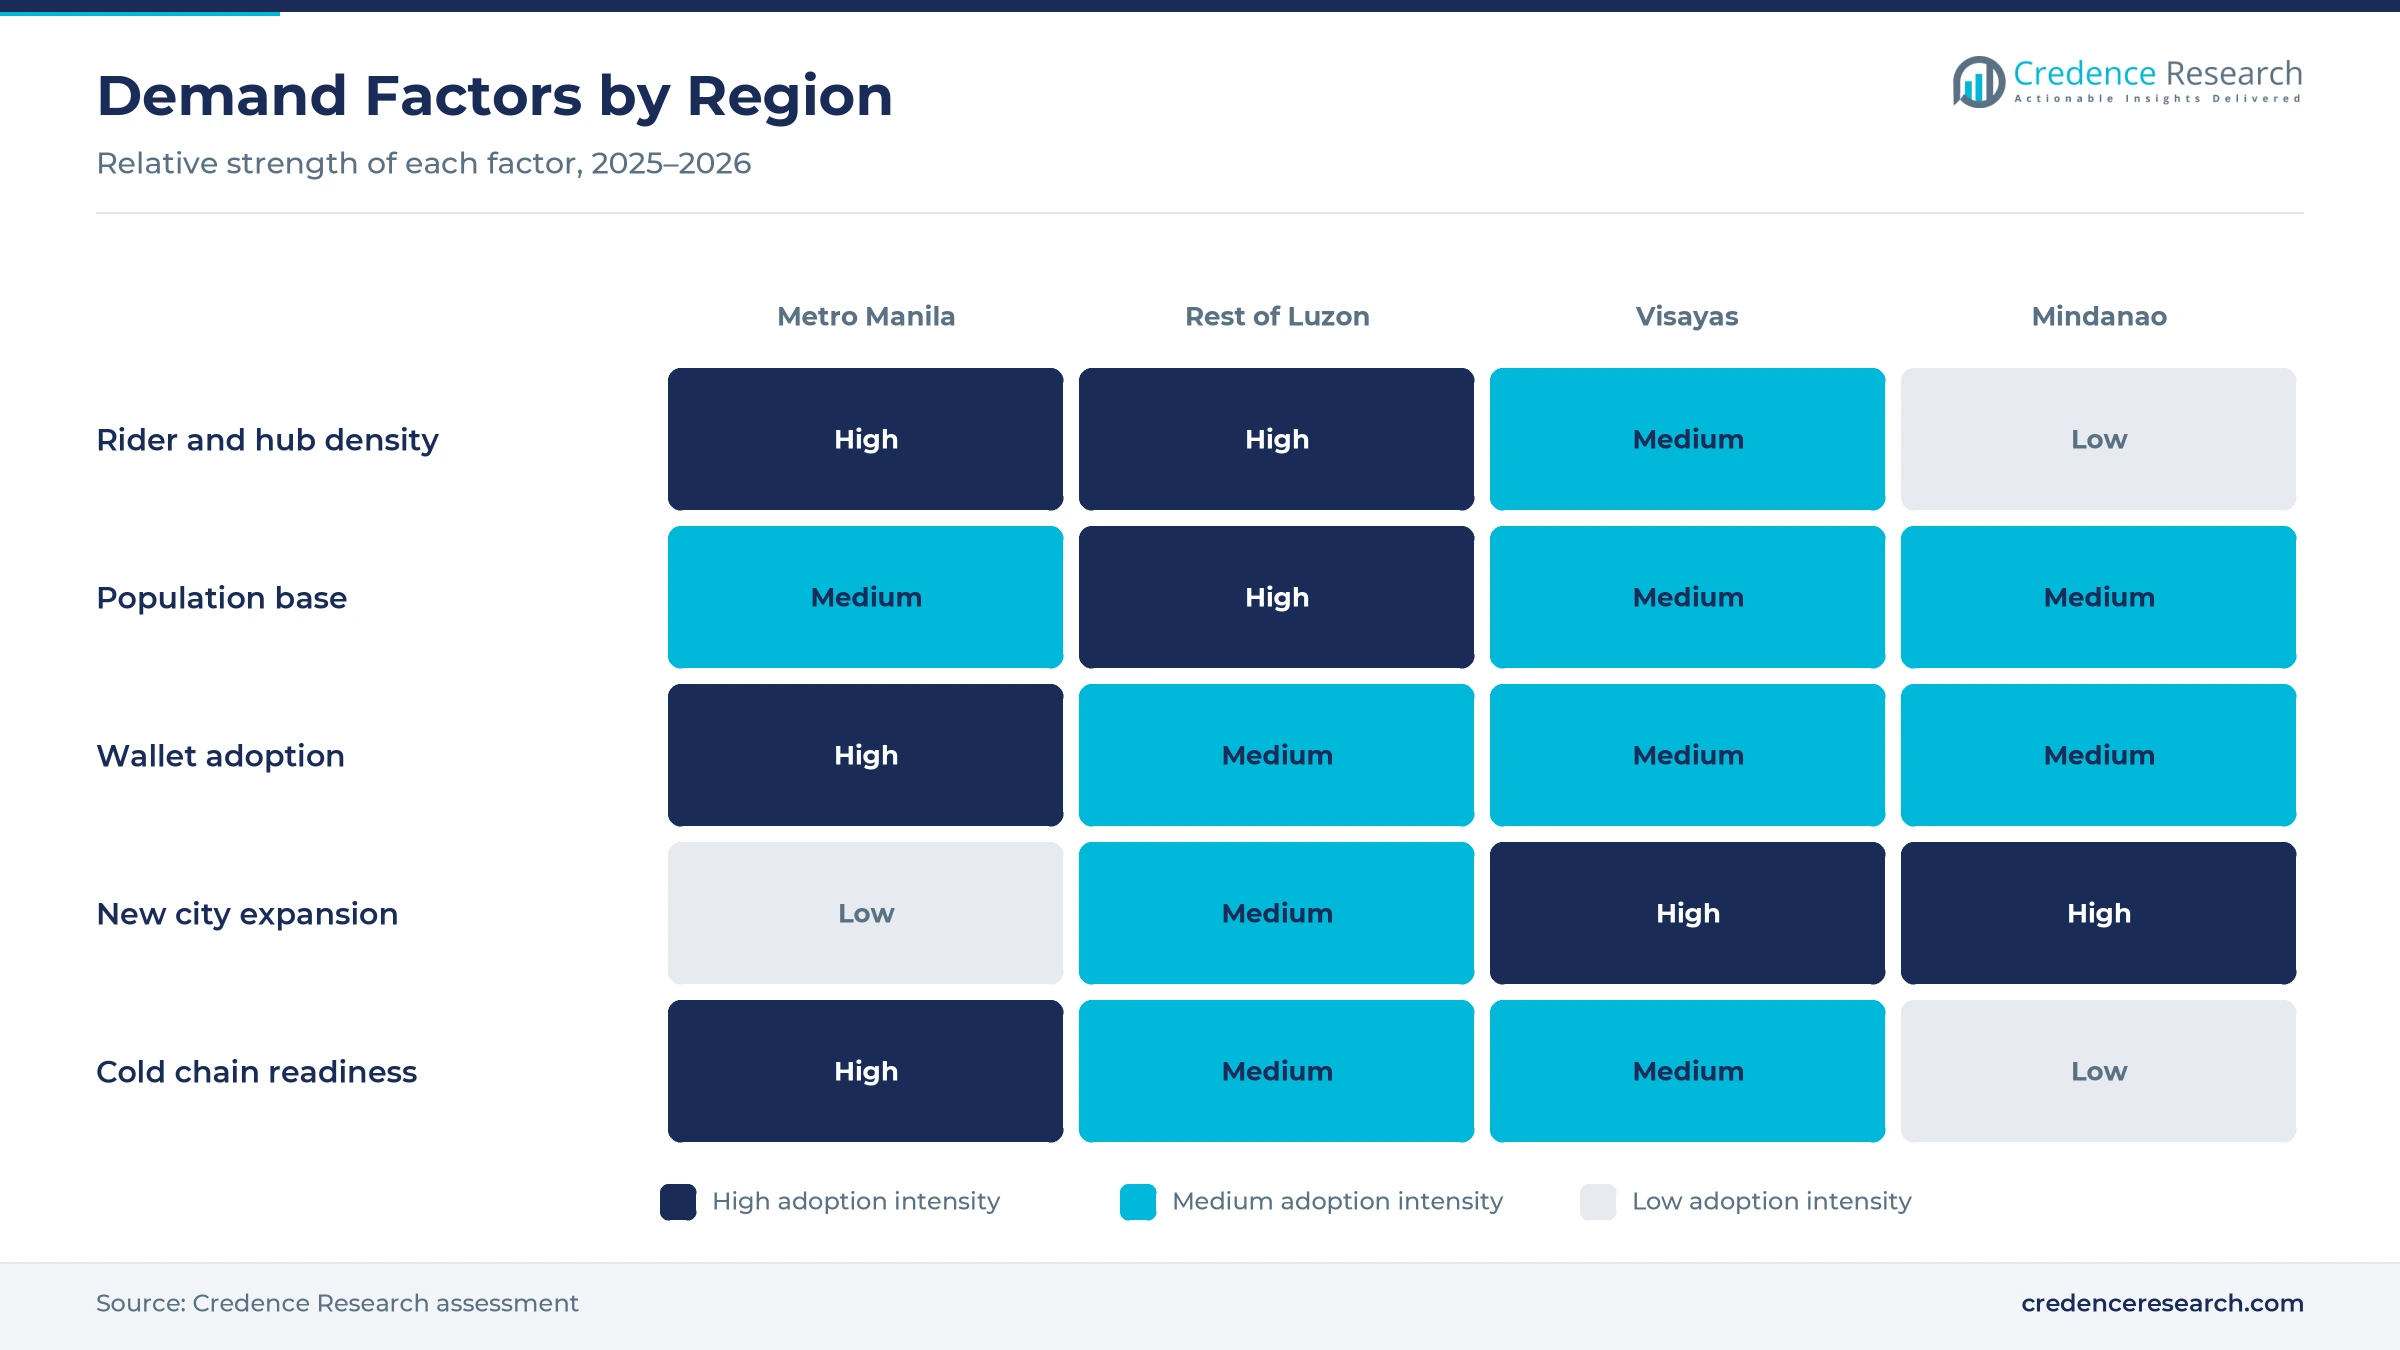
Rest of Luzon held a 35.0% share of 2025 value and grows at 16.68% a year, because CALABARZON counted 16,933,234 residents in the 2024 census, the most of any region. foodpanda runs pandamart hubs in Cavite, Laguna, Batangas, Bulacan, Pampanga and Benguet. The Calamba hub opened in July 2026 to serve Laguna households. As a result, the provinces around the capital generate the largest share of online grocery value.
How does Metro Manila anchor fast delivery?
Metro Manila held a 32.0% share of 2025 value and grows at 15.88% a year, because the capital has the densest rider fleets and the most supermarket partners. GrabMart launched in Metro Manila in April 2020 with delivery targets of about 30 minutes. foodpanda added a Caloocan hub in July 2026, and MetroMart offers two-hour delivery from partner stores. In turn, the capital remains the testing ground for new fast delivery services.
Why is the Visayas gaining online grocery orders?
The Visayas held 18.0% of 2025 value and grows at 16.88% a year, because Metro Cebu hosts pandamart hubs and a large base of digital shoppers. foodpanda extended 24-hour pandamart service to Cebu in March 2026. Marketplaces also ship packaged goods to Iloilo, Bacolod and other cities through partner couriers. As a result, the Visayas adds fast delivery in Cebu and scheduled delivery elsewhere.
How is Mindanao becoming the fastest-growing zone?
Mindanao held a 15.0% share of 2025 value and grows fastest at 17.18% a year, because platforms are opening service in Davao and other growing cities. foodpanda runs pandamart service in Davao, which offered 24-hour delivery from March 2026. Grab plans to expand delivery services to 40 additional cities in 2026. In turn, Mindanao gains new users as fast delivery reaches cities that relied on traditional markets.
Hub openings, city expansion and rule milestones
| Development | Status and market relevance |
|---|---|
| In May 2024, the government issued the implementing rules of the Internet Transactions Act for online merchants and platforms. | Sets disclosure and liability rules for e-commerce |
| In June 2025, the Internet Transactions Act became fully enforceable after its transition period ended. | Raises trust in online grocery purchases |
| In March 2026, foodpanda launched 24-hour pandamart grocery delivery nationwide, covering Metro Manila, Baguio, Cebu and Davao. | Extends round-the-clock quick commerce |
| In May 2026, Grab Philippines announced plans to expand to 40 additional cities, starting with delivery services. | Widens delivery coverage beyond the capital |
| In July 2026, foodpanda opened pandamart hubs in Calamba and Caloocan, bringing its network to 23 hubs. | Adds dark store capacity in Luzon |
Apps, routing and wallets define fast basket fulfillment
- Dark store systems track stock in online-only hubs, which lets pickers pack a basket within minutes of an order and keeps substitutions low.
- Route optimization groups orders and plans rider paths through congested streets, which cuts delivery time and cost per order in Metro Manila and Cebu.
- Wallet and QR checkout confirms payment before dispatch, which reduces failed deliveries and cash handling risk.
- Retail media tools place sponsored products in search results and live streams, which adds income beyond delivery fees.
Need a Custom Version of This Report?
Tailor the scope, geography, or segments to your exact requirements.
- Custom geography or segment scope
- Direct access to our analyst team
Marketplaces, super-apps and grocers compete on speed
Competition combines horizontal marketplaces, super-app delivery services and supermarket-owned apps. Shopee competes through Shopee Supermarket, which offers nationwide delivery with cash on delivery, wallet and card payments. Lazada competes with LazMallOne, which combines orders from several brands into one delivery. TikTok Shop competes through live selling and said local sellers grew sales more than 200% in 2025. foodpanda competes with 23 round-the-clock pandamart hubs and typical delivery of 25 to 35 minutes. GrabMart competes through the Grab super-app, which plans to reach 40 more cities in 2026. MetroMart competes with personal shoppers and two-hour delivery from partner stores, while Puregold has run an online grocery service linked to its store network. Rivals compete on speed, range, fresh quality, vouchers and payment choice.
Which platforms serve Filipino grocery shoppers?
| Company | Type | Role in the market |
|---|---|---|
| pandamart | Super-app quick commerce | Runs 23 round-the-clock dark store hubs |
| GrabMart | Super-app grocery delivery | Delivers groceries through the Grab app |
| Shopee | Horizontal marketplace | Offers Shopee Supermarket with nationwide delivery |
| Lazada | Horizontal marketplace | Combines brand orders through LazMallOne |
| TikTok Shop | Social commerce marketplace | Sells packaged goods through live streams |
| MetroMart | Dedicated online grocer | Offers two-hour delivery with personal shoppers |
Credence Research view on Filipino digital baskets
Credence Research's view is that Philippine online grocery platforms will grow quickly because e-wallets, dark stores and clearer e-commerce rules remove the main barriers to buying food online. Horizontal marketplaces remain the largest value pool, while super-app marts, quick commerce and QR payments add the fastest growth. Hub openings in Luzon, Cebu and Davao and expansion into new cities will widen reach. Platforms with dense hub networks, strong wallet links and retail media income should gain the most, while cold chain gaps and thin margins test smaller players.
How the national basket estimate was built
The report uses 2025 as the base year on a calendar basis, and market values come from the Credence Research model. That model combines official population and digital economy statistics, central bank payment data, company releases and trade media reports. Segment splits and zone growth rates are Credence Research estimates, while zone shares follow the client-provided split. Sources used are official statistics, central bank data, government releases, company releases and news reports, and no interviews or surveys were used.
Quick commerce and wallet checkout carry growth to 2035
The Philippines online grocery and delivery platforms market is expected to reach USD 11.37 billion by 2035, a 16.54% CAGR during 2026–2035, as households move routine baskets to apps and pay with wallets. Growth should be strongest in quick commerce, super-app marts and Mindanao, because these areas gain most from new hubs and city expansion. QR payments and retail media will lift platform income, while cold chain gaps, traffic and thin grocery margins could slow smaller operators.
Frequently Asked Questions
How big is the Philippines online grocery and delivery platforms market?
Which platform type leads the Philippine market?
Which region leads the Philippine market?
How common are digital payments in the Philippines?
Which delivery model is growing fastest?
What rules govern online grocery sales in the Philippines?
Who are the leading companies in the Philippine market?
What are the main challenges for online grocery platforms?
Table of Content
Chapter 1 Market Segmentation
- 1.1 Segmentation Framework
- 1.1.1 Product and Service Classification
- 1.1.2 Application and End-Use Classification
- 1.1.3 Technology and Solution Classification
- 1.1.4 Customer and Distribution Channel Classification
- 1.1.5 Geographic Segmentation
- 1.1.6 Market Segment Definitions and Boundaries
- 1.2 By Platform Type
- 1.2.1 Horizontal Marketplaces
- 1.2.2 On-Demand Super-App Mart
- 1.2.3 Dedicated Online Grocers
- 1.2.4 Retailer-Owned E-Commerce
- 1.3 By Delivery Model
- 1.3.1 Under-30-Minute Quick Commerce
- 1.3.2 Same-Day On-Demand
- 1.3.3 Scheduled Delivery
- 1.3.4 Click-and-Collect
- 1.4 By Product Category
- 1.4.1 Staples and Packaged Food
- 1.4.2 Fresh Produce and Dairy
- 1.4.3 Meat and Seafood
- 1.4.4 Household and Personal Care
- 1.5 By Payment Method
- 1.5.1 Digital Wallets
- 1.5.2 Cards
- 1.5.3 Cash on Delivery
- 1.5.4 Bank and QR Payments
Chapter 2 Introduction
- 2.1 Report Objectives and Scope
- 2.2 Product Definition and Industry Terminology
- 2.3 Market Inclusions and Exclusions
- 2.4 Research Process
- 2.4.1 Primary Research and Expert Interviews
- 2.4.2 Secondary Research and Source Review
- 2.4.3 Top-Down and Bottom-Up Estimation
- 2.4.4 Data Triangulation and Verification
- 2.5 Market Size Measurement Basis
- 2.5.1 2025: USD 2.32 billion → 2035: USD 11.37 billion
- 2.6 Historical and Forecast Reference Periods
- 2.6.1 Historical Period: 2018-2025
- 2.6.2 Base Year: 2025
- 2.6.3 Forecast Period: 2025-2035
- 2.7 Research Assumptions and Limitations
Chapter 3 Executive Summary
- 3.1 Market Snapshot and Key Findings
- 3.2 Base-Year Market Size, 2025
- 3.3 Forecast Market Size, 2035
- 3.4 Revenue and Volume Growth Outlook
- 3.5 Key Demand and Supply Indicators
- 3.6 Leading Market Segments
- 3.7 Fastest-Growing Market Opportunities
- 3.8 Regional Performance Highlights
- 3.9 Technology and Industry Transformation
- 3.10 Competitive Landscape Summary
- 3.11 Analyst View and Strategic Implications
Chapter 4 Philippines Online Grocery & Delivery Platforms Market Trends and Developments
- 4.1 Historical Industry Development, 2018-2025
- 4.2 Recent Market Trends and Developments
- 4.3 Demand and Customer Behavior Trends
- 4.4 Technology and Product Innovation
- 4.5 Artificial Intelligence, Automation and Digitalization
- 4.6 Local Manufacturing and Supply Chain Realignment
- 4.7 Industry Partnerships, Mergers and Acquisitions
- 4.8 Sustainability and Circular Economy Developments
- 4.9 Government and Private Sector Investment Trends
- 4.10 Emerging Business Models and Commercialization
- 4.11 Industry Developments and Announcements
Chapter 5 Philippines Online Grocery & Delivery Platforms Market Production, Supply and Demand Analysis
- 5.1 Demand Trend and Consumption Analysis, 2018-2025
- 5.2 Demand Forecast, 2025-2035
- 5.3 Production and Output Trend, 2018-2025
- 5.4 Production and Output Forecast, 2025-2035
- 5.5 Installed Capacity and Capacity Utilization
- 5.6 Company-Wise Production Plants and Statistics
- 5.6.1 Installed Production Capacity
- 5.6.2 Actual Production
- 5.6.3 Planned Capacity and Expansion Targets
- 5.7 Supply Chain Structure and Procurement Trends
- 5.8 Supply-Demand Gap and Bottlenecks
- 5.9 Import Dependence and Sourcing Structure
- 5.10 Contract Manufacturing and Outsourcing
- 5.11 Regional Supply and Demand Concentration
Chapter 6 Philippines Online Grocery & Delivery Platforms Market Pricing Analysis
- 6.1 Pricing Structure and Measurement
- 6.2 Historical Pricing Trends, 2018-2025
- 6.3 Pricing Outlook, 2025-2035
- 6.4 Average Selling Price and Unit Economics
- 6.5 Pricing by Product and Market Segment
- 6.6 Geographic Pricing Differences
- 6.7 Key Input, Energy, Labor and Logistics Costs
- 6.8 Contract Pricing and Purchasing Models
- 6.9 Pricing Sensitivity and Competitive Positioning
- 6.10 Price, Margin and Profitability Implications
Chapter 7 Philippines Online Grocery & Delivery Platforms Market Dynamics
- 7.1 Market Growth Drivers
- 7.1.1 Demand-Side Drivers
- 7.1.2 Technology and Innovation Drivers
- 7.1.3 Infrastructure and Investment Drivers
- 7.1.4 Regulatory and Policy Drivers
- 7.2 Market Restraints
- 7.2.1 Cost and Affordability Constraints
- 7.2.2 Technology and Adoption Barriers
- 7.2.3 Supply Chain and Operational Constraints
- 7.3 Market Challenges
- 7.3.1 Competitive Pressure and Margin Erosion
- 7.3.2 Skills, Infrastructure and Implementation Gaps
- 7.4 Emerging Market Opportunities
- 7.5 Market Dynamics Impact and Time-Horizon Assessment
Chapter 8 Philippines Online Grocery & Delivery Platforms Value Chain Analysis
- 8.1 Industry Value Chain Overview
- 8.2 Upstream Suppliers and Critical Inputs
- 8.3 Technology and Component Providers
- 8.4 Manufacturing or Service Delivery
- 8.5 Distribution, Channel Partners and Integrators
- 8.6 Downstream Applications and End Users
- 8.7 Value Addition and Profit Pools
- 8.8 Vertical Integration and Outsourcing
- 8.9 Supplier Concentration and Risk
- 8.10 Supply Chain Localization and Resilience
Chapter 9 Philippines Online Grocery & Delivery Platforms Market Regulations and Policies
- 9.1 Relevant Laws, Standards and Compliance Frameworks
- 9.2 Product, Service, Safety and Quality Requirements
- 9.3 Government Policies, Incentives and Subsidies
- 9.4 Imports, Exports and Trade Barriers
- 9.5 Public Procurement and Local Content Requirements
- 9.6 Environmental and Sustainability Compliance
- 9.7 Upcoming Policy Changes and Market Implications
Chapter 10 Philippines Online Grocery & Delivery Platforms Market Hotspots and Opportunities
- 10.1 Market Opportunity Mapping and Growth Hotspots
- 10.2 High-Growth Applications and Customer Groups
- 10.3 Underserved Markets and White-Space Opportunities
- 10.4 Emerging Technology and Product Opportunities
- 10.5 New Capacity and Investment Hotspots
- 10.6 Market Entry and Expansion Opportunities
- 10.7 Distribution and Partnership Opportunities
- 10.8 Near-Term and Long-Term Commercial Potential
- 10.9 Opportunity Attractiveness and Execution Risks
Chapter 11 Philippines Online Grocery & Delivery Platforms Market Outlook, 2025-2035
- 11.1 Market Size and Analysis
- 11.1.1 Revenue (Market Measurement: 2025: USD 2.32 billion → 2035: USD 11.37 billion)
- 11.1.2 Market Volume and Quantity Sold
- 11.1.3 Historical Market Size, 2018-2025
- 11.1.4 Base-Year Market Size, 2025
- 11.2 Market Forecast, 2025-2035
- 11.2.1 Revenue Forecast to 2035
- 11.2.2 Volume Forecast to 2035
- 11.2.3 CAGR and Year-on-Year Growth
- 11.2.4 Incremental Revenue Opportunity
- 11.3 Forecast Assumptions and Scenario Analysis
- 11.3.1 Base-Case Forecast
- 11.3.2 Optimistic and Conservative Scenarios
- 11.3.3 Technology, Pricing and Policy Sensitivities
- 11.4 Market Attractiveness and Growth Outlook
Chapter 12 Philippines Online Grocery & Delivery Platforms Market Segmentation and Outlook
- 12.1 Segmentation Summary and Market Shares, 2025
- 12.2 Largest and Fastest-Growing Segments
- 12.3 By Platform Type - Market Size and Forecast, 2025-2035
- 12.3.1 Segment Definition and Scope
- 12.3.2 Historical Market Size, 2018-2025
- 12.3.3 Revenue Forecast, 2025-2035
- 12.3.4 Volume Forecast, 2025-2035
- 12.3.5 Base-Year Market Share, 2025
- 12.3.6 Segment CAGR and Growth Drivers
- 12.3.7 Subsegment Market Size and Forecast
- 12.3.7.1 Horizontal Marketplaces
- 12.3.7.2 On-Demand Super-App Mart
- 12.3.7.3 Dedicated Online Grocers
- 12.3.7.4 Retailer-Owned E-Commerce
- 12.3.8 Subsegment Pricing and Adoption Trends
- 12.3.9 Leading Suppliers and Competition
- 12.3.10 Regional Demand and Opportunities
- 12.4 By Delivery Model - Market Size and Forecast, 2025-2035
- 12.4.1 Segment Definition and Scope
- 12.4.2 Historical Market Size, 2018-2025
- 12.4.3 Revenue Forecast, 2025-2035
- 12.4.4 Volume Forecast, 2025-2035
- 12.4.5 Base-Year Market Share, 2025
- 12.4.6 Segment CAGR and Growth Drivers
- 12.4.7 Subsegment Market Size and Forecast
- 12.4.7.1 Under-30-Minute Quick Commerce
- 12.4.7.2 Same-Day On-Demand
- 12.4.7.3 Scheduled Delivery
- 12.4.7.4 Click-and-Collect
- 12.4.8 Subsegment Pricing and Adoption Trends
- 12.4.9 Leading Suppliers and Competition
- 12.4.10 Regional Demand and Opportunities
- 12.5 By Product Category - Market Size and Forecast, 2025-2035
- 12.5.1 Segment Definition and Scope
- 12.5.2 Historical Market Size, 2018-2025
- 12.5.3 Revenue Forecast, 2025-2035
- 12.5.4 Volume Forecast, 2025-2035
- 12.5.5 Base-Year Market Share, 2025
- 12.5.6 Segment CAGR and Growth Drivers
- 12.5.7 Subsegment Market Size and Forecast
- 12.5.7.1 Staples and Packaged Food
- 12.5.7.2 Fresh Produce and Dairy
- 12.5.7.3 Meat and Seafood
- 12.5.7.4 Household and Personal Care
- 12.5.8 Subsegment Pricing and Adoption Trends
- 12.5.9 Leading Suppliers and Competition
- 12.5.10 Regional Demand and Opportunities
- 12.6 By Payment Method - Market Size and Forecast, 2025-2035
- 12.6.1 Segment Definition and Scope
- 12.6.2 Historical Market Size, 2018-2025
- 12.6.3 Revenue Forecast, 2025-2035
- 12.6.4 Volume Forecast, 2025-2035
- 12.6.5 Base-Year Market Share, 2025
- 12.6.6 Segment CAGR and Growth Drivers
- 12.6.7 Subsegment Market Size and Forecast
- 12.6.7.1 Digital Wallets
- 12.6.7.2 Cards
- 12.6.7.3 Cash on Delivery
- 12.6.7.4 Bank and QR Payments
- 12.6.8 Subsegment Pricing and Adoption Trends
- 12.6.9 Leading Suppliers and Competition
- 12.6.10 Regional Demand and Opportunities
- 12.7 Segment Growth Comparison
- 12.8 Segment Attractiveness and Priority Matrix
Chapter 13 Philippines Online Grocery & Delivery Platforms Geographic Market Outlook, 2025-2035
- 13.1 Domestic Market Distribution and Demand Clusters
- 13.2 State- or Province-Wise Market Size and Forecast, 2025-2035
- 13.3 City and Metropolitan Market Outlook
- 13.4 Industrial, Manufacturing and Commercial Clusters
- 13.5 Geographic Concentration of Key End Users
- 13.6 Local Pricing and Purchasing Differences
- 13.7 Domestic Production Facilities and Capacity Map
- 13.8 Local Infrastructure and Project Pipeline
- 13.9 State-Level Policy and Incentive Differences
- 13.10 Subnational Investment Hotspots and Opportunities
- 13.11 Distribution and Logistics Networks
- 13.12 Domestic Competitive Footprint
Chapter 14 Philippines Online Grocery & Delivery Platforms Technology, Innovation and Sustainability Outlook
- 14.1 Technology Landscape and Maturity
- 14.2 Product, Process and Service Innovation
- 14.3 AI, Automation and Digital Tools in the Industry
- 14.4 Technology Adoption and Performance Benchmarking
- 14.5 Innovation Pipeline and R&D Investment
- 14.6 Patent and Intellectual Property Trends
- 14.7 Energy Efficiency and Resource Management
- 14.8 Sustainability, Recycling and Circularity
- 14.9 Technology Roadmap, 2025-2035
- 14.10 Risks of Obsolescence and Technology Substitution
Chapter 15 Philippines Online Grocery & Delivery Platforms Market Key Strategic Imperatives
- 15.1 Growth and Market Entry Priorities
- 15.2 High-Return Products and Segments
- 15.3 Pricing, Profitability and Cost Optimization
- 15.4 Technology Investment and Product Differentiation
- 15.5 Supply Chain Localization and Resilience
- 15.6 Distribution and Customer Acquisition
- 15.7 Partnership, Acquisition and Capacity Strategy
- 15.8 Regional Expansion Priorities
- 15.9 Short-, Medium- and Long-Term Actions
Chapter 16 Competition Outlook
- 16.1 Industry Competition Characteristics
- 16.2 Market Structure and Concentration
- 16.3 Market Share and Competitive Positioning, 2025
- 16.4 Company-Wise Revenue and Product Benchmarking
- 16.5 Production and Service Capacity Benchmarking
- 16.6 Technology, Pricing and Differentiation
- 16.7 Regional Footprint and Distribution Strength
- 16.8 Mergers, Acquisitions and Strategic Alliances
- 16.9 New Entrants and Competitive Threats
- 16.10 Porter's Five Forces and Industry Attractiveness
- 16.11 Competitive Outlook, 2025-2035
Chapter 17 Company Profiles
- 17.1 Company Coverage and Selection Criteria
- 17.2 Shopee
- 17.2.1 Business Description
- 17.2.2 Company Ownership and Geographic Presence
- 17.2.3 Product and Service Portfolio
- 17.2.4 Manufacturing and Operating Footprint
- 17.2.5 Production Capacity and Expansion Plans
- 17.2.6 Financial Performance and Investment
- 17.2.7 Market Share and Competitive Position
- 17.2.8 Technology and Innovation Capabilities
- 17.2.9 Strategic Alliances or Partnerships
- 17.2.10 Recent Developments
- 17.2.11 Growth Strategy and Outlook
- 17.3 TikTok Shop
- 17.4 Lazada
- 17.5 GrabMart
- 17.6 pandamart
- 17.7 MetroMart
- 17.8 SM Markets
- 17.9 Puregold Mobile
- 17.10 Other Relevant Market Participants
Note: Every listed company is profiled on the structure shown under the first company. The company list is preliminary and may change based on research findings, market developments, data availability and client requirements.
Chapter 18 Disclaimer
- 18.1 Research and Forecast Disclaimer
- 18.2 Data Source and Estimation Limitations
Note: The depth of individual sections depends on data availability for this market. Volume, capacity, trade and other unit-based metrics are included where applicable.

