
Indonesia Sustainable Tourism Market Overview:
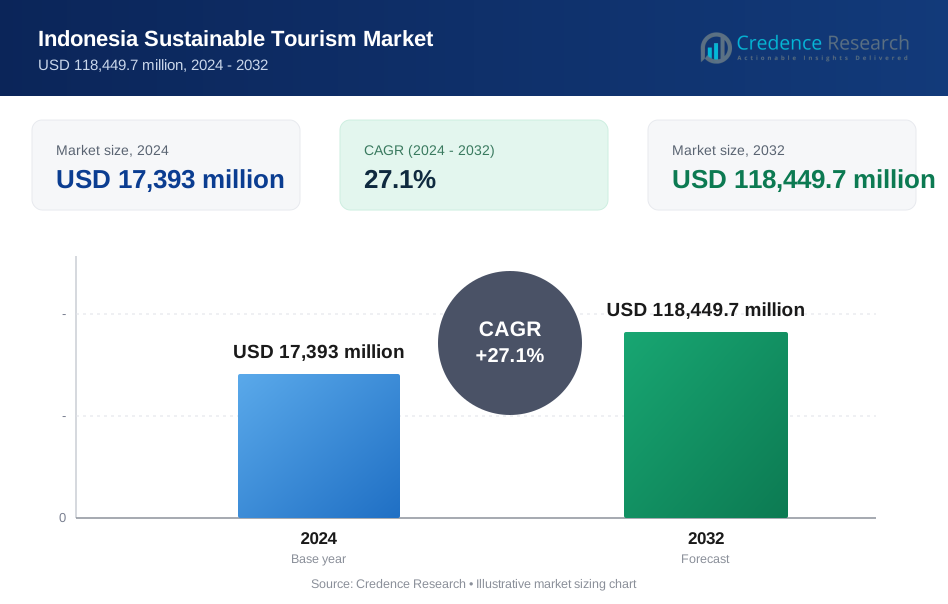
Indonesia’s sustainable tourism market was valued at USD 17,393 million in 2024 and is projected to reach USD 118,449.7 million by 2032, expanding at a robust CAGR of 27.1% during the forecast period.
| REPORT ATTRIBUTE | DETAILS |
|---|---|
| Historical Period | 2020-2023 |
| Base Year | 2024 |
| Forecast Period | 2025-2032 |
| Indonesia Sustainable Tourism Market Size 2024 | USD 17,393 million |
| Indonesia Sustainable Tourism Market, CAGR | 27.1% |
| Indonesia Sustainable Tourism Market Size 2032 | USD 118,449.7 million |
Indonesia Sustainable Tourism Market Insights
- Strong government support for sustainable destination management, conservation-led tourism policies, and promotion of high-value, low-impact travel is a key driver, alongside rising global demand for eco-tourism, community tourism, and responsible marine and nature-based experiences.
- Key market trends include the dominance of eco-tourism as the leading segment, driven by biodiversity-focused travel, and online booking as the largest booking channel, supported by high digital adoption and sustainability-focused travel platforms.
- The competitive landscape is moderately fragmented, with eco-tour operators, local community-based providers, and international travel companies competing through immersive experiences, eco-certifications, and partnerships with conservation and local stakeholders.
- Regionally, Bali leads with ~39% market share, followed by Java (22-24%), Sumatra (14-16%), Sulawesi & Eastern Indonesia (12-14%), and Kalimantan (8-10%), reflecting a shift toward diversified, conservation-driven regional tourism growth.
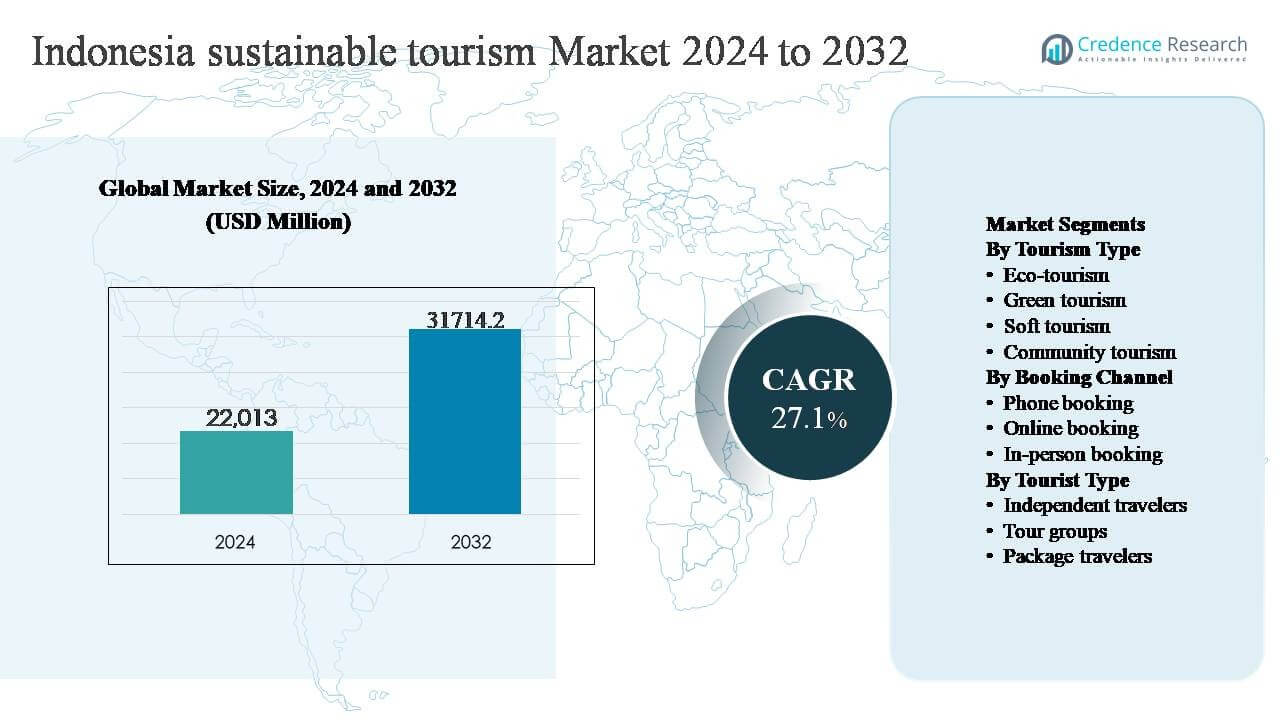
Indonesia Sustainable Tourism Market Segmentation Analysis:
By Tourism Type
By tourism type, eco-tourism represents the dominant sub-segment in Indonesia’s sustainable tourism market, accounting for the largest share due to the country’s exceptional biodiversity, extensive protected areas, and strong global appeal of destinations such as national parks, coral reefs, and rainforest ecosystems. Demand is driven by international and domestic travelers seeking low-impact, nature-based experiences aligned with conservation and wildlife protection. Government-backed eco-certification programs, limits on mass tourism in sensitive zones, and investments in eco-lodges and conservation tourism further strengthen eco-tourism’s leadership over green, soft, and community tourism offerings.
- For instance, Plataran Indonesia operates conservation-focused eco-resorts adjacent to Komodo National Park and Bromo Tengger Semeru National Park, where it directly supports habitat protection programs covering more than 3,000 hectares, manages on-site waste segregation and composting systems processing over 120 tonnes of organic waste annually, and deploys solar installations generating over 500 kWp across its eco-properties.
By Booking Channel
By booking channel, online booking holds the dominant market share, supported by rising digital adoption, widespread smartphone usage, and the strong presence of global and regional travel platforms. Travelers increasingly prefer online channels for their convenience, transparency, and ability to compare eco-certified accommodations and sustainable tour packages. Integration of sustainability filters, digital payment systems, and real-time availability has accelerated this shift. While phone and in-person bookings remain relevant for remote destinations and community-based tourism, digital platforms continue to drive volume growth and customer reach across Indonesia’s sustainable tourism ecosystem.
- "For instance, Traveloka has direct operations in 8 countries (including Indonesia, Australia, and Japan) and has achieved over 140 million app downloads. The platform integrates a wide variety of digital payment instruments such as credit cards, bank transfers, and e-wallets like GrabPay enabling end-to-end mobile transactions for sustainable travel options, including eco-lodges and nature-based tours across Indonesia."
By Tourist Type
By tourist type, independent travelers form the dominant sub-segment, driven by growing demand for personalized, flexible, and immersive travel experiences. Sustainability-focused travelers increasingly design self-guided itineraries to engage directly with nature reserves, local communities, and eco-friendly accommodations. This segment benefits from easy access to online planning tools, sustainable travel apps, and localized experiences that align with responsible tourism values. Although tour groups and package travelers contribute to market stability, especially in remote regions, independent travelers lead adoption by prioritizing authenticity, environmental responsibility, and cultural engagement.
Key Growth Drivers
Government-Led Sustainable Tourism Policies and Destination Management
Strong policy support is a primary growth driver for Indonesia’s sustainable tourism market. The government has prioritized sustainability through national tourism master plans, low-impact destination zoning, and strict visitor caps in ecologically sensitive areas. Programs promoting eco-certification, waste reduction, renewable energy adoption in hospitality, and marine conservation have improved destination resilience while protecting natural assets. Flagship initiatives in priority destinations such as Bali, Labuan Bajo, and Raja Ampat emphasize quality tourism over volume, encouraging higher-value, environmentally responsible travel. Public investments in sustainable infrastructure, including clean transport, waste management, and community tourism facilities, further enhance long-term viability. These measures create regulatory clarity and investor confidence, accelerating the development of eco-resorts, conservation-based experiences, and community-led tourism enterprises across Indonesia.
- For instance, Bali’s sustainable destination management initiatives include electric bus pilots on high-traffic corridors, specifically the Trans Metro Dewata (TMD) Corridor 6 (Kuta–Airport–Nusa Dua), which began trials in August 2025.
Rising Global Demand for Nature-Based and Responsible Travel
Growing awareness of climate change, biodiversity loss, and cultural preservation is reshaping traveler preferences, significantly benefiting Indonesia’s sustainable tourism sector. International and domestic tourists increasingly seek nature-based experiences that minimize environmental impact while supporting local communities. Indonesia’s diverse ecosystems ranging from rainforests and volcanoes to coral reefs and mangroves position the country as a prime destination for eco-conscious travelers. Demand is particularly strong for wildlife tourism, marine conservation activities, and immersive cultural experiences. This shift toward responsible travel is driving longer stays, higher per-trip spending, and repeat visitation. As sustainability becomes a core decision factor, operators offering certified eco-experiences gain a competitive advantage, reinforcing market growth.
- For instance, Misool Eco Resort in Raja Ampat operates within a privately managed marine reserve protecting more than 122,000 hectares of reef and coastal habitat, employs over 150 local residents, and supports patrol operations that have conducted over 15,000 hours of marine monitoring to curb illegal fishing since the reserve’s establishment.
Private Investment in Eco-Friendly Hospitality and Experiences
Rising private-sector investment is accelerating the expansion of sustainable tourism offerings in Indonesia. Hospitality groups, local entrepreneurs, and international investors are increasingly developing eco-lodges, low-carbon resorts, and renewable energy-powered accommodations. Investment also extends to sustainable tour operations, conservation-linked experiences, and community-based tourism enterprises. These projects emphasize energy efficiency, water conservation, waste reduction, and local sourcing, aligning with global sustainability standards. Financial institutions and impact investors are supporting these initiatives through green financing and sustainability-linked funding. This influx of capital enhances service quality, expands capacity in underserved regions, and strengthens Indonesia’s ability to meet growing demand for responsible tourism experiences.
Key Trends & Opportunities
Expansion of Community-Based and Indigenous Tourism Models
Community-based tourism is emerging as a major opportunity within Indonesia’s sustainable tourism landscape. Travelers increasingly seek authentic cultural engagement, creating demand for locally managed homestays, guided village tours, and traditional craft and culinary experiences. These models enable communities to retain economic value while preserving cultural heritage and natural resources. Government and NGO support for training, capacity building, and digital access is improving service standards and market visibility for rural destinations. As travelers prioritize social impact and equitable tourism, community-led initiatives are well positioned to scale, particularly in lesser-known islands and rural regions, reducing overdependence on established tourism hubs.
- For instance, Airbnb’s community-based tourism initiatives in Indonesia have supported thousands of locally hosted stays, with hosts in rural areas generating income directly from spare-room and homestay accommodations while preserving traditional housing styles.
Digital Platforms Enabling Sustainable Travel Choices
Digitalization is transforming how sustainable tourism products are marketed, discovered, and booked. Online platforms increasingly highlight eco-certifications, carbon-conscious travel options, and community experiences, empowering travelers to make informed choices. Data-driven personalization, mobile apps, and seamless digital payments improve access to sustainable tourism offerings across Indonesia. For operators, digital tools enable broader reach, dynamic pricing, and improved demand forecasting. This trend creates significant opportunities for small and medium-sized sustainable tourism providers to compete with larger operators, accelerating market penetration and supporting inclusive growth.
- For instance, K.B.A Tur (PT. Karang Bali Asli Tur), a professional Destination Management Company (DMC) with over 25 years of experience, specializes in bespoke Indonesian travel solutions. The company provides curated thematic experiences including cultural, adventure, and luxury tours supported by a network of local partners.
Integration of Sustainability with Premium and Experiential Tourism
Sustainability is increasingly integrated with premium travel experiences, creating opportunities for higher-value tourism. Eco-luxury resorts, conservation-linked cruises, and exclusive nature-based experiences cater to travelers willing to pay more for responsible travel. These offerings emphasize privacy, environmental stewardship, and personalized experiences rather than mass tourism. This trend supports revenue growth while limiting ecological strain, aligning with Indonesia’s strategy of attracting quality-focused visitors. As experiential tourism continues to gain traction, sustainable premium offerings are expected to play a critical role in shaping future market expansion.
Key Challenges
Infrastructure Gaps and Uneven Regional Development
Despite strong growth prospects, infrastructure limitations remain a key challenge for sustainable tourism development in Indonesia. Many high-potential destinations lack adequate transport connectivity, waste management systems, clean water access, and digital infrastructure. These gaps constrain visitor capacity, increase operational costs, and limit service quality, particularly in remote and emerging regions. While flagship destinations receive significant investment, uneven development risks overconcentration and environmental pressure in established hubs. Addressing infrastructure disparities is essential to unlocking sustainable tourism growth across the broader archipelago and ensuring balanced regional development.
Balancing Tourism Growth with Environmental Carrying Capacity
Managing environmental impact remains a critical challenge as visitor numbers rise. Fragile ecosystems such as coral reefs, rainforests, and small islands face risks from overuse, pollution, and unregulated development. Ensuring compliance with sustainability standards across diverse operators is complex, particularly among small and informal businesses. Without effective monitoring and enforcement, rapid growth could undermine the very natural assets that drive demand. Strengthening destination governance, improving data-driven visitor management, and enforcing sustainability regulations are essential to maintaining long-term ecological balance and market credibility.
Regional Analysis
Bali
Bali dominates Indonesia’s sustainable tourism market, accounting for approximately 38-40% market share, driven by its advanced eco-tourism infrastructure, strong international brand recognition, and early adoption of sustainability regulations. The island leads in eco-certified hotels, renewable energy integration in hospitality, waste reduction programs, and community-based tourism models. Visitor caps, green taxation, and conservation-focused destination management support quality tourism over volume. High demand for eco-luxury resorts, wellness tourism, and marine conservation experiences continues to attract high-spending travelers, reinforcing Bali’s position as the country’s flagship sustainable tourism hub.
Java
Java represents around 22-24% of the sustainable tourism market, supported by strong domestic tourism, cultural heritage sites, and improving green urban tourism initiatives. Sustainable tourism growth is driven by eco-conscious city tourism, heritage conservation in destinations such as Yogyakarta and Bandung, and increasing adoption of green hotels and low-impact transport solutions. Java benefits from superior transport connectivity and digital booking penetration, encouraging short-duration sustainable travel experiences. Government-backed cultural preservation and responsible tourism programs further strengthen Java’s role, particularly in educational, cultural, and community-led tourism offerings.
Sumatra
Sumatra accounts for approximately 14-16% market share, driven by eco-tourism centered on rainforests, wildlife conservation, and national parks. Destinations focused on orangutan habitats, volcanic landscapes, and lake ecosystems attract nature-focused travelers seeking low-impact experiences. Sustainable tourism development is supported by conservation-linked tourism initiatives, eco-lodges, and community involvement in forest protection. While infrastructure gaps limit large-scale growth, Sumatra’s strong biodiversity appeal and increasing international interest in conservation tourism position the region as a key growth contributor within Indonesia’s sustainable tourism landscape.
Kalimantan
Kalimantan holds an estimated 8-10% market share, supported by its role as a biodiversity hotspot and a center for rainforest and river-based eco-tourism. Sustainable tourism is driven by conservation tourism, indigenous cultural experiences, and wildlife-focused travel linked to forest preservation efforts. The region benefits from increasing attention to responsible tourism as part of broader environmental protection initiatives. Although limited accessibility constrains visitor volumes, Kalimantan’s emphasis on low-density, high-impact tourism aligns strongly with sustainable tourism principles, supporting steady long-term growth.
Sulawesi and Eastern Indonesia
Sulawesi and Eastern Indonesia collectively account for around 12-14% of the market, led by marine eco-tourism, coral reef conservation, and island-based community tourism. Destinations such as Raja Ampat and Wakatobi drive demand for sustainable diving, marine biodiversity experiences, and conservation-linked travel. Growth is supported by strict environmental regulations, community participation, and international recognition of marine ecosystems. While infrastructure development remains gradual, the region’s exceptional natural assets and focus on high-value, low-impact tourism continue to strengthen its contribution to Indonesia’s sustainable tourism market.
Indonesia Sustainable Tourism Market Segmentations:
By Tourism Type
- Eco-tourism
- Green tourism
- Soft tourism
- Community tourism
By Booking Channel
- Phone booking
- Online booking
- In-person booking
By Tourist Type
- Independent travelers
- Tour groups
- Package travelers
By Geography
- Bali
- Java
- Sumatra
- Kalimantan
- Sulawesi and Eastern Indonesia
Competitive Landscape
The competitive landscape of Indonesia’s sustainable tourism market is moderately fragmented, comprising international hospitality groups, regional eco-resort operators, local tour providers, and community-based enterprises. Leading players differentiate through eco-certifications, low-impact accommodation designs, renewable energy adoption, and conservation-linked tourism experiences. Established operators in destinations such as Bali and Eastern Indonesia leverage strong brand recognition, integrated sustainability practices, and premium service offerings to capture high-value travelers. Meanwhile, local and community-led operators compete by delivering authentic cultural and nature-based experiences with direct economic benefits to residents. Strategic partnerships with conservation organizations, government agencies, and digital travel platforms are increasingly common, enabling operators to enhance credibility and market reach. Innovation in experiential tourism, marine conservation programs, and eco-luxury hospitality remains a key competitive factor, as companies align business growth with environmental stewardship and long-term destination sustainability.
Key Player Analysis
- Azimuth Adventure Travel Ltd
- Delokal -Travel Like Local
- Exo Travel Indonesia
- Happy Trails! Asia - Indonesia
- Javaindo Ecotourism Tour & Services
- K.B.A Tur (PT. Karang Bali Asli Tur)
- Satguru Indonesia -Travel Management Company
- Sumatra Eco Travel Bukit Lawang -Tours & Treks
- Travelxism Sustainable Tour
- Altai Travel
Recent Developments
- In November 2025, EXO Travel Indonesia released a Product & Destination Update introducing a set of new and refreshed tour programmes tailored for families, couples, and friends exploring Java and Bali, with curated experiences emphasizing cultural depth and nature immersion that align with responsible travel preferences.
- In October 2025, Exo Travel Indonesia Field insights from EXO Indonesia’s inspection included an extensive ten-day product evaluation across Flores & Komodo, demonstrating EXO’s commitment to evolving nature-based tourism offerings and deep-dive destination research to integrate local environmental and cultural narratives into tour design.
Report Coverage
The research report offers an in-depth analysis based on Tourism type, Booking channel, Tourist type and Geography. It details leading market players, providing an overview of their business, product offerings, investments, revenue streams, and key applications. Additionally, the report includes insights into the competitive environment, SWOT analysis, current market trends, as well as the primary drivers and constraints. Furthermore, it discusses various factors that have driven market expansion in recent years. The report also explores market dynamics, regulatory scenarios, and technological advancements that are shaping the industry. It assesses the impact of external factors and global economic changes on market growth. Lastly, it provides strategic recommendations for new entrants and established companies to navigate the complexities of the market.
Future Outlook
- Sustainable tourism will continue shifting toward quality-driven, low-impact travel rather than volume-based mass tourism.
- Eco-tourism and nature-based experiences will remain the dominant growth segments, supported by biodiversity conservation efforts.
- Community-based and indigenous tourism models will expand, increasing local economic participation and cultural preservation.
- Digital platforms will play a larger role in promoting certified sustainable experiences and transparent travel choices.
- Eco-certified and carbon-conscious accommodations will see higher adoption across established and emerging destinations.
- Marine and coastal sustainability initiatives will strengthen demand for responsible diving, snorkeling, and island tourism.
- Investment in sustainable infrastructure will improve accessibility to underdeveloped regions across the archipelago.
- Premium and experiential sustainable tourism offerings will attract higher-spending international travelers.
- Stronger regulatory enforcement will improve environmental protection and destination carrying capacity management.
- Indonesia will strengthen its position as a leading sustainable tourism destination in Southeast Asia.
Request a Free Sample
Fill in your details and we'll send you a free sample report.
- Sample data tables & charts
- Research methodology
Need a Custom Version of This Report?
Tailor the scope, geography, or segments to your exact requirements.
- Custom geography or segment scope
- Direct access to our analyst team
Frequently Asked Questions
What is the current market size for Indonesia sustainable tourism, and what is its projected size in 2032?
At what Compound Annual Growth Rate is the Indonesia sustainable tourism projected to grow between 2024 and 2032?
Which Indonesia sustainable tourism segment held the largest share in 2024?
What are the primary factors fueling the growth of the Indonesia sustainable tourism market?
Who are the leading companies in the Indonesia sustainable tourism market?
Which region commanded the largest share of the Indonesia sustainable tourism market in 2024?
Table of Content
Chapter 1. Report Introduction
- 1.1 Report Description & Purpose
- 1.1.1 Report Title & Market Definition
- 1.1.2 Unique Selling Propositions (USP) & Key Differentiators
- 1.1.3 Value Proposition for Stakeholders
- 1.2 Research Objectives
- 1.2.1 Market Sizing Objectives (Volume & Revenue)
- 1.2.2 Segmentation Objectives
- 1.2.3 Competitive Intelligence Objectives
- 1.2.4 Forecast & Scenario Objectives
- 1.3 Report Scope
- 1.3.1 Indonesia Sustainable Tourism Scope – Types & Subtypes Covered
- 1.3.2 Geographic Scope – Regions & Countries Covered
- 1.3.3 Historical Period, Base Year & Forecast Period (2024; forecast to 2032)
- 1.3.4 Inclusions & Exclusions
- 1.4 HS Code & Classification Framework
- 1.5 Currency, Units & Pricing Basis
- 1.6 Target Stakeholders
- 1.7 Limitations & Assumptions
Chapter 2. Executive Summary
- 2.1 Global Indonesia Sustainable Tourism Market Snapshot
- 2.1.1 Market Size – Historical (2024) & Forecast (2024-2032) (2024: USD 17,393 million → 2032: USD 118,449.7 million)
- 2.1.2 Volume & Revenue – Global Totals
- 2.1.3 Key Market Highlights – Top Five Facts
- 2.2 Indonesia Sustainable Tourism Market Segmentation Snapshot
- 2.2.1 Market Split by Region – 2024 vs. 2032
- 2.3 Competitive Snapshot
- 2.3.1 Top 10 Players by Revenue Share – 2024
- 2.3.2 Top 10 Players by Volume Share – 2024
- 2.3.3 Recent Strategic Developments (18-Month Summary)
- 2.4 Key Investment Highlights & Strategic Conclusions
Chapter 3. Indonesia Sustainable Tourism Market Dynamics & Industry Analysis
- 3.1 Market Overview & Context
- 3.1.1 Indonesia Sustainable Tourism Market Position in the Broader Automotive Value Chain
- 3.1.2 OEM vs. Replacement Market Dynamics
- 3.1.3 Market Maturity & Development Stage by Region
- 3.2 Indonesia Sustainable Tourism Market Drivers
- 3.3 Indonesia Sustainable Tourism Market Restraints & Challenges
- 3.4 Indonesia Sustainable Tourism Market Opportunities
- 3.5 Porter's Five Forces Analysis
- 3.5.1 Threat of New Entrants
- 3.5.2 Bargaining Power of Suppliers
- 3.5.3 Bargaining Power of Buyers
- 3.5.4 Threat of Substitutes
- 3.5.5 Competitive Rivalry – Intensity Assessment
- 3.6 Indonesia Sustainable Tourism Value Chain Analysis
- 3.6.1 Upstream – Raw Material/Input Suppliers
- 3.6.1.1 Raw Material/Input 1
- 3.6.1.2 Raw Material/Input 2
- 3.6.1.3 Raw Material/Input 3
- 3.6.2 Midstream – Production/Manufacturing/Service Delivery
- 3.6.2.1 Production/Process Overview
- 3.6.2.2 Key Facility Locations & Capacity by Manufacturer
- 3.6.3 Downstream – Distribution & End Consumer
- 3.6.3.1 Primary Channel – B2B/OEM
- 3.6.3.2 Secondary Channels – Dealer, Retail, Online, Direct
- 3.6.4 Value Chain Profitability Analysis
- 3.6.1 Upstream – Raw Material/Input Suppliers
- 3.7 PESTEL Analysis
- 3.7.1 Political Factors
- 3.7.2 Economic Factors
- 3.7.3 Social Factors
- 3.7.4 Technological Factors
- 3.7.5 Environmental Factors
- 3.7.6 Legal Factors
- 3.8 Indonesia Sustainable Tourism Supply Chain Analysis
- 3.8.1 Raw Material/Input Supply Risk Assessment
- 3.8.2 Manufacturing Concentration Risk (Geographic Exposure)
- 3.8.3 Trade Disruption Impact Analysis
- 3.9 Regulatory & Policy Landscape
Note: The regulatory and policy landscape section covers regulations based on their applicability to the market, Indonesia Sustainable Tourism category, geography, and scope of the study. Only regulatory frameworks with a material impact on operations, compliance, trade, sustainability, or market access are analyzed in detail.
Chapter 4. Key Investment Pockets & Opportunity Analysis
- 4.1 Indonesia Sustainable Tourism Market Attractiveness Analysis
- 4.1.1 By Region – Investment Attractiveness Matrix (Volume × CAGR)
- 4.2 Absolute Revenue Growth Opportunity
- 4.2.1 By Region – Absolute USD Growth Through 2032
- 4.3 Incremental Volume Opportunity
- 4.3.1 By Region – Incremental Volume Through 2032
- 4.3.2 Segment – Incremental Volume
- 4.4 Emerging Submarket Opportunity Deep Dive (Subject to Applicability)
- 4.5 Emerging Market Opportunity Scorecards
- 4.5.1 United States
- 4.5.2 Europe
- 4.5.3 Asia
- 4.5.4 Middle East & Africa
Note: Emerging Market Opportunity Scorecards will be included based on relevance and strategic importance. Regions listed are indicative and may vary depending on data availability and market dynamics.
Chapter 5. Indonesia Sustainable Tourism Import-Export Analysis & Trade Flows
- 5.1 Global Trade Overview
- 5.1.1 Global Export Value by Country (2024)
- 5.1.2 Global Export Volume by Country (2024)
- 5.1.3 Global Import Value by Country (2024)
- 5.1.4 Global Import Volume by Country (2024)
- 5.1.5 Net Trade Balance by Country (2024)
- 5.2 Export Analysis – Segment
- 5.2.1 Type 1 (HS Code)
- 5.2.2 Type 2 (HS Code)
- 5.2.3 Type 3 (HS Code)
- 5.2.4 Type 4 (HS Code)
- 5.2.5 Type 5 (HS Code)
- 5.3 Import Analysis – Segment
- 5.3.1 Type 1 (HS Code)
- 5.3.2 Type 2 (HS Code)
- 5.3.3 Type 3 (HS Code)
- 5.3.4 Type 4 (HS Code)
- 5.3.5 Type 5 (HS Code)
- 5.4 Average Unit Trade Prices
- 5.4.1 Average Export Price – Segment & Country
- 5.4.2 Average Import Price – Segment & Source Country
- 5.4.3 Price Trends (2024)
- 5.5 Key Trade Route Analysis
- 5.5.1 Trade Route 1
- 5.5.2 Trade Route 2
- 5.5.3 Trade Route 3
- 5.5.4 Trade Route 4
- 5.5.5 Trade Route 5
- 5.6 Trade Policy Impact Assessment
- 5.6.1 US Anti-Dumping & Section 301 Tariffs
- 5.6.2 EU Customs Union Impact
- 5.6.3 Major Free Trade Agreements
- 5.6.4 USMCA Rules of Origin
Note: Trade policy analysis will be included only where relevant to the Indonesia Sustainable Tourism market.
Chapter 6. Competitive Landscape & Company Benchmarking
- 6.1 Indonesia Sustainable Tourism Market Concentration & Structure
- 6.1.1 Herfindahl-Hirschman Index (HHI) – vs. 2024
- 6.1.2 Tier 1, Tier 2 & Tier 3 Market Structure
- 6.1.3 Global, Regional & Local Player Dynamics
- 6.2 Indonesia Sustainable Tourism Market Share Analysis – 2024
- 6.2.1 Global Revenue Share by Company
- 6.2.2 Global Volume Share by Company
- 6.2.3 Regional Revenue Share
- 6.2.4 Market Share Evolution ( vs. 2024)
- 6.2.5 OEM Segment Share by Company
- 6.2.6 Replacement Segment Share by Company
- 6.3 Production/Delivery Capacity & Facility Analysis
- 6.3.1 Global Installed Capacity
- 6.3.2 Capacity Utilization Rates
- 6.3.3 Production/Output Volume
- 6.3.4 Facility Locations & Capacity Map
- 6.3.5 Planned Capacity Additions
- 6.4 Indonesia Sustainable Tourism Competitive Benchmarking Matrix
- 6.4.1 Revenue, Volume, CAGR & Profitability Comparison
- 6.4.2 Channel Revenue Mix
- 6.4.3 Geographic Revenue Exposure
- 6.4.4 R&D Intensity
- 6.4.5 Sustainability Maturity
- 6.5 Strategic Developments in Indonesia Sustainable Tourism (Last 24 Months)
- 6.5.1 Mergers, Acquisitions & Divestments
- 6.5.2 New Indonesia Sustainable Tourism Launches
- 6.5.3 Facility Expansions
- 6.5.4 Strategic Alliances, Joint Ventures & Partnerships
- 6.5.5 Distribution Expansion & Market Entry
- 6.5.6 Sustainability & ESG Initiatives
- 6.6 Competitive Strategy Mapping
- 6.6.1 Leader, Challenger, Follower & Niche Classification
- 6.6.2 Pricing Strategy Comparison
- 6.6.3 Channel Strategy Matrix
Note: Strategic developments are included based on their materiality and the availability of reliable information.
Chapter 7. Global Indonesia Sustainable Tourism Market – By Distribution Channel
- 7.1 Segment Overview
- 7.1.1 Volume & Revenue Split by Channel (2024 & 2032)
- 7.1.2 Channel Mix Evolution (2024-2032)
Chapter 8. Regional Market Analysis – Global Overview
- 8.1 Global Regional Overview
- 8.1.1 Regional Volume Share
- 8.1.2 Regional Revenue Share
- 8.1.3 Regional Volume by Region
- 8.1.4 Regional Revenue by Region
- 8.1.5 Regional Forecast Through 2032
- 8.2 Cross-Regional Segment Analysis
- 8.2.1 By Distribution Channel
- 8.2.2 By Brand/Price Tier
Chapter 9. North America Indonesia Sustainable Tourism Market
- 9.1 United States
- 9.2 Canada
- 9.3 Mexico
Chapter 10. Europe Indonesia Sustainable Tourism Market
- 10.1 Germany
- 10.2 France
- 10.3 Italy
- 10.4 United Kingdom
- 10.5 Spain
- 10.6 Poland
- 10.7 Russia
- 10.8 Netherlands
- 10.9 Belgium
- 10.10 Sweden
- 10.11 Denmark
- 10.12 Norway
- 10.13 Rest of Europe
Chapter 11. Asia Pacific Indonesia Sustainable Tourism Market
- 11.1 China
- 11.2 India
- 11.3 Japan
- 11.4 South Korea
- 11.5 Thailand
- 11.6 Indonesia
- 11.7 Vietnam
- 11.8 Malaysia
- 11.9 Australia
- 11.10 Rest of Asia Pacific
Chapter 12. Latin America Indonesia Sustainable Tourism Market
- 12.1 Brazil
- 12.2 Argentina
- 12.3 Colombia
- 12.4 Chile
- 12.5 Rest of Latin America
Chapter 13. Middle East Indonesia Sustainable Tourism Market
- 13.1 Saudi Arabia
- 13.2 United Arab Emirates
- 13.3 Turkey
- 13.4 Israel
- 13.5 Iran
- 13.6 Rest of the Middle East
Chapter 14. Africa Indonesia Sustainable Tourism Market
- 14.1 South Africa
- 14.2 Egypt
- 14.3 Nigeria
- 14.4 Morocco
- 14.5 Rest of Africa
Chapter 15. Indonesia Sustainable Tourism Company Profiles
- 15.1 [Company 01]
- 15.1.1 Company Overview
- 15.1.2 Key Management Personnel
- 15.1.3 Products & Services Portfolio
- 15.1.4 Financial Performance
- 15.1.5 Key Market Focus & Geographic Presence
- 15.1.6 Recent Developments & Strategic Initiatives
Note: The company profile list is preliminary and may change based on research findings, market developments, data availability, and client requirements.
Chapter 16. Appendices
- Appendix A – List of Abbreviations & Acronyms
- Appendix B – Industry Classification Code Reference – Full Series
- Appendix C – Production & Capacity Data Tables
- Appendix D – End-Use & Demand Base Tables
- Appendix E – Consumption & Replacement Rate Assumptions
- Appendix F – ASP Reference Tables
- Appendix G – Manufacturing & Facility Database
- Appendix H – Import-Export Data Tables
- Appendix I – Regulatory Summary Tables
- Appendix J – Primary Research Participant List (Anonymized)
- Appendix K – Primary Research Questionnaire Framework
- Appendix L – Data Sources & Bibliography
- Appendix M – Market Size Divergence & Source Comparison
Chapter 17. Research Methodology
- 17.1 Research Framework & Philosophy
- 17.2 Secondary Research – Sources, Hierarchy & Data Extraction
- 17.3 Data Modeling – Bottom-Up & Top-Down Market Sizing
- 17.4 Primary Research – Stakeholder Framework, LOI & Sample Sizes
- 17.5 Forecast Methodology – Regression, Scenario & Sensitivity Analysis
- 17.6 Quality Control – Four-Layer Validation Framework
- 17.7 Limitations & Standard Assumptions
- 17.8 Disclaimer
