
Sachet habits and cafe chains drive a large drinking base
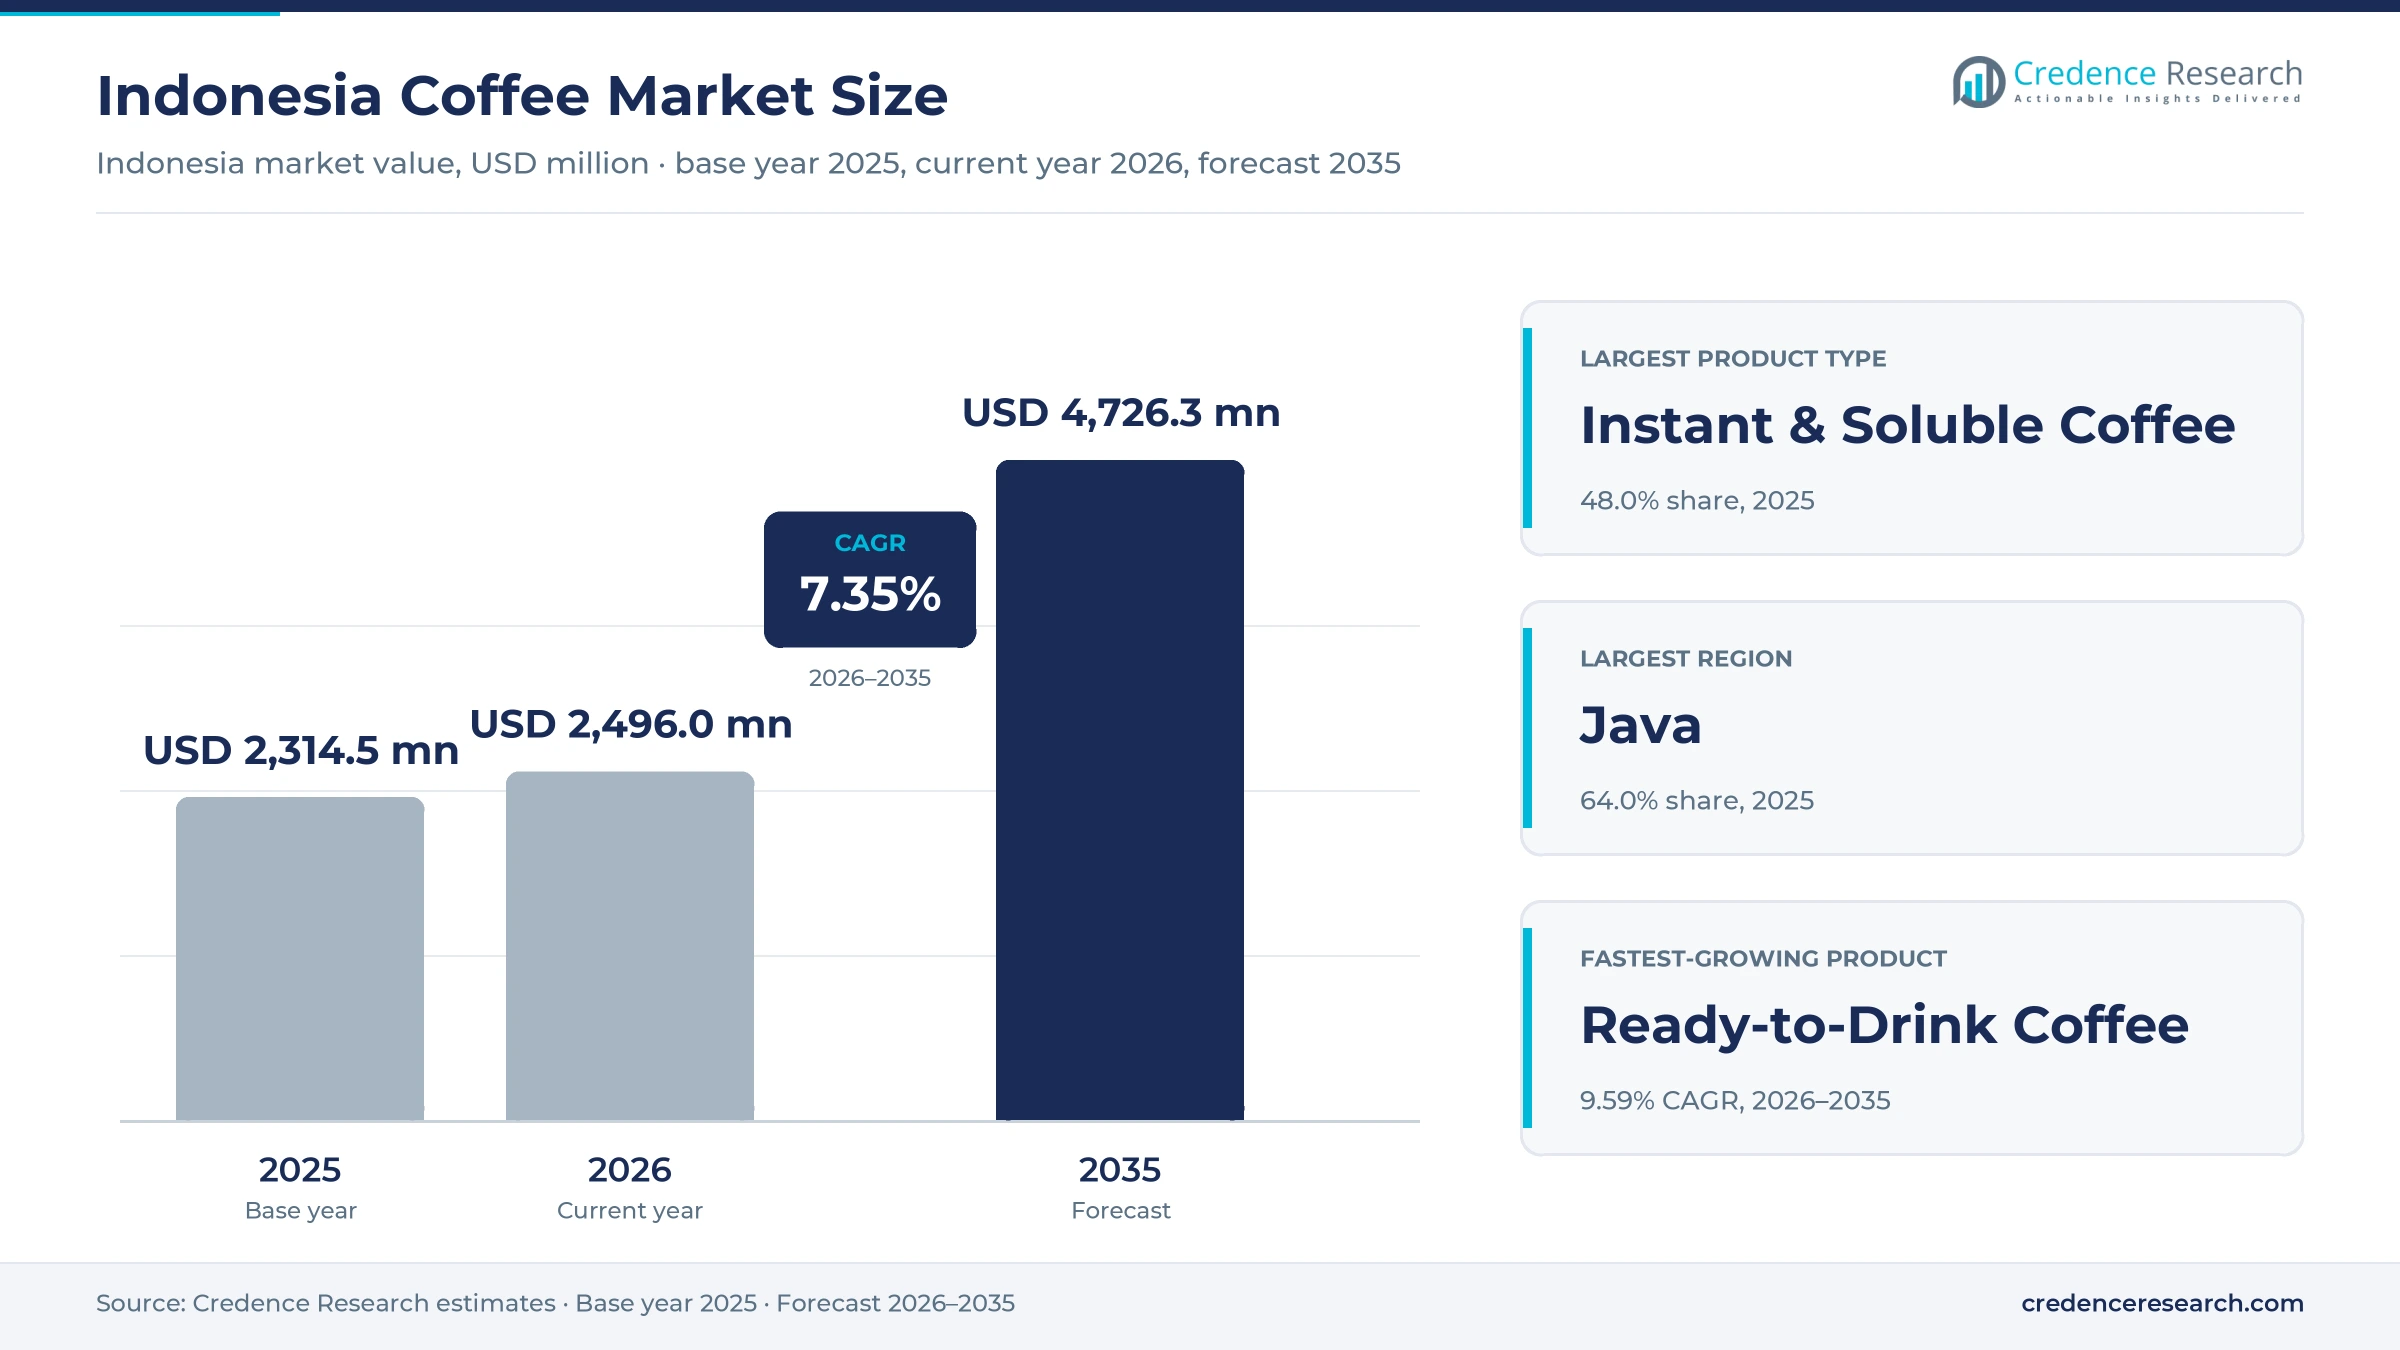
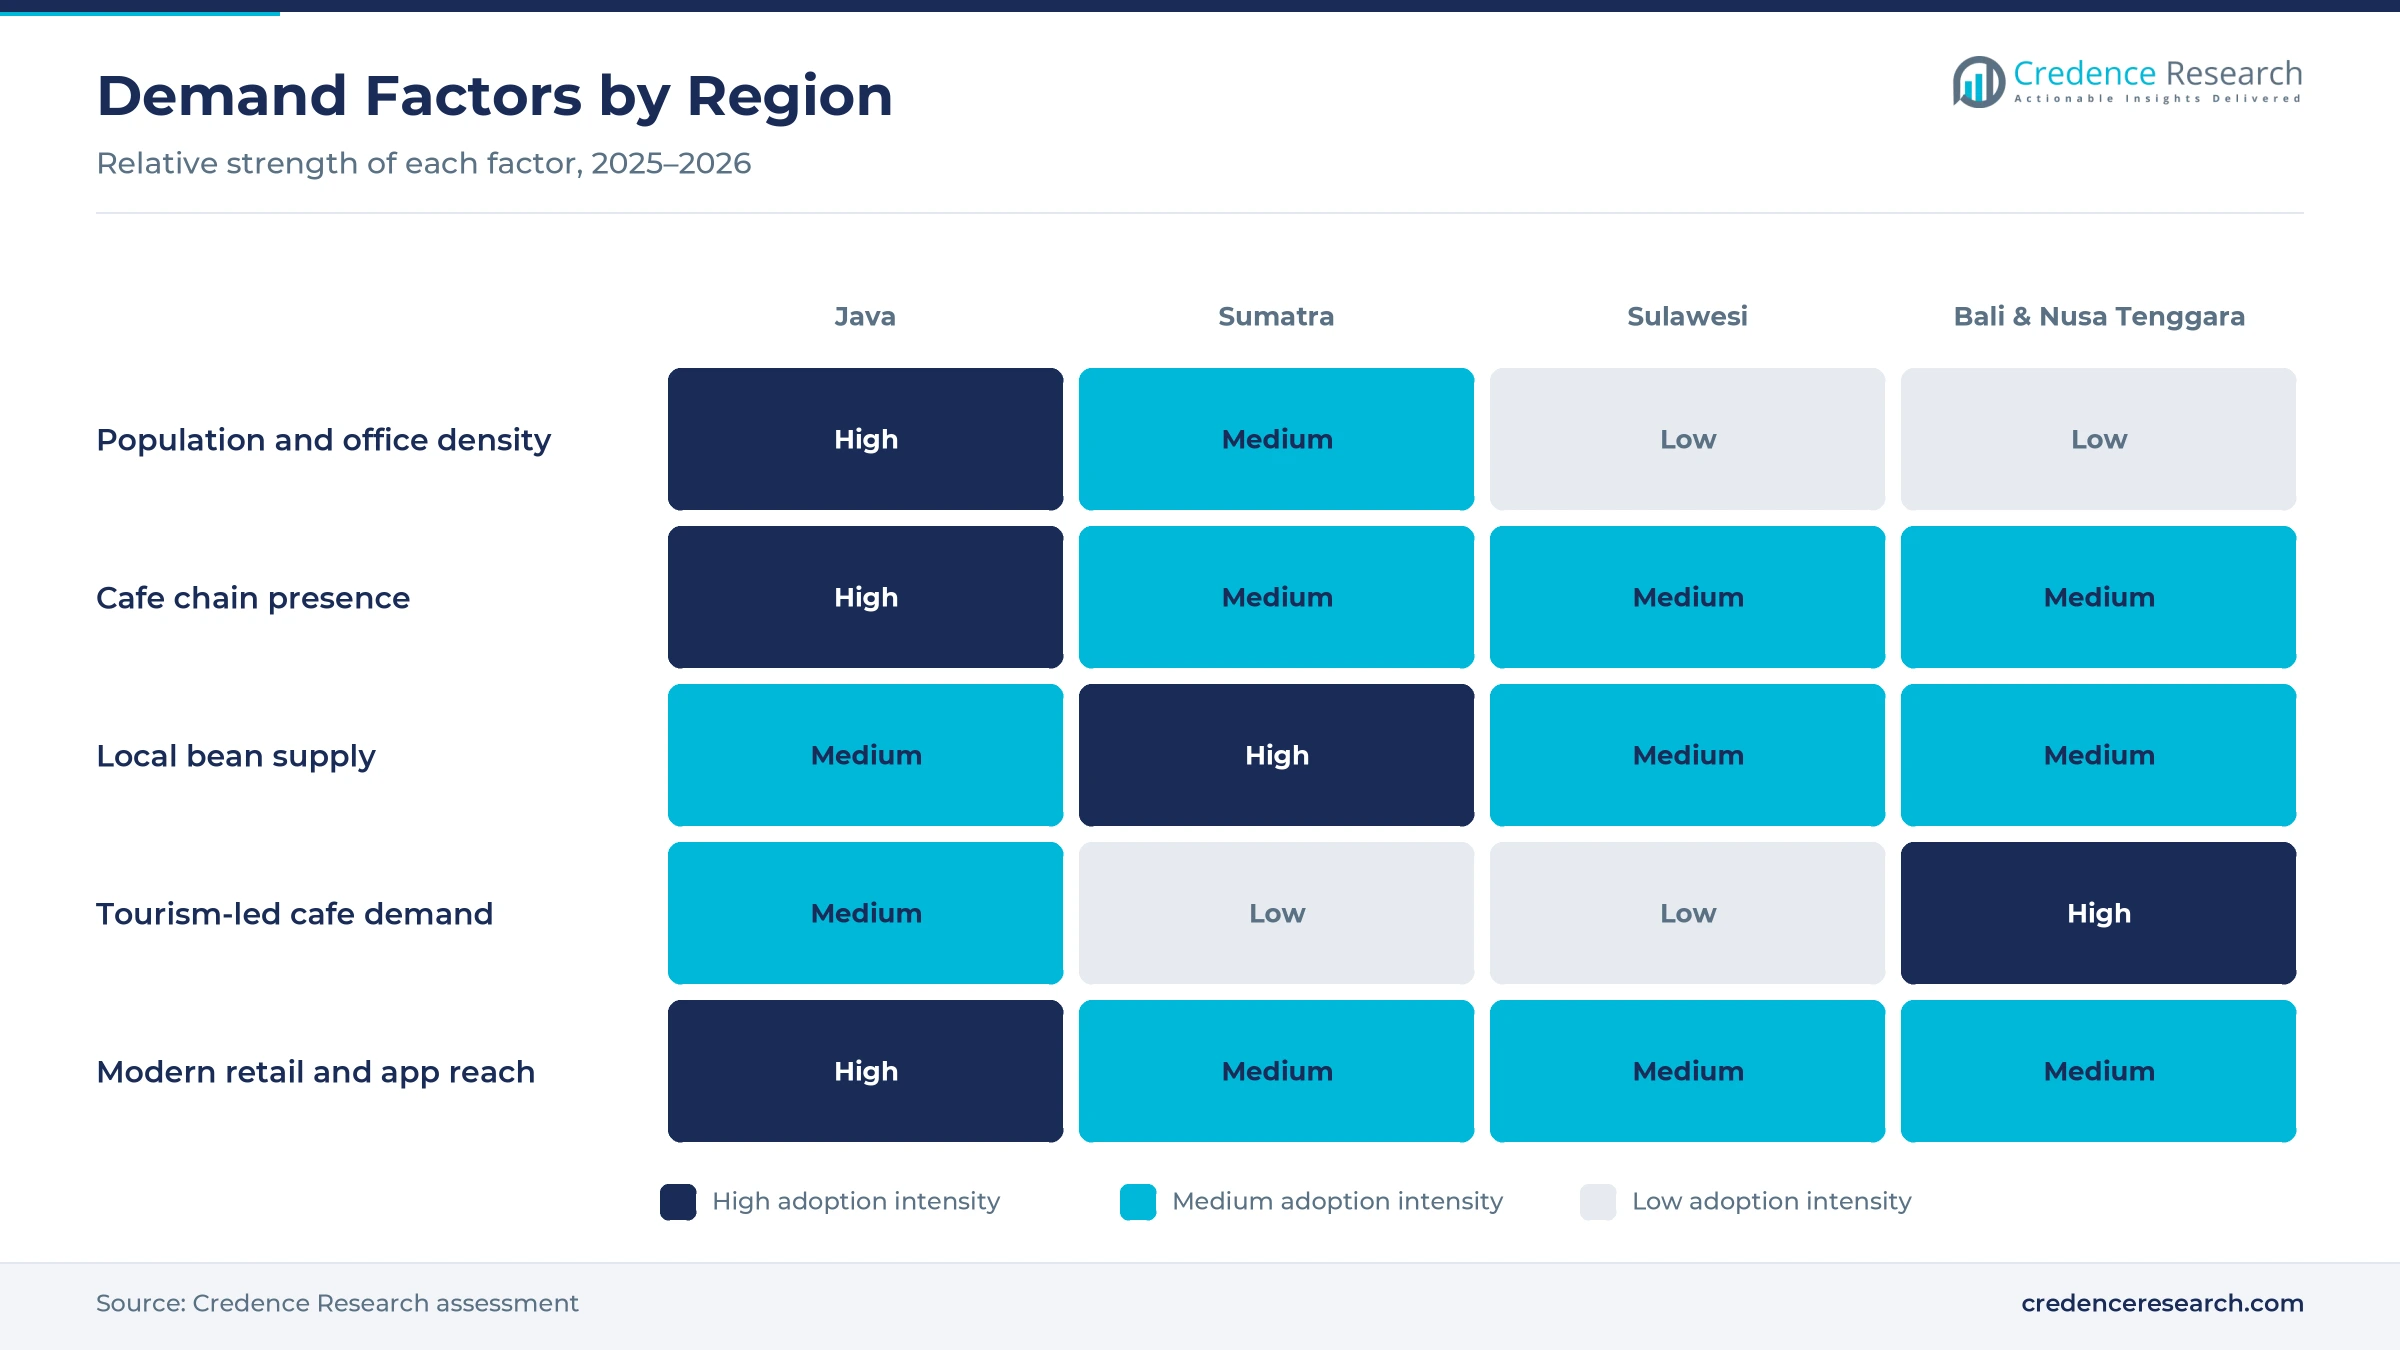
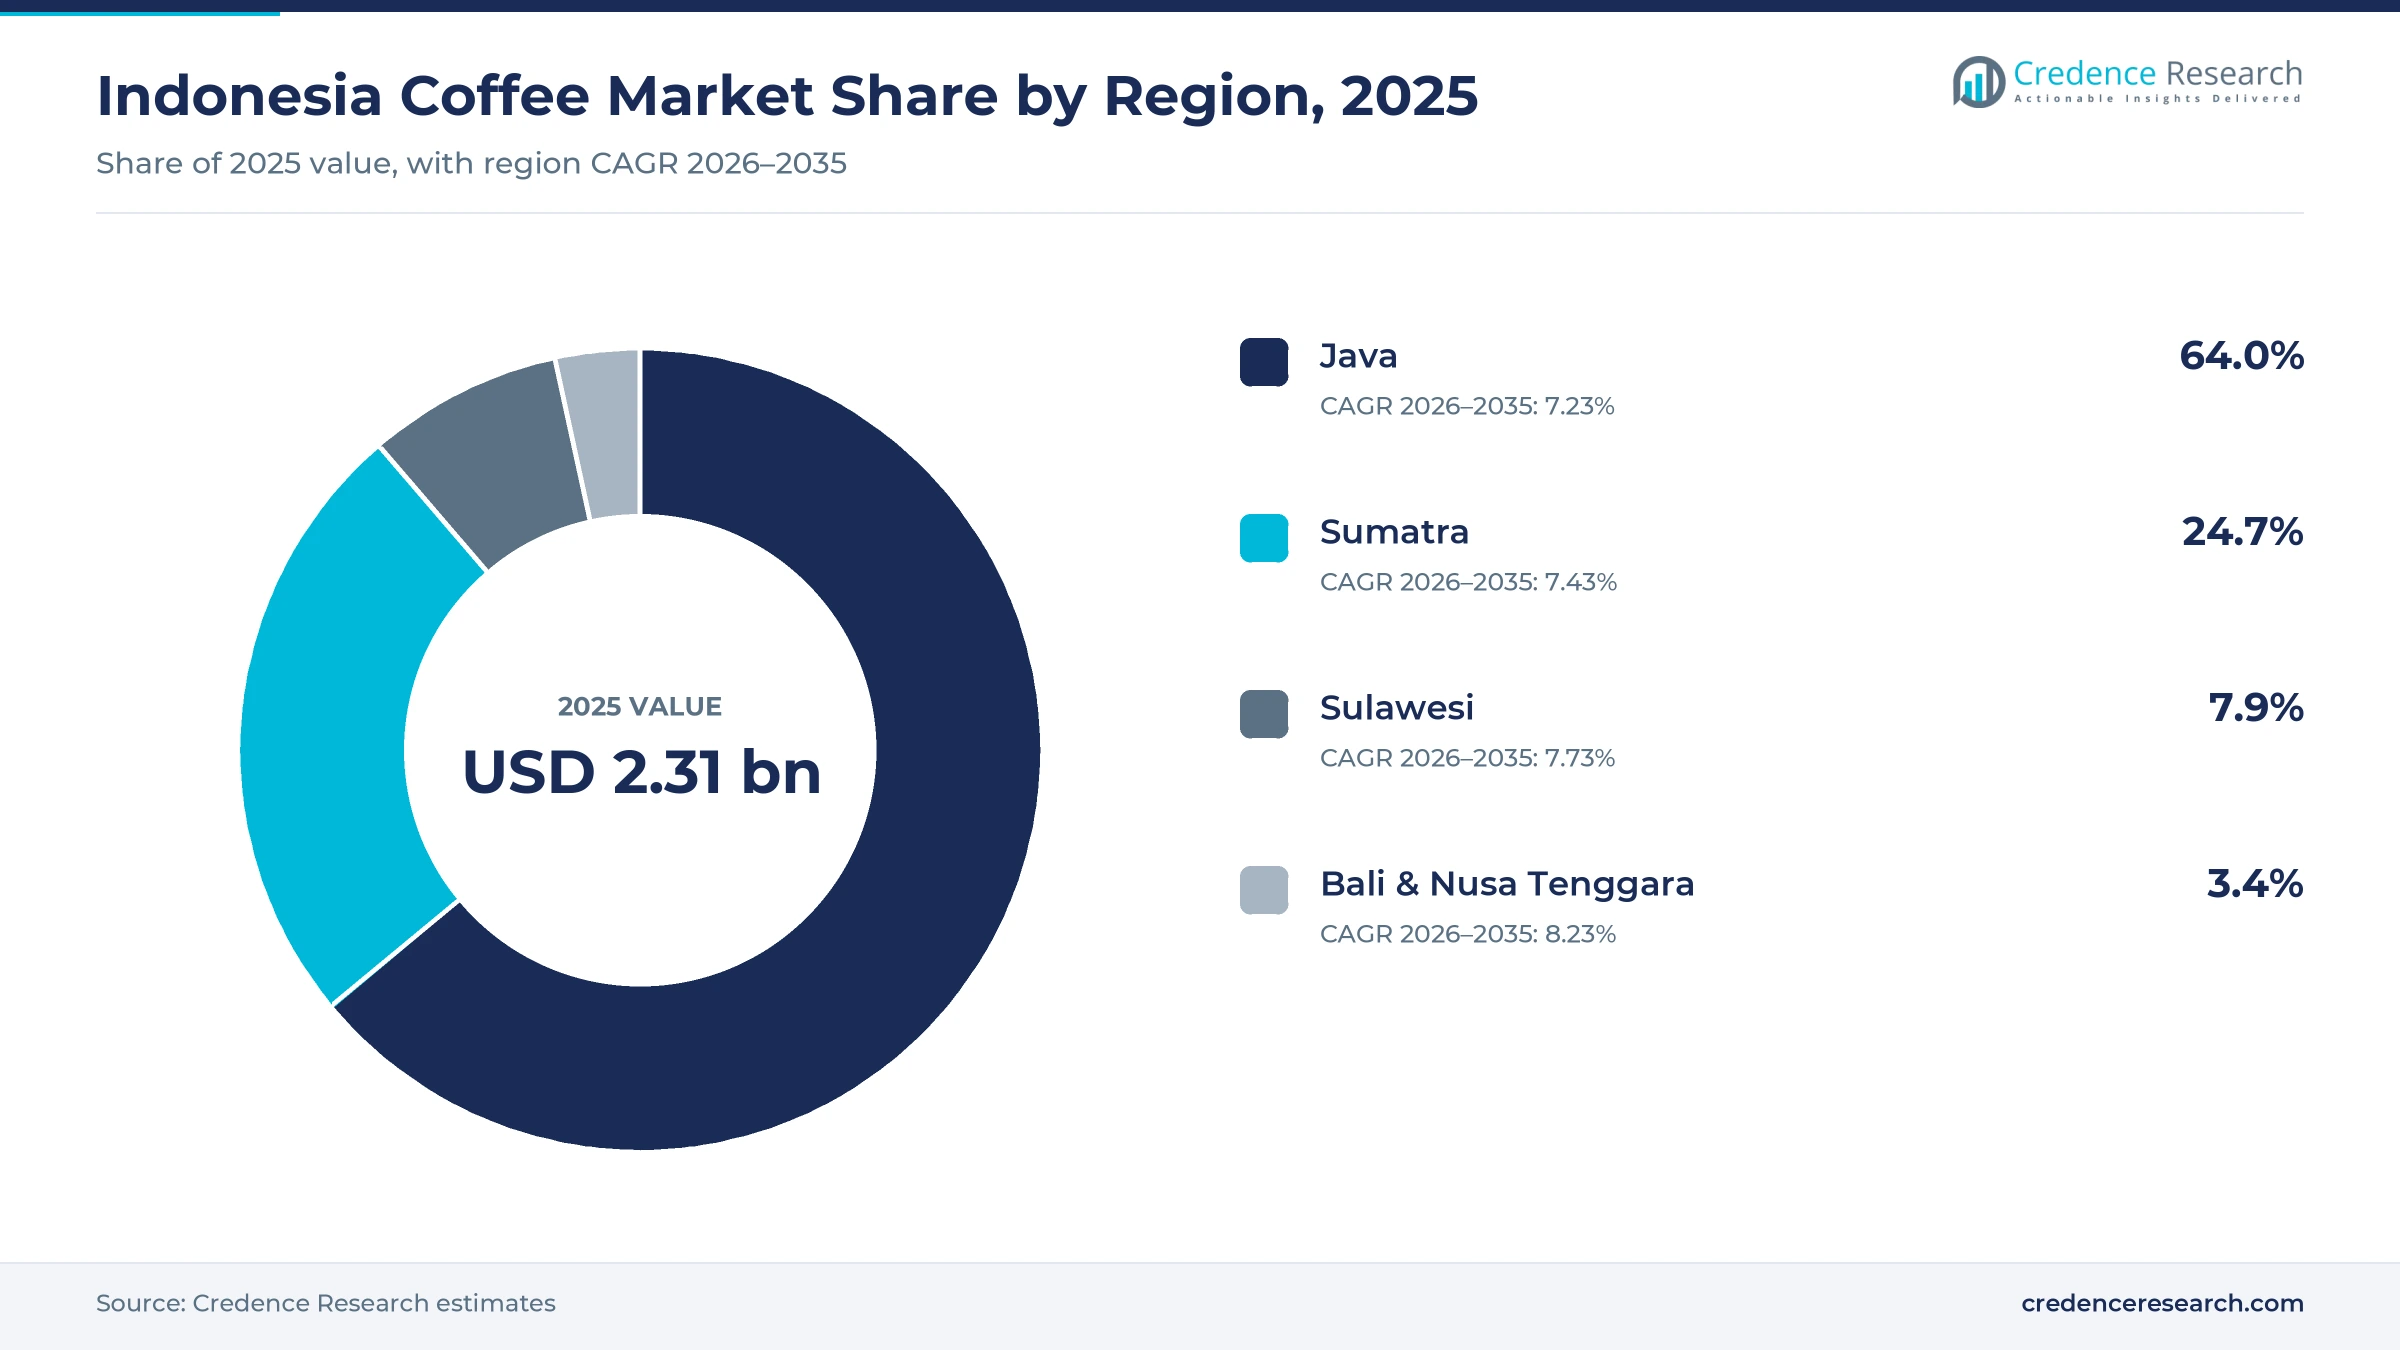
The Indonesia coffee market was valued at USD 2.31 billion in 2025 and is projected to increase from USD 2.50 billion in 2026 to USD 4.73 billion by 2035, registering a CAGR of 7.35% during 2026–2035. Demand comes from households that drink instant sachets every morning, from office workers and students who buy iced milk coffee from app-based chains, and from cafes, hotels and restaurants that serve local beans. Java held the largest regional share, 64.0% in 2025, because it holds most of the population, offices and modern stores. Bali & Nusa Tenggara is the fastest-growing region at 8.23% a year, as tourism lifts cafe visits and specialty bean sales. In turn, the national coffee shop count nearly tripled in three years, according to the industry ministry, which pushed premium cups and bottled lattes into everyday routines for younger buyers.
Which products and sales routes does the estimate cover?
The estimate measures the retail value of instant and soluble products, roast and ground products, whole beans and ready-to-drink bottles and cans sold to households, workers, enthusiasts and foodservice buyers in Indonesia. It covers branded and private-label products sold through warung kiosks, minimarkets, supermarkets, online marketplaces, brand stores and specialty roasters.
The estimate excludes green beans shipped abroad, cups sold by cafes as a prepared drink service and coffee candy or confectionery. The value chain runs from smallholder growers in Sumatra, Java and Sulawesi through collectors, processors, roasters and packers to distributors, retailers and online sellers that serve buyers.
Indonesia Coffee Market Insights
- The Indonesia coffee market was valued at USD 2.31 billion in 2025 and is projected to reach USD 4.73 billion by 2035, registering a CAGR of 7.35% during 2026–2035.
- Java held a 64.0% share of 2025 value, because the island holds most of the population, offices, modern stores and cafe chains.
- Instant and soluble products led with a 48.0% share of 2025 value, because sachets suit daily home drinking at low prices.
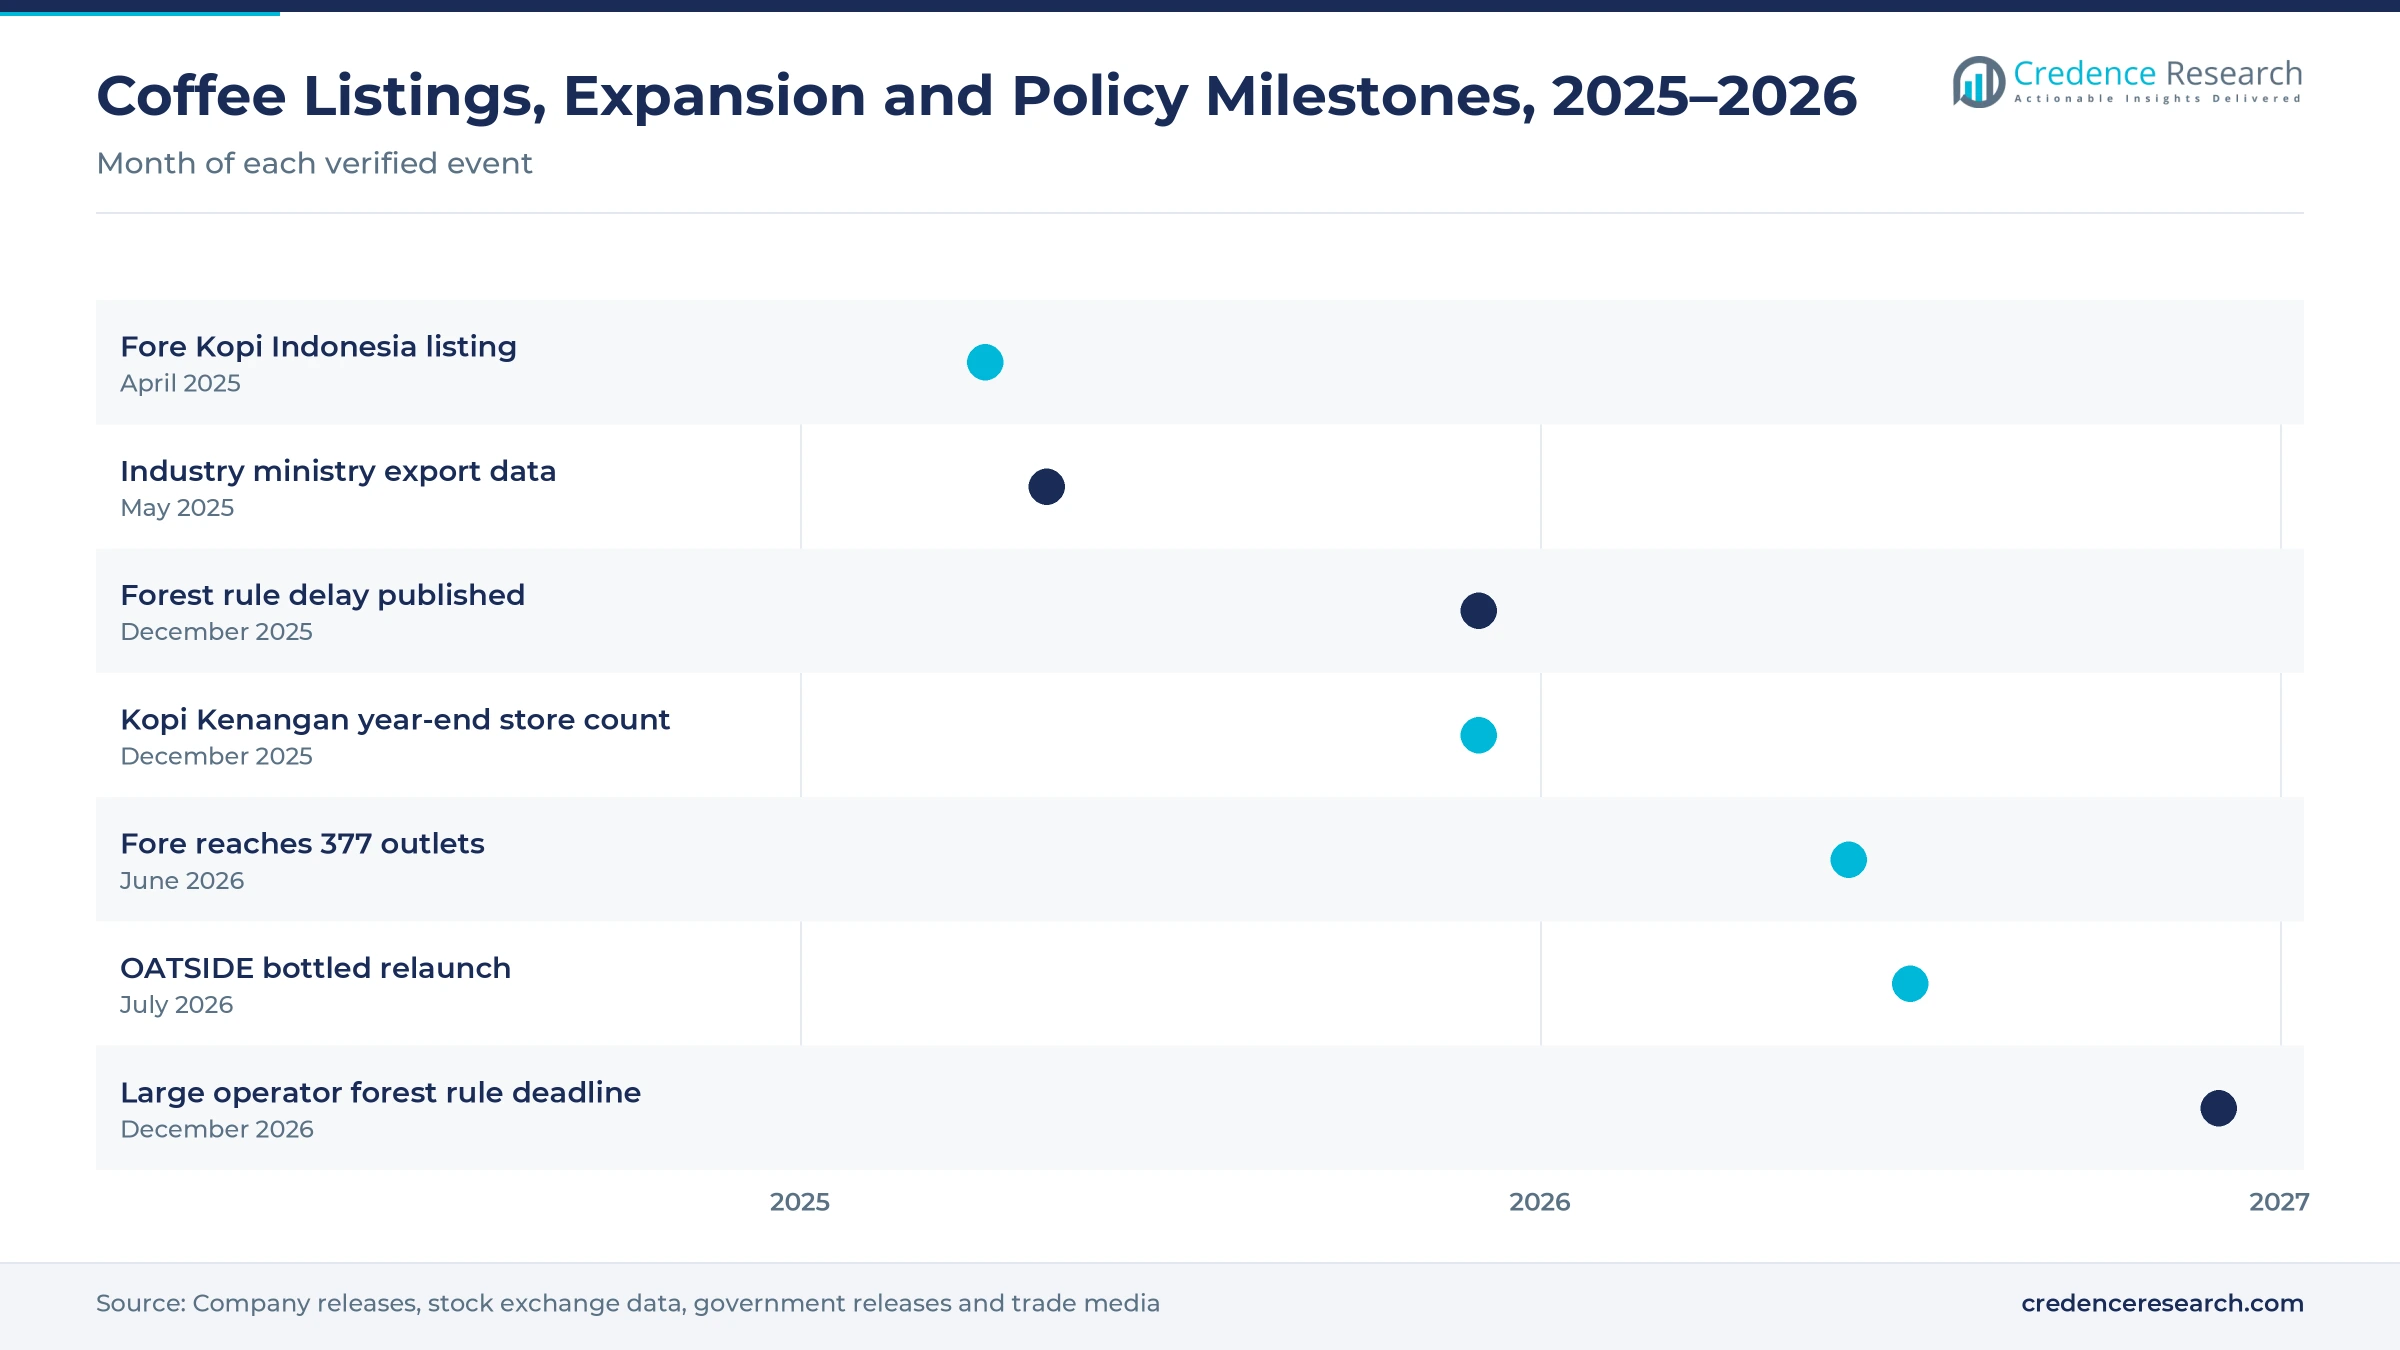
- Fore Kopi Indonesia listed on the Indonesia Stock Exchange on April 14, 2025, raising about Rp353.44 billion to open more outlets.
- Kopi Kenangan ended 2025 with 1,324 stores across six countries, adding 347 net new outlets during the year to widen its reach.
Instant sachets lead while bottled drinks grow fastest
Why do instant sachets hold most of the value?
Based on product type, the market is categorized into instant and soluble products, roast and ground products, whole beans and ready-to-drink bottles and cans. Instant & Soluble Coffee led with a 48.0% share of 2025 value, because sachets with sugar and creamer are cheap and easy to prepare. Ready-to-Drink Coffee grows fastest at 9.59% a year, as chilled bottled lattes reach minimarkets and online stores.
How fast are buyers trading up across price tiers?
Based on price tier, the market is categorized into value, mainstream, premium and specialty products. Value products led with a 40.0% share of 2025 value, because most households buy low-priced sachets at warung kiosks. Specialty products grow fastest at 10.03% a year, as single-origin beans from Aceh, Toraja and Flores win younger urban drinkers and cafe owners.
Why do warung kiosks still dominate sales?
Based on distribution channel, the market is categorized into traditional grocery and kiosks, modern grocery and convenience, e-commerce and marketplaces, and direct-to-consumer and specialty retail. Traditional Grocery & Kiosks led with a 52.0% share of 2025 value, because warung stores reach almost every street. E-Commerce & Marketplaces grow fastest at 10.49% a year, as buyers order beans and bottles through apps.
How is packaging shifting toward bottles and cans?
Based on packaging format, the market is categorized into sachets and stick packs, pouches and bags, jars and tins, and bottles and cans. Sachets & Stick Packs led with a 54.0% share of 2025 value, because single-serve packs fit daily budgets. Bottles & Cans grow fastest at 9.46% a year, as brands sell chilled lattes in minimarket fridges.
| Segment Group | Leading Sub-segment | Share, 2025 | Fastest-growing Sub-segment | CAGR, 2026–2035 |
|---|---|---|---|---|
| By Product Type | Instant & Soluble Coffee | 48.0% | Ready-to-Drink Coffee | 9.59% |
| By Price Tier | Value | 40.0% | Specialty | 10.03% |
| By Distribution Channel | Traditional Grocery & Kiosks | 52.0% | E-Commerce & Marketplaces | 10.49% |
| By Packaging Format | Sachets & Stick Packs | 54.0% | Bottles & Cans | 9.46% |
Request a Free Sample
Fill in your details and we'll send you a free sample report.
- Sample data tables & charts
- Research methodology
Home demand, premium formats and retail reach lift sales
How does a deep home drinking base support demand?
A deep domestic consumption base supports demand, because coffee is a daily drink in most Indonesian homes, offices and roadside kiosks. Domestic consumption was expected at 4.8 million 60-kilogram bags in 2024/25, according to the U.S. Department of Agriculture. The industry ministry put national consumption at 1.03 kg per person, or 288,000 tons, and said coffee shops nearly tripled over three years, according to Antara. The same ministry reported processed output of 1.04 million tons in 2024 at 77% capacity utilization. As a result, instant and soluble products hold 48.0% of 2025 value, because sachets remain the cheapest daily cup for most families across the islands.
Why do premium formats and new drinks raise spending?
Premiumization and format innovation raise spending per cup, because younger buyers now pay more for iced lattes, bottled drinks and single-origin beans. The industry ministry says 54 Indonesian coffees hold geographical indication status, which gives specialty roasters strong origin stories. OATSIDE relaunched its plant-based bottled coffee line in 2026 with a new Espresso Roast variant, priced from Rp9,000 in minimarkets and on Shopee. More than 53% of the population are Gen Z or millennials, according to the ministry, citing national statistics. In turn, ready-to-drink beverages grow at 9.59% a year, the fastest product rate, as chilled lattes reach more minimarket fridges.
How do growth and chain expansion widen retail reach?
Macroeconomic and channel expansion widens retail reach, because steady income growth lets chains open stores in second and third-tier cities. The economy grew 5.11% in 2025, while household consumption rose 4.98%, according to national statistics released on Feb. 5, 2026. Fore Kopi Indonesia raised about Rp353.44 billion in its April 2025 listing and planned 140 new outlets within two years, according to Infobank News. Kopi Kenangan ended 2025 with 1,173 outlets in Indonesia and plans about 550 new stores in 2026. As a result, e-commerce and marketplaces grow at 10.49% a year, as chains push app ordering and delivery deals.
Why does a large local bean supply keep prices steady?
A large local bean supply keeps prices steady for domestic roasters, because Indonesia grows most of the coffee it drinks and needs few imports. Production was forecast at 11.3 million bags for 2025/26, up 5%, according to a U.S. Department of Agriculture report summarized by Daily Coffee News. Robusta made up 9.8 million bags, nearly 87% of output, while arabica made up 1.5 million bags. Exports were forecast to rise 7% to 6.5 million bags, which shows that local supply can serve both home and foreign buyers. In turn, robusta beans feed the sachets and stick packs that hold 54.0% of 2025 value across kiosks and minimarkets.
Cafe chains and bottled lattes reshape daily demand
How is the rise of app-based cafe chains changing habits?
The rise of app-based cafe chains is changing daily habits, because buyers now order iced milk drinks for pickup or delivery several times a week. Kopi Kenangan ended 2025 with 1,324 stores across six countries, added 347 net new outlets and gained 4.47 million new customers through digital channels. Fore Kopi Indonesia ran 377 outlets across 60 cities at the end of June 2026, including 10 donut outlets and four stores in Singapore. Fore also set a five-year goal of up to 600 outlets after its listing. As a result, direct-to-consumer and specialty retail grow faster than the market, as chains sell beans, bottles and merchandise in their stores.
Why is the shift to bottled and plant-based drinks significant?
The shift to bottled and plant-based drinks is significant, because chilled ready-to-drink lattes let buyers skip the cafe queue and still get a cafe-style taste. OATSIDE moved its coffee line from Tetra packs to a new easy-to-carry pack in 2026, priced from Rp9,000, and sold it through minimarkets across Indonesia and its Shopee store. Nestlé began building a USD 220 million factory in Batang, Central Java, in May 2021 for Nescafé, Milo and Bear Brand drinks. Kapal Api also opened a Semarang plant worth more than Rp3 trillion in August 2023. In turn, bottles and cans grow at 9.46% a year, the fastest rate among pack formats in the market.
Can specialty and origin coffees open premium demand?
Specialty and origin coffees can open premium demand, because Indonesian islands offer distinct tastes that local buyers and tourists value. Arabica output reached 1.5 million bags in the 2025/26 forecast, mostly from northern Sumatra, Java and Sulawesi. The industry ministry counts 54 coffees with geographical indication status, such as Gayo, Toraja and Kintamani. Processed exports reached 196,800 tons worth USD 661.9 million in 2024, which shows strong overseas interest in local brands. As a result, specialty products grow at 10.03% a year, the fastest price tier, as roasters sell single-origin bags online and through their own cafes.
Is regional food and drink processing an opening for roasters?
Regional processing offers an opening for roasters, because large food groups can turn local beans into higher value sachets, bottles and capsules for home and export markets. The food and beverage industry already runs coffee plants at 77% utilization, which leaves room for more output without new factories. Mayora, the maker of Kopiko, stayed confident in full-year growth in August 2025 despite weaker purchasing power. Exports were forecast at 6.5 million bags for 2025/26, up 7%. In turn, roasters that add packing lines near growing areas can lower costs, keep beans fresher and reach more buyers in home and overseas markets.
Weather, export rules and price swings pressure roasters
How do weather swings disrupt bean supply?
Weather swings disrupt bean supply, because late rains or dry spells can cut robusta harvests in southern Sumatra for a full season. In turn, roasters face higher bean costs and must choose between raising shelf prices or accepting thinner margins. Producers respond with contracts across several growing regions, larger stocks before harvest gaps and support for farmers who replant older trees with higher-yield varieties that cope better with dry spells.
Why do European forest rules add export costs?
European forest rules add export costs, because the regulation bans coffee from land cleared after December 2020. The amendment published on Dec. 23, 2025, set compliance from Dec. 31, 2026, for large operators, according to Mongabay. As a result, exporters must map farms and trace each lot. Producers respond with farm mapping, supplier records and cooperative training programs that help smallholders prove where each lot was grown.
How do price swings squeeze sachet makers?
Price swings squeeze sachet makers, because value buyers resist even small increases in the price of a daily cup. In turn, makers that hold fixed retail prices for kiosks must absorb sugar, creamer and bean cost spikes for months. Producers respond with smaller packs, new blends with steady taste and promotions that keep loyal buyers while protecting margins across their portfolios and keeping kiosk owners stocked during busy periods.
Why does crowded cafe competition limit store profits?
Crowded cafe competition limits store profits, because many chains now open outlets on the same streets and offer frequent app discounts. As a result, some stores struggle to cover rent and staff costs in busy city areas. Producers respond with smaller pickup stores, loyalty programs, higher-margin food items and packaged products that earn more value from each regular buyer and reduce reliance on deep app discounts.
Java leads while Bali and Nusa Tenggara grow fastest
| Region | Value, 2025 (USD billion) | Share, 2025 | CAGR, 2026–2035 |
|---|---|---|---|
| Java | 1.48 | 64.0% | 7.23% |
| Sumatra | 0.57 | 24.7% | 7.43% |
| Sulawesi | 0.18 | 7.9% | 7.73% |
| Bali & Nusa Tenggara | 0.08 | 3.4% | 8.23% |
Why does Java hold the largest share?
Java held a 64.0% share of 2025 value and grows at 7.23% a year, because it holds most of the population, offices, campuses and modern stores. Jakarta, Bandung, Semarang and Surabaya host the densest cafe chain networks, and Kapal Api runs a plant in Semarang worth more than Rp3 trillion. Nestlé also built its Batang factory in Central Java to make Nescafé and other packaged drinks. As a result, Java remains the main market for sachets, bottled drinks and cafe chains.
How does Sumatra link growing and drinking?
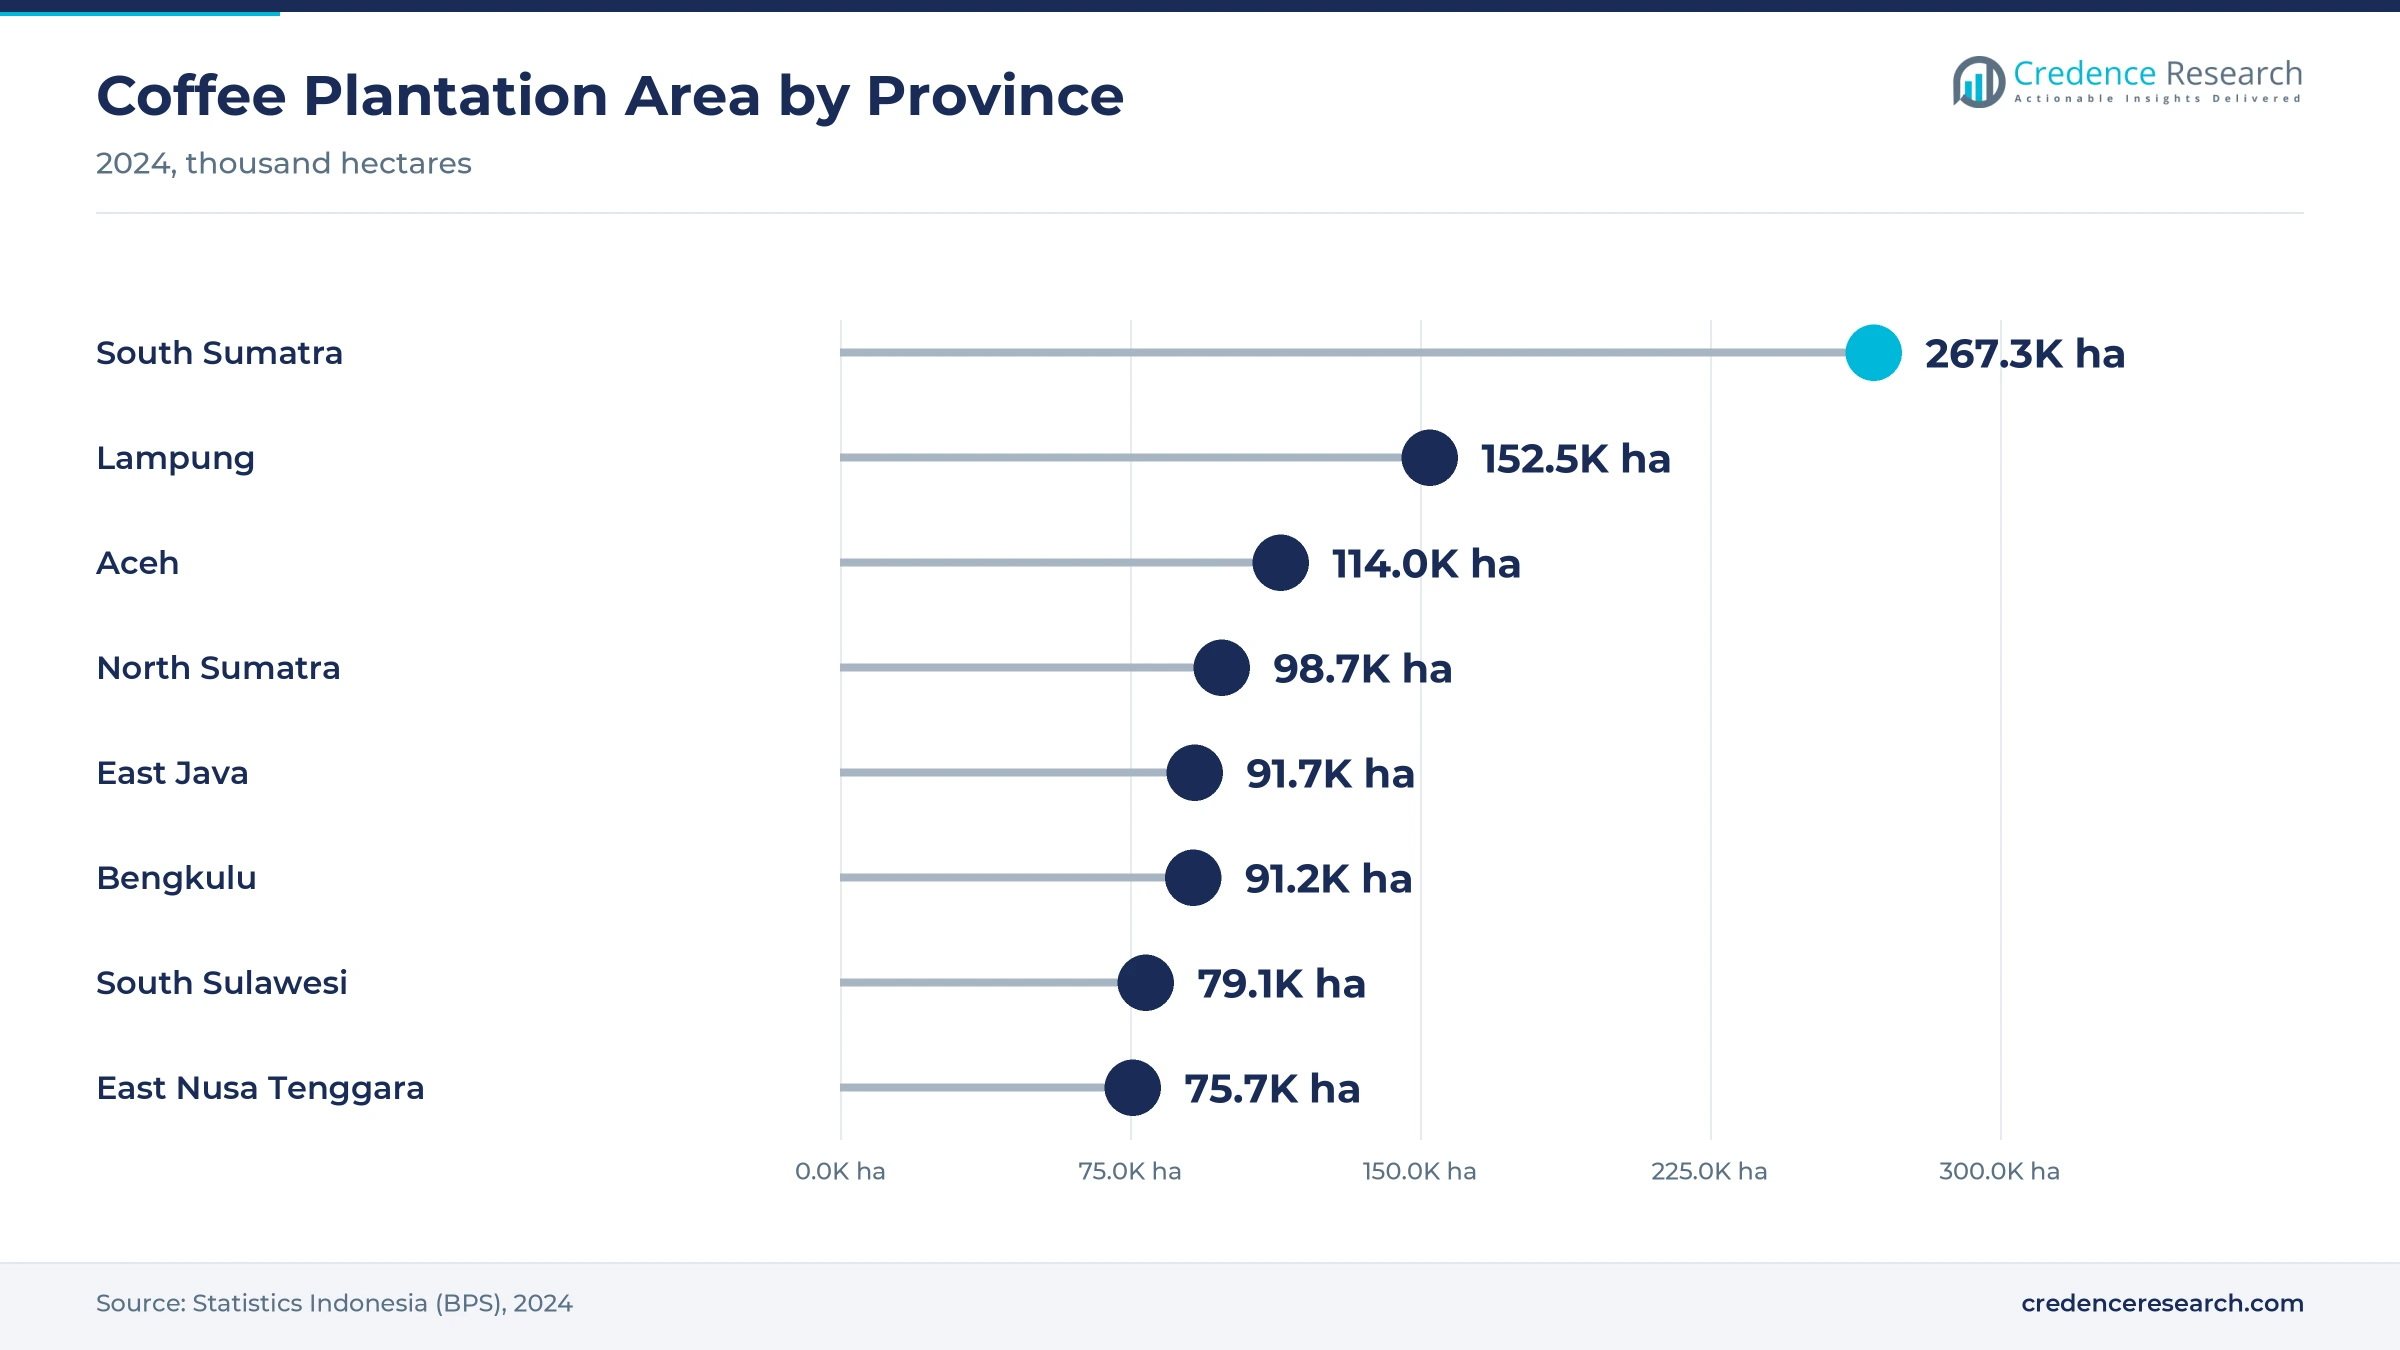
Sumatra held a 24.7% share of 2025 value and grows at 7.43% a year, because it grows 70% to 75% of national coffee and has a strong local cafe culture in Medan, Palembang and Aceh. South Sumatra had 267,280 hectares of coffee plantations in 2024, the largest of any province. Lampung and Aceh also rank among the top growing provinces. In turn, local roasters sell fresh robusta and Gayo arabica at lower prices.
Why does Sulawesi matter for specialty beans?
Sulawesi held a 7.9% share of 2025 value and grows at 7.73% a year, because Makassar and Manado have growing cafe scenes and the island grows well-known Toraja arabica. South Sulawesi had 79,060 hectares of coffee plantations in 2024, according to national statistics. Specialty roasters also buy Toraja beans for single-origin bags sold online. As a result, Sulawesi adds premium value while sachets still lead volume.
How fast are Bali and Nusa Tenggara growing?
Bali & Nusa Tenggara held a 3.4% share of 2025 value and grows fastest at 8.23% a year, because tourists and expatriates visit specialty cafes in Bali and Lombok. East Nusa Tenggara had 75,650 hectares of coffee plantations in 2024, and Flores beans are popular with specialty buyers. Kintamani coffee from Bali also holds geographical indication status for its origin. In turn, premium and specialty beans gain share in the region.
Listings, store expansion and policy moves since 2024
| Development | Status and market relevance |
|---|---|
| In April 2025, Fore Kopi Indonesia listed on the Indonesia Stock Exchange at Rp188 per share, raising about Rp353.44 billion. | Funds new outlets and a donut subsidiary |
| In May 2025, the industry ministry reported 2024 processed exports of 196,800 tons worth USD 661.9 million. | Confirms rising value-added exports |
| In December 2025, the European Union published an amendment delaying forest rule compliance for large operators to Dec. 31, 2026. | Gives exporters more time for farm mapping |
| In December 2025, Kopi Kenangan closed the year with 1,324 stores across six countries and planned about 550 openings in 2026. | Expands app-based cafe reach |
| In July 2026, OATSIDE promoted its relaunched bottled coffee line with an Espresso Roast variant in minimarkets and on Shopee. | Widens plant-based bottled choices |
Roasting, packing and ordering tools modernize supply
- High-speed sachet lines fill and seal stick packs at scale, which keeps unit costs low for kiosk buyers across the islands.
- Aseptic and cold-fill bottling lets brands sell milk-based lattes with longer shelf life, which suits minimarket fridges and online orders.
- App ordering and loyalty systems link cafe chains with buyers, which raises repeat orders and guides new store locations.
- Farm mapping and traceability tools record plot locations and harvest lots, which helps exporters meet European forest rules.
Need a Custom Version of This Report?
Tailor the scope, geography, or segments to your exact requirements.
- Custom geography or segment scope
- Direct access to our analyst team
Sachet giants and cafe chains compete for daily cups
Competition is led by large sachet makers with national distribution, alongside multinational food groups, app-based cafe chains and specialty roasters. PT Santos Jaya Abadi, the maker of Kapal Api, competes on value sachets and roast and ground products and opened a Semarang plant worth more than Rp3 trillion in 2023. PT Mayora Indah Tbk competes through Kopiko and packaged drinks. PT Nestlé Indonesia competes with Nescafé and built a factory in Batang for beverages. Fore Kopi Indonesia and Kopi Kenangan compete as fast-growing cafe chains that also sell packaged products. Rivals compete on price, taste, shelf reach, app promotions and new formats. Because most buyers drink coffee every day, brands with deep warung reach, strong minimarket visibility and loyal app users usually win the most repeat purchases.
Which companies shape Indonesian coffee shelves?
| Company | Type | Role in the market |
|---|---|---|
| PT Santos Jaya Abadi | Roaster and sachet maker | Opened a Semarang plant worth more than Rp3 trillion in 2023 |
| PT Mayora Indah Tbk | Food and beverage group | Makes Kopiko and other packaged drinks |
| PT Nestlé Indonesia | Multinational food group | Built a Batang factory for Nescafé and other drinks |
| Fore Kopi Indonesia | Cafe chain | Listed in April 2025 and ran 377 outlets by June 2026 |
| Kopi Kenangan | Cafe chain | Ended 2025 with 1,324 stores across six countries |
Credence Research view on daily drinking in Indonesia
Credence Research's view is that the Indonesian coffee market will grow through both volume and trading up, because sachets keep a huge daily base while cafe chains and bottled drinks lift spending per cup. Instant products remain the largest value pool, while ready-to-drink products, specialty beans, online sales and Bali & Nusa Tenggara add the fastest growth. Steady bean supply, rising incomes and new outlets will support demand. Brands with strong kiosk reach, app-based loyalty and chilled bottled lines should gain the most, while weather and export rules keep pressure on supply.
How the national beverage estimate was built
The report uses 2025 as the base year on a calendar basis, and market values come from the Credence Research model. That model combines production and consumption forecasts, industry ministry statistics, national accounts, plantation data and company releases. Regional shares follow the client zone definitions, while segment splits and growth rates are Credence Research estimates. Sources used are official statistics, government releases, stock exchange data and company releases reported in trade and business media, and no interviews or surveys were used.
Cafe chains and bottled drinks carry growth to 2035
The Indonesia coffee market is expected to reach USD 4.73 billion by 2035, a 7.35% CAGR during 2026–2035, as cafe chains open more stores and buyers move to bottled and premium products. Growth should be strongest in ready-to-drink products, specialty beans, online channels and Bali & Nusa Tenggara, because these areas gain most from younger buyers and tourism. Steady local supply will help prices, while weather swings, European forest rules and crowded cafe competition could slow some brands.
Frequently Asked Questions
How big is the Indonesia coffee market?
Which product type leads Indonesian coffee value?
Which region leads the Indonesian market?
How much coffee does Indonesia drink?
Which sales channel is growing fastest?
What recent moves have changed the Indonesian market?
Who are the leading companies in the Indonesian market?
What are the main challenges for coffee makers in Indonesia?
Table of Content
Chapter 1 Market Segmentation
- 1.1 Segmentation Framework
- 1.1.1 Product and Service Classification
- 1.1.2 Application and End-Use Classification
- 1.1.3 Technology and Solution Classification
- 1.1.4 Customer and Distribution Channel Classification
- 1.1.5 Geographic Segmentation
- 1.1.6 Market Segment Definitions and Boundaries
- 1.2 By Product Type
- 1.2.1 Instant & Soluble Coffee
- 1.2.2 Roast & Ground Coffee
- 1.2.3 Whole Bean Coffee
- 1.2.4 Ready-to-Drink Coffee
- 1.3 By Price Tier
- 1.3.1 Value
- 1.3.2 Mainstream
- 1.3.3 Premium
- 1.3.4 Specialty
- 1.4 By Packaging Format
- 1.4.1 Sachets & Stick Packs
- 1.4.2 Pouches & Bags
- 1.4.3 Jars & Tins
- 1.4.4 Bottles & Cans
Chapter 2 Introduction
- 2.1 Report Objectives and Scope
- 2.2 Product Definition and Industry Terminology
- 2.3 Market Inclusions and Exclusions
- 2.4 Research Process
- 2.4.1 Primary Research and Expert Interviews
- 2.4.2 Secondary Research and Source Review
- 2.4.3 Top-Down and Bottom-Up Estimation
- 2.4.4 Data Triangulation and Verification
- 2.5 Market Size Measurement Basis
- 2.5.1 2025: USD 2.31 billion → 2035: USD 4.73 billion
- 2.6 Historical and Forecast Reference Periods
- 2.6.1 Historical Period: 2018-2025
- 2.6.2 Base Year: 2025
- 2.6.3 Forecast Period: 2025-2035
- 2.7 Research Assumptions and Limitations
Chapter 3 Executive Summary
- 3.1 Market Snapshot and Key Findings
- 3.2 Base-Year Market Size, 2025
- 3.3 Forecast Market Size, 2035
- 3.4 Revenue and Volume Growth Outlook
- 3.5 Key Demand and Supply Indicators
- 3.6 Leading Market Segments
- 3.7 Fastest-Growing Market Opportunities
- 3.8 Regional Performance Highlights
- 3.9 Technology and Industry Transformation
- 3.10 Competitive Landscape Summary
- 3.11 Analyst View and Strategic Implications
Chapter 4 Indonesia Coffee Market Trends and Developments
- 4.1 Historical Industry Development, 2018-2025
- 4.2 Recent Market Trends and Developments
- 4.3 Demand and Customer Behavior Trends
- 4.4 Technology and Product Innovation
- 4.5 Artificial Intelligence, Automation and Digitalization
- 4.6 Local Manufacturing and Supply Chain Realignment
- 4.7 Industry Partnerships, Mergers and Acquisitions
- 4.8 Sustainability and Circular Economy Developments
- 4.9 Government and Private Sector Investment Trends
- 4.10 Emerging Business Models and Commercialization
- 4.11 Industry Developments and Announcements
Chapter 5 Indonesia Coffee Market Production, Supply and Demand Analysis
- 5.1 Demand Trend and Consumption Analysis, 2018-2025
- 5.2 Demand Forecast, 2025-2035
- 5.3 Production and Output Trend, 2018-2025
- 5.4 Production and Output Forecast, 2025-2035
- 5.5 Installed Capacity and Capacity Utilization
- 5.6 Company-Wise Production Plants and Statistics
- 5.6.1 Installed Production Capacity
- 5.6.2 Actual Production
- 5.6.3 Planned Capacity and Expansion Targets
- 5.7 Supply Chain Structure and Procurement Trends
- 5.8 Supply-Demand Gap and Bottlenecks
- 5.9 Import Dependence and Sourcing Structure
- 5.10 Contract Manufacturing and Outsourcing
- 5.11 Regional Supply and Demand Concentration
Chapter 6 Indonesia Coffee Market Pricing Analysis
- 6.1 Pricing Structure and Measurement
- 6.2 Historical Pricing Trends, 2018-2025
- 6.3 Pricing Outlook, 2025-2035
- 6.4 Average Selling Price and Unit Economics
- 6.5 Pricing by Product and Market Segment
- 6.6 Geographic Pricing Differences
- 6.7 Key Input, Energy, Labor and Logistics Costs
- 6.8 Contract Pricing and Purchasing Models
- 6.9 Pricing Sensitivity and Competitive Positioning
- 6.10 Price, Margin and Profitability Implications
Chapter 7 Indonesia Coffee Market Dynamics
- 7.1 Market Growth Drivers
- 7.1.1 Demand-Side Drivers
- 7.1.2 Technology and Innovation Drivers
- 7.1.3 Infrastructure and Investment Drivers
- 7.1.4 Regulatory and Policy Drivers
- 7.2 Market Restraints
- 7.2.1 Cost and Affordability Constraints
- 7.2.2 Technology and Adoption Barriers
- 7.2.3 Supply Chain and Operational Constraints
- 7.3 Market Challenges
- 7.3.1 Competitive Pressure and Margin Erosion
- 7.3.2 Skills, Infrastructure and Implementation Gaps
- 7.4 Emerging Market Opportunities
- 7.5 Market Dynamics Impact and Time-Horizon Assessment
Chapter 8 Indonesia Coffee Value Chain Analysis
- 8.1 Industry Value Chain Overview
- 8.2 Upstream Suppliers and Critical Inputs
- 8.3 Technology and Component Providers
- 8.4 Manufacturing or Service Delivery
- 8.5 Distribution, Channel Partners and Integrators
- 8.6 Downstream Applications and End Users
- 8.7 Value Addition and Profit Pools
- 8.8 Vertical Integration and Outsourcing
- 8.9 Supplier Concentration and Risk
- 8.10 Supply Chain Localization and Resilience
Chapter 9 Indonesia Coffee Market Regulations and Policies
- 9.1 Relevant Laws, Standards and Compliance Frameworks
- 9.2 Product, Service, Safety and Quality Requirements
- 9.3 Government Policies, Incentives and Subsidies
- 9.4 Imports, Exports and Trade Barriers
- 9.5 Public Procurement and Local Content Requirements
- 9.6 Environmental and Sustainability Compliance
- 9.7 Upcoming Policy Changes and Market Implications
Chapter 10 Indonesia Coffee Market Hotspots and Opportunities
- 10.1 Market Opportunity Mapping and Growth Hotspots
- 10.2 High-Growth Applications and Customer Groups
- 10.3 Underserved Markets and White-Space Opportunities
- 10.4 Emerging Technology and Product Opportunities
- 10.5 New Capacity and Investment Hotspots
- 10.6 Market Entry and Expansion Opportunities
- 10.7 Distribution and Partnership Opportunities
- 10.8 Near-Term and Long-Term Commercial Potential
- 10.9 Opportunity Attractiveness and Execution Risks
Chapter 11 Indonesia Coffee Market Outlook, 2025-2035
- 11.1 Market Size and Analysis
- 11.1.1 Revenue (Market Measurement: 2025: USD 2.31 billion → 2035: USD 4.73 billion)
- 11.1.2 Market Volume and Quantity Sold
- 11.1.3 Historical Market Size, 2018-2025
- 11.1.4 Base-Year Market Size, 2025
- 11.2 Market Forecast, 2025-2035
- 11.2.1 Revenue Forecast to 2035
- 11.2.2 Volume Forecast to 2035
- 11.2.3 CAGR and Year-on-Year Growth
- 11.2.4 Incremental Revenue Opportunity
- 11.3 Forecast Assumptions and Scenario Analysis
- 11.3.1 Base-Case Forecast
- 11.3.2 Optimistic and Conservative Scenarios
- 11.3.3 Technology, Pricing and Policy Sensitivities
- 11.4 Market Attractiveness and Growth Outlook
Chapter 12 Indonesia Coffee Market Segmentation and Outlook
- 12.1 Segmentation Summary and Market Shares, 2025
- 12.2 Largest and Fastest-Growing Segments
- 12.3 By Product Type - Market Size and Forecast, 2025-2035
- 12.3.1 Segment Definition and Scope
- 12.3.2 Historical Market Size, 2018-2025
- 12.3.3 Revenue Forecast, 2025-2035
- 12.3.4 Volume Forecast, 2025-2035
- 12.3.5 Base-Year Market Share, 2025
- 12.3.6 Segment CAGR and Growth Drivers
- 12.3.7 Subsegment Market Size and Forecast
- 12.3.7.1 Instant & Soluble Coffee
- 12.3.7.2 Roast & Ground Coffee
- 12.3.7.3 Whole Bean Coffee
- 12.3.7.4 Ready-to-Drink Coffee
- 12.3.8 Subsegment Pricing and Adoption Trends
- 12.3.9 Leading Suppliers and Competition
- 12.3.10 Regional Demand and Opportunities
- 12.4 By Price Tier - Market Size and Forecast, 2025-2035
- 12.4.1 Segment Definition and Scope
- 12.4.2 Historical Market Size, 2018-2025
- 12.4.3 Revenue Forecast, 2025-2035
- 12.4.4 Volume Forecast, 2025-2035
- 12.4.5 Base-Year Market Share, 2025
- 12.4.6 Segment CAGR and Growth Drivers
- 12.4.7 Subsegment Market Size and Forecast
- 12.4.7.1 Value
- 12.4.7.2 Mainstream
- 12.4.7.3 Premium
- 12.4.7.4 Specialty
- 12.4.8 Subsegment Pricing and Adoption Trends
- 12.4.9 Leading Suppliers and Competition
- 12.4.10 Regional Demand and Opportunities
- 12.5 By Packaging Format - Market Size and Forecast, 2025-2035
- 12.5.1 Segment Definition and Scope
- 12.5.2 Historical Market Size, 2018-2025
- 12.5.3 Revenue Forecast, 2025-2035
- 12.5.4 Volume Forecast, 2025-2035
- 12.5.5 Base-Year Market Share, 2025
- 12.5.6 Segment CAGR and Growth Drivers
- 12.5.7 Subsegment Market Size and Forecast
- 12.5.7.1 Sachets & Stick Packs
- 12.5.7.2 Pouches & Bags
- 12.5.7.3 Jars & Tins
- 12.5.7.4 Bottles & Cans
- 12.5.8 Subsegment Pricing and Adoption Trends
- 12.5.9 Leading Suppliers and Competition
- 12.5.10 Regional Demand and Opportunities
- 12.6 Segment Growth Comparison
- 12.7 Segment Attractiveness and Priority Matrix
Chapter 13 Indonesia Coffee Geographic Market Outlook, 2025-2035
- 13.1 Domestic Market Distribution and Demand Clusters
- 13.2 State- or Province-Wise Market Size and Forecast, 2025-2035
- 13.3 City and Metropolitan Market Outlook
- 13.4 Industrial, Manufacturing and Commercial Clusters
- 13.5 Geographic Concentration of Key End Users
- 13.6 Local Pricing and Purchasing Differences
- 13.7 Domestic Production Facilities and Capacity Map
- 13.8 Local Infrastructure and Project Pipeline
- 13.9 State-Level Policy and Incentive Differences
- 13.10 Subnational Investment Hotspots and Opportunities
- 13.11 Distribution and Logistics Networks
- 13.12 Domestic Competitive Footprint
Chapter 14 Indonesia Coffee Technology, Innovation and Sustainability Outlook
- 14.1 Technology Landscape and Maturity
- 14.2 Product, Process and Service Innovation
- 14.3 AI, Automation and Digital Tools in the Industry
- 14.4 Technology Adoption and Performance Benchmarking
- 14.5 Innovation Pipeline and R&D Investment
- 14.6 Patent and Intellectual Property Trends
- 14.7 Energy Efficiency and Resource Management
- 14.8 Sustainability, Recycling and Circularity
- 14.9 Technology Roadmap, 2025-2035
- 14.10 Risks of Obsolescence and Technology Substitution
Chapter 15 Indonesia Coffee Market Key Strategic Imperatives
- 15.1 Growth and Market Entry Priorities
- 15.2 High-Return Products and Segments
- 15.3 Pricing, Profitability and Cost Optimization
- 15.4 Technology Investment and Product Differentiation
- 15.5 Supply Chain Localization and Resilience
- 15.6 Distribution and Customer Acquisition
- 15.7 Partnership, Acquisition and Capacity Strategy
- 15.8 Regional Expansion Priorities
- 15.9 Short-, Medium- and Long-Term Actions
Chapter 16 Competition Outlook
- 16.1 Industry Competition Characteristics
- 16.2 Market Structure and Concentration
- 16.3 Market Share and Competitive Positioning, 2025
- 16.4 Company-Wise Revenue and Product Benchmarking
- 16.5 Production and Service Capacity Benchmarking
- 16.6 Technology, Pricing and Differentiation
- 16.7 Regional Footprint and Distribution Strength
- 16.8 Mergers, Acquisitions and Strategic Alliances
- 16.9 New Entrants and Competitive Threats
- 16.10 Porter's Five Forces and Industry Attractiveness
- 16.11 Competitive Outlook, 2025-2035
Chapter 17 Company Profiles
- 17.1 Company Coverage and Selection Criteria
- 17.2 PT Santos Jaya Abadi
- 17.2.1 Business Description
- 17.2.2 Company Ownership and Geographic Presence
- 17.2.3 Product and Service Portfolio
- 17.2.4 Manufacturing and Operating Footprint
- 17.2.5 Production Capacity and Expansion Plans
- 17.2.6 Financial Performance and Investment
- 17.2.7 Market Share and Competitive Position
- 17.2.8 Technology and Innovation Capabilities
- 17.2.9 Strategic Alliances or Partnerships
- 17.2.10 Recent Developments
- 17.2.11 Growth Strategy and Outlook
- 17.3 PT Mayora Indah Tbk
- 17.4 PT Nestlé Indonesia
- 17.5 PT Wings Surya
- 17.6 PT Sari Incofood Corporation
- 17.7 PT Aneka Coffee Industry
- 17.8 PT Java Prima Abadi
- 17.9 PT Otten Coffee Indonesia
- 17.10 PT JJ Multi Utama Indonesia
- 17.11 Tanamera Coffee Indonesia
- 17.12 Other Relevant Market Participants
Note: Every listed company is profiled on the structure shown under the first company. The company list is preliminary and may change based on research findings, market developments, data availability and client requirements.
Chapter 18 Disclaimer
- 18.1 Research and Forecast Disclaimer
- 18.2 Data Source and Estimation Limitations
Note: The depth of individual sections depends on data availability for this market. Volume, capacity, trade and other unit-based metrics are included where applicable.

