
Data centers, emission rules and remote sites shape demand
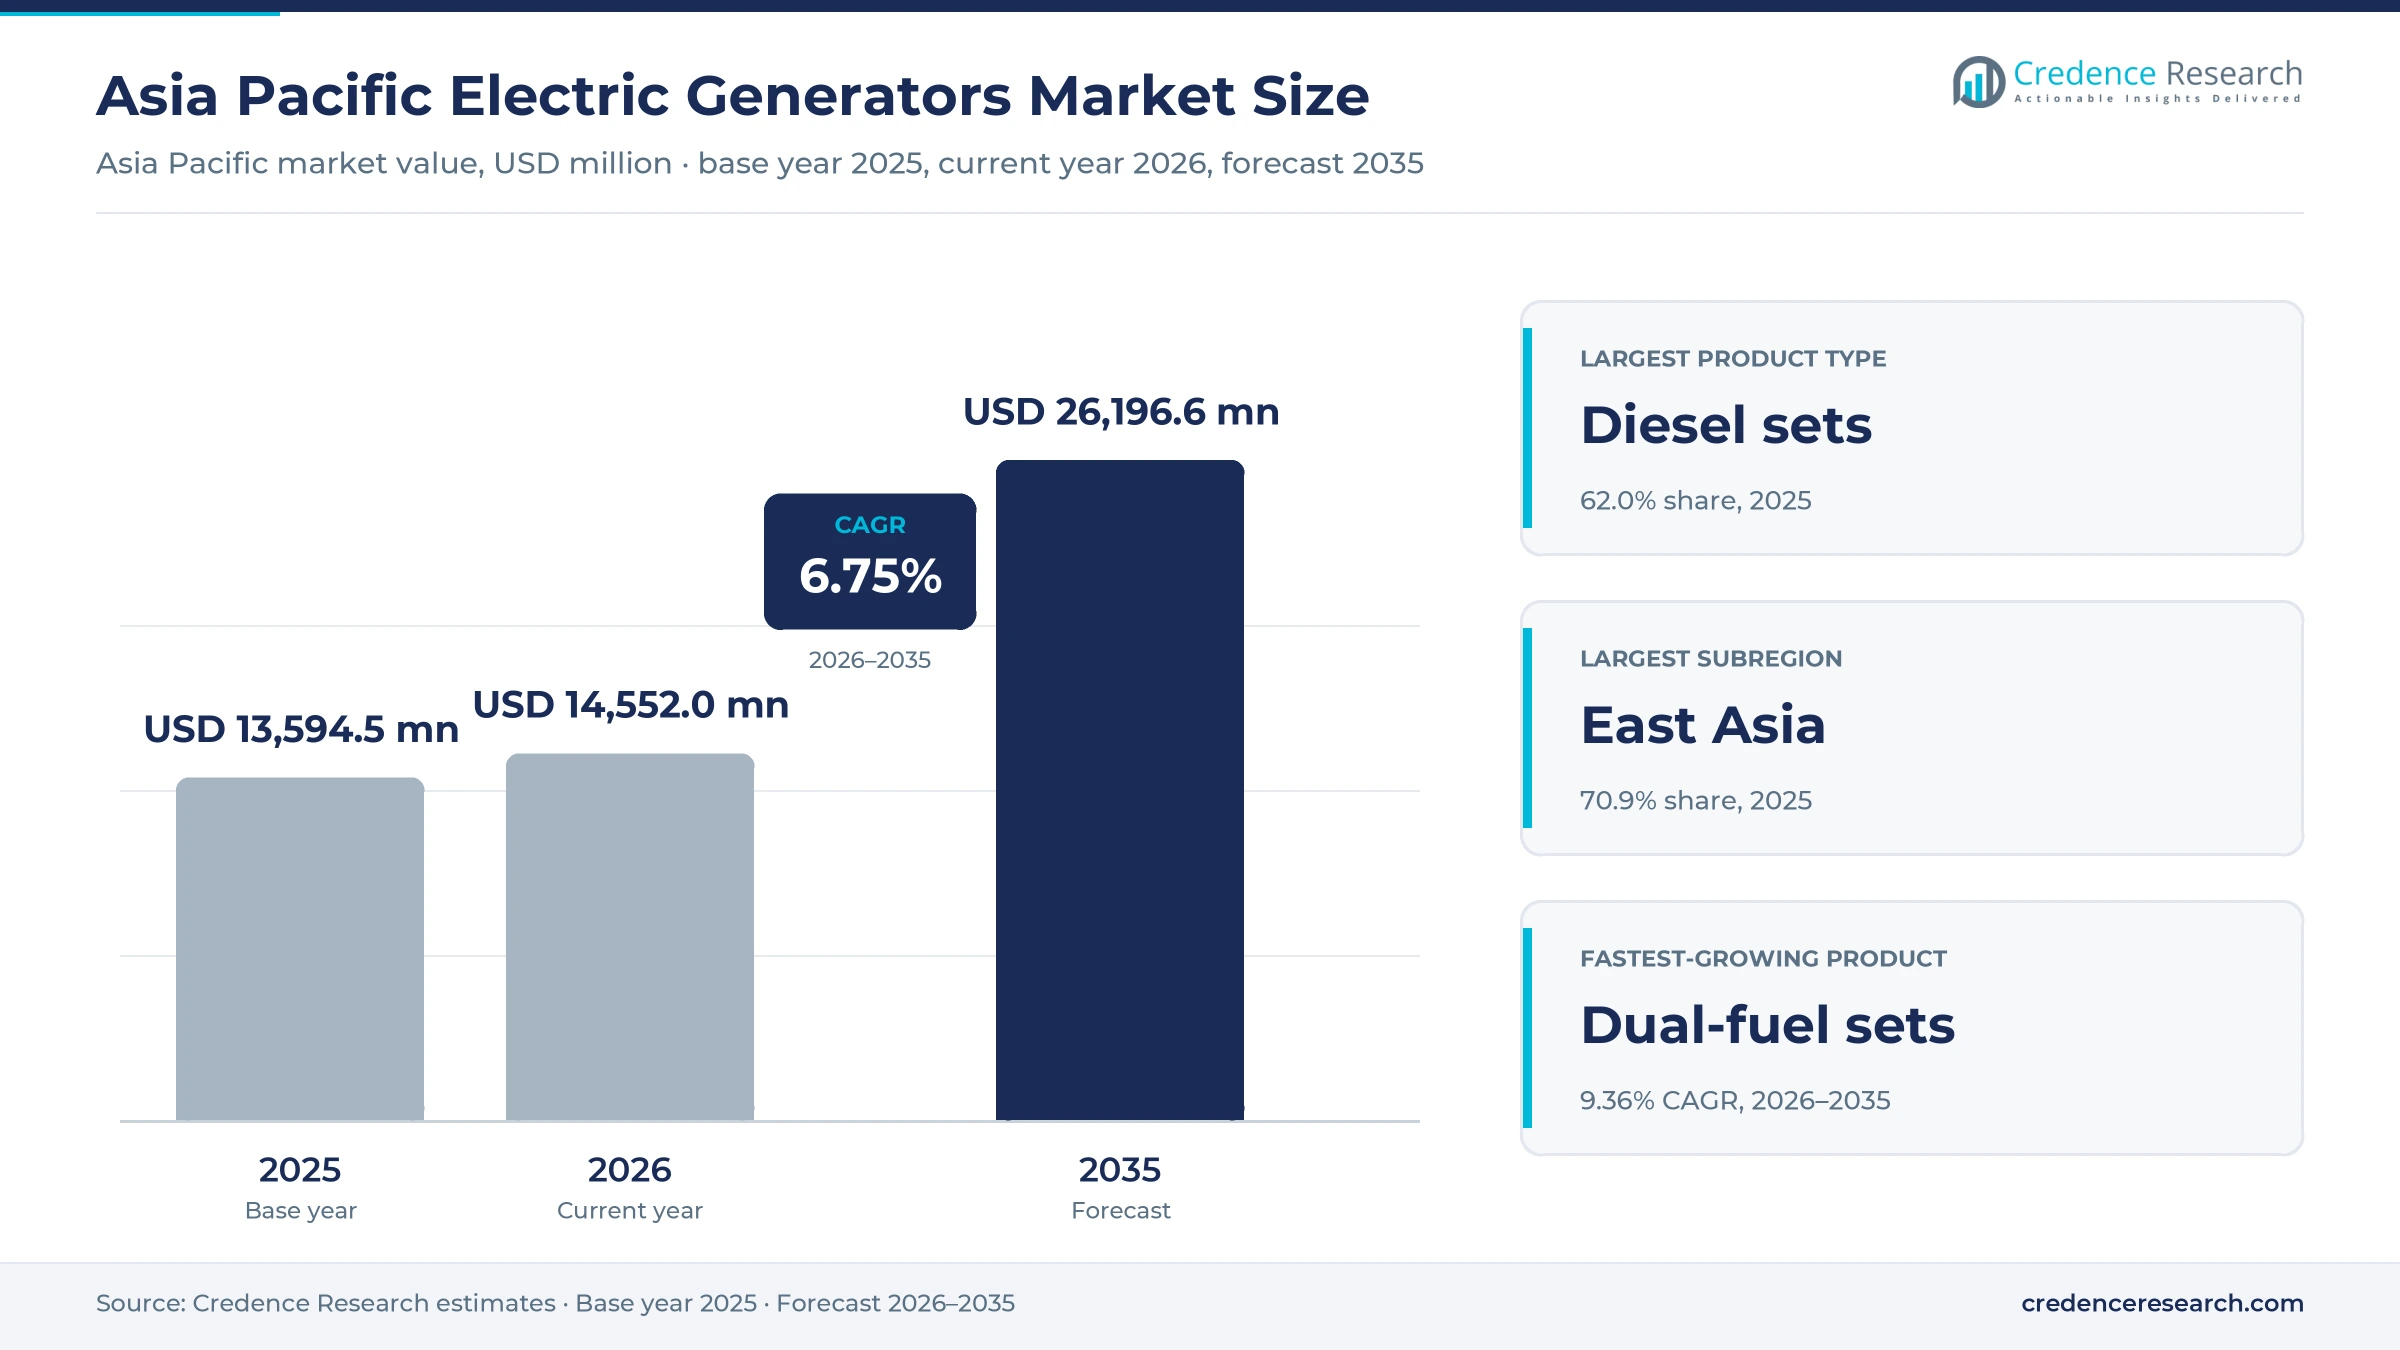
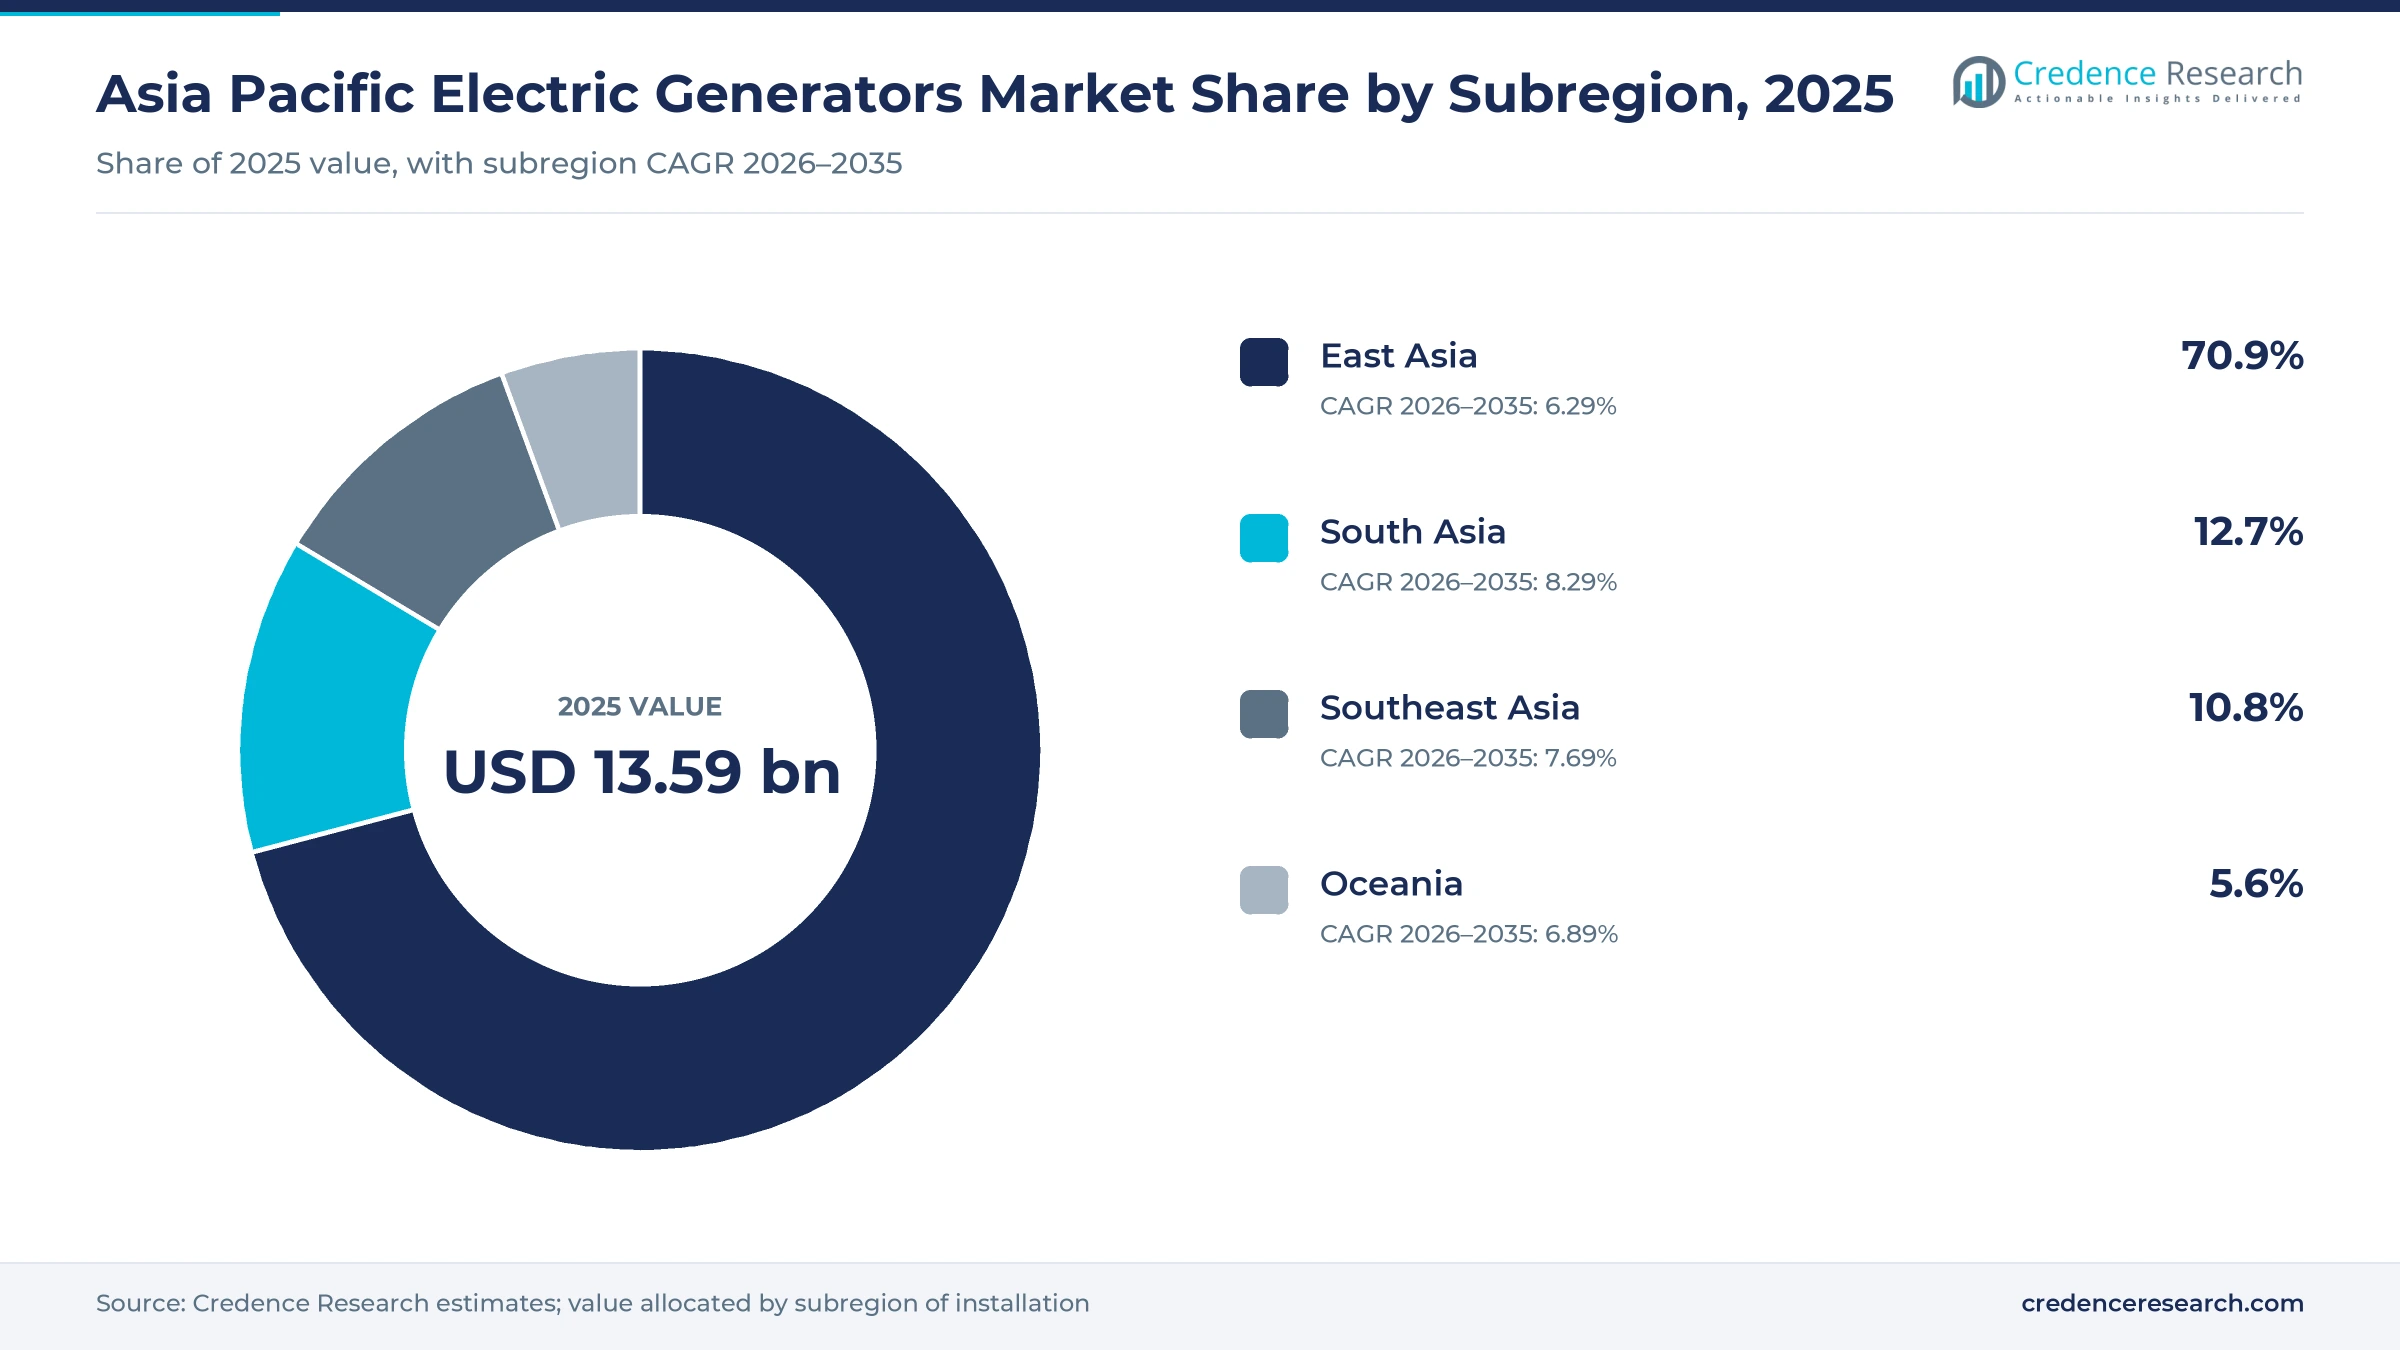
The Asia Pacific electric generators market was valued at USD 13.59 billion in 2025 and is projected to increase from USD 14.55 billion in 2026 to USD 26.20 billion by 2035, registering a CAGR of 6.75% during 2026–2035. Demand comes from data center operators, factories, mines, rental fleets and households that buy diesel, gas, petrol and dual-fuel sets for backup and off-grid power across the region. East Asia held the largest subregional share, 70.9% in 2025, because China, Japan and South Korea run the largest installed base of data centers, factories and commercial buildings. South Asia is the fastest-growing subregion at 8.29% a year, as India adds data center capacity and replaces older diesel sets with units that meet tighter emission rules. In turn, suppliers are shifting toward fast-start gas units, battery hybrid packages and remote monitoring, while large engine makers expand local production for mission-critical buyers.
Which generator products and buyers does the estimate cover?
The estimate measures the value of new diesel, gas, petrol, dual-fuel and alternative-fuel generator sets sold in Asia Pacific across ratings from small portable units below 10 kVA to large sets above 375 kVA. It covers sets bought through direct enterprise sales, authorized dealers and digital retail by facility operators, industrial owners, rental fleets and households.
The estimate excludes utility-scale turbines, wind and hydro generators, spare parts and maintenance services. The value chain runs from engine and alternator makers through packagers, dealers and rental companies to data center operators, factories, mines, telecom towers and homes across East Asia, South Asia, Southeast Asia and Oceania.
Asia Pacific Electric Generators Market Insights
- The Asia Pacific electric generators market was valued at USD 13.59 billion in 2025 and is projected to reach USD 26.20 billion by 2035, registering a CAGR of 6.75% during 2026–2035.
- East Asia held a 70.9% share of 2025 value, because China, Japan and South Korea operate the largest base of data centers and factories.
- Diesel generator sets led with a 62.0% share of 2025 value, because they start fast, store fuel on site and suit most backup duties.
- India made CPCB IV+ emission norms mandatory for new diesel sets up to 800 kW from July 1, 2023, which pushed a full product reset.
- Mission-critical facility operators grow fastest by customer type at 7.62% a year during 2026–2035, as hyperscale data centers order large sets.
Diesel sets lead while dual-fuel and alternative units rise
Why do diesel sets still lead product demand?
Based on product type, the market is categorized into diesel generator sets, gas generator sets, petrol generator sets and dual-fuel and alternative-fuel generator sets. Diesel Generator Sets led with a 62.0% share of 2025 value, because diesel units start fast and store fuel on site for long outages. Dual-Fuel and Alternative-Fuel Generator Sets grow fastest at 9.36% a year, as buyers test gas, biogas and hydrogen blends to cut emissions.
How do large ratings shape spending?
Based on power rating, the market is categorized into below 10 kilovolt-amperes, 10–75 kilovolt-amperes, above 75–375 kilovolt-amperes, and above 375 kilovolt-amperes. Above 375 Kilovolt-Amperes led with a 35.0% share of 2025 value, because data centers, hospitals and factories buy multi-megawatt sets. Above 375 Kilovolt-Amperes also grows fastest at 7.33% a year, as hyperscale campuses install banks of large units.
Why does standby power dominate use?
Based on application, the market is categorized into standby power, prime power, continuous power and peak shaving. Standby Power led with a 52.0% share of 2025 value, because most buyers run sets only when the grid fails. Peak Shaving grows fastest at 7.34% a year, as fast-start gas units let large users cut grid demand during tariff peaks.
Which buyers drive the largest orders?
Based on customer type, the market is categorized into mission-critical facility operators, industrial asset owners, rental fleet operators and household and mobile users. Mission-Critical Facility Operators led with a 34.0% share of 2025 value, because data centers and hospitals need redundant backup. Mission-Critical Facility Operators also grow fastest at 7.62% a year, as hyperscale capacity expands.
| Segment Group | Leading Sub-segment | Share, 2025 | Fastest-growing Sub-segment | CAGR, 2026–2035 |
|---|---|---|---|---|
| By Product Type | Diesel Generator Sets | 62.0% | Dual-Fuel and Alternative-Fuel Generator Sets | 9.36% |
| By Power Rating | Above 375 Kilovolt-Amperes | 35.0% | Above 375 Kilovolt-Amperes | 7.33% |
| By Application | Standby Power | 52.0% | Peak Shaving | 7.34% |
| By Customer Type | Mission-Critical Facility Operators | 34.0% | Mission-Critical Facility Operators | 7.62% |
Request a Free Sample
Fill in your details and we'll send you a free sample report.
- Sample data tables & charts
- Research methodology
Data centers, cleaner engines and mine power drive sales
How does critical computing growth lift standby demand?
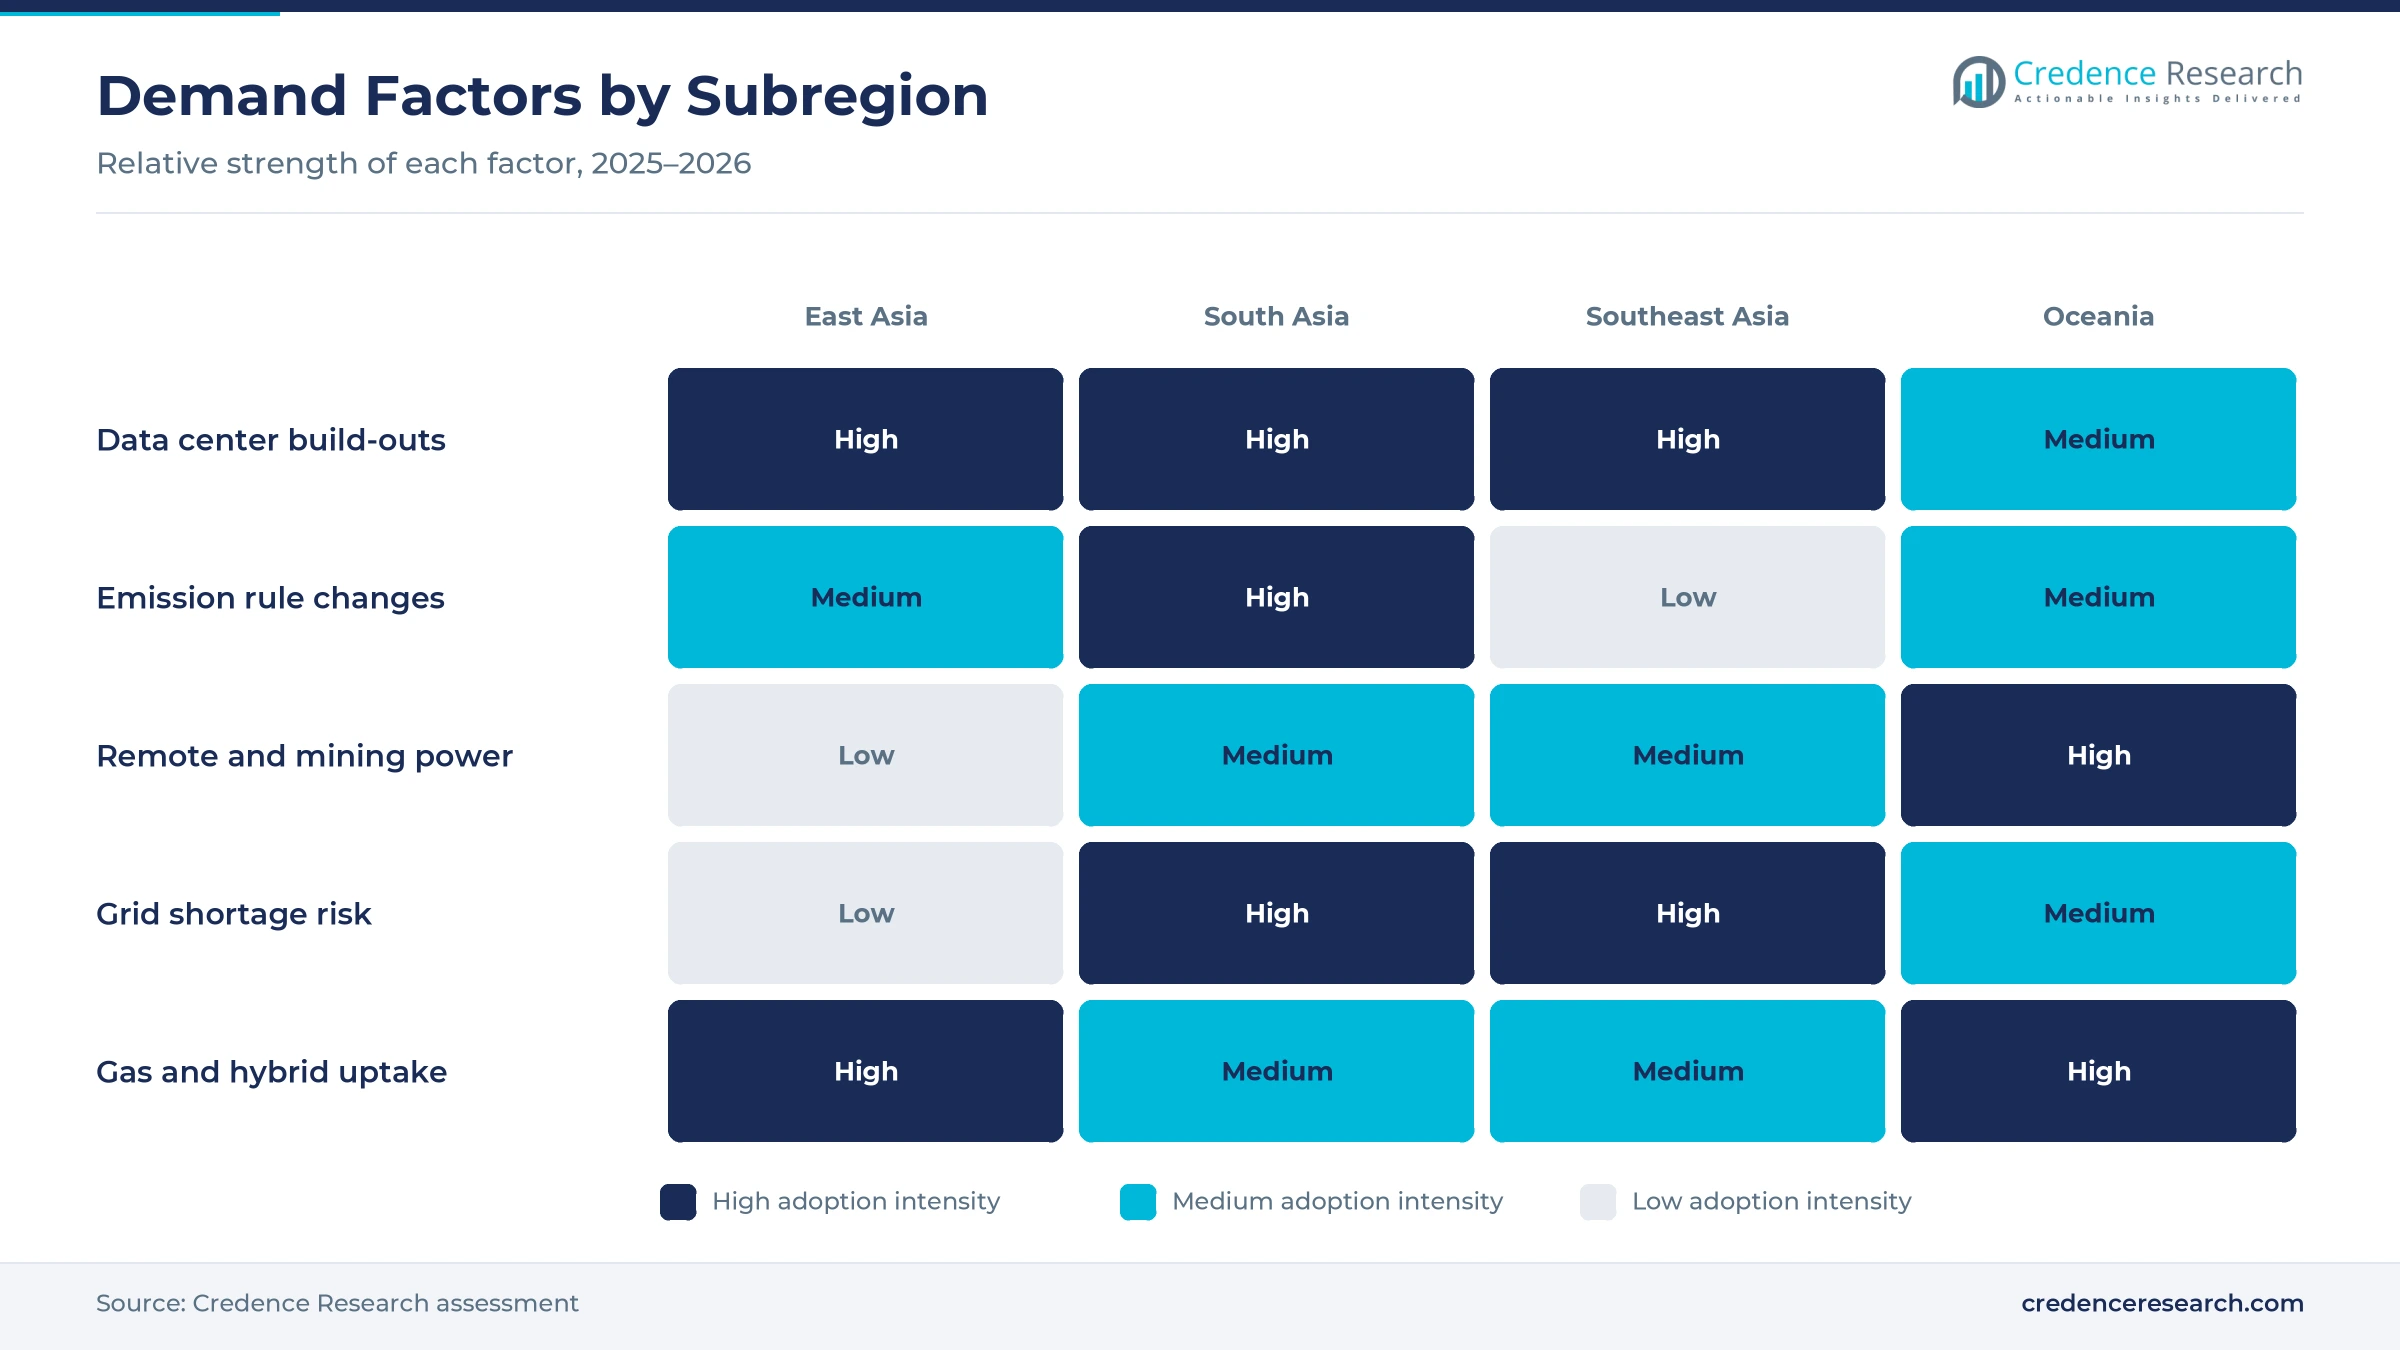
Every new data center hall needs diesel or gas sets that can carry the full IT load during a grid failure, so computing growth turns directly into standby orders. Data centers used about 415 TWh of electricity worldwide in 2024, and China accounted for 25% of that use, according to the International Energy Agency. Japan's grid coordinator OCCTO forecast in January 2025 that data centers will need 6.16 GW of peak demand by fiscal 2034. Rolls-Royce also supplied 31 mtu Series 4000 sets with 45.9 MW of capacity to an Osaka hyperscale data center in February 2024. As a result, mission-critical facility operators hold 34.0% of 2025 value, alongside spending on uninterruptible power supplies.
Why does compliant equipment qualification drive replacement?
Buyers must qualify new engines that meet stricter emission and safety rules before they can install them, which forces a wave of replacement purchases. India made CPCB IV+ norms mandatory for new diesel sets up to 800 kW from July 1, 2023, and the sale of older CPCB II sets was to stop after July 1, 2024. Kirloskar Oil Engines launched a CPCB IV+ range in September 2023 that runs on diesel, natural gas and biogas. Cummins India then showed a CPCB IV+ 82.5 kVA set for construction and quick-commerce sites at CII EXCON 2025. In turn, South Asia holds 12.7% of 2025 value, and its replacement demand rises quickly.
How does remote industrial power favor hybrid operation?
Mines and camps far from the grid need firm generation, yet they also want to cut fuel use with solar and batteries, so hybrid stations now anchor remote power. Aggreko connected a 4.4 MW solar farm and 2 MW of batteries to its 5 MW diesel station at the Porphyry gold mine in Western Australia, saving 1.67 million liters of diesel a year, according to Aggreko. Aggreko also expanded the Granny Smith mine system in August 2024 to 19 MW of solar and 9 MW of batteries beside gas engines. Atlas Copco says its ZenergiZe storage lets a paired generator be sized 40% smaller. As a result, industrial asset owners keep buying firm backup for every hybrid site, and Oceania grows at 6.89% a year.
Why do grid shortages keep backup sets in demand?
Factories in fast-growing economies still lose output when supply cannot keep up with peak load, which keeps backup sets on every plant shopping list. The World Bank estimated in August 2023 that power cuts in May and June cost Vietnam about USD 1.4 billion, or 0.3% of GDP, according to AFP. Malaysia's Johor data center capacity rose from 10 MW in early 2021 to about 1.3 GW by November 2024, ISEAS-Yusof Ishak Institute reported in June 2025, which adds load to the grid. In turn, Southeast Asia grows at 7.69% a year, and many buyers rent units through temporary power rental contracts during shortages.
Gas sets, hybrid packs and local engine output gain ground
How is the shift to fast-start gas sets changing backup?
Operators want lower emissions without losing the start speed of diesel units, so gas sets that start in seconds are gaining a place in backup design. Caterpillar introduced the G3520 Fast Response gas set for 50 Hz mission-critical sites in August 2024, rated at 2.6 MW and able to accept load from a cold start in 10 seconds. Kirloskar's CPCB IV+ range also runs on natural gas and biogas as well as diesel. Gas units can also run during tariff peaks, which diesel standby sets rarely do. As a result, gas generator sets and peak shaving gain share, and peak shaving grows at 7.34% a year, the fastest application rate.
Why is the rise of local engine production notable?
Buyers in China want shorter lead times for large data center sets, and engine makers are responding by building more engines inside the country. Rolls-Royce Power Systems launched the mtu Series 2000 G06 engine in August 2025 at MTU Yuchai Power, its joint venture with Guangxi Yuchai, according to Rolls-Royce. The joint venture has built more than 3,000 mtu engines since April 2018 and signed agreements with more than ten generator packagers at the launch. Chinese business outlet Jiemian reported that local output of data center engines is about 1,000 a year, below demand. In turn, local engine supply supports sales of large sets above 375 kVA across East Asia.
Can hydrogen-ready engines open new fuel options?
Large users with net-zero targets want backup sets that can switch away from diesel over time, and hydrogen-ready engines offer that path. Mitsubishi Heavy Industries Engine & Turbocharger reported rated operation of a 6-cylinder 500 kW-class hydrogen engine set in March 2025, after starting in-house evaluation in May 2024. The company's MGS3100R diesel set, launched in August 2023, offers 3,025 kVA of standby power for data centers and hospitals and uses common rail fuel injection and a smaller radiator to save installation space. Kirloskar's multi-fuel CPCB IV+ sets also accept biogas in India. As a result, dual-fuel and alternative-fuel generator sets grow at 9.36% a year, the fastest product rate.
Will hybrid storage packages open rental growth?
Rental fleets can offer lower fuel bills and quieter sites by pairing generators with batteries, which creates an opening for hybrid rental packages. Atlas Copco launched its ZenergiZe storage range in September 2020 and says its hybrid mode can cut fuel use by up to 50% over 12 hours against a larger standalone set. Aggreko added two Y.Cube battery systems at Porphyry in February 2024 and expanded storage at Granny Smith to 9 MW in August 2024. Rental users also avoid capital outlays when projects are short or uncertain. In turn, rental fleet operators add hybrid packages, and suppliers that bundle battery storage with sets win longer contracts.
Fuel costs, emission limits and grid upgrades test suppliers
How do fuel price swings raise operating costs?
Prime and continuous power users burn diesel or gas for thousands of hours each year, so every fuel price swing feeds straight into operating costs. Remote mines and island grids in Australia and the Pacific feel these swings most, since fuel must be trucked or shipped to each site over long distances. As a result, some buyers delay new sets or shift to hybrid systems. Suppliers respond with more efficient engines, battery pairing and fuel management software.
Why do emission limits add cost and testing time?
Cleaner engines need after-treatment, new controls and fresh type approvals, which adds both cost and testing time for every maker that sells in the region. India's CPCB IV+ change forced makers to redesign most ratings up to 800 kW at once. In turn, compliant sets carry added hardware cost, and some small buyers in shops and offices may keep older units running longer. Makers respond with modular after-treatment, shared platforms and dealer training.
How do grid upgrades reduce some backup needs?
Better supply in cities lowers the number of hours households and shops run small sets, which trims some backup needs. India, Indonesia and Bangladesh each reported electricity access above 99% of people in 2024, based on World Bank data, so outages are shorter in many towns. As a result, demand for small portable units grows slowly in urban markets. Suppliers respond by targeting rural, island and outdoor users and by selling quieter inverter models.
Why do local permits slow large installations?
Noise, fuel storage and air quality rules apply to every bank of large sets at a data center or hospital, so permits can slow large installations. Projects in dense cities often face longer reviews from local authorities, because sites sit close to homes and offices. In turn, delivery schedules can slip even after orders are signed. Suppliers respond with containerized sets, lower-noise enclosures and gas options that ease air permit reviews.
East Asia leads while South Asia grows fastest
| Subregion | Value, 2025 (USD billion) | Share, 2025 | CAGR, 2026–2035 |
|---|---|---|---|
| East Asia | 9.64 | 70.9% | 6.29% |
| South Asia | 1.73 | 12.7% | 8.29% |
| Southeast Asia | 1.47 | 10.8% | 7.69% |
| Oceania | 0.76 | 5.6% | 6.89% |
Why does East Asia keep the top share?
East Asia held a 70.9% share of 2025 value and grows at 6.29% a year, because China, Japan and South Korea operate the largest base of data centers, factories and commercial buildings in the region. Japan's OCCTO expects data centers and chip plants to need 7.15 GW of peak demand by fiscal 2034, while Rolls-Royce delivered 45.9 MW of mtu sets to one Osaka site. However, growth is slower than in South Asia, because the installed base is already large and grids are more reliable.
How fast is South Asia adding generator demand?
South Asia held a 12.7% share of 2025 value and grows fastest at 8.29% a year, because India is adding data centers and replacing older diesel sets. India's data center capacity rose from about 375 MW in 2020 to around 1,500 MW by 2025, according to Digital India. CPCB IV+ rules also forced a full product reset by Cummins India, Kirloskar Oil Engines and other makers, which lifts the value of each new set.
Why does Southeast Asia need more backup power?
Southeast Asia held a 10.8% share of 2025 value and grows at 7.69% a year, because factories and new data centers face grid strain. Power cuts in May and June 2023 cost Vietnam about USD 1.4 billion, according to a World Bank estimate. Johor in Malaysia also grew to about 1.3 GW of data center capacity by November 2024, and each campus needs large standby sets.
What role does Oceania play?
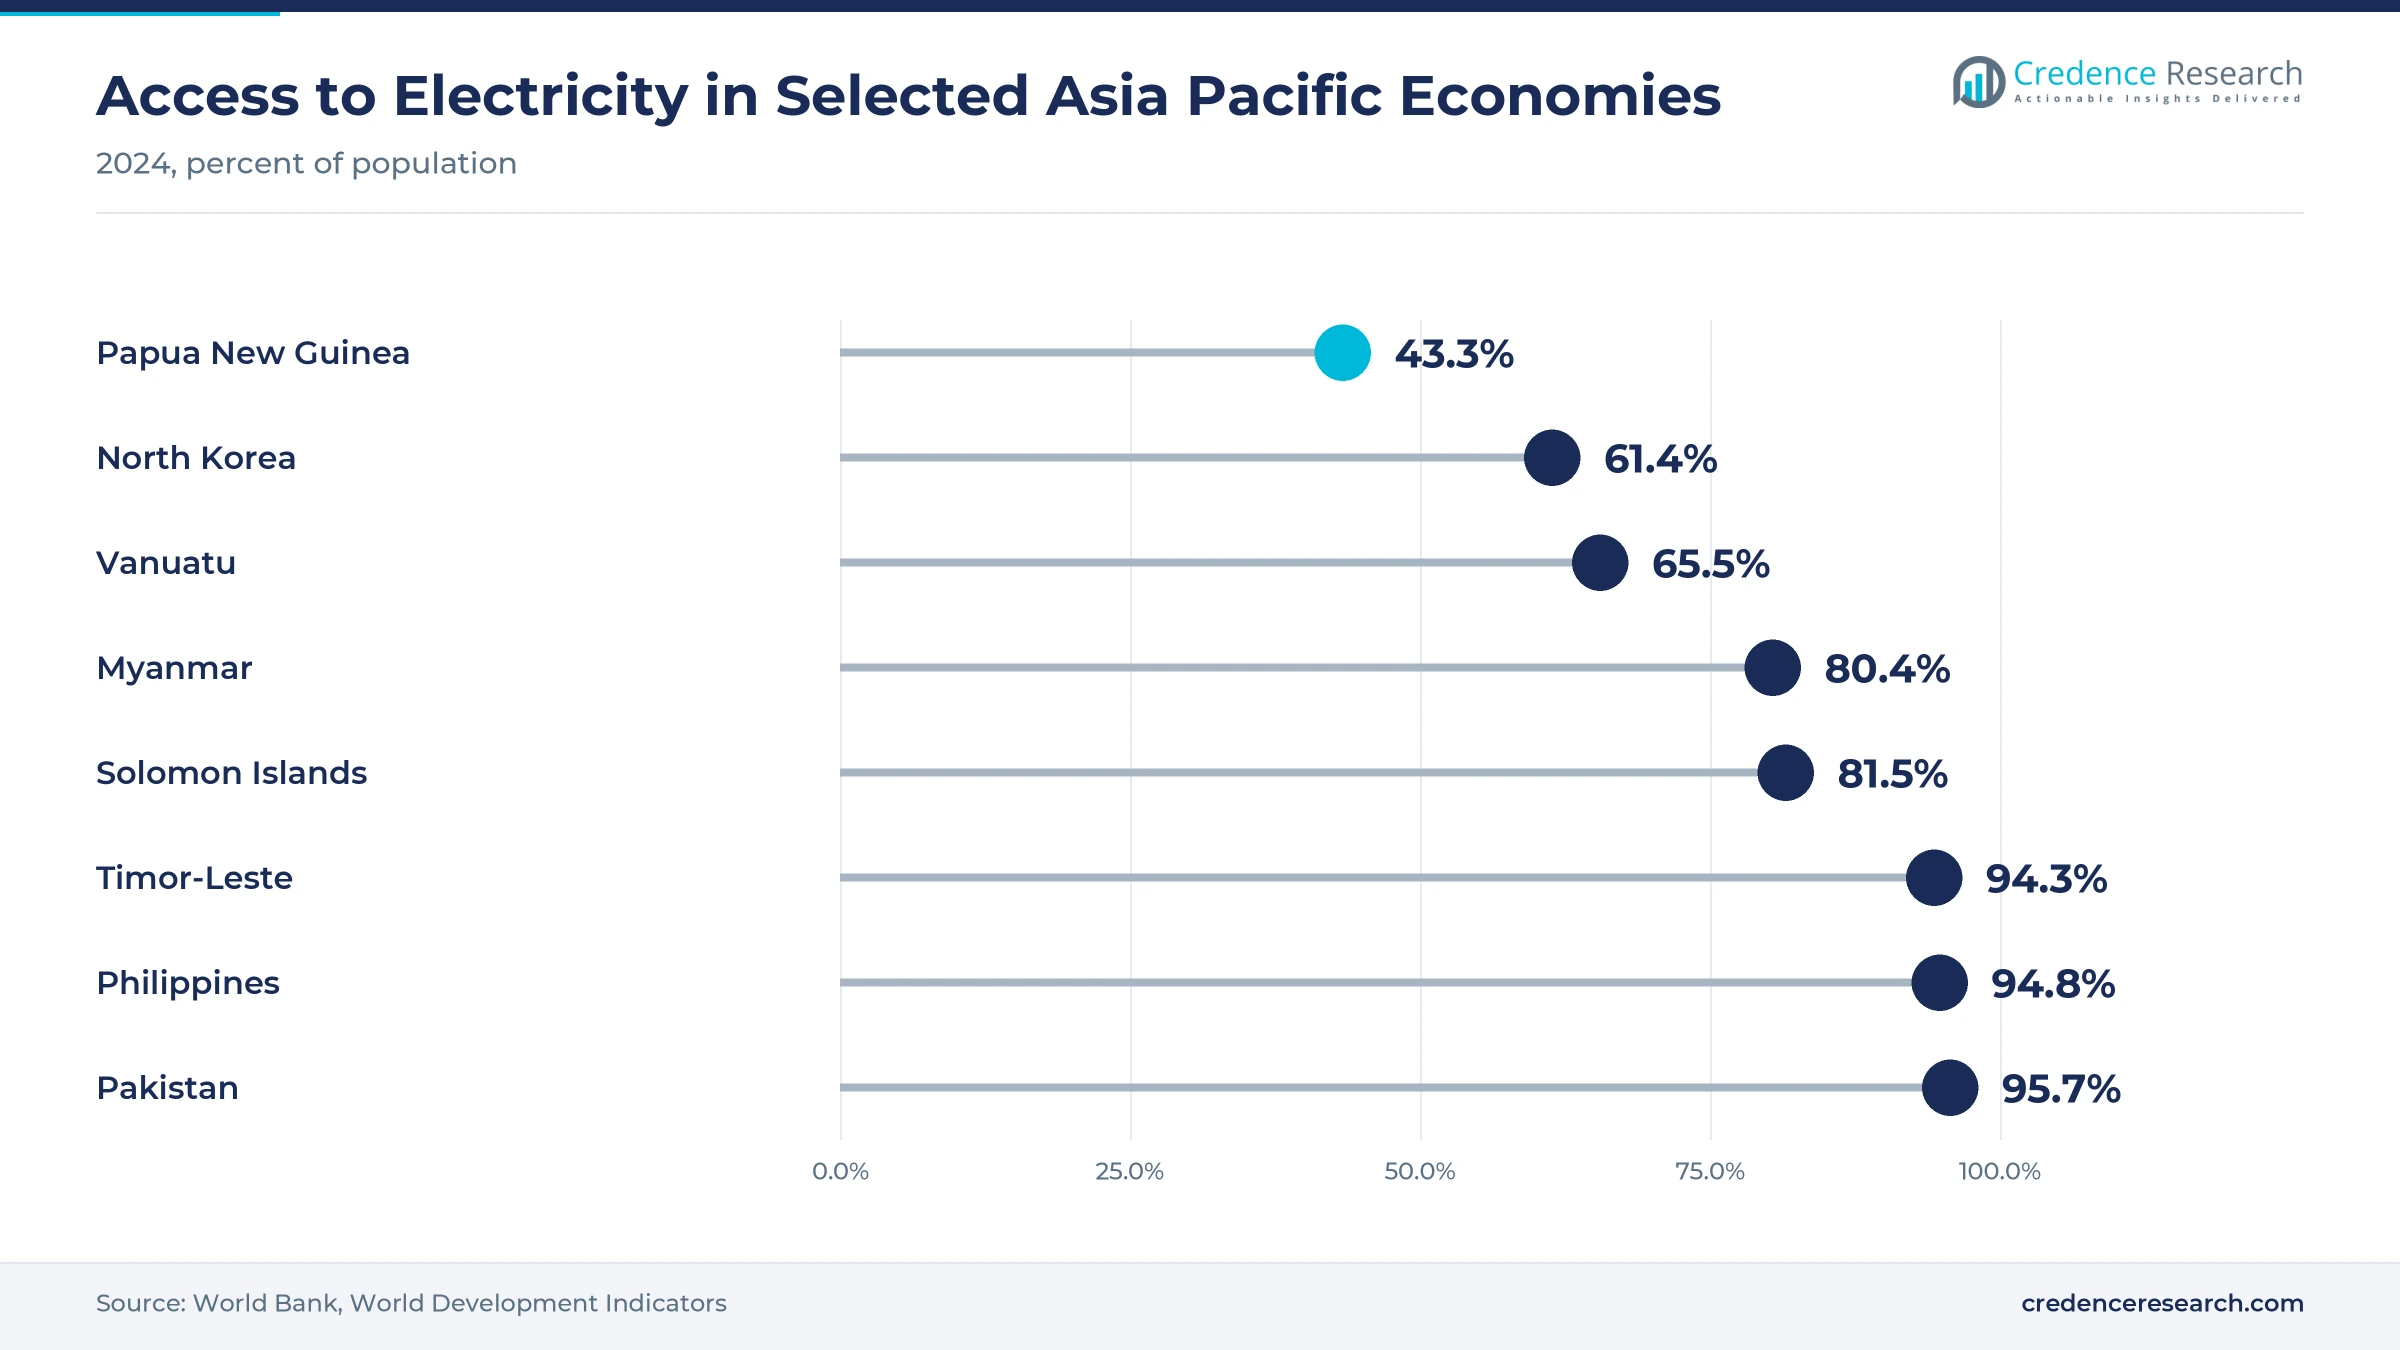
Oceania held a 5.6% share of 2025 value and grows at 6.89% a year, because Australian mines and Pacific islands rely on off-grid generation. Only 43.3% of people in Papua New Guinea had electricity access in 2024, according to World Bank data. Aggreko also runs hybrid solar, battery and engine stations at Western Australian gold mines such as Porphyry and Granny Smith.
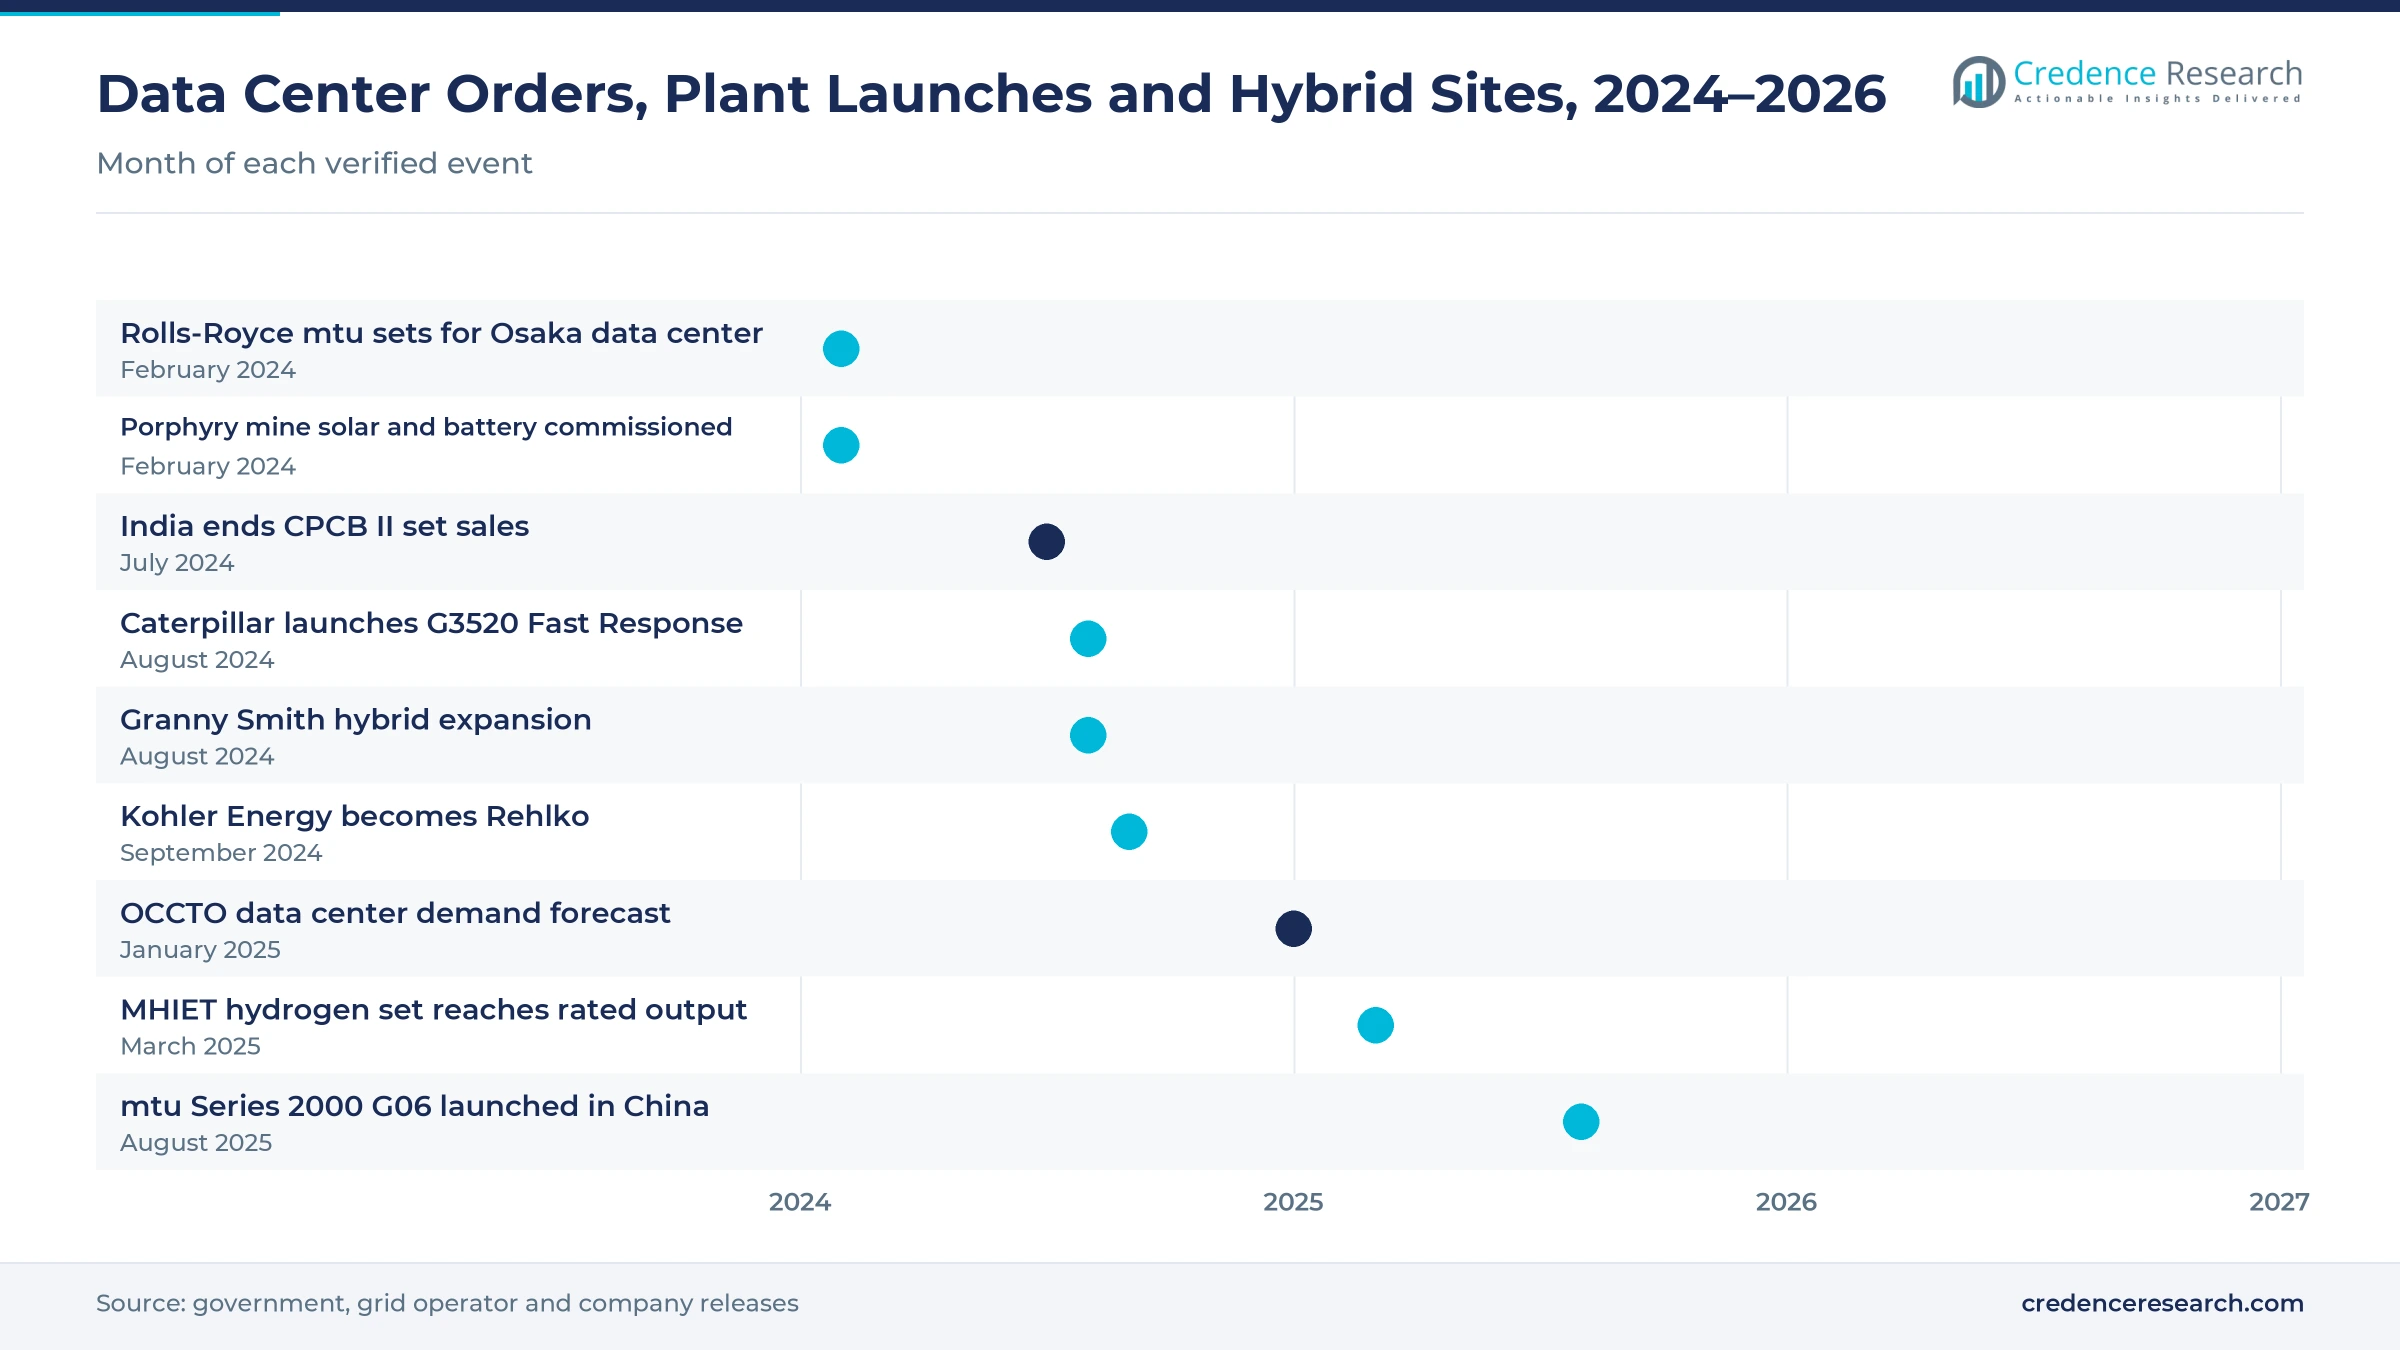
Data center orders, launches and hybrid sites, 2024–2026
| Development | Status and market relevance |
|---|---|
| In February 2024, Rolls-Royce supplied 31 mtu Series 4000 emergency sets to a hyperscale data center near Osaka, Japan. | 45.9 MW of designed capacity |
| In May 2024, Aggreko reported its 4.4 MW solar farm and battery system at the Porphyry gold mine in Western Australia. | Saves 1.67 million liters of diesel a year |
| In August 2024, Caterpillar introduced the G3520 Fast Response gas generator set for 50 Hz mission-critical sites. | 2.6 MW, accepts load in 10 seconds |
| In September 2024, Kohler Energy rebranded as Rehlko, keeping its power systems and engines businesses. | Operations across Asia continue under the new name |
| In August 2025, Rolls-Royce Power Systems launched the mtu Series 2000 G06 engine at MTU Yuchai Power in China. | Local supply for data center and rental sets |
Fast-start gas units, hybrid storage and smart controls
- Fast-start gas sets accept load within seconds and can also run during tariff peaks, as with the 2.6 MW Caterpillar G3520 Fast Response unit for 50 Hz grids.
- Battery hybrid packages let a smaller generator cover base load while storage handles peaks, which Atlas Copco says can cut fuel use by up to 50%.
- IoT-enabled controllers send run hours, fuel levels and faults to owners, and Kirloskar Oil Engines says it has deployed more than 60,000 connected sets.
- Hydrogen-capable engines are moving from test cells to rated operation, as Mitsubishi Heavy Industries Engine & Turbocharger showed with a 500 kW-class unit in 2025.
Need a Custom Version of This Report?
Tailor the scope, geography, or segments to your exact requirements.
- Custom geography or segment scope
- Direct access to our analyst team
Engine makers, local packagers and rental firms compete
Competition is split between global engine makers that supply large sets for data centers and mines, Indian makers that lead mid-range diesel sets at home, Japanese makers of portable and industrial units, and rental companies that own large fleets. Rolls-Royce Power Systems supplies mtu sets to Japanese hyperscale sites and builds engines in China through MTU Yuchai Power. Cummins India and Kirloskar Oil Engines compete on CPCB IV+ compliant ranges, while Honda India Power Products builds portable units in Greater Noida. Aggreko and Atlas Copco compete in rental and hybrid power, especially in Australian mining. Rivals compete on start time, fuel flexibility, dealer coverage and service. Because large buyers sign multiyear frame agreements, suppliers with local engine output and proven hybrid designs win the largest new programs.
Key suppliers active in the region
| Company | Type | Role in the market |
|---|---|---|
| Rolls-Royce Power Systems | Global engine and set maker | 31 mtu sets for an Osaka data center; mtu Series 2000 G06 built in China |
| Cummins Inc. | Global engine and set maker | Cummins India showed a CPCB IV+ 82.5 kVA set at CII EXCON 2025 |
| Kirloskar Oil Engines Limited | Indian engine and set maker | Multi-fuel, IoT-enabled CPCB IV+ range launched in 2023 |
| Mitsubishi Heavy Industries Engine & Turbocharger, Ltd. | Japanese engine and set maker | MGS3100R 3,025 kVA set; 500 kW-class hydrogen set |
| Caterpillar Inc. | Global engine and set maker | G3520 Fast Response gas set for 50 Hz mission-critical sites |
| Aggreko | Power rental and hybrid operator | Hybrid solar, battery and engine stations at Western Australian mines |
| Atlas Copco Group | Portable power and storage supplier | ZenergiZe storage paired with mobile generators in Australia |
| Honda Motor Co., Ltd. | Portable set maker | Honda India Power Products builds portable units in Greater Noida |
Credence Research view on regional generator demand
Credence Research's view is that Asia Pacific demand for electric generators will grow steadily because data centers, emission rules and remote industry all require new sets at the same time. East Asia remains the largest buyer, while India and Southeast Asia add the most new demand from data center and factory growth. Large sets above 375 kVA take a rising share of value. Suppliers that combine local engine output, gas and hybrid options and strong dealer service should gain share fastest. Fuel costs, permit delays and grid upgrades remain the main risks.
How the regional generator estimate was built
The report uses 2025 as the base year on a calendar basis, and market values come from the Credence Research model. That model combines data center capacity statistics, electricity access data, emission rules, trade statistics and company releases on generator launches, orders and plants. Segment splits and subregional growth rates are Credence Research estimates, while subregional shares follow the client-defined split. Sources used are public reports, official statistics, trade press and company releases, and no interviews or surveys were used for this generator estimate.
Critical sites and hybrid fleets carry growth to 2035
Generator value is expected to reach USD 26.20 billion by 2035, a 6.75% CAGR during 2026–2035, as data centers, mines and factories add firm power. Growth should stay strong through 2030 while India, Japan and Malaysia build new data center capacity. After that, gas, hybrid and hydrogen-capable sets will carry more of the growth as emission rules tighten. Faster grid upgrades would cut some small-unit demand, while extreme weather and supply shortages would lift backup orders. Suppliers with local engine output and hybrid designs are expected to gain the most.
Frequently Asked Questions
How big is the Asia Pacific electric generators market?
Which product type leads regional demand?
Which subregion leads the Asia Pacific generator market?
How do India's CPCB IV+ norms affect generator demand?
Why do data centers matter for generator sales?
How are mines in Australia changing generator use?
Who are the leading companies in Asia Pacific electric generators?
What are the main challenges for generator suppliers?
Table of Content
Chapter 1 Market Segmentation
- 1.1 Segmentation Framework
- 1.1.1 Product and Service Classification
- 1.1.2 Application and End-Use Classification
- 1.1.3 Technology and Solution Classification
- 1.1.4 Customer and Distribution Channel Classification
- 1.1.5 Geographic Segmentation
- 1.1.6 Market Segment Definitions and Boundaries
- 1.2 By Product Type
- 1.2.1 Diesel Generator Sets
- 1.2.2 Gas Generator Sets
- 1.2.3 Petrol Generator Sets
- 1.2.4 Dual-Fuel and Alternative-Fuel Generator Sets
- 1.3 By Power Rating
- 1.3.1 Below 10 Kilovolt-Amperes
- 1.3.2 10–75 Kilovolt-Amperes
- 1.3.3 Above 75–375 Kilovolt-Amperes
- 1.3.4 Above 375 Kilovolt-Amperes
- 1.4 By Application
- 1.4.1 Standby Power
- 1.4.2 Prime Power
- 1.4.3 Continuous Power
- 1.4.4 Peak Shaving
- 1.5 By Customer Type
- 1.5.1 Mission-Critical Facility Operators
- 1.5.2 Industrial Asset Owners
- 1.5.3 Rental Fleet Operators
- 1.5.4 Household and Mobile Users
- 1.6 By Subregion
- 1.6.1 East Asia
- 1.6.2 South Asia
- 1.6.3 Southeast Asia
- 1.6.4 Oceania
Chapter 2 Introduction
- 2.1 Report Objectives and Scope
- 2.2 Product Definition and Industry Terminology
- 2.3 Market Inclusions and Exclusions
- 2.4 Research Process
- 2.4.1 Primary Research and Expert Interviews
- 2.4.2 Secondary Research and Source Review
- 2.4.3 Top-Down and Bottom-Up Estimation
- 2.4.4 Data Triangulation and Verification
- 2.5 Market Size Measurement Basis
- 2.5.1 2025: USD 13.59 billion → 2035: USD 26.20 billion
- 2.6 Historical and Forecast Reference Periods
- 2.6.1 Historical Period: 2018-2025
- 2.6.2 Base Year: 2025
- 2.6.3 Forecast Period: 2025-2035
- 2.7 Research Assumptions and Limitations
Chapter 3 Executive Summary
- 3.1 Market Snapshot and Key Findings
- 3.2 Base-Year Market Size, 2025
- 3.3 Forecast Market Size, 2035
- 3.4 Revenue and Volume Growth Outlook
- 3.5 Key Demand and Supply Indicators
- 3.6 Leading Market Segments
- 3.7 Fastest-Growing Market Opportunities
- 3.8 Regional Performance Highlights
- 3.9 Technology and Industry Transformation
- 3.10 Competitive Landscape Summary
- 3.11 Analyst View and Strategic Implications
Chapter 4 Asia Pacific Electric Generators Market Trends and Developments
- 4.1 Historical Industry Development, 2018-2025
- 4.2 Recent Market Trends and Developments
- 4.3 Demand and Customer Behavior Trends
- 4.4 Technology and Product Innovation
- 4.5 Artificial Intelligence, Automation and Digitalization
- 4.6 Local Manufacturing and Supply Chain Realignment
- 4.7 Industry Partnerships, Mergers and Acquisitions
- 4.8 Sustainability and Circular Economy Developments
- 4.9 Government and Private Sector Investment Trends
- 4.10 Emerging Business Models and Commercialization
- 4.11 Industry Developments and Announcements
Chapter 5 Asia Pacific Electric Generators Market Production, Supply and Demand Analysis
- 5.1 Demand Trend and Consumption Analysis, 2018-2025
- 5.2 Demand Forecast, 2025-2035
- 5.3 Production and Output Trend, 2018-2025
- 5.4 Production and Output Forecast, 2025-2035
- 5.5 Installed Capacity and Capacity Utilization
- 5.6 Company-Wise Production Plants and Statistics
- 5.6.1 Installed Production Capacity
- 5.6.2 Actual Production
- 5.6.3 Planned Capacity and Expansion Targets
- 5.7 Supply Chain Structure and Procurement Trends
- 5.8 Supply-Demand Gap and Bottlenecks
- 5.9 Import Dependence and Sourcing Structure
- 5.10 Contract Manufacturing and Outsourcing
- 5.11 Regional Supply and Demand Concentration
Chapter 6 Asia Pacific Electric Generators Market Pricing Analysis
- 6.1 Pricing Structure and Measurement
- 6.2 Historical Pricing Trends, 2018-2025
- 6.3 Pricing Outlook, 2025-2035
- 6.4 Average Selling Price and Unit Economics
- 6.5 Pricing by Product and Market Segment
- 6.6 Geographic Pricing Differences
- 6.7 Key Input, Energy, Labor and Logistics Costs
- 6.8 Contract Pricing and Purchasing Models
- 6.9 Pricing Sensitivity and Competitive Positioning
- 6.10 Price, Margin and Profitability Implications
Chapter 7 Asia Pacific Electric Generators Market Dynamics
- 7.1 Market Growth Drivers
- 7.1.1 Demand-Side Drivers
- 7.1.2 Technology and Innovation Drivers
- 7.1.3 Infrastructure and Investment Drivers
- 7.1.4 Regulatory and Policy Drivers
- 7.2 Market Restraints
- 7.2.1 Cost and Affordability Constraints
- 7.2.2 Technology and Adoption Barriers
- 7.2.3 Supply Chain and Operational Constraints
- 7.3 Market Challenges
- 7.3.1 Competitive Pressure and Margin Erosion
- 7.3.2 Skills, Infrastructure and Implementation Gaps
- 7.4 Emerging Market Opportunities
- 7.5 Market Dynamics Impact and Time-Horizon Assessment
Chapter 8 Asia Pacific Electric Generators Value Chain Analysis
- 8.1 Industry Value Chain Overview
- 8.2 Upstream Suppliers and Critical Inputs
- 8.3 Technology and Component Providers
- 8.4 Manufacturing or Service Delivery
- 8.5 Distribution, Channel Partners and Integrators
- 8.6 Downstream Applications and End Users
- 8.7 Value Addition and Profit Pools
- 8.8 Vertical Integration and Outsourcing
- 8.9 Supplier Concentration and Risk
- 8.10 Supply Chain Localization and Resilience
Chapter 9 Asia Pacific Electric Generators Market Regulations and Policies
- 9.1 Relevant Laws, Standards and Compliance Frameworks
- 9.2 Product, Service, Safety and Quality Requirements
- 9.3 Government Policies, Incentives and Subsidies
- 9.4 Imports, Exports and Trade Barriers
- 9.5 Public Procurement and Local Content Requirements
- 9.6 Environmental and Sustainability Compliance
- 9.7 Upcoming Policy Changes and Market Implications
Chapter 10 Asia Pacific Electric Generators Market Hotspots and Opportunities
- 10.1 Market Opportunity Mapping and Growth Hotspots
- 10.2 High-Growth Applications and Customer Groups
- 10.3 Underserved Markets and White-Space Opportunities
- 10.4 Emerging Technology and Product Opportunities
- 10.5 New Capacity and Investment Hotspots
- 10.6 Market Entry and Expansion Opportunities
- 10.7 Distribution and Partnership Opportunities
- 10.8 Near-Term and Long-Term Commercial Potential
- 10.9 Opportunity Attractiveness and Execution Risks
Chapter 11 Asia Pacific Electric Generators Market Outlook, 2025-2035
- 11.1 Market Size and Analysis
- 11.1.1 Revenue (Market Measurement: 2025: USD 13.59 billion → 2035: USD 26.20 billion)
- 11.1.2 Market Volume and Quantity Sold
- 11.1.3 Historical Market Size, 2018-2025
- 11.1.4 Base-Year Market Size, 2025
- 11.2 Market Forecast, 2025-2035
- 11.2.1 Revenue Forecast to 2035
- 11.2.2 Volume Forecast to 2035
- 11.2.3 CAGR and Year-on-Year Growth
- 11.2.4 Incremental Revenue Opportunity
- 11.3 Forecast Assumptions and Scenario Analysis
- 11.3.1 Base-Case Forecast
- 11.3.2 Optimistic and Conservative Scenarios
- 11.3.3 Technology, Pricing and Policy Sensitivities
- 11.4 Market Attractiveness and Growth Outlook
Chapter 12 Asia Pacific Electric Generators Market Segmentation and Outlook
- 12.1 Segmentation Summary and Market Shares, 2025
- 12.2 Largest and Fastest-Growing Segments
- 12.3 By Product Type - Market Size and Forecast, 2025-2035
- 12.3.1 Segment Definition and Scope
- 12.3.2 Historical Market Size, 2018-2025
- 12.3.3 Revenue Forecast, 2025-2035
- 12.3.4 Volume Forecast, 2025-2035
- 12.3.5 Base-Year Market Share, 2025
- 12.3.6 Segment CAGR and Growth Drivers
- 12.3.7 Subsegment Market Size and Forecast
- 12.3.7.1 Diesel Generator Sets
- 12.3.7.2 Gas Generator Sets
- 12.3.7.3 Petrol Generator Sets
- 12.3.7.4 Dual-Fuel and Alternative-Fuel Generator Sets
- 12.3.8 Subsegment Pricing and Adoption Trends
- 12.3.9 Leading Suppliers and Competition
- 12.3.10 Regional Demand and Opportunities
- 12.4 By Power Rating - Market Size and Forecast, 2025-2035
- 12.4.1 Segment Definition and Scope
- 12.4.2 Historical Market Size, 2018-2025
- 12.4.3 Revenue Forecast, 2025-2035
- 12.4.4 Volume Forecast, 2025-2035
- 12.4.5 Base-Year Market Share, 2025
- 12.4.6 Segment CAGR and Growth Drivers
- 12.4.7 Subsegment Market Size and Forecast
- 12.4.7.1 Below 10 Kilovolt-Amperes
- 12.4.7.2 10–75 Kilovolt-Amperes
- 12.4.7.3 Above 75–375 Kilovolt-Amperes
- 12.4.7.4 Above 375 Kilovolt-Amperes
- 12.4.8 Subsegment Pricing and Adoption Trends
- 12.4.9 Leading Suppliers and Competition
- 12.4.10 Regional Demand and Opportunities
- 12.5 By Application - Market Size and Forecast, 2025-2035
- 12.5.1 Segment Definition and Scope
- 12.5.2 Historical Market Size, 2018-2025
- 12.5.3 Revenue Forecast, 2025-2035
- 12.5.4 Volume Forecast, 2025-2035
- 12.5.5 Base-Year Market Share, 2025
- 12.5.6 Segment CAGR and Growth Drivers
- 12.5.7 Subsegment Market Size and Forecast
- 12.5.7.1 Standby Power
- 12.5.7.2 Prime Power
- 12.5.7.3 Continuous Power
- 12.5.7.4 Peak Shaving
- 12.5.8 Subsegment Pricing and Adoption Trends
- 12.5.9 Leading Suppliers and Competition
- 12.5.10 Regional Demand and Opportunities
- 12.6 By Customer Type - Market Size and Forecast, 2025-2035
- 12.6.1 Segment Definition and Scope
- 12.6.2 Historical Market Size, 2018-2025
- 12.6.3 Revenue Forecast, 2025-2035
- 12.6.4 Volume Forecast, 2025-2035
- 12.6.5 Base-Year Market Share, 2025
- 12.6.6 Segment CAGR and Growth Drivers
- 12.6.7 Subsegment Market Size and Forecast
- 12.6.7.1 Mission-Critical Facility Operators
- 12.6.7.2 Industrial Asset Owners
- 12.6.7.3 Rental Fleet Operators
- 12.6.7.4 Household and Mobile Users
- 12.6.8 Subsegment Pricing and Adoption Trends
- 12.6.9 Leading Suppliers and Competition
- 12.6.10 Regional Demand and Opportunities
- 12.7 By Subregion - Market Size and Forecast, 2025-2035
- 12.7.1 Segment Definition and Scope
- 12.7.2 Historical Market Size, 2018-2025
- 12.7.3 Revenue Forecast, 2025-2035
- 12.7.4 Volume Forecast, 2025-2035
- 12.7.5 Base-Year Market Share, 2025
- 12.7.6 Segment CAGR and Growth Drivers
- 12.7.7 Subsegment Market Size and Forecast
- 12.7.7.1 East Asia
- 12.7.7.2 South Asia
- 12.7.7.3 Southeast Asia
- 12.7.7.4 Oceania
- 12.7.8 Subsegment Pricing and Adoption Trends
- 12.7.9 Leading Suppliers and Competition
- 12.7.10 Regional Demand and Opportunities
- 12.8 Segment Growth Comparison
- 12.9 Segment Attractiveness and Priority Matrix
Chapter 13 Asia Pacific Electric Generators End-Use and Application Market Outlook
- 13.1 End-Use Industry and Customer Demand Structure
- 13.2 Leading Applications and Customer Groups
- 13.3 End-Use Market Size, Share and Forecast
- 13.4 Major End-Use Industry Deep Dives
- 13.4.1 Customer Requirements and Use Cases
- 13.4.2 Demand and Replacement Cycles
- 13.4.3 Technical and Regulatory Considerations
- 13.4.4 Purchasing and Procurement Models
- 13.4.5 Leading Vendors and Distribution Channels
- 13.4.6 Forecast and Commercial Opportunities
- 13.5 Emerging Applications and Cross-Segment Demand
- 13.6 End-Use Industry Investment Priorities
Chapter 14 Asia Pacific Electric Generators Geographic Market Outlook, 2025-2035
- 14.1 Regional Market Size and Country-Level Shares, 2025
- 14.2 Country Market Size Comparison, 2025
- 14.3 Country Market Forecasts, 2025-2035
- 14.4 Subregional Industrial and Demand Clusters
- 14.5 Intra-Regional Pricing and Cost Differences
- 14.6 Cross-Border Trade and Supply Networks
- 14.7 Regional Supply and Demand Balances
- 14.8 Country Opportunity Comparison and Prioritization
Note: Every listed country is covered on the structure shown under the first country.
Chapter 15 Asia Pacific Electric Generators Technology, Innovation and Sustainability Outlook
- 15.1 Technology Landscape and Maturity
- 15.2 Product, Process and Service Innovation
- 15.3 AI, Automation and Digital Tools in the Industry
- 15.4 Technology Adoption and Performance Benchmarking
- 15.5 Innovation Pipeline and R&D Investment
- 15.6 Patent and Intellectual Property Trends
- 15.7 Energy Efficiency and Resource Management
- 15.8 Sustainability, Recycling and Circularity
- 15.9 Technology Roadmap, 2025-2035
- 15.10 Risks of Obsolescence and Technology Substitution
Chapter 16 Asia Pacific Electric Generators Market Key Strategic Imperatives
- 16.1 Growth and Market Entry Priorities
- 16.2 High-Return Products and Segments
- 16.3 Pricing, Profitability and Cost Optimization
- 16.4 Technology Investment and Product Differentiation
- 16.5 Supply Chain Localization and Resilience
- 16.6 Distribution and Customer Acquisition
- 16.7 Partnership, Acquisition and Capacity Strategy
- 16.8 Regional Expansion Priorities
- 16.9 Short-, Medium- and Long-Term Actions
Chapter 17 Competition Outlook
- 17.1 Industry Competition Characteristics
- 17.2 Market Structure and Concentration
- 17.3 Market Share and Competitive Positioning, 2025
- 17.4 Company-Wise Revenue and Product Benchmarking
- 17.5 Production and Service Capacity Benchmarking
- 17.6 Technology, Pricing and Differentiation
- 17.7 Regional Footprint and Distribution Strength
- 17.8 Mergers, Acquisitions and Strategic Alliances
- 17.9 New Entrants and Competitive Threats
- 17.10 Porter's Five Forces and Industry Attractiveness
- 17.11 Competitive Outlook, 2025-2035
Chapter 18 Company Profiles
- 18.1 Company Coverage and Selection Criteria
- 18.2 Cummins Inc.
- 18.2.1 Business Description
- 18.2.2 Company Ownership and Geographic Presence
- 18.2.3 Product and Service Portfolio
- 18.2.4 Manufacturing and Operating Footprint
- 18.2.5 Production Capacity and Expansion Plans
- 18.2.6 Financial Performance and Investment
- 18.2.7 Market Share and Competitive Position
- 18.2.8 Technology and Innovation Capabilities
- 18.2.9 Strategic Alliances or Partnerships
- 18.2.10 Recent Developments
- 18.2.11 Growth Strategy and Outlook
- 18.3 Caterpillar Inc.
- 18.4 Yanmar Holdings Co., Ltd.
- 18.5 Kirloskar Oil Engines Limited
- 18.6 Honda Motor Co., Ltd.
- 18.7 Atlas Copco Group
- 18.8 Aggreko
- 18.9 Rehlko
- 18.10 Mitsubishi Heavy Industries Engine & Turbocharger, Ltd.
- 18.11 Rolls-Royce Power Systems
- 18.12 Other Relevant Market Participants
Note: Every listed company is profiled on the structure shown under the first company. The company list is preliminary and may change based on research findings, market developments, data availability and client requirements.
Chapter 19 Disclaimer
- 19.1 Research and Forecast Disclaimer
- 19.2 Data Source and Estimation Limitations
Note: The depth of individual sections depends on data availability for this market. Volume, capacity, trade and other unit-based metrics are included where applicable.

