Running, padel and marketplaces reshape sports spending
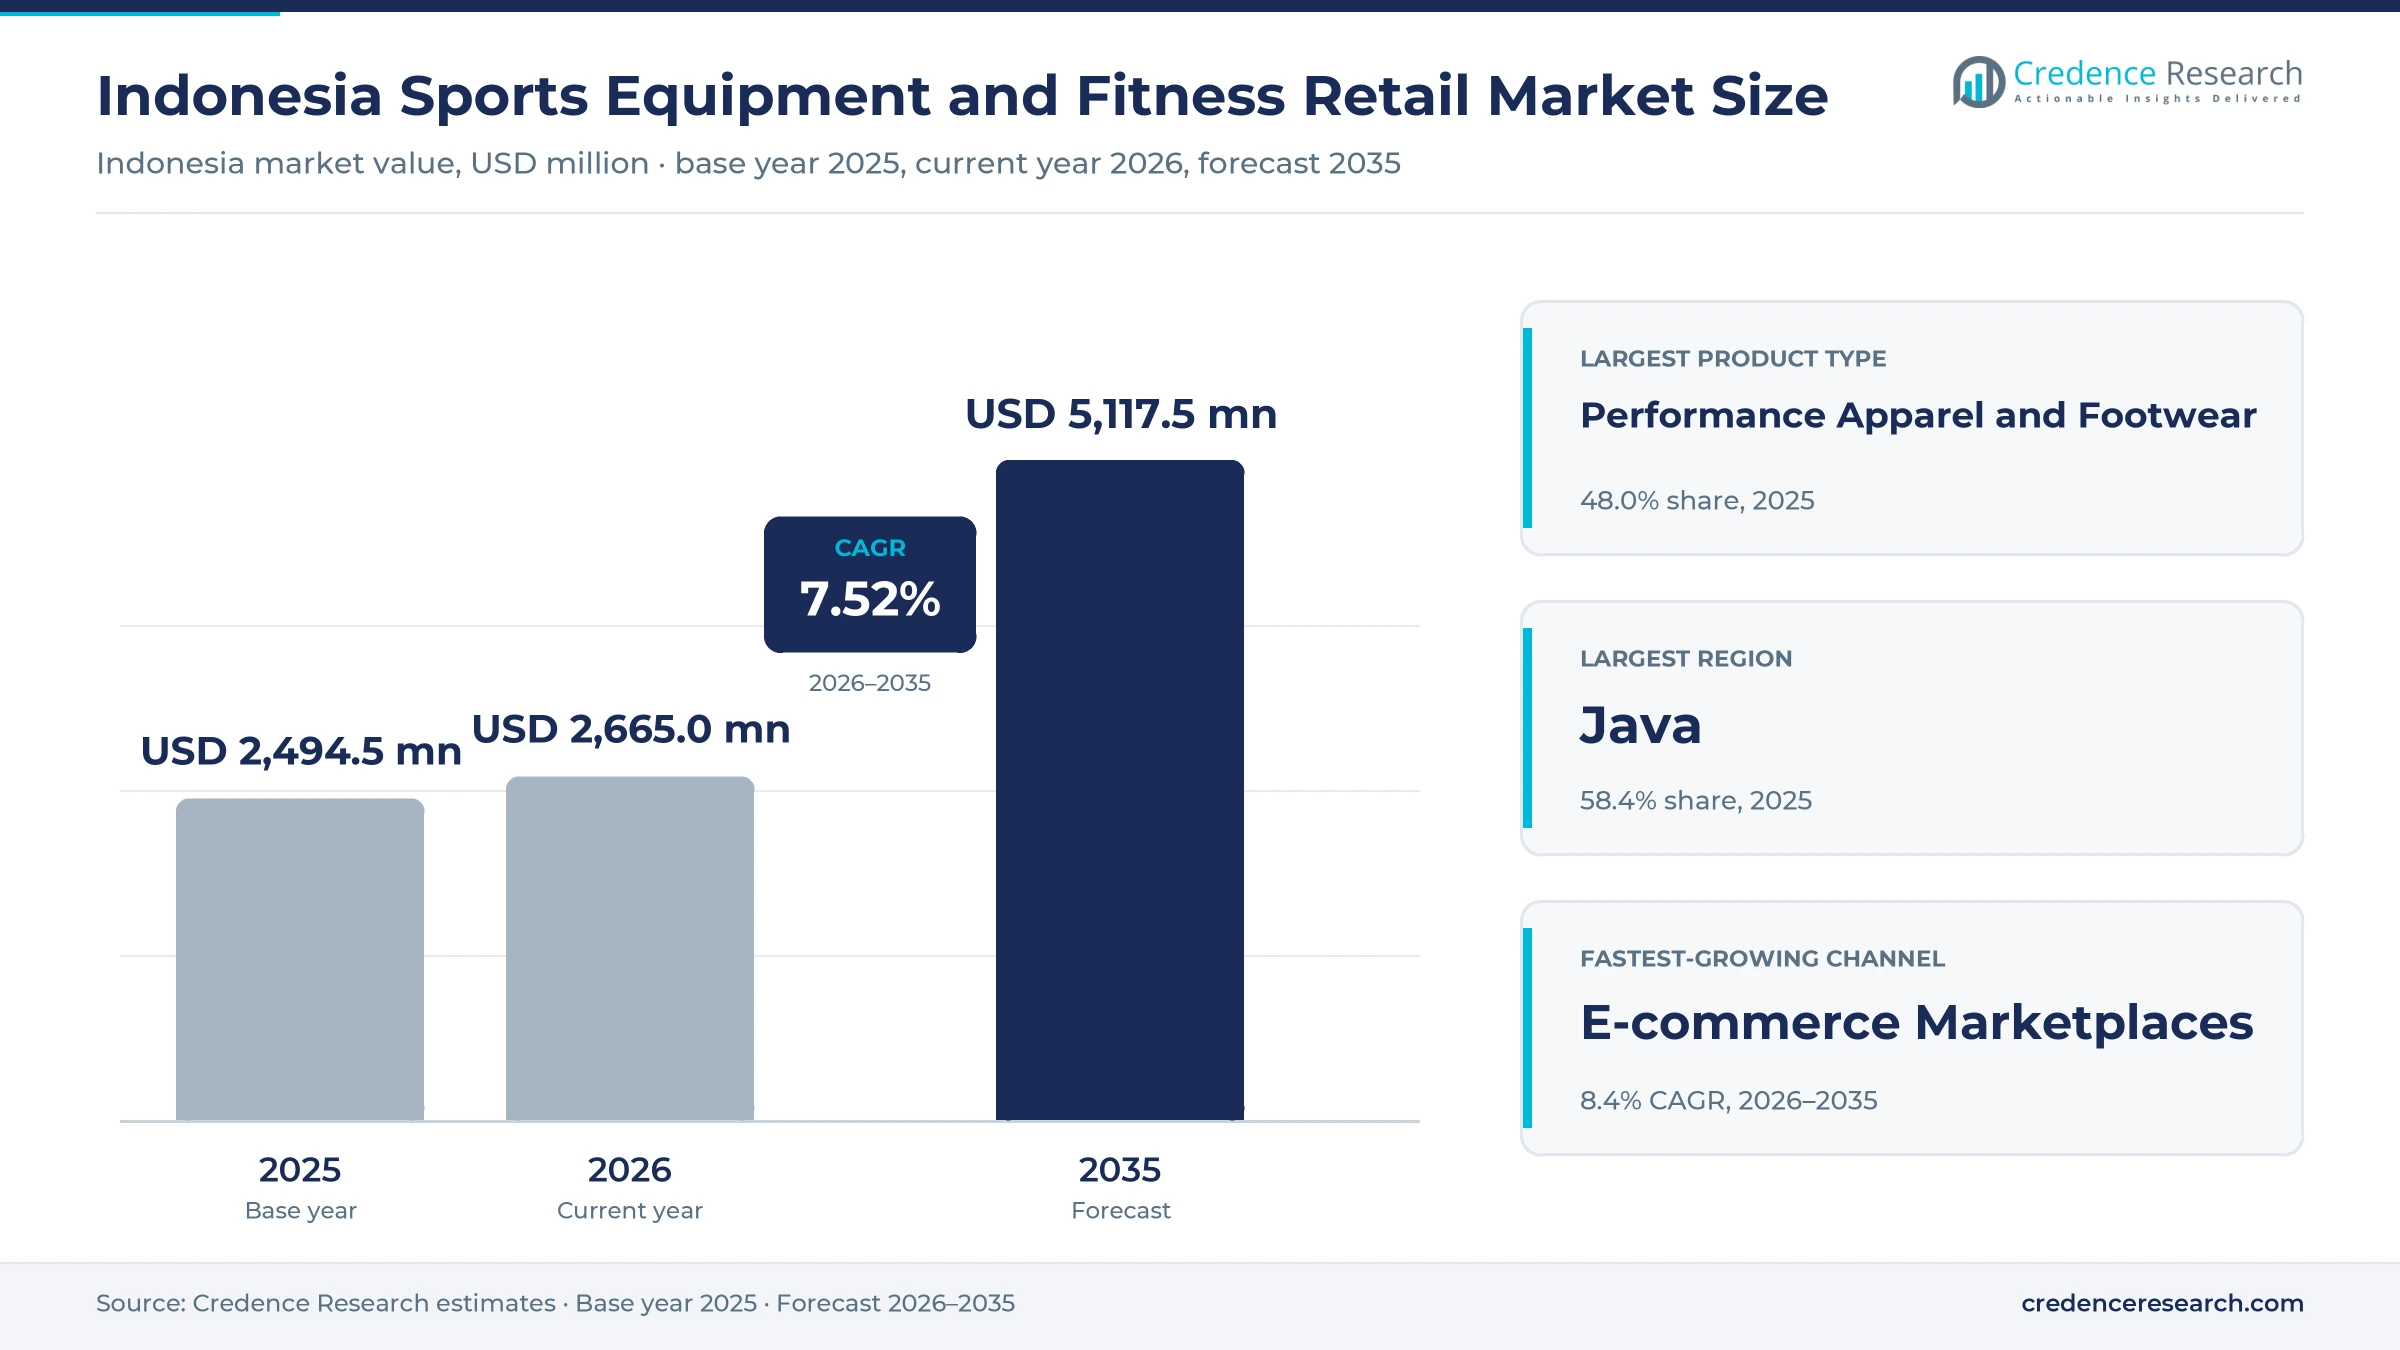
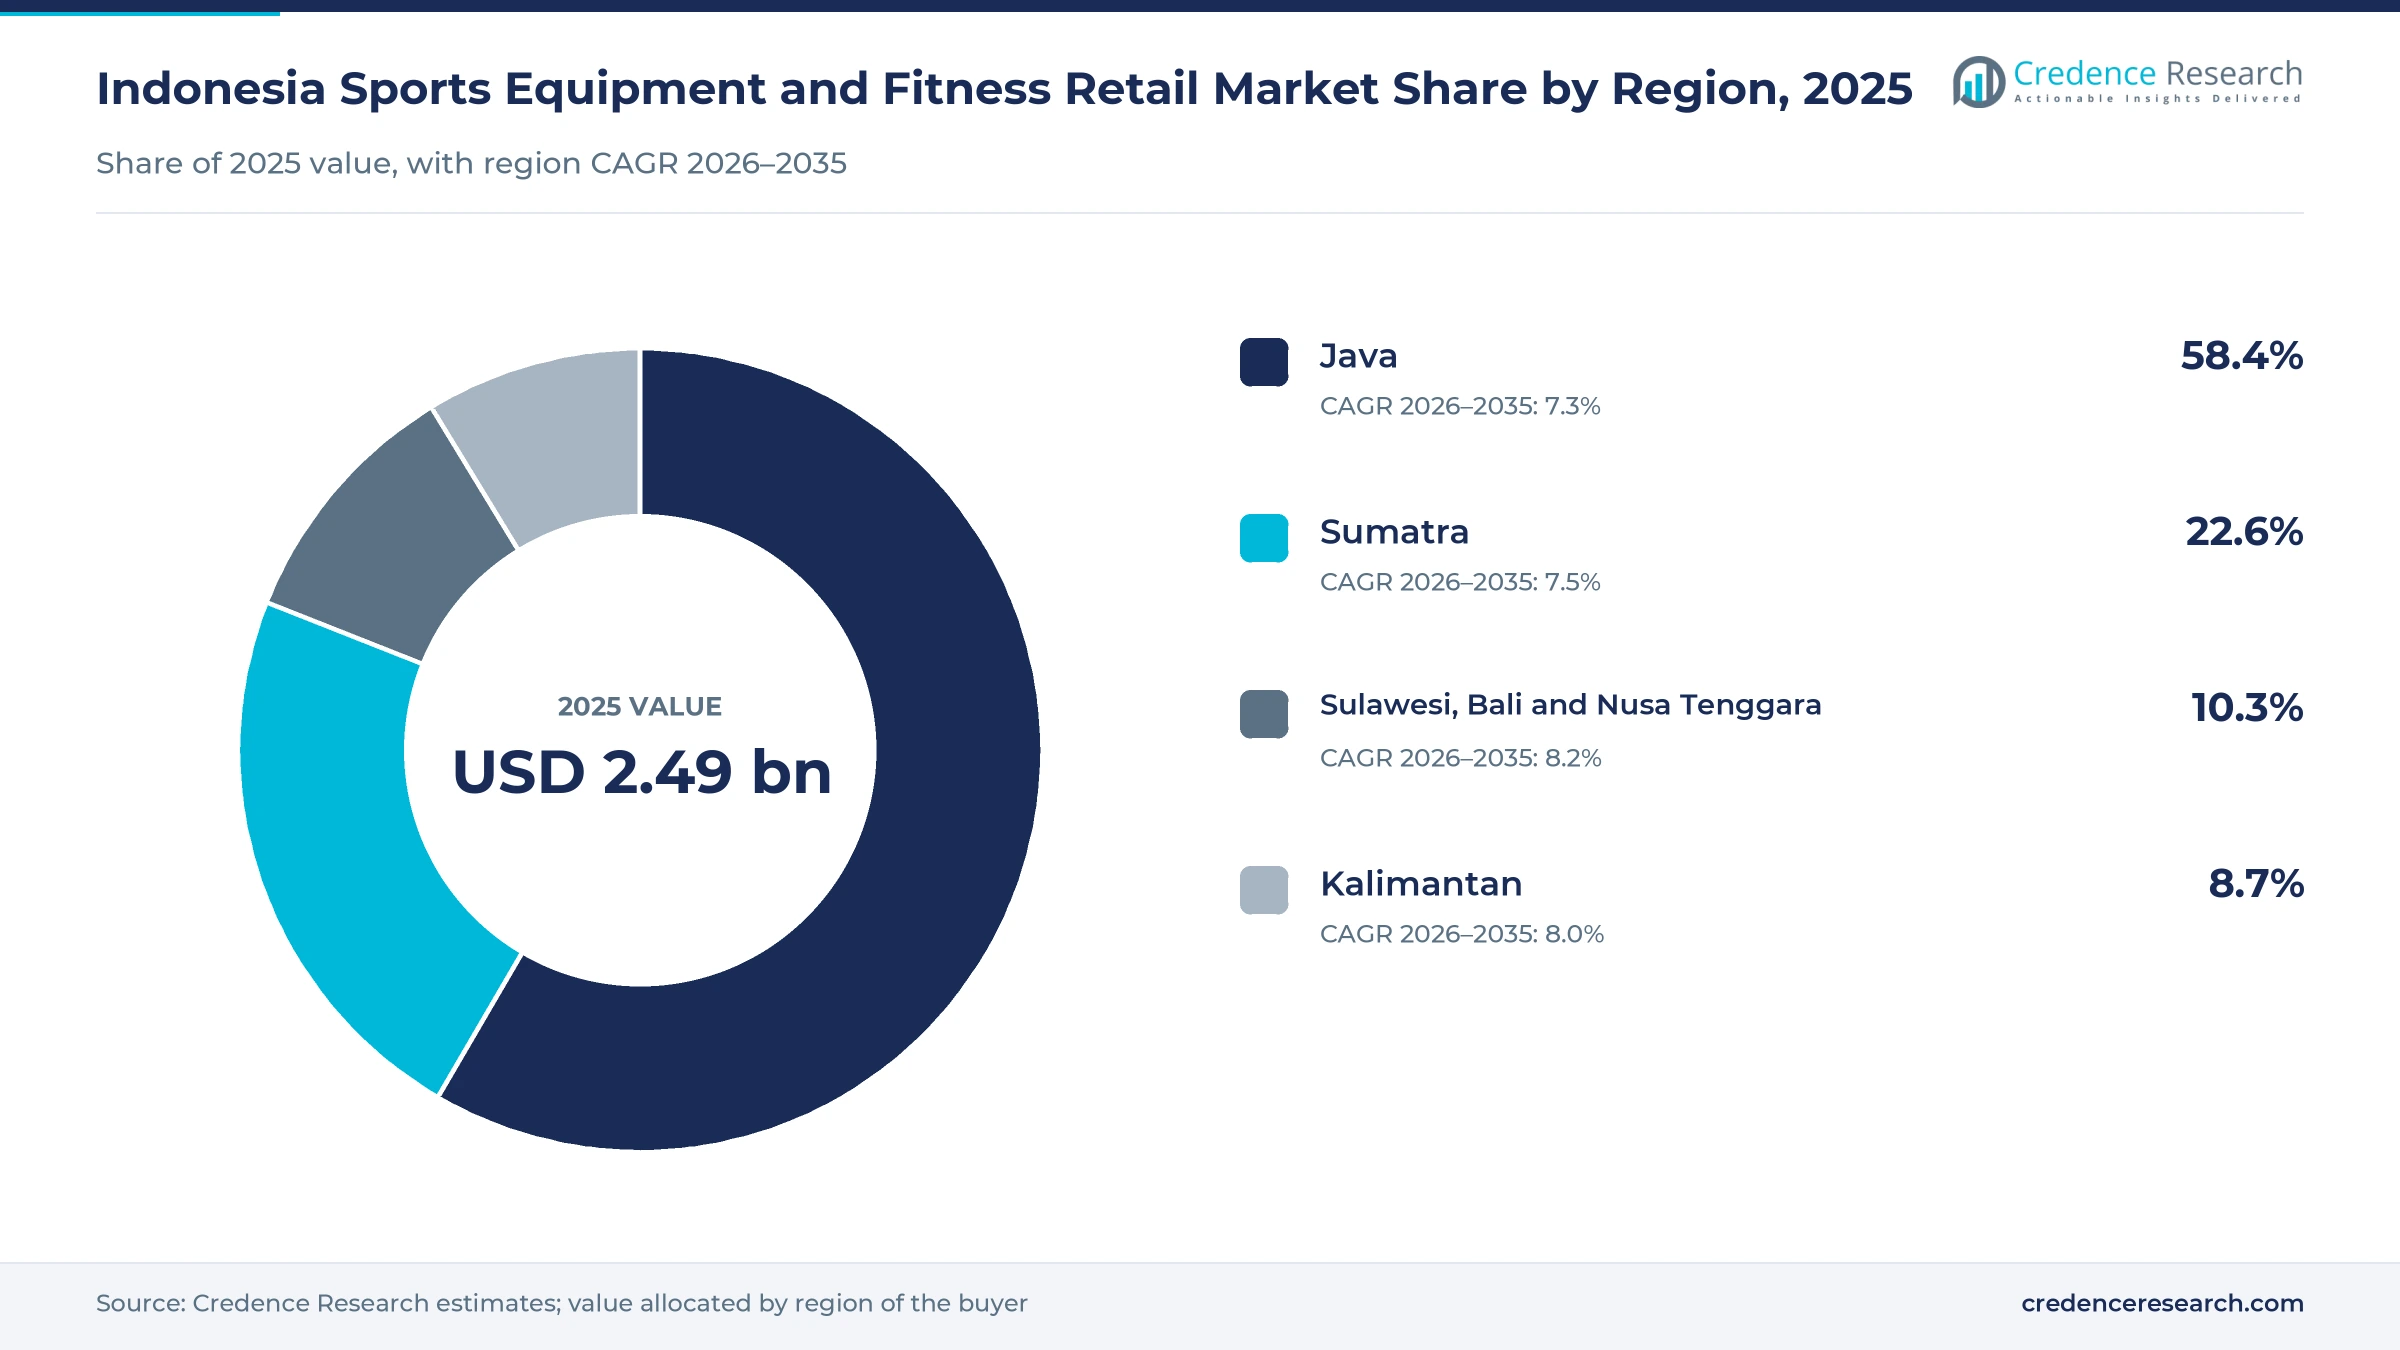
The Indonesia sports equipment and fitness retail market was valued at USD 2.49 billion in 2025 and is projected to increase from USD 2.67 billion in 2026 to USD 5.12 billion by 2035, registering a CAGR of 7.52% during 2026–2035. Spending rests on a widening base of runners, gym members and racquet players, on marketplaces that reach buyers far from mall districts, and on brand-run flagships in Jakarta and Surabaya. Java held the largest regional share, 58.4% in 2025, because Greater Jakarta, Bandung and Surabaya host most organized sports stores and paid courts. Sulawesi, Bali and Nusa Tenggara is the fastest-growing region at 8.2% a year as manufacturing-led growth in Sulawesi and tourist demand in Bali widen the buyer pool. Padel, which barely existed in the country in 2021, has become a new equipment category for specialty sellers within four years.
Which goods and buyers make up organized sports retail in Indonesia?
The market counts branded fitness equipment, team and racket sports equipment, outdoor and recreation equipment, and performance apparel and footwear sold to buyers in Indonesia. Buyers range from first-time runners buying a pair of shoes to gym chains, schools and clubs ordering equipment in bulk. Products reach them through specialty sports stores, brand-owned stores, e-commerce marketplaces, brand webstores and direct business sales.
Value is counted at retail selling prices, including value-added tax, for goods sold through organized channels. The estimate excludes unbranded goods sold in traditional markets, casual lifestyle fashion without a sports function, gym memberships and court rental fees, and the exports of Indonesian factories that make shoes and equipment for global brands.
Indonesia Sports Equipment and Fitness Retail Market Insights
- Organized sports retail grows from USD 2.49 billion in 2025 to USD 5.12 billion by 2035, a 7.52% pace led by racquet gear, commercial fitness buyers and marketplace sales.
- Java led with 58.4% of 2025 value, while Sulawesi, Bali and Nusa Tenggara grows fastest at 8.2% a year on rising regional incomes.
- Performance Apparel and Footwear held 48.0% of 2025 value, because running shoes and training wear are replaced more often than equipment.
- Padel courts in Indonesia rose from 15 in 2021 to 947 at the end of 2025, creating a new racket and footwear category for specialty sellers.
- MAP Active runs more than 2,200 stores and over 40 exclusive brands, giving one listed retailer wide control over branded sports supply.
Apparel, personal buyers and sports stores hold most value
Why do apparel and footwear hold the largest share?
Based on product type, the market is categorized into fitness equipment, team and racket sports equipment, outdoor and recreation equipment, and performance apparel and footwear. Performance Apparel and Footwear led with 48.0% of 2025 value because shoes and training wear wear out within a season and are bought by almost every active person, unlike benches or tents. Team and Racket Sports Equipment grows fastest at 8.5% a year as La Padel plans five complexes with 45 courts in Greater Jakarta, The Jakarta Post reported in August 2025, and every new court needs rackets, balls and court shoes. Demand for badminton rackets adds a steady base under this growth.
Which buyers carry the most value, and which grow fastest?
Based on customer type, the market is categorized into individual consumers, commercial fitness operators, education institutions and sports clubs and corporate wellness buyers. Individual Consumers led with 71.0% of 2025 value because sport in Indonesia is mostly self-organized, and GoodStats reported in June 2026, drawing on BPS survey data, that running and jogging are gaining popularity among young people as race events multiply. Commercial Fitness Operators grow fastest at 8.7% a year as boutique studios fit out with imported machines, and premium reformer concept VAURA Pilates opened its first Indonesian studio, its 10th worldwide, in Menteng, Jakarta, Australasian Leisure Management reported in July 2026.
Why do sports stores lead, and why are marketplaces gaining?
Based on distribution channel, the market is categorized into specialty sports stores, brand-owned stores, e-commerce marketplaces and brand webstores. Specialty Sports Stores led with 39.0% of 2025 value because multi-brand chains such as Sports Station, Planet Sports and Foot Locker sit inside a network of more than 2,200 MAP Active stores, SGB Executive reported in March 2026. E-commerce Marketplaces grow fastest at 8.4% a year as even store-led sellers now trade there, and Decathlon told Fortune Indonesia in July 2025 that it sells on Tokopedia, Shopee and TikTok alongside its own stores.
How do entry, mid-market and premium tiers split value?
Based on price tier, the market is categorized into entry-level, mid-market, premium and professional grade, the last sold mainly to clubs and gyms. Mid-Market led with 42.0% of 2025 value because most buyers trade up one item at a time, choosing house-brand or mainstream global shoes priced near Rp1 million rather than flagship models. Decathlon also cut prices on more than 1,000 products by up to 15% in 2025, Fortune Indonesia reported. Premium grows fastest at 8.3% a year as adidas opened a two-floor brand center of 1,715.4 square meters at Grand Indonesia on June 12, 2026, its largest store in the country, IDN Times reported.
| Segment Group | Leading Sub-segment | Share, 2025 | Fastest-growing Sub-segment | CAGR, 2026–2035 |
|---|---|---|---|---|
| By Product Type | Performance Apparel and Footwear | 48.0% | Team and Racket Sports Equipment | 8.5% |
| By Customer Type | Individual Consumers | 71.0% | Commercial Fitness Operators | 8.7% |
| By Distribution Channel | Specialty Sports Stores | 39.0% | E-commerce Marketplaces | 8.4% |
| By Price Tier | Mid-Market | 42.0% | Premium | 8.3% |
Prices run from Rp783,000 shoes to Rp6 million padel rackets
Pricing works per item, and global brands set national price lists that follow their regional lists with the rupiah passed through in seasonal resets. A house-brand running shoe costs roughly a third of a mainstream Nike model, which keeps entry and mid-market tiers close together and makes discount events decisive for volume. Padel rackets show the same ladder, from under Rp2 million to more than Rp6 million, and brand-owned lines such as adidas and Decathlon’s Kuikma sit in the middle and upper rungs. Fitness equipment follows two buying processes, with home machines sold on marketplaces and commercial machines sold through dealers that bundle delivery, installation and service.
| Product or price element | Typical price or fee | Basis |
|---|---|---|
| Decathlon Kiprun KS900 Light running shoe | Rp783,000 to Rp1,050,000 | Medcom listing, August 2026 |
| Nike Pegasus 42 running shoe | Rp2,199,000 | Nike Indonesia list price reported by Suara, August 2026 |
| Padel rackets, Dunlop Galactica to StarVie Raptor Evolution | Rp1,975,000 to Rp6,176,000 | Popmama retail survey, May 2025 |
| adidas Metalbone Carbon and Kuikma PR 990 Power Hard padel rackets | From Rp3,249,000 and Rp5,250,000 | Popmama retail survey, May 2025 |
Request a Free Sample
Fill in your details and we'll send you a free sample report.
- Sample data tables & charts
- Research methodology
Participation, online selling and new stores drive demand
Why are more Indonesians buying running and sports gear?
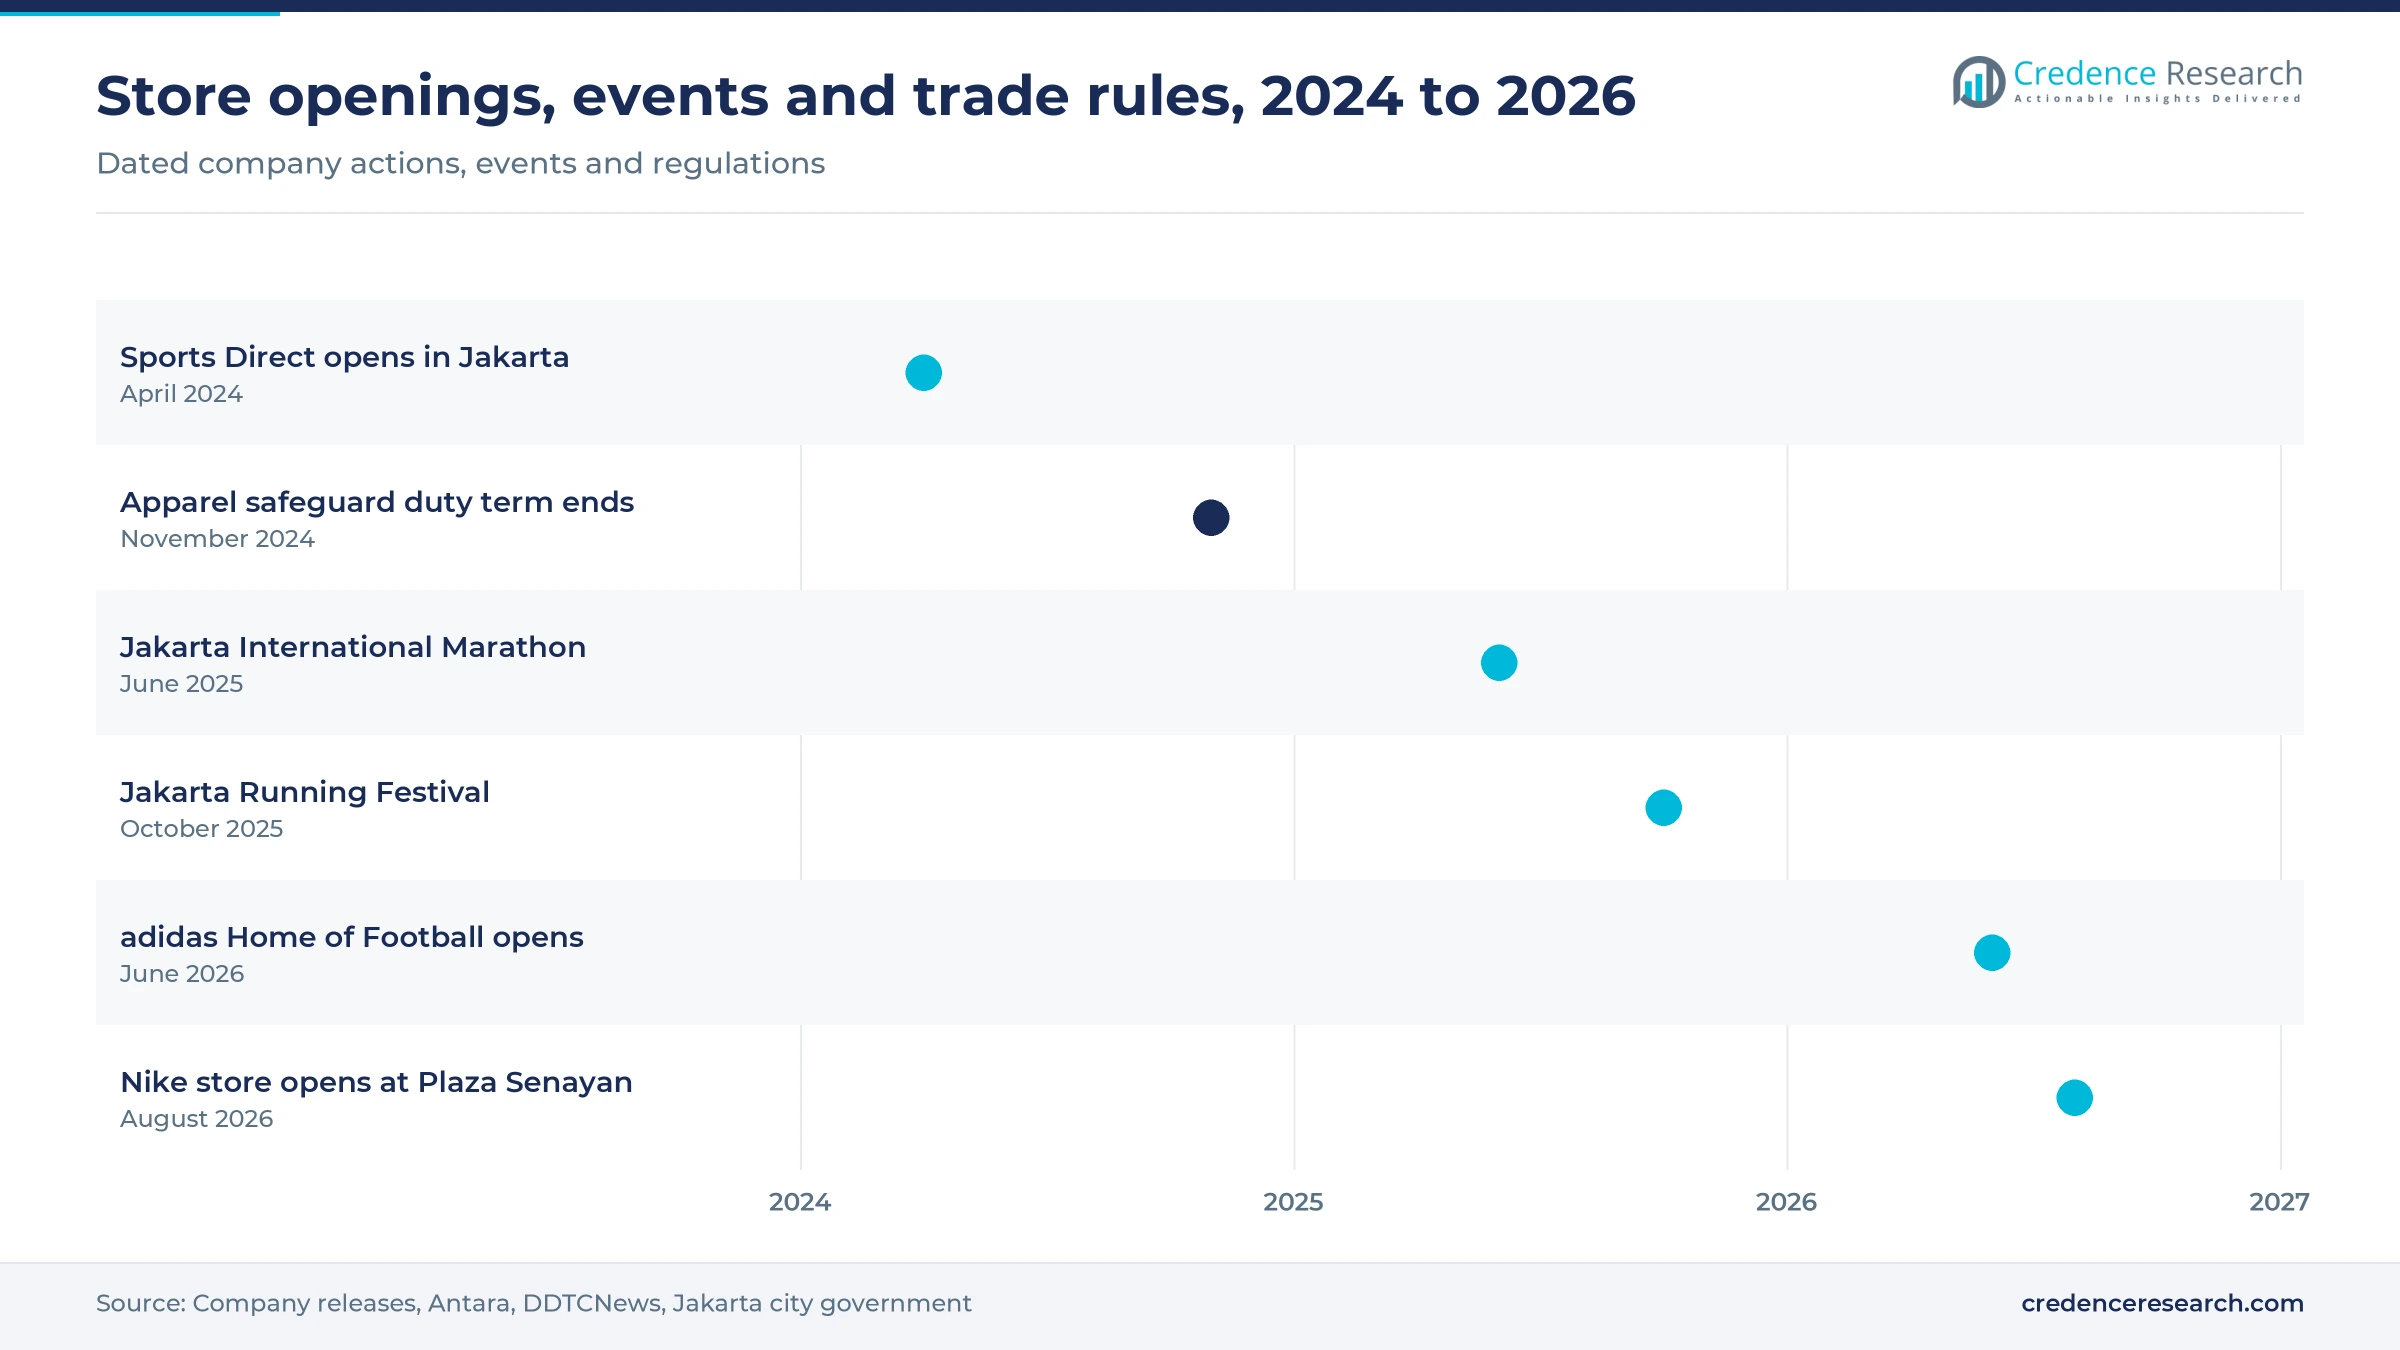
More Indonesians now play sport each week, and each new participant needs shoes, apparel and basic equipment before anything else. BPS reported that 37.27% of people aged five and over did sport in the week before its 2025 social survey, a pool of roughly 100 million people. Mass running events show the same shift, with more than 31,000 runners from 51 countries at the Jakarta International Marathon on June 29, 2025. The Jakarta Running Festival drew 27,300 runners on Oct. 25 and 26, 2025, up 70% from the year before, according to the Jakarta city government. Race calendars of this kind pull first-time buyers into specialty stores for road shoes and trail running shoes, and they support the lead of Performance Apparel and Footwear.
How do marketplaces convert buyers far from the malls?
Online selling lets brands reach buyers in cities with no mall-based sports store, and it shortens the path from a social media post to a purchase. Indonesian e-commerce gross merchandise value was projected to grow more than 14% to about US$71 billion in 2025, according to the e-Conomy SEA 2025 report released by Google and Temasek in November 2025. The country’s whole digital economy came close to US$100 billion in the same year, the largest in Southeast Asia. E-commerce Marketplaces grow fastest at 8.4% a year, because sellers can list the same shoe or dumbbell set nationally at one price. Retailers that join store stock to marketplace orders can turn this traffic into higher sell-through and fewer markdowns.
New store formats and brands widen organized retail
Organized retailers keep adding brands and formats, which moves spending away from unbranded traders toward chains with stock depth and service. MAP Active holds more than 40 exclusive brands across mono-brand and multi-brand formats, SGB Executive reported in March 2026. Frasers Group opened the first Sports Direct store in Indonesia with MAP Active at Mall Kota Kasablanka on April 25, 2024, carrying Nike, adidas, PUMA, Under Armour, New Balance and ASICS. adidas then opened its first football specialist store, Home of Football, with Kanmo Group at Pondok Indah Mall 3 on June 5, 2026, Antara reported. Each new format widens choice in Jakarta first, and suppliers without a strong retail partner find it harder to win floor space.
A local manufacturing base that supports supply
Indonesia makes much of the gear it sells, so retailers can source quickly and keep landed costs below fully imported lines. The Ministry of Industry counted 128 sports equipment firms employing 15,663 people, Deputy Minister Faisol Riza said on Aug. 3, 2026. Sports equipment exports rose 12% to US$306.3 million, the ministry said, citing Statistics Indonesia. That export base shows the scale of factories able to supply the home market. Decathlon plans to raise locally made products in its Indonesian range from about 5% in 2025 to 30% by 2028 and 50% by 2030, Fortune Indonesia reported. Local sourcing shortens restocking cycles and helps hold Mid-Market prices steady when the rupiah weakens.
Racquet courts and video selling shift where gear sells
Padel courts multiply and pull racket sales with them
Racquet sports played on paid courts are becoming a new equipment category, led by padel in Jakarta and Bali. Padel courts in Indonesia grew from 15 in 2021 to 947 at the end of 2025, according to the Core & Court Indonesia Padel Report cited by Databoks, with 326 courts in Jakarta alone. By May 2024 the country already ranked first in Southeast Asia for registered active padel courts, according to Federation Internationale de Padel data cited by The Southeast Asia Desk. Racquet facilities averaged about 70% occupancy in 2025, Liga.Tennis data show. Each court converts players into buyers of rackets, balls and court shoes, which supports growth in Team and Racket Sports Equipment and gives specialty stores a reason to host clinics and demo days.
Video selling moves from fashion into sports gear
Live and short-video selling is moving from fashion and athleisure clothing into sports gear, as brands demonstrate shoes, rackets and home equipment on camera. Video commerce transactions in Indonesia rose about 90% in 2025 to 2.6 billion, the e-Conomy SEA 2025 report found. The number of sellers and online stores using video rose about 75% to 800,000 in the same year. MAP Active runs 30 online sites, including the MAPCLUB membership platform, SGB Executive reported, which lets it connect video traffic to store stock. Sellers that train staff to present products on video can reach buyers outside Java at low cost, while slower sellers face price comparison in real time.
Where can compact stores win new buyers outside Jakarta?
Smaller store formats in second-tier cities offer an opening, because most large sports stores still sit in a few metropolitan malls. In July 2025 Decathlon announced plans to grow from nine stores to 19 between the end of 2024 and the end of 2025, and to 50 to 60 stores within five years, using compact stores such as AEON Mall Deltamas in Cikarang. Decathlon also took back its Yogyakarta franchise and reopened at Pakuwon Mall Jogja on Oct. 5, 2024, Mojok reported. Compact formats cut rent and stock costs per store, which makes cities in Sumatra, Sulawesi and Kalimantan viable. Retailers that move first can secure the best mall units before rents rise, and camping gear suits these stores because hiking demand is strong outside Jakarta.
Can offices and gyms become volume equipment buyers?
Employers and gym operators offer a B2B opening, because organized workplace exercise is still rare in Indonesia. The WHO physical activity factsheet for Indonesia lists workplace physical activity promotion as a policy action not yet in place. Lack of time was the main reason for inactivity, cited by 48.7% of inactive people in the 2023 Indonesian Health Survey, according to the Ministry of Health. Anytime Fitness named Indonesia as a target market in May 2024, Athletech News reported, while Fitness First marked 20 years in the country in March 2025 with 10 clubs, all in Jakarta. Suppliers that bundle equipment, installation and service for offices and gyms can lift Commercial Fitness Operators sales without competing on shelf price.
Inactivity, trade rules and a weak rupiah test sellers
Does low everyday activity cap the buyer pool?
A large share of Indonesians still exercise too little, which limits how many people buy sports goods regularly. WHO estimates that 19.0% of Indonesian adults were insufficiently active in 2022, up from 15.2% in 2000. The 2023 Indonesian Health Survey uses a wider age range, covering everyone aged 10 and over, so it reports a higher 37.4%, the Ministry of Health said in October 2025. Retailers therefore depend on a narrower group of committed buyers, so many now run community runs and classes to recruit new ones.
How much do trade rules disrupt imported ranges?
Trade rules add cost and uncertainty for sellers of imported apparel and equipment. Trade Minister Regulation No. 31/2023 set a minimum price of US$100 per unit for goods sold directly from abroad on marketplaces, Katadata reported in September 2023. Overseas sellers of cheap shoes, balls and resistance bands lost that direct route, so the same goods must now pass through local importers that carry stock, pay duties and hold licenses. That shift favors local stockists, but it raises landed costs and slows range changes for smaller online sellers.
Will a weaker rupiah squeeze retail margins?
Most premium shoes, rackets and fitness machines are priced from imported costs, so a weaker rupiah raises landed costs. Bank Indonesia Governor Perry Warjiyo told parliament on May 18, 2026 that the rupiah would average about Rp16,800 per dollar in 2026, The Jakarta Post reported. Retailers that cannot pass costs on in full lose margin, and buyers shift toward local and house brands. Dealers of commercial gym equipment feel this most because their contracts are priced months in advance.
Are venues too concentrated to reach national buyers?
Paid courts and premium gyms are clustered in a few provinces, which limits demand for court and studio equipment elsewhere. The five provinces with the most padel courts held about 85% of the national total at the end of 2025, Databoks reported. Greater Jakarta held 40% of courts and Bali 30% in June 2025, according to the Indonesian Padel Association. Sellers outside Java therefore find fewer institutional buyers, and they must rely on personal buyers and online orders.
Java leads while Sulawesi and Bali grow fastest
| Region | Value, 2025 (USD billion) | Share, 2025 | CAGR, 2026–2035 |
|---|---|---|---|
| Java | 1.46 | 58.4% | 7.3% |
| Sumatra | 0.56 | 22.6% | 7.5% |
| Sulawesi, Bali and Nusa Tenggara | 0.26 | 10.3% | 8.2% |
| Kalimantan | 0.22 | 8.7% | 8.0% |
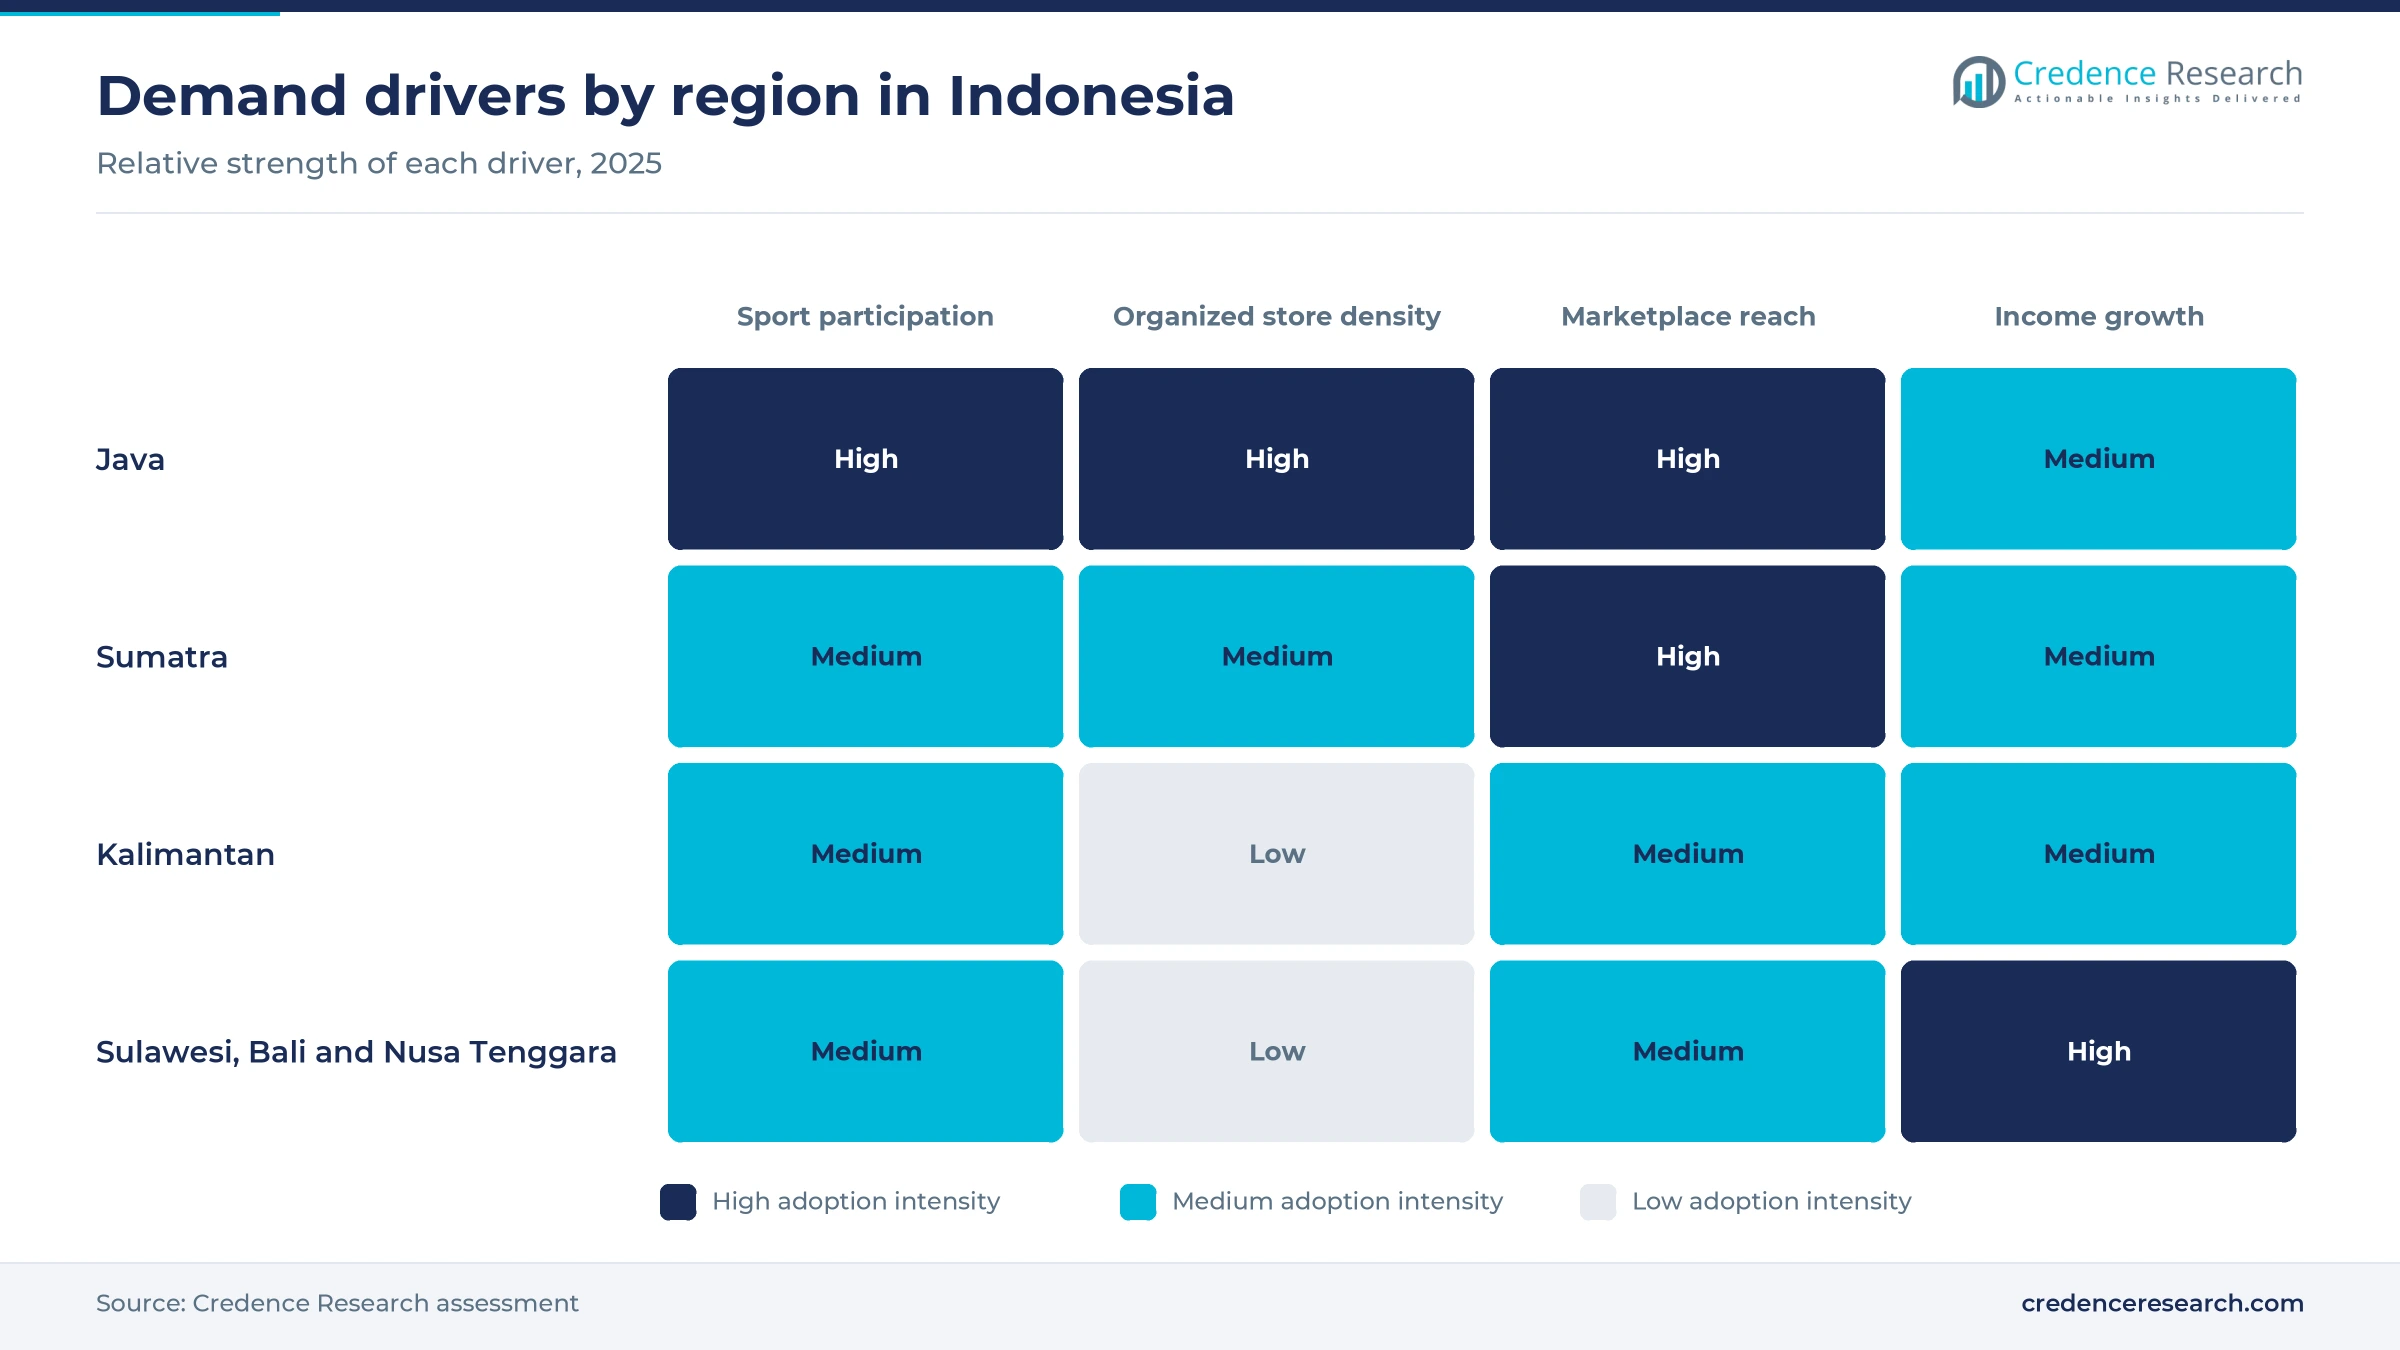
Java leads on population, income and store density
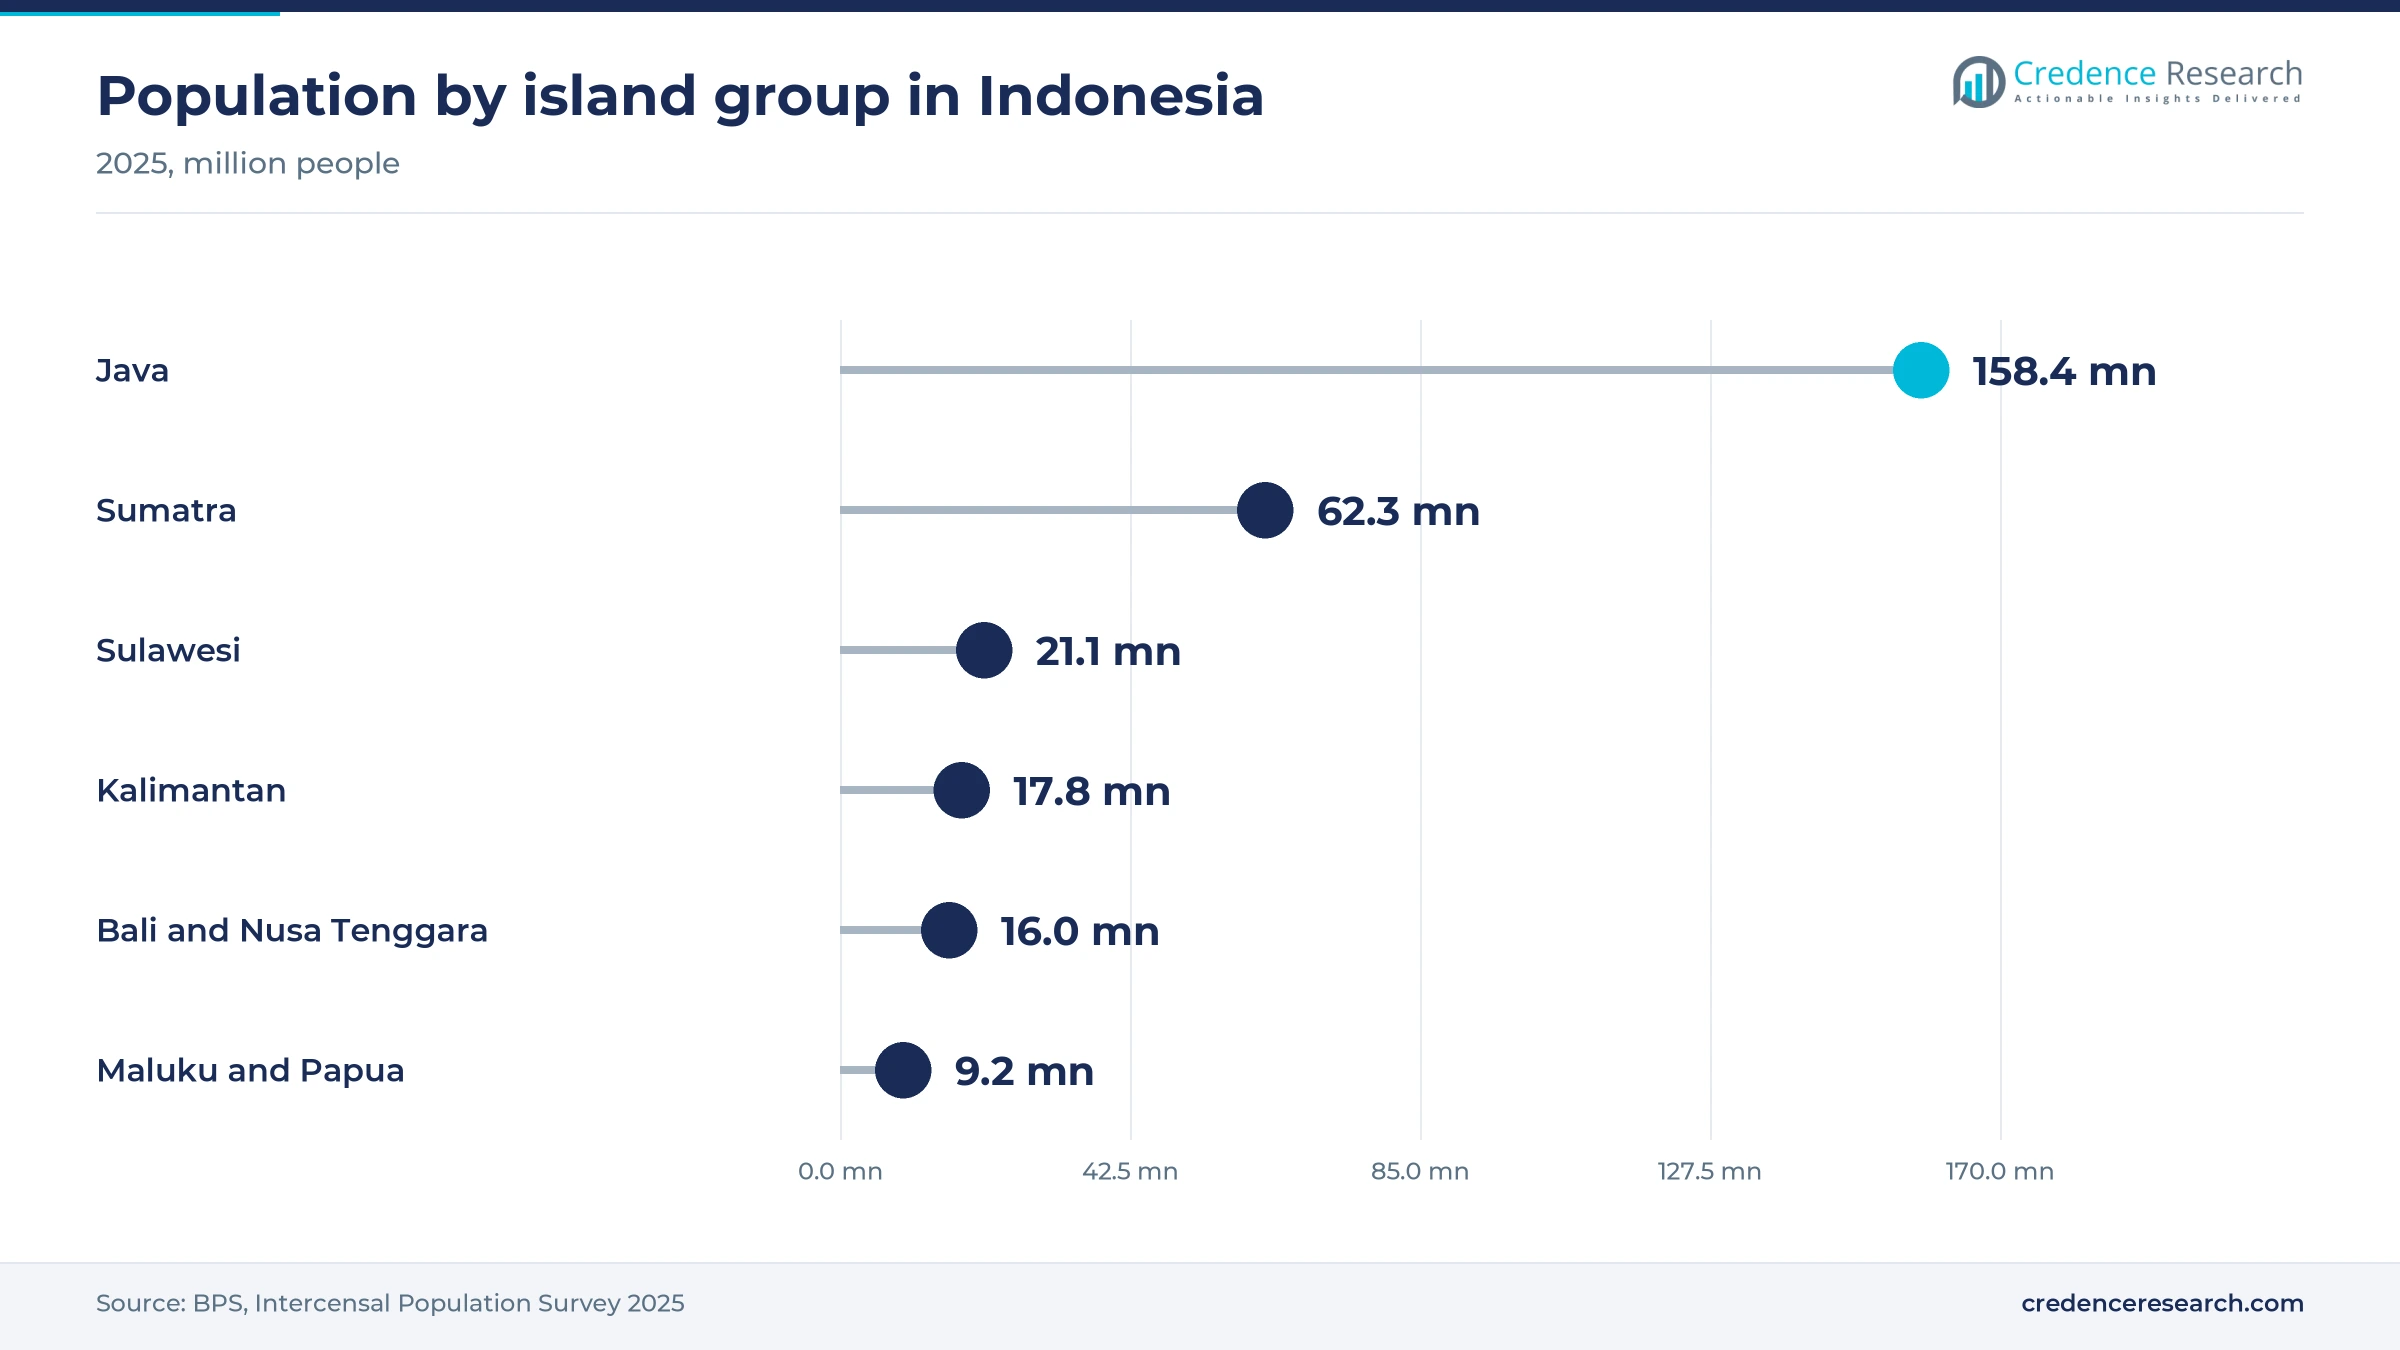
Java held a 58.4% share of 2025 value and grows at 7.3% a year. The island had 158.41 million residents in 2025, according to the BPS intercensal survey, and produced 56.93% of national GDP, growing 5.30%. Jakarta had the highest sport participation of any province at 57.27%, BPS reported. Decathlon chose Pakuwon Mall Surabaya for its first East Java store, Times Indonesia reported and most brand launches start in Jakarta before they move to other islands.
Sumatra builds demand on a large regional population
Sumatra held a 22.6% share of 2025 value and grows at 7.5% a year. The island had 62.32 million residents in 2025 and generated 22.22% of national GDP, BPS reported, with North Sumatra contributing most to growth. Sport participation reached 43.12% in the Riau Islands and 39.84% in Bangka Belitung, both above the national rate. Medan, Palembang and Batam host most organized stores, while buyers in smaller towns rely on marketplaces and regional distributors.
Kalimantan grows on mining and plantation incomes
Kalimantan held an 8.7% share of 2025 value and grows at 8.0% a year. The island had 17.75 million residents in 2025, according to BPS, and its economy rests on manufacturing, trade and agriculture. East Kalimantan recorded 41.51% sport participation in 2025, the seventh highest in the country, BPS reported. Balikpapan and Samarinda draw well-paid mining and plantation workers who buy outdoor and fitness gear, though few global brands run their own stores there yet.
Sulawesi, Bali and Nusa Tenggara grow fastest
Sulawesi, Bali and Nusa Tenggara held a 10.3% share of 2025 value and grow fastest at 8.2% a year. Sulawesi’s economy grew 6.23% in 2025, above the national rate, BPS reported on Feb. 5, 2026. Sport participation reached 43.05% in West Nusa Tenggara and 38.63% in Bali. Bali also draws foreign residents who buy surf, padel and fitness gear, while Makassar is the main store hub for eastern Indonesia.
Flagship stores and race events mark 2024 to 2026
| Development | Status and market relevance |
|---|---|
| In April 2024, Frasers Group and MAP Active opened the first Sports Direct store in Indonesia at Mall Kota Kasablanka in Jakarta. | Open; adds a new multi-brand format to organized retail |
| In October 2024, Decathlon reopened its Yogyakarta store at Pakuwon Mall Jogja after taking back the franchise. | Open; Decathlon now runs the store directly |
| In June 2026, adidas opened its largest store in Indonesia, a two-floor brand center at Grand Indonesia in Jakarta. | Open; expands brand-owned premium space |
| In June 2026, adidas and Kanmo Group opened Home of Football, the brand’s first football specialist store in Indonesia. | Open; targets football boots and team kit buyers |
| In August 2026, MAP Active opened a Nike store at Plaza Senayan with Nike By You personalization services. | Open; extends Nike’s partner-run store network in Jakarta |
Live selling, personalization and connected gear
- Live video storefronts let staff demonstrate shoes, rackets and home machines to buyers anywhere in the country, then take orders from store stock.
- Product personalization such as the Nike By You patch service shown at Plaza Senayan, raises the value of a shoe or jersey purchase.
- Connected fitness machines record workouts and link to apps, which helps gyms track use and helps dealers sell service plans.
- Unified stock systems connect stores, webstores and marketplace listings, so retailers can sell one item once and avoid stockouts during big sale days.
Need a Custom Version of This Report?
Tailor the scope, geography, or segments to your exact requirements.
- Custom geography or segment scope
- Direct access to our analyst team
One listed retailer and global brands shape supply
Competition in Indonesian sports equipment and fitness retail is led by MAP Active, which runs multi-brand chains such as Sports Station and Planet Sports and partner stores for global brands, and by Decathlon, which sells its own brands through large and compact stores. Global brand owners adidas, Nike and PUMA compete for shelf space and also sell through their own flagships and webstores, with adidas working with Kanmo Group on specialist formats. Eiger leads local outdoor gear with its own store network. In fitness equipment, equipment maker Johnson Health Tech and dealers such as PrimaFit and MG Sports serve gyms and studios, while BODIMAX sells home machines mainly on marketplaces. Buyers compare prices online before they visit a store, so sellers compete on range, service and delivery speed more than on brand alone, and partnerships with race organizers and court operators decide who reaches new players first.
How is supply organized, and where do margins sit?
Supply is concentrated in a listed franchise retailer, a few global brand owners and one large direct-selling sports chain, with specialist dealers in fitness equipment and local brands in outdoor gear. MAP Active runs partner stores for Nike and several other brands and the multi-brand chains noted above, which gives it wide control over floor space. Decathlon sells mainly its own brands, so it captures both the brand and retail margin. Fitness equipment flows through dealers such as PrimaFit and MG Sports that earn margin on installation and service. Entry barriers sit in brand licenses and mall access more than in production.
Companies profiled and their roles in this market
| Company | Type | Role in the market |
|---|---|---|
| PT Map Aktif Adiperkasa Tbk | Multi-brand and franchise retailer | Runs Sports Station, Planet Sports, Sports Direct and partner stores for Nike |
| Decathlon Indonesia | Own-brand sports retailer | Sells house brands for about 80 sports through stores and marketplaces |
| adidas Indonesia (adidas AG) | Global brand owner | Sells footwear, apparel and padel rackets through brand centers and partners |
| NIKE, Inc. | Global brand owner | Sells running, training and football products through partner-run Nike stores |
| PT PUMA Sports Indonesia | Global brand subsidiary | Operates the PUMA Indonesia webstore and supplies multi-brand retailers |
| PT Eigerindo Multi Produk Industri (Eiger) | Local brand and retailer | Makes and sells outdoor apparel, packs and camping equipment through own stores |
| PT Maharupa Gatra (MG Sports) | Fitness equipment distributor and retailer | Sells Kettler and other home and commercial fitness machines |
| PT Johnson Health Tech Indonesia | Equipment maker subsidiary | Maker of Matrix, Horizon and Vision treadmills, bikes and strength equipment |
| PrimaFit Indonesia | Fitness equipment distributor and service provider | Supplies gyms and studios, exclusive distributor of Merrithew Pilates equipment |
| BODIMAX Indonesia | Home fitness brand | Sells treadmills and home machines through official marketplace stores |
Store reach outside Java will decide share to 2035
Credence Research’s view is that in sports equipment and fitness retail, store reach outside Java, more than brand lineup, will decide market share to 2035. Participation is already rising fastest outside the capital, but most organized stores remain in a few Jakarta and Surabaya malls. MAP Active and Decathlon have the scale to open compact stores in Sumatra and Sulawesi, and the retailer that links those stores to marketplace orders will capture first-time buyers. Fitness equipment dealers should treat gyms, studios and offices as service clients rather than one-off sales, because installation and maintenance carry better margins than the machines.
Population, participation and retail data anchor sizing
The report uses 2025 as the base year and forecasts to 2035. Market values come from the Credence Research model, which combines BPS population and sport participation data, BPS regional output, published store counts and company releases, and retail price observations from brand and marketplace listings. Segment, channel and regional splits are Credence Research estimates built from these sources. The sources used are Statistics Indonesia, the Ministry of Health, the Ministry of Industry, WHO, Bank Indonesia statements, company announcements and national press reports.
Participation gains outweigh price pressure to 2035
Indonesian sports equipment and fitness retail is set to roughly double between 2025 and 2035 as more Indonesians run, play racquet sports and join gyms. Growth will be strongest in racquet equipment, in sales to commercial fitness operators and on marketplaces, while apparel and footwear keep the largest share. Java stays the core, but Sulawesi, Bali and Nusa Tenggara gain share as incomes rise. A weaker rupiah and trade rules will keep pressure on imported premium lines, which favors retailers that build local sourcing and own brands. Store reach outside the main malls will separate the leading sellers by the end of the period.
What separates the downside, base and upside paths to 2035?
The range of outcomes depends mainly on how fast participation keeps rising and on how far the rupiah weakens. A downside path follows if household budgets tighten, the rupiah falls further and racquet sports prove to be a short trend. The base case assumes steady participation gains and store growth at the pace announced to date. An upside path needs organized retailers to open widely outside Java and employers to start buying wellness equipment at scale.
| Scenario | CAGR, 2026–2035 | Value, 2035 | What has to hold |
|---|---|---|---|
| Downside | 6.1% | USD 4.55 billion | Household budgets tighten, the rupiah falls further and paid racquet court growth stalls |
| Base | 7.52% | USD 5.12 billion | Participation keeps rising steadily and store openings follow the plans announced to date |
| Upside | 8.8% | USD 5.70 billion | Compact stores spread outside Java and employers buy wellness equipment at scale |
Frequently Asked Questions
How big is the Indonesia sports equipment and fitness retail market?
Which region leads the market?
Which region grows fastest?
Which product type holds the largest share?
Why is padel important for sports retailers in Indonesia?
How fast are online channels growing?
Who are the leading companies in this market?
What are the main challenges for sellers?
Table of Content
Chapter 1 Market Segmentation
- 1.1 Segmentation Framework
- 1.1.1 Product and Service Classification
- 1.1.2 Application and End-Use Classification
- 1.1.3 Technology and Solution Classification
- 1.1.4 Customer and Distribution Channel Classification
- 1.1.5 Geographic Segmentation
- 1.1.6 Market Segment Definitions and Boundaries
- 1.2 By Product Type
- 1.2.1 Fitness Equipment
- 1.2.2 Team and Racket Sports Equipment
- 1.2.3 Outdoor and Recreation Equipment
- 1.2.4 Performance Apparel and Footwear
- 1.3 By Customer Type
- 1.3.1 Individual Consumers
- 1.3.2 Commercial Fitness Operators
- 1.3.3 Education Institutions
- 1.3.4 Sports Clubs and Corporate Wellness Buyers
- 1.4 By Price Tier
- 1.4.1 Entry-Level
- 1.4.2 Mid-Market
- 1.4.3 Premium
- 1.4.4 Professional Grade
Chapter 2 Introduction
- 2.1 Report Objectives and Scope
- 2.2 Product Definition and Industry Terminology
- 2.3 Market Inclusions and Exclusions
- 2.4 Research Process
- 2.4.1 Primary Research and Expert Interviews
- 2.4.2 Secondary Research and Source Review
- 2.4.3 Top-Down and Bottom-Up Estimation
- 2.4.4 Data Triangulation and Verification
- 2.5 Market Size Measurement Basis
- 2.5.1 2025: USD 2.49 billion → 2035: USD 5.12 billion
- 2.6 Historical and Forecast Reference Periods
- 2.6.1 Historical Period: 2018-2025
- 2.6.2 Base Year: 2025
- 2.6.3 Forecast Period: 2025-2035
- 2.7 Research Assumptions and Limitations
Chapter 3 Executive Summary
- 3.1 Market Snapshot and Key Findings
- 3.2 Base-Year Market Size, 2025
- 3.3 Forecast Market Size, 2035
- 3.4 Revenue and Volume Growth Outlook
- 3.5 Key Demand and Supply Indicators
- 3.6 Leading Market Segments
- 3.7 Fastest-Growing Market Opportunities
- 3.8 Regional Performance Highlights
- 3.9 Technology and Industry Transformation
- 3.10 Competitive Landscape Summary
- 3.11 Analyst View and Strategic Implications
Chapter 4 Indonesia Sports Equipment and Fitness Retail Market Trends and Developments
- 4.1 Historical Industry Development, 2018-2025
- 4.2 Recent Market Trends and Developments
- 4.3 Demand and Customer Behavior Trends
- 4.4 Technology and Product Innovation
- 4.5 Artificial Intelligence, Automation and Digitalization
- 4.6 Local Manufacturing and Supply Chain Realignment
- 4.7 Industry Partnerships, Mergers and Acquisitions
- 4.8 Sustainability and Circular Economy Developments
- 4.9 Government and Private Sector Investment Trends
- 4.10 Emerging Business Models and Commercialization
- 4.11 Industry Developments and Announcements
Chapter 5 Indonesia Sports Equipment and Fitness Retail Market Production, Supply and Demand Analysis
- 5.1 Demand Trend and Consumption Analysis, 2018-2025
- 5.2 Demand Forecast, 2025-2035
- 5.3 Production and Output Trend, 2018-2025
- 5.4 Production and Output Forecast, 2025-2035
- 5.5 Installed Capacity and Capacity Utilization
- 5.6 Company-Wise Production Plants and Statistics
- 5.6.1 Installed Production Capacity
- 5.6.2 Actual Production
- 5.6.3 Planned Capacity and Expansion Targets
- 5.7 Supply Chain Structure and Procurement Trends
- 5.8 Supply-Demand Gap and Bottlenecks
- 5.9 Import Dependence and Sourcing Structure
- 5.10 Contract Manufacturing and Outsourcing
- 5.11 Regional Supply and Demand Concentration
Chapter 6 Indonesia Sports Equipment and Fitness Retail Market Pricing Analysis
- 6.1 Pricing Structure and Measurement
- 6.2 Historical Pricing Trends, 2018-2025
- 6.3 Pricing Outlook, 2025-2035
- 6.4 Average Selling Price and Unit Economics
- 6.5 Pricing by Product and Market Segment
- 6.6 Geographic Pricing Differences
- 6.7 Key Input, Energy, Labor and Logistics Costs
- 6.8 Contract Pricing and Purchasing Models
- 6.9 Pricing Sensitivity and Competitive Positioning
- 6.10 Price, Margin and Profitability Implications
Chapter 7 Indonesia Sports Equipment and Fitness Retail Market Dynamics
- 7.1 Market Growth Drivers
- 7.1.1 Demand-Side Drivers
- 7.1.2 Technology and Innovation Drivers
- 7.1.3 Infrastructure and Investment Drivers
- 7.1.4 Regulatory and Policy Drivers
- 7.2 Market Restraints
- 7.2.1 Cost and Affordability Constraints
- 7.2.2 Technology and Adoption Barriers
- 7.2.3 Supply Chain and Operational Constraints
- 7.3 Market Challenges
- 7.3.1 Competitive Pressure and Margin Erosion
- 7.3.2 Skills, Infrastructure and Implementation Gaps
- 7.4 Emerging Market Opportunities
- 7.5 Market Dynamics Impact and Time-Horizon Assessment
Chapter 8 Indonesia Sports Equipment and Fitness Retail Value Chain Analysis
- 8.1 Industry Value Chain Overview
- 8.2 Upstream Suppliers and Critical Inputs
- 8.3 Technology and Component Providers
- 8.4 Manufacturing or Service Delivery
- 8.5 Distribution, Channel Partners and Integrators
- 8.6 Downstream Applications and End Users
- 8.7 Value Addition and Profit Pools
- 8.8 Vertical Integration and Outsourcing
- 8.9 Supplier Concentration and Risk
- 8.10 Supply Chain Localization and Resilience
Chapter 9 Indonesia Sports Equipment and Fitness Retail Market Regulations and Policies
- 9.1 Relevant Laws, Standards and Compliance Frameworks
- 9.2 Product, Service, Safety and Quality Requirements
- 9.3 Government Policies, Incentives and Subsidies
- 9.4 Imports, Exports and Trade Barriers
- 9.5 Public Procurement and Local Content Requirements
- 9.6 Environmental and Sustainability Compliance
- 9.7 Upcoming Policy Changes and Market Implications
Chapter 10 Indonesia Sports Equipment and Fitness Retail Market Hotspots and Opportunities
- 10.1 Market Opportunity Mapping and Growth Hotspots
- 10.2 High-Growth Applications and Customer Groups
- 10.3 Underserved Markets and White-Space Opportunities
- 10.4 Emerging Technology and Product Opportunities
- 10.5 New Capacity and Investment Hotspots
- 10.6 Market Entry and Expansion Opportunities
- 10.7 Distribution and Partnership Opportunities
- 10.8 Near-Term and Long-Term Commercial Potential
- 10.9 Opportunity Attractiveness and Execution Risks
Chapter 11 Indonesia Sports Equipment and Fitness Retail Market Outlook, 2025-2035
- 11.1 Market Size and Analysis
- 11.1.1 Revenue (Market Measurement: 2025: USD 2.49 billion → 2035: USD 5.12 billion)
- 11.1.2 Market Volume and Quantity Sold
- 11.1.3 Historical Market Size, 2018-2025
- 11.1.4 Base-Year Market Size, 2025
- 11.2 Market Forecast, 2025-2035
- 11.2.1 Revenue Forecast to 2035
- 11.2.2 Volume Forecast to 2035
- 11.2.3 CAGR and Year-on-Year Growth
- 11.2.4 Incremental Revenue Opportunity
- 11.3 Forecast Assumptions and Scenario Analysis
- 11.3.1 Base-Case Forecast
- 11.3.2 Optimistic and Conservative Scenarios
- 11.3.3 Technology, Pricing and Policy Sensitivities
- 11.4 Market Attractiveness and Growth Outlook
Chapter 12 Indonesia Sports Equipment and Fitness Retail Market Segmentation and Outlook
- 12.1 Segmentation Summary and Market Shares, 2025
- 12.2 Largest and Fastest-Growing Segments
- 12.3 By Product Type - Market Size and Forecast, 2025-2035
- 12.3.1 Segment Definition and Scope
- 12.3.2 Historical Market Size, 2018-2025
- 12.3.3 Revenue Forecast, 2025-2035
- 12.3.4 Volume Forecast, 2025-2035
- 12.3.5 Base-Year Market Share, 2025
- 12.3.6 Segment CAGR and Growth Drivers
- 12.3.7 Subsegment Market Size and Forecast
- 12.3.7.1 Fitness Equipment
- 12.3.7.2 Team and Racket Sports Equipment
- 12.3.7.3 Outdoor and Recreation Equipment
- 12.3.7.4 Performance Apparel and Footwear
- 12.3.8 Subsegment Pricing and Adoption Trends
- 12.3.9 Leading Suppliers and Competition
- 12.3.10 Regional Demand and Opportunities
- 12.4 By Customer Type - Market Size and Forecast, 2025-2035
- 12.4.1 Segment Definition and Scope
- 12.4.2 Historical Market Size, 2018-2025
- 12.4.3 Revenue Forecast, 2025-2035
- 12.4.4 Volume Forecast, 2025-2035
- 12.4.5 Base-Year Market Share, 2025
- 12.4.6 Segment CAGR and Growth Drivers
- 12.4.7 Subsegment Market Size and Forecast
- 12.4.7.1 Individual Consumers
- 12.4.7.2 Commercial Fitness Operators
- 12.4.7.3 Education Institutions
- 12.4.7.4 Sports Clubs and Corporate Wellness Buyers
- 12.4.8 Subsegment Pricing and Adoption Trends
- 12.4.9 Leading Suppliers and Competition
- 12.4.10 Regional Demand and Opportunities
- 12.5 By Price Tier - Market Size and Forecast, 2025-2035
- 12.5.1 Segment Definition and Scope
- 12.5.2 Historical Market Size, 2018-2025
- 12.5.3 Revenue Forecast, 2025-2035
- 12.5.4 Volume Forecast, 2025-2035
- 12.5.5 Base-Year Market Share, 2025
- 12.5.6 Segment CAGR and Growth Drivers
- 12.5.7 Subsegment Market Size and Forecast
- 12.5.7.1 Entry-Level
- 12.5.7.2 Mid-Market
- 12.5.7.3 Premium
- 12.5.7.4 Professional Grade
- 12.5.8 Subsegment Pricing and Adoption Trends
- 12.5.9 Leading Suppliers and Competition
- 12.5.10 Regional Demand and Opportunities
- 12.6 Segment Growth Comparison
- 12.7 Segment Attractiveness and Priority Matrix
Chapter 13 Indonesia Sports Equipment and Fitness Retail End-Use and Application Market Outlook
- 13.1 End-Use Industry and Customer Demand Structure
- 13.2 Leading Applications and Customer Groups
- 13.3 End-Use Market Size, Share and Forecast
- 13.4 Major End-Use Industry Deep Dives
- 13.4.1 Customer Requirements and Use Cases
- 13.4.2 Demand and Replacement Cycles
- 13.4.3 Technical and Regulatory Considerations
- 13.4.4 Purchasing and Procurement Models
- 13.4.5 Leading Vendors and Distribution Channels
- 13.4.6 Forecast and Commercial Opportunities
- 13.5 Emerging Applications and Cross-Segment Demand
- 13.6 End-Use Industry Investment Priorities
Chapter 14 Indonesia Sports Equipment and Fitness Retail Geographic Market Outlook, 2025-2035
- 14.1 Domestic Market Distribution and Demand Clusters
- 14.2 State- or Province-Wise Market Size and Forecast, 2025-2035
- 14.3 City and Metropolitan Market Outlook
- 14.4 Industrial, Manufacturing and Commercial Clusters
- 14.5 Geographic Concentration of Key End Users
- 14.6 Local Pricing and Purchasing Differences
- 14.7 Domestic Production Facilities and Capacity Map
- 14.8 Local Infrastructure and Project Pipeline
- 14.9 State-Level Policy and Incentive Differences
- 14.10 Subnational Investment Hotspots and Opportunities
- 14.11 Distribution and Logistics Networks
- 14.12 Domestic Competitive Footprint
Chapter 15 Indonesia Sports Equipment and Fitness Retail Technology, Innovation and Sustainability Outlook
- 15.1 Technology Landscape and Maturity
- 15.2 Product, Process and Service Innovation
- 15.3 AI, Automation and Digital Tools in the Industry
- 15.4 Technology Adoption and Performance Benchmarking
- 15.5 Innovation Pipeline and R&D Investment
- 15.6 Patent and Intellectual Property Trends
- 15.7 Energy Efficiency and Resource Management
- 15.8 Sustainability, Recycling and Circularity
- 15.9 Technology Roadmap, 2025-2035
- 15.10 Risks of Obsolescence and Technology Substitution
Chapter 16 Indonesia Sports Equipment and Fitness Retail Market Key Strategic Imperatives
- 16.1 Growth and Market Entry Priorities
- 16.2 High-Return Products and Segments
- 16.3 Pricing, Profitability and Cost Optimization
- 16.4 Technology Investment and Product Differentiation
- 16.5 Supply Chain Localization and Resilience
- 16.6 Distribution and Customer Acquisition
- 16.7 Partnership, Acquisition and Capacity Strategy
- 16.8 Regional Expansion Priorities
- 16.9 Short-, Medium- and Long-Term Actions
Chapter 17 Competition Outlook
- 17.1 Industry Competition Characteristics
- 17.2 Market Structure and Concentration
- 17.3 Market Share and Competitive Positioning, 2025
- 17.4 Company-Wise Revenue and Product Benchmarking
- 17.5 Production and Service Capacity Benchmarking
- 17.6 Technology, Pricing and Differentiation
- 17.7 Regional Footprint and Distribution Strength
- 17.8 Mergers, Acquisitions and Strategic Alliances
- 17.9 New Entrants and Competitive Threats
- 17.10 Porter's Five Forces and Industry Attractiveness
- 17.11 Competitive Outlook, 2025-2035
Chapter 18 Company Profiles
- 18.1 Company Coverage and Selection Criteria
- 18.2 PT Map Aktif Adiperkasa Tbk
- 18.2.1 Business Description
- 18.2.2 Company Ownership and Geographic Presence
- 18.2.3 Product and Service Portfolio
- 18.2.4 Manufacturing and Operating Footprint
- 18.2.5 Production Capacity and Expansion Plans
- 18.2.6 Financial Performance and Investment
- 18.2.7 Market Share and Competitive Position
- 18.2.8 Technology and Innovation Capabilities
- 18.2.9 Strategic Alliances or Partnerships
- 18.2.10 Recent Developments
- 18.2.11 Growth Strategy and Outlook
- 18.3 Decathlon Indonesia
- 18.4 adidas Indonesia (adidas AG)
- 18.5 NIKE, Inc.
- 18.6 PT PUMA Sports Indonesia
- 18.7 PT Eigerindo Multi Produk Industri (Eiger)
- 18.8 PT Maharupa Gatra (MG Sports)
- 18.9 PT Johnson Health Tech Indonesia
- 18.10 PrimaFit Indonesia
- 18.11 BODIMAX Indonesia
- 18.12 Other Relevant Market Participants
Note: Every listed company is profiled on the structure shown under the first company. The company list is preliminary and may change based on research findings, market developments, data availability and client requirements.
Chapter 19 Disclaimer
- 19.1 Research and Forecast Disclaimer
- 19.2 Data Source and Estimation Limitations
Note: The depth of individual sections depends on data availability for this market. Volume, capacity, trade and other unit-based metrics are included where applicable.