
Market Overview
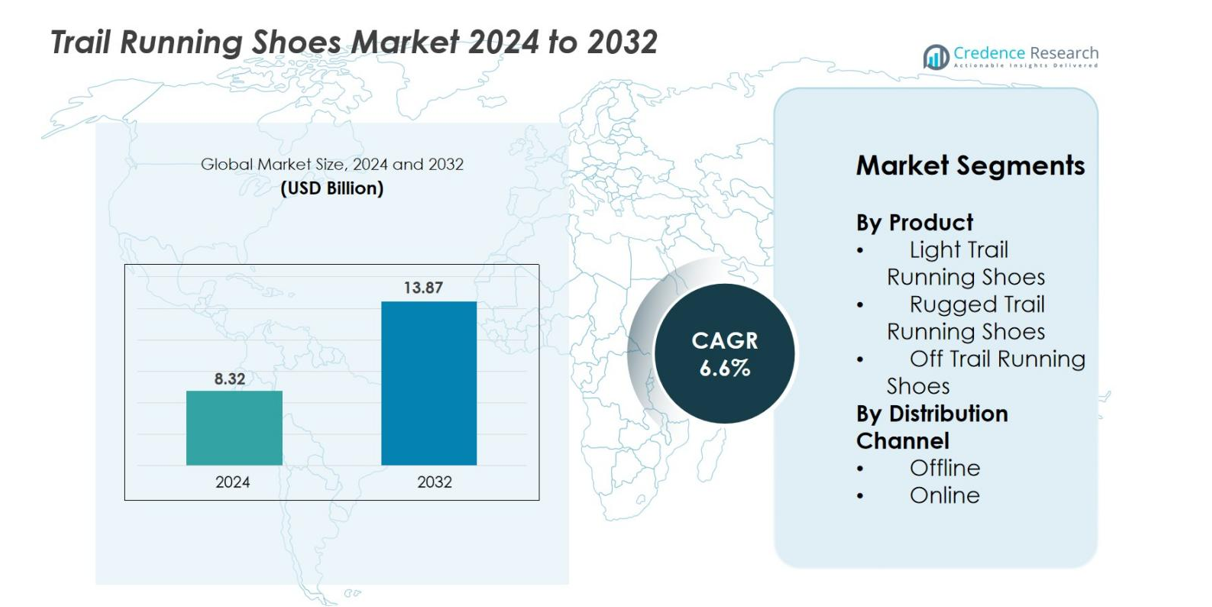
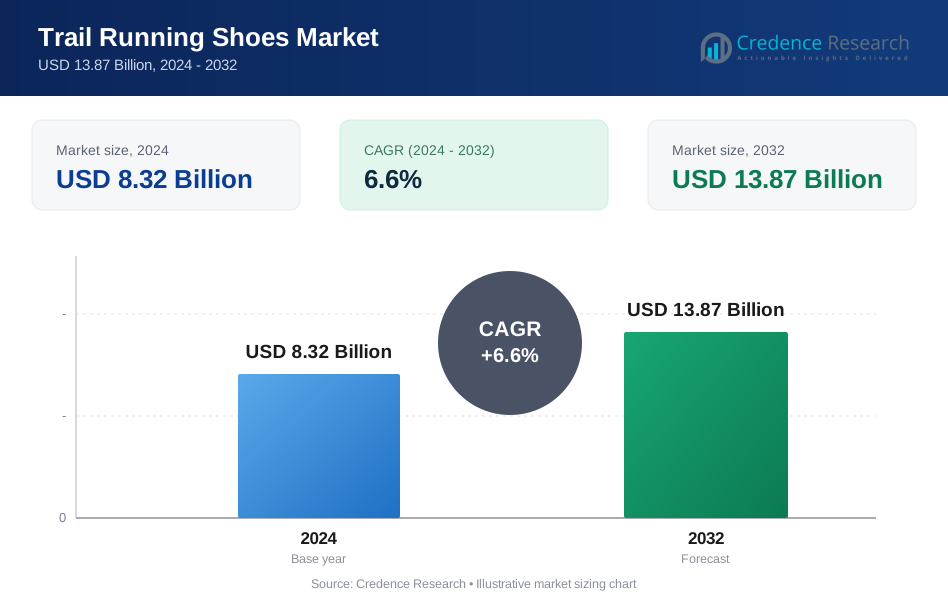
Trail Running Shoes Market size was valued USD 8.32 Billion in 2024 and is anticipated to reach USD 13.87 Billion by 2032, at a CAGR of 6.6% during the forecast period.| REPORT ATTRIBUTE | DETAILS |
|---|---|
| Historical Period | 2020-2023 |
| Base Year | 2024 |
| Forecast Period | 2025-2032 |
| Trail Running Shoes Market Size 2024 | USD 8.32 Billion |
| Trail Running Shoes Market, CAGR | 6.6% |
| Trail Running Shoes Market Size 2032 | USD 13.87 Billion |
Market Insights
- Trail Running Shoes Market was valued at USD 8.32 Billion in 2024 and is projected to reach USD 13.87 Billion by 2032, registering a CAGR of 6.6% during the forecast period.
- Market growth is driven by rising outdoor sports participation, increasing health consciousness, and expanding demand for lightweight and high-performance footwear across recreational and professional runners.
- Key trends include adoption of sustainable materials, innovation in cushioning and grip technologies, and growing preference for premium models designed for diverse terrains and long-distance running events.
- Leading players such as Nike, Adidas, Deckers Brands, New Balance, ASICS, and Brooks compete through advanced product designs, strong retail presence, and expanding e-commerce channels, while smaller brands face pricing and innovation pressures.
- North America holds a 32% regional share, Europe accounts for 28%, and Asia Pacific captures 27%, while Light Trail Running Shoes lead the product segment with a 46.3% share, supported by strong demand for versatile and lightweight designs.
Market Segmentation Analysis
By Product
The Trail Running Shoes Market by product is led by Light Trail Running Shoes, accounting for 46.3% of the segment share in 2024. This category dominates due to its lightweight construction, enhanced flexibility, and suitability for mixed-terrain running preferred by recreational and competitive runners. Rugged Trail Running Shoes hold a strong presence with their advanced stability and protection features, while Off-Trail Running Shoes serve niche users requiring extreme durability. Growth across all product types is supported by increasing outdoor sports participation, rising demand for performance footwear, and expanding innovation in cushioning and outsole technologies.- For instance, the Nike Terra Kiger 9 has a full-length Nike React foam midsole and specifically removed the Zoom Air units (both forefoot and heel) found in previous iterations to bring the foot closer to the ground for enhanced agility and a more connected feel on the trail.
By Distribution Channel
The distribution channel analysis shows that Offline Retail remains the dominant sub-segment, capturing 58.7% of the Trail Running Shoes Market in 2024. Specialty sports stores, brand outlets, and outdoor gear retailers continue to attract buyers seeking proper fit assessment and expert guidance. However, Online Channels are expanding rapidly, supported by wider product availability, competitive pricing, and the convenience of home delivery. The surge in digital commerce platforms, enhanced virtual try-on tools, and growing consumer confidence in online purchases further fuel the online segment’s robust growth trajectory.- For instance, Decathlon supports offline dominance with a network of over 1,750 physical stores across more than 70 countries, enabling on-site footwear fitting and expert consultations.
Key Growth Drivers
Rising Participation in Outdoor and Fitness Activities
The Trail Running Shoes Market is experiencing strong growth due to the surge in outdoor sports participation, driven by increasing health awareness and the popularity of recreational fitness activities. Consumers across all age groups are adopting trail running for its physical and mental health benefits, contributing significantly to footwear demand. The rise of organized outdoor events, such as trail marathons, mountain running competitions, and endurance races, further boosts product adoption. Additionally, growing interest in adventure tourism, supported by improved access to hiking trails and national parks, accelerates market expansion. Brands are responding with advanced cushioning technologies, lightweight materials, and enhanced grip designs to meet evolving user preferences. The emphasis on performance footwear suited for varied terrains positions trail running shoes as a core category within the broader athletic footwear segment. This rising adoption, combined with lifestyle shifts and global fitness trends, continues to drive steady market growth.- For instance, The UTMB (Ultra-Trail du Mont-Blanc) registered 10,000+ runners across its race categories in 2023, many equipped with specialized trail footwear supplied through brand partnerships such as Salomon’s event support team of over 200 product specialists
Product Innovation and Technological Advancements
Technological advancements are a crucial catalyst for growth in the Trail Running Shoes Market. Manufacturers are investing in innovative materials and engineering techniques to deliver superior durability, traction, and comfort for demanding terrains. Key innovations include multi-directional lug patterns, energy-return midsoles, and reinforced uppers that enhance stability and protection without compromising weight. Brands are integrating sustainable materials, such as recycled mesh and eco-friendly rubber compounds, to cater to environmentally conscious consumers. Moreover, advancements in gait analysis and biomechanical research have enabled personalized footwear solutions, improving performance and reducing injury risks. These technology-driven improvements help brands differentiate in a highly competitive market while meeting diverse consumer expectations. Continuous R&D investment ensures that trail running shoes evolve rapidly, attracting both seasoned athletes and beginners. As innovation remains central to product development, the market benefits from consistent upgrades, expanded product lines, and enhanced user experience, fueling long-term growth.- For instance, Brooks incorporates nitrogen-infused DNA Flash foam technology in certain road and trail models to increase energy return and provide lightweight performance.
Expansion of E-commerce and Omnichannel Retailing
The rapid expansion of e-commerce and omnichannel retail strategies serves as a significant growth driver for the Trail Running Shoes Market. Online platforms offer consumers access to a wider range of products, competitive pricing, and detailed product comparisons, making digital shopping increasingly preferred. Brands and retailers are enhancing user experience through virtual try-on tools, AI-driven product recommendations, and advanced sizing systems that reduce purchase hesitation. Omnichannel integration, such as click-and-collect services and seamless returns, further strengthens consumer confidence. Retailers are leveraging data analytics to understand buying behaviors, optimize inventory, and tailor promotions to specific customer segments. Additionally, social media and influencer marketing play a pivotal role in raising brand visibility and promoting outdoor lifestyles associated with trail running. The convenience of online purchasing, combined with expanding global reach and evolving digital strategies, reinforces the segment’s growth trajectory and improves accessibility for both urban and remote consumers.Key Trends & Opportunities
Sustainability and Eco-Friendly Product Development
Sustainability has emerged as a defining trend in the Trail Running Shoes Market, with consumers increasingly prioritizing eco-friendly materials and responsible manufacturing practices. Brands are incorporating recycled plastics, biodegradable midsoles, and natural rubber outsoles to minimize environmental impact. Waterless dyeing techniques, reduced carbon manufacturing, and ethical sourcing practices are gaining traction across the industry. This shift presents a major opportunity for companies to build brand loyalty by aligning with global sustainability values. Regulatory bodies and environmental organizations are pushing for greener production standards, further motivating manufacturers to adopt sustainable methods. The growing preference for long-lasting and repairable footwear also encourages brands to design more durable products. As environmental consciousness rises and consumers prefer brands that support circular economy practices, sustainability will continue to reshape product innovation and market positioning, offering long-term competitive advantages.- For instance, Adidas’ Parley program incorporates materials made from intercepted marine waste, with each pair of shoes using the equivalent of approximately 11 recovered plastic bottles, reducing reliance on virgin plastics.
Growing Demand for Premium and High-Performance Footwear
Another key trend shaping the Trail Running Shoes Market is the rising demand for premium, high-performance footwear equipped with advanced functionalities. Consumers are increasingly willing to invest in shoes that offer superior cushioning, enhanced breathability, and specialized traction for diverse terrains. This demand is driven by the growing sophistication of trail running as a sport and the expectations of experienced runners seeking optimized performance. Opportunities arise for brands to expand their premium product portfolios, including waterproof models, carbon-plate infused shoes, and terrain-specific designs. The popularity of long-distance trail events and technical mountain races has amplified the need for products that balance comfort, protection, and speed. Custom-fit footwear and limited-edition performance series are gaining traction among enthusiasts. As consumer preferences shift toward high-value technical products, brands with advanced R&D capabilities have a significant opportunity to capture premium market share.- For instance, The Nike Ultrafly Trail integrates a full-length carbon plate combined with ZoomX foam and weighs approximately 300 grams in a men’s size 9, engineered for elite racing performance.
Key Challenges
Intense Market Competition and Price Pressure
The Trail Running Shoes Market faces significant challenges due to intense competition among global and regional brands. Established companies with strong R&D investments dominate the market, making it difficult for smaller players to compete on both technology and pricing. Frequent product launches by leading brands increase price pressure, forcing manufacturers to balance cost efficiency with innovation. Additionally, counterfeit and low-quality products in certain regions dilute brand value and disrupt pricing strategies. Retail competition, both offline and online, further compresses margins, as discount-driven promotions become prevalent. Consumers increasingly compare specifications, reviews, and pricing across multiple platforms, raising the requirement for differentiation. Maintaining profitability while delivering advanced features remains challenging for many manufacturers. As competitive intensity grows, brands must strategically innovate, optimize supply chains, and invest in marketing to sustain market presence and protect market share.Supply Chain Disruptions and Raw Material Volatility
Supply chain instability poses an ongoing challenge in the Trail Running Shoes Market, particularly due to fluctuations in raw material availability and global logistics disruptions. The industry relies heavily on specific materials such as EVA foam, rubber compounds, synthetic fabrics, and eco-friendly alternatives, all of which are prone to price volatility. Environmental regulations and restrictions on certain chemical components can further impact manufacturing processes. Geopolitical tensions, global shipping delays, and labor shortages in manufacturing hubs disrupt production timelines, affecting product availability across key markets. Brands must navigate rising transportation costs and ensure flexibility in sourcing to maintain steady output. Additionally, the push toward sustainability requires new supply partnerships, which can initially increase costs and complexity. Ensuring consistent material quality and timely delivery while managing production costs remains a critical challenge for companies in this evolving and dynamic market.Regional Analysis
North America North America holds a 32% share of the Trail Running Shoes Market, driven by strong participation in outdoor sports, well-developed trail infrastructure, and high consumer spending on premium athletic footwear. The U.S. leads the region due to its widespread trail running culture and the presence of major performance footwear brands introducing advanced cushioning and grip technologies. Rising interest in fitness activities, coupled with growing enrollment in trail races and marathons, further strengthens market demand. Retail expansion across specialty sports stores and increasing online penetration also support steady growth, positioning North America as a key revenue contributor. Europe Europe accounts for 28% of the Trail Running Shoes Market, supported by a strong outdoor recreation culture and favorable geographical conditions for trail running across countries like Germany, France, Spain, and the Nordic nations. The region benefits from a large base of professional and recreational trail runners, driving demand for durable and performance-enhancing footwear. Increasing participation in ultra-trail and mountain running events also boosts uptake of rugged and lightweight models. Sustainability-focused innovations appeal strongly to European consumers, enhancing brand competitiveness. With a mature athletic footwear market and rising tourism in mountainous regions, Europe maintains a solid growth trajectory. Asia Pacific Asia Pacific captures 27% of the Trail Running Shoes Market, emerging as one of the fastest-growing regions due to expanding outdoor sports participation and rising health awareness in China, Japan, Australia, and India. Governments and private organizations are investing in hiking trails, running parks, and adventure tourism, stimulating product demand. Growing urbanization and higher disposable incomes encourage consumers to adopt premium performance footwear. International brands are increasing regional presence through targeted marketing and e-commerce expansion. The surge in local trail running events and growing interest in fitness lifestyle trends further position Asia Pacific as a high-potential market. Latin America Latin America holds an 8% share of the Trail Running Shoes Market, driven by increasing interest in outdoor recreational activities and expanding participation in trail races across Brazil, Mexico, Chile, and Argentina. The region’s diverse terrain, including mountains and forest trails, supports rising demand for durable and multi-terrain footwear. Growing adoption of active lifestyles and the expansion of specialty sports stores further strengthen market penetration. E-commerce growth enables broader access to international brands, encouraging faster product adoption. Although the market is still developing, rising fitness engagement and tourism-driven trail activities continue to create opportunities for sustained regional growth. Middle East & Africa The Middle East & Africa region accounts for 5% of the Trail Running Shoes Market, supported by increasing outdoor activity participation in countries such as the UAE, South Africa, and Saudi Arabia. Expanding adventure tourism, including desert trails and mountain running zones, is boosting demand for lightweight and rugged footwear. Growth in health consciousness and rising popularity of community-based running events further stimulate market interest. Retail development and improved online availability of global brands enhance accessibility. Although smaller in size, the region shows steady potential as urban populations embrace fitness-oriented lifestyles and seek specialized footwear for challenging terrains.Market Segmentations
By Product- Light Trail Running Shoes
- Rugged Trail Running Shoes
- Off Trail Running Shoes
- Offline
- Online
- North America
- U.S.
- Canada
- Mexico
- Europe
- Germany
- France
- U.K.
- Italy
- Spain
- Rest of Europe
- Asia Pacific
- China
- Japan
- India
- South Korea
- South-east Asia
- Rest of Asia Pacific
- Latin America
- Brazil
- Argentina
- Rest of Latin America
- Middle East & Africa
- GCC Countries
- South Africa
- Rest of the Middle East and Africa
Competitive Landscape
The Trail Running Shoes Market features a dynamic competitive landscape shaped by global brands and specialized outdoor performance companies. Key players such as Nike, Inc., Adidas AG, New Balance, Deckers Brands, ASICS America Corporation, Brooks Sports, Inc., Wolverine World Wide, Inc., VF Corporation, SKECHERS USA, Inc., and Amer Sports dominate the market through extensive product portfolios and strong distribution networks. These companies compete on innovation, focusing on advanced cushioning, lightweight materials, enhanced traction, and sustainable manufacturing to meet evolving consumer expectations. Premium technologies, such as energy-return midsoles, multi-directional grip outsoles, and waterproof membranes, help brands differentiate in a crowded environment. Strategic partnerships, athlete endorsements, and expanding e-commerce reach further strengthen brand visibility and customer loyalty. Additionally, niche outdoor brands continue to gain momentum by offering terrain-specific designs and eco-conscious products. As competition intensifies, companies increasingly invest in R&D, digital engagement, and regional expansion to secure long-term market leadership.Key Player Analysis
- Nike, Inc.
- Deckers Brands
- Brooks Sports, Inc.
- ASICS America Corporation
- Amer Sports
- Wolverine World Wide, Inc.
- SKECHERS USA, Inc.
- VF Corporation
- Adidas AG
- New Balance
Recent Developments
- In November 2025, Salomon revealed the collaborative trail-running shoe “XT-Whisper” with Aries, set for release 18 November.
- In July 2025, Keen will release its first trail-running shoe “Seek” on July 25 after nearly two years of development.
- In March 2025, The North Face unveiled four new trail-running shoes in its Vectiv 3.0 series.
Report Coverage
The research report offers an in-depth analysis based on Product, Distribution Channel and Geography. It details leading market players, providing an overview of their business, product offerings, investments, revenue streams, and key applications. Additionally, the report includes insights into the competitive environment, SWOT analysis, current market trends, as well as the primary drivers and constraints. Furthermore, it discusses various factors that have driven market expansion in recent years. The report also explores market dynamics, regulatory scenarios, and technological advancements that are shaping the industry. It assesses the impact of external factors and global economic changes on market growth. Lastly, it provides strategic recommendations for new entrants and established companies to navigate the complexities of the market.
Future Outlook
- The market will experience steady growth as outdoor recreation and fitness participation continue to rise globally.
- Demand for lightweight, durable, and performance-enhancing footwear will strengthen across beginner and professional runners.
- Brands will increasingly adopt sustainable materials and eco-friendly production methods to meet consumer expectations.
- Premium and technologically advanced shoes with improved cushioning and traction will gain higher market traction.
- E-commerce expansion and digital retail innovations will further boost accessibility and global product reach.
- Custom-fit and personalized trail running shoe solutions will emerge as key differentiation factors.
- Growth in adventure tourism and participation in trail races will drive higher product adoption.
- Regional markets in Asia Pacific and Latin America will expand rapidly due to rising fitness awareness.
- Companies will intensify collaborations with athletes and influencers to enhance brand visibility.
- Continuous R&D investment will lead to advanced shoe designs tailored for diverse terrains and running styles.
Request a Free Sample
Fill in your details and we'll send you a free sample report.
- Sample data tables & charts
- Research methodology
Need a Custom Version of This Report?
Tailor the scope, geography, or segments to your exact requirements.
- Custom geography or segment scope
- Direct access to our analyst team
Frequently Asked Questions
What is the current market size for Trail Running Shoes market, and what is its projected size in 2032?
At what Compound Annual Growth Rate is the Trail Running Shoes market projected to grow between 2025 and 2032?
Which is the leading region of the market for trail running shoes?
What are the key drivers for the growth of the trail running shoe market?
Which is the major market segment in the trail running shoes by distribution channel outlook?
Who are the leading companies in the Trail Running Shoes market?
Table of Content
Chapter 1. Report Introduction
- 1.1 Report Description & Purpose
- 1.1.1 Report Title & Market Definition
- 1.1.2 Unique Selling Propositions (USP) & Key Differentiators
- 1.1.3 Value Proposition for Stakeholders
- 1.2 Research Objectives
- 1.2.1 Market Sizing Objectives (Volume & Revenue) (Volume Where Applicable)
- 1.2.2 Segmentation Objectives
- 1.2.3 Competitive Intelligence Objectives
- 1.2.4 Forecast & Scenario Objectives
- 1.3 Report Scope
- 1.3.1 Trail Running Shoes Scope – Segments & Subsegments Covered
- 1.3.2 Geographic Scope – Regions & Countries Covered
- 1.3.3 Historical Period, Base Year & Forecast Period (2024; forecast to 2032)
- 1.3.4 Inclusions & Exclusions
- 1.4 Industry Classification & Applicable Codes
- 1.5 Currency, Measurement Units & Valuation Basis
- 1.6 Target Stakeholders
- 1.7 Limitations & Assumptions
Chapter 2. Executive Summary
- 2.1 Global Trail Running Shoes Market Snapshot
- 2.1.1 Market Size – Historical (2024) & Forecast (2024-2032) (2024: USD 8.32 Billion → 2032: USD 13.87 Billion)
- 2.1.2 Volume & Revenue – Global Totals (Volume Where Applicable)
- 2.1.3 Key Market Highlights – Top Five Facts
- 2.2 Trail Running Shoes Market Segmentation Snapshot
- 2.2.1 Market Split by Region – 2024 vs. 2032
- 2.3 Competitive Snapshot
- 2.3.1 Top 10 Players by Revenue Share – 2024
- 2.3.2 Top 10 Players by Volume Share – 2024 (Volume Where Applicable)
- 2.3.3 Recent Strategic Developments (18-Month Summary)
- 2.4 Key Investment Highlights & Strategic Conclusions
Chapter 3. Trail Running Shoes Market Dynamics & Industry Analysis
- 3.1 Market Overview & Context
- 3.1.1 Trail Running Shoes Market Position in the Broader Industry Value Chain
- 3.1.2 Demand Structure & Purchasing Dynamics
- 3.1.3 Market Maturity & Development Stage by Region
- 3.2 Trail Running Shoes Market Drivers
- 3.3 Trail Running Shoes Market Restraints & Challenges
- 3.4 Trail Running Shoes Market Opportunities
- 3.5 Porter's Five Forces Analysis
- 3.5.1 Threat of New Entrants
- 3.5.2 Bargaining Power of Suppliers
- 3.5.3 Bargaining Power of Buyers
- 3.5.4 Threat of Substitutes
- 3.5.5 Competitive Rivalry – Intensity Assessment
- 3.6 Trail Running Shoes Value Chain Analysis
- 3.6.1 Upstream – Key Inputs, Resources & Suppliers
- 3.6.1.1 Key Input/Resource 1
- 3.6.1.2 Key Input/Resource 2
- 3.6.1.3 Key Input/Resource 3
- 3.6.2 Midstream – Core Operations & Value Creation
- 3.6.2.1 Operating Model & Process Overview
- 3.6.2.2 Key Operating Locations & Capabilities by Company
- 3.6.3 Downstream – Market Channels & End Users
- 3.6.3.1 Direct Sales & Customer Engagement Channels
- 3.6.3.2 Indirect Sales, Intermediaries & Partner Channels
- 3.6.4 Value Chain Profitability Analysis
- 3.6.1 Upstream – Key Inputs, Resources & Suppliers
- 3.7 PESTEL Analysis
- 3.7.1 Political Factors
- 3.7.2 Economic Factors
- 3.7.3 Social Factors
- 3.7.4 Technological Factors
- 3.7.5 Environmental Factors
- 3.7.6 Legal Factors
- 3.8 Trail Running Shoes Supply Chain Analysis
- 3.8.1 Critical Input & Resource Availability Risk Assessment
- 3.8.2 Supplier & Operational Concentration Risk (Geographic Exposure)
- 3.8.3 Supply & Service Disruption Impact Analysis
- 3.9 Regulatory & Policy Landscape
Note: The regulatory and policy landscape section covers regulations based on their applicability to the market, Trail Running Shoes category, geography, and scope of the study. Only regulatory frameworks with a material impact on operations, compliance, trade, sustainability, or market access are analyzed in detail.
Chapter 4. Key Investment Pockets & Opportunity Analysis
- 4.1 Trail Running Shoes Market Attractiveness Analysis
- 4.1.1 By Region – Investment Attractiveness Matrix (Market Size × CAGR)
- 4.2 Absolute Revenue Growth Opportunity
- 4.2.1 By Region – Absolute Revenue Growth Through 2032
- 4.3 Incremental Demand Opportunity
- 4.3.1 By Region – Incremental Demand Through 2032
- 4.3.2 Segment – Incremental Demand
- 4.4 Emerging Submarket Opportunity Deep Dive (Subject to Applicability)
- 4.5 Priority Market Opportunity Scorecards
- 4.5.1 United States
- 4.5.2 Europe
- 4.5.3 Asia
- 4.5.4 Middle East & Africa
Note: Priority market opportunity scorecards reflect the geographic scope and strategic relevance of the study. Listed markets are indicative and may be adapted to the industry.
Chapter 5. Trail Running Shoes Cross-Border Trade & Market Access Analysis
- 5.1 International Trade & Cross-Border Activity Overview
- 5.1.1 Global Export Value by Country (2024)
- 5.1.2 Global Export Volume by Country (2024) (Volume Where Applicable)
- 5.1.3 Global Import Value by Country (2024)
- 5.1.4 Global Import Volume by Country (2024) (Volume Where Applicable)
- 5.1.5 Net Trade Balance by Country (2024)
- 5.2 Export Analysis – Segment
- 5.2.1 Category 1 (Applicable Classification Code)
- 5.2.2 Category 2 (Applicable Classification Code)
- 5.2.3 Category 3 (Applicable Classification Code)
- 5.2.4 Category 4 (Applicable Classification Code)
- 5.2.5 Category 5 (Applicable Classification Code)
- 5.3 Import Analysis – Segment
- 5.3.1 Category 1 (Applicable Classification Code)
- 5.3.2 Category 2 (Applicable Classification Code)
- 5.3.3 Category 3 (Applicable Classification Code)
- 5.3.4 Category 4 (Applicable Classification Code)
- 5.3.5 Category 5 (Applicable Classification Code)
- 5.4 Cross-Border Pricing & Transaction Benchmarks
- 5.4.1 Export Pricing – Segment & Country
- 5.4.2 Import Pricing – Segment & Source Country
- 5.4.3 Price Trends (2024)
- 5.5 Key Cross-Border Trade & Delivery Routes
- 5.5.1 Cross-Border Trade/Delivery Route 1
- 5.5.2 Cross-Border Trade/Delivery Route 2
- 5.5.3 Cross-Border Trade/Delivery Route 3
- 5.5.4 Cross-Border Trade/Delivery Route 4
- 5.5.5 Cross-Border Trade/Delivery Route 5
- 5.6 Trade Policy & Market Access Impact Assessment
- 5.6.1 Tariff & Non-Tariff Barriers
- 5.6.2 Regional Trade & Economic Integration Frameworks
- 5.6.3 Bilateral & Multilateral Trade Agreements
- 5.6.4 Cross-Border Operating, Licensing & Localization Requirements
Note: This chapter applies where cross-border trade or delivery is relevant to Trail Running Shoes. Goods, services, and digital offerings are assessed using applicable classifications and transaction measures. Import-export volumes, trade balances, and route analyses are included only where meaningful to the market.
Chapter 6. Competitive Landscape & Company Benchmarking
- 6.1 Trail Running Shoes Market Concentration & Structure
- 6.1.1 Herfindahl-Hirschman Index (HHI) – vs. 2024
- 6.1.2 Leading, Mid-Sized & Emerging Player Structure
- 6.1.3 Global, Regional & Local Player Dynamics
- 6.2 Trail Running Shoes Market Share Analysis – 2024
- 6.2.1 Global Revenue Share by Company
- 6.2.2 Global Volume Share by Company (Volume Where Applicable)
- 6.2.3 Regional Revenue Share
- 6.2.4 Market Share Evolution ( vs. 2024)
- 6.2.5 Company Market Share by Key Segment
- 6.2.6 Company Market Share by Customer Group
- 6.3 Operating Scale, Capacity & Infrastructure Analysis
- 6.3.1 Global Operating Scale & Supply Capacity
- 6.3.2 Resource Utilization & Operating Efficiency
- 6.3.3 Output, Service Delivery & Activity Metrics
- 6.3.4 Operating Footprint & Infrastructure Map
- 6.3.5 Planned Operational & Capacity Expansion
- 6.4 Trail Running Shoes Competitive Benchmarking Matrix
- 6.4.1 Revenue, Growth, Profitability & Operating Metric Comparison
- 6.4.2 Channel Revenue Mix
- 6.4.3 Geographic Revenue Exposure
- 6.4.4 R&D Intensity
- 6.4.5 Sustainability Maturity
- 6.5 Strategic Developments in Trail Running Shoes (Last 24 Months)
- 6.5.1 Mergers, Acquisitions & Divestments
- 6.5.2 New Products, Services & Solutions in Trail Running Shoes
- 6.5.3 Operational & Infrastructure Expansions
- 6.5.4 Strategic Alliances, Joint Ventures & Partnerships
- 6.5.5 Distribution Expansion & Market Entry
- 6.5.6 Sustainability & ESG Initiatives
- 6.6 Competitive Strategy Mapping
- 6.6.1 Leader, Challenger, Follower & Niche Classification
- 6.6.2 Pricing Strategy Comparison
- 6.6.3 Channel Strategy Matrix
Note: Strategic developments are included based on their materiality and the availability of reliable information.
Chapter 7. Global Trail Running Shoes Market – By Sales & Delivery Channel
- 7.1 Segment Overview
- 7.1.1 Volume & Revenue Split by Channel (2024 & 2032) (Volume Where Applicable)
- 7.1.2 Channel Mix Evolution (2024-2032)
Chapter 8. Regional Market Analysis – Global Overview
- 8.1 Global Regional Overview
- 8.1.1 Regional Volume Share (Volume Where Applicable)
- 8.1.2 Regional Revenue Share
- 8.1.3 Regional Volume by Region (Volume Where Applicable)
- 8.1.4 Regional Revenue by Region
- 8.1.5 Regional Forecast Through 2032
- 8.2 Cross-Regional Segment Analysis
- 8.2.1 By Sales & Delivery Channel
- 8.2.2 By Competitive Positioning & Price Tier
Chapter 9. North America Trail Running Shoes Market
- 9.1 United States
- 9.2 Canada
- 9.3 Mexico
Chapter 10. Europe Trail Running Shoes Market
- 10.1 Germany
- 10.2 France
- 10.3 Italy
- 10.4 United Kingdom
- 10.5 Spain
- 10.6 Poland
- 10.7 Russia
- 10.8 Netherlands
- 10.9 Belgium
- 10.10 Sweden
- 10.11 Denmark
- 10.12 Norway
- 10.13 Rest of Europe
Chapter 11. Asia Pacific Trail Running Shoes Market
- 11.1 China
- 11.2 India
- 11.3 Japan
- 11.4 South Korea
- 11.5 Thailand
- 11.6 Indonesia
- 11.7 Vietnam
- 11.8 Malaysia
- 11.9 Australia
- 11.10 Rest of Asia Pacific
Chapter 12. Latin America Trail Running Shoes Market
- 12.1 Brazil
- 12.2 Argentina
- 12.3 Colombia
- 12.4 Chile
- 12.5 Rest of Latin America
Chapter 13. Middle East Trail Running Shoes Market
- 13.1 Saudi Arabia
- 13.2 United Arab Emirates
- 13.3 Turkey
- 13.4 Israel
- 13.5 Iran
- 13.6 Rest of the Middle East
Chapter 14. Africa Trail Running Shoes Market
- 14.1 South Africa
- 14.2 Egypt
- 14.3 Nigeria
- 14.4 Morocco
- 14.5 Rest of Africa
Chapter 15. Trail Running Shoes Company Profiles
- 15.1 [Company 01]
- 15.1.1 Company Overview
- 15.1.2 Key Management Personnel
- 15.1.3 Products & Services Portfolio
- 15.1.4 Financial Performance
- 15.1.5 Key Market Focus & Geographic Presence
- 15.1.6 Recent Developments & Strategic Initiatives
Note: The company profile list is preliminary and may change based on research findings, market developments, data availability, and client requirements.
Chapter 16. Appendices
- Appendix A – List of Abbreviations & Acronyms
- Appendix B – Industry Classification Code Reference – Full Series
- Appendix C – Supply, Output & Operating Capacity Data Tables
- Appendix D – End-Use & Demand Base Tables
- Appendix E – Demand, Adoption & Usage Assumptions
- Appendix F – Pricing & Revenue Metric Reference Tables
- Appendix G – Company Operations & Infrastructure Database
- Appendix H – Cross-Border Trade & Activity Data Tables (Where Applicable)
- Appendix I – Regulatory Summary Tables
- Appendix J – Primary Research Participant List (Anonymized)
- Appendix K – Primary Research Questionnaire Framework
- Appendix L – Data Sources & Bibliography
- Appendix M – Market Size Divergence & Source Comparison
Chapter 17. Research Methodology
- 17.1 Research Framework & Philosophy
- 17.2 Secondary Research – Sources, Hierarchy & Data Extraction
- 17.3 Data Modeling – Bottom-Up & Top-Down Market Sizing
- 17.4 Primary Research – Stakeholder Framework, LOI & Sample Sizes
- 17.5 Forecast Methodology – Regression, Scenario & Sensitivity Analysis
- 17.6 Quality Control – Four-Layer Validation Framework
- 17.7 Limitations & Standard Assumptions
- 17.8 Disclaimer
