Dutch sportswear spending tracks a nation that trains weekly
The Netherlands athletic apparel and sportswear market was valued at USD 3.64 billion in 2025 and is projected to increase from USD 3.87 billion in 2026 to USD 6.18 billion by 2035, registering a CAGR of 5.33% during 2026–2035. Demand comes from a population that trains every week in gyms, on football pitches and on running routes, and from shoppers who wear training clothes and sneakers as everyday dress. The Randstad held the largest regional share, 51.0% in 2025, because Amsterdam, Rotterdam, The Hague and Utrecht concentrate income, flagship stores and the European offices of the main brands, while East Netherlands is the fastest-growing region at 5.7% a year as new towns in Flevoland and Gelderland add young households. Online stores carry the largest share of sales, and brand-owned stores are expanding fastest. The most important regulatory change is the European ban on destroying unsold clothing and footwear, which applies to large companies from July 19, 2026, and pushes brands to plan stock more tightly.
Footwear and training clothes carry value, worn far beyond sport
The market counts performance apparel, casual sportswear, athletic footwear and sports accessories bought by Dutch consumers at retail prices. It covers clothes and shoes made for training and competition and the same ranges worn for leisure, whether bought from brand stores, sporting goods specialists, department and value chains or online retailers.
The count excludes sports equipment such as bicycles, rackets and fitness machines, team kit bought by clubs in bulk, and the large flow of goods that brands import into Dutch warehouses and ship on to other European countries. Value sits with the brands that design and market products and with the retailers that reach buyers online and in city centers.
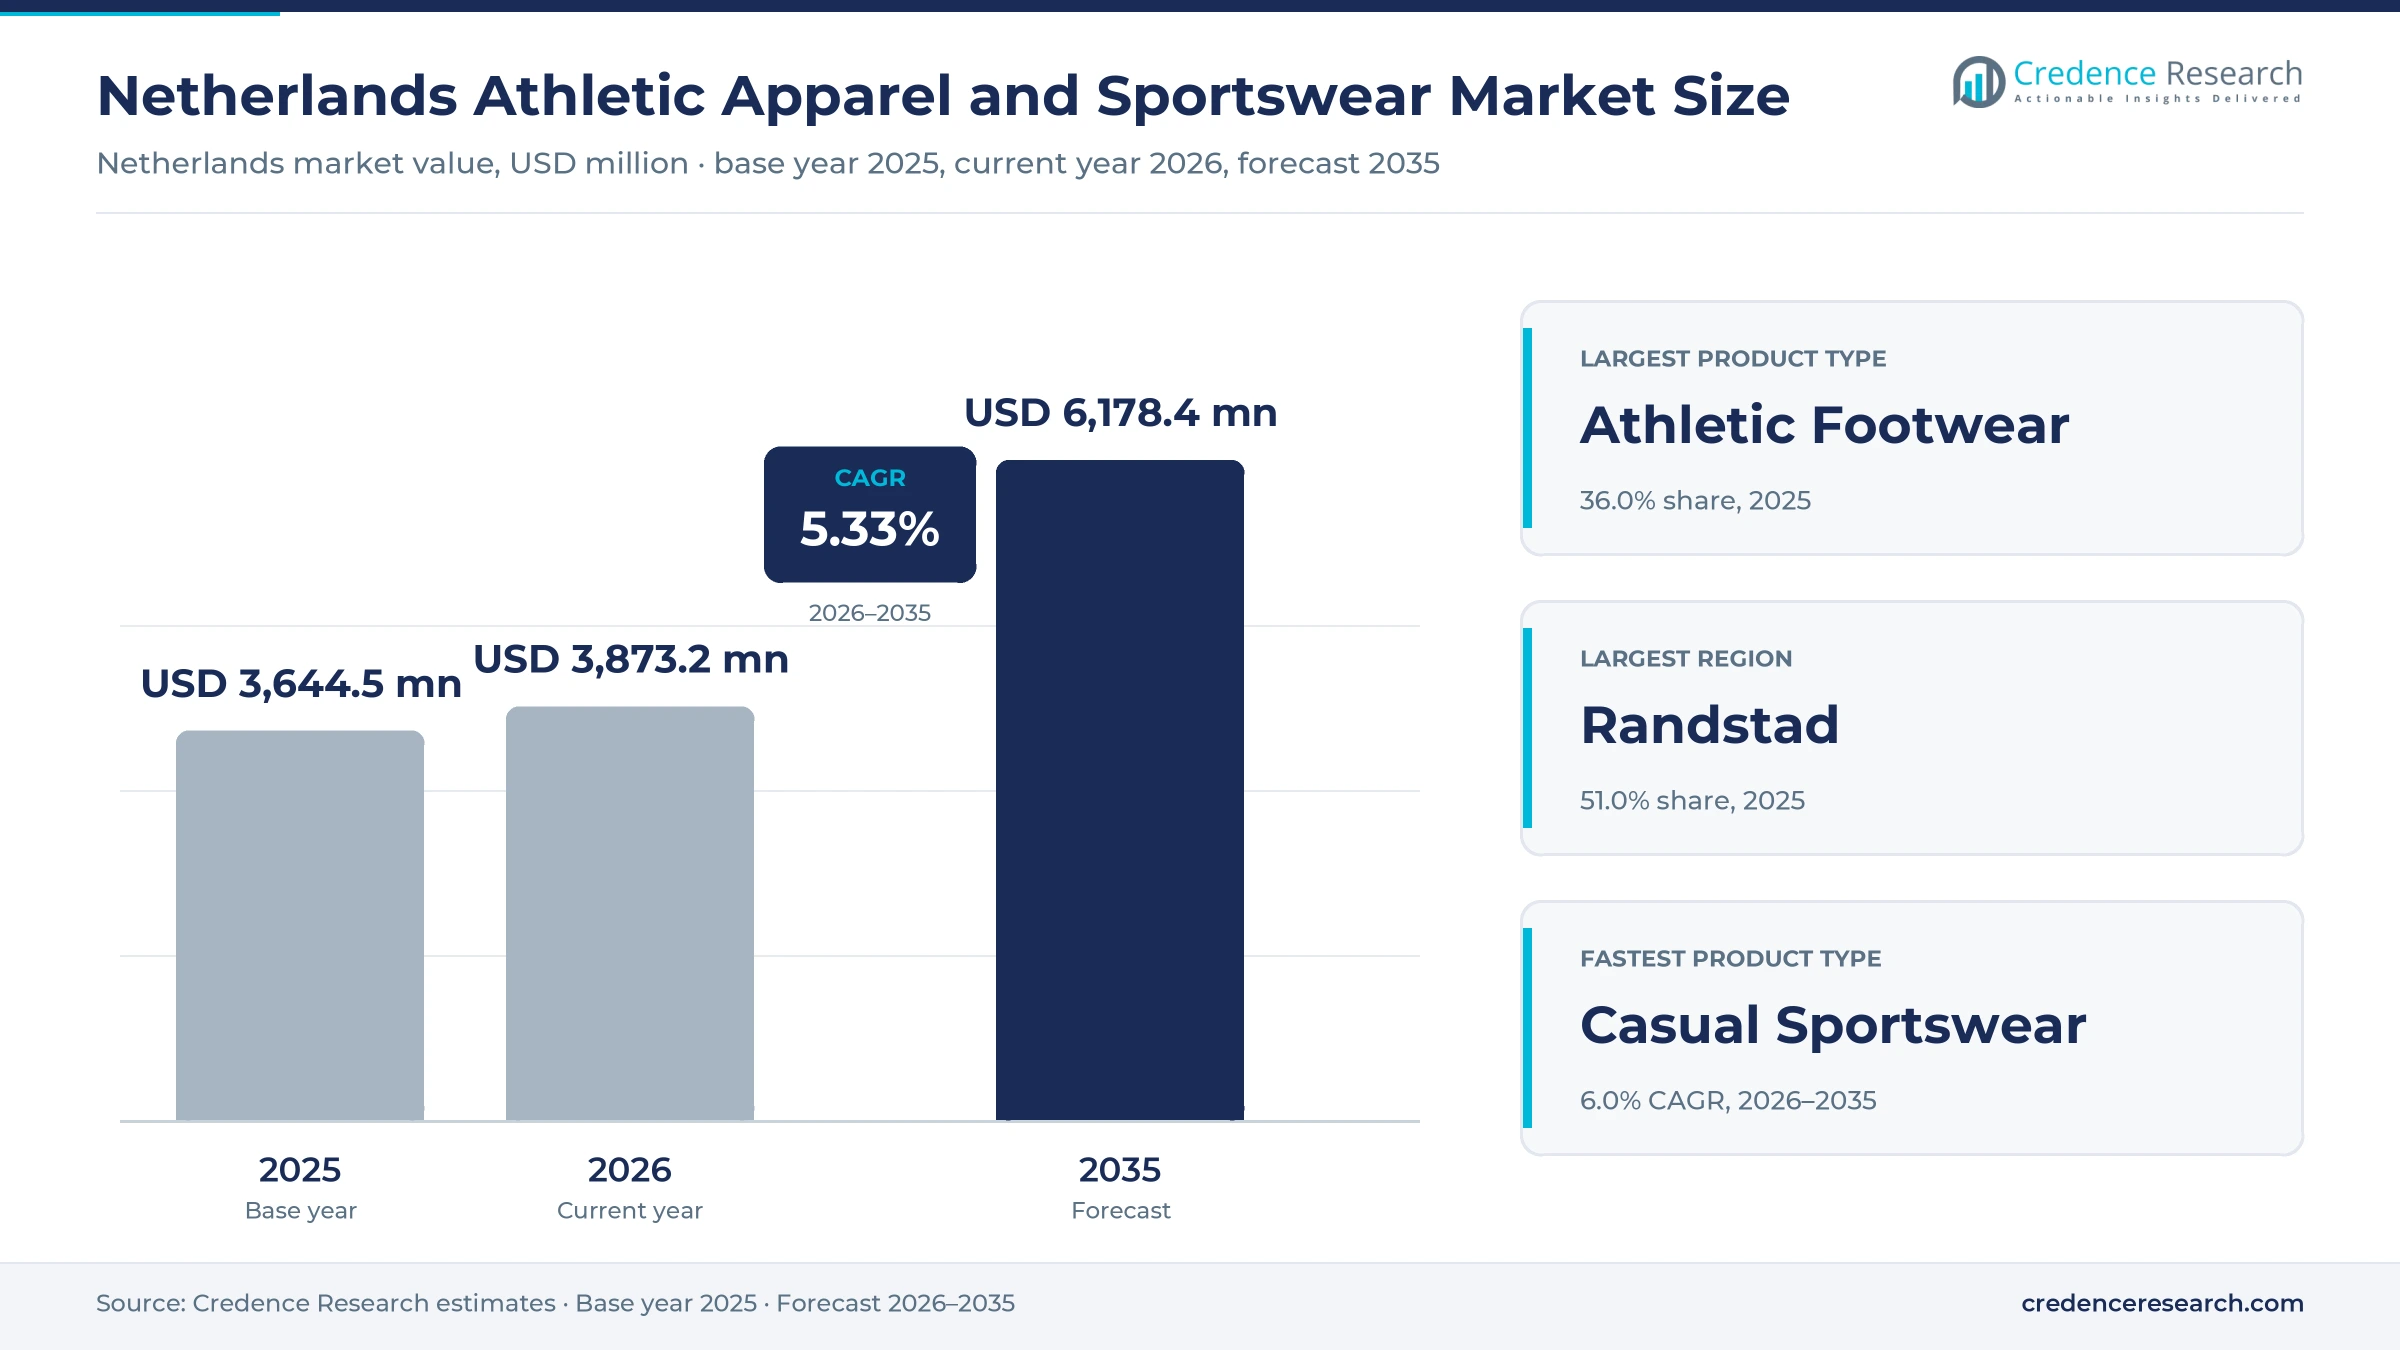
Netherlands Athletic Apparel and Sportswear Market Insights
- The Netherlands athletic apparel and sportswear market rises from USD 3.64 billion in 2025 to USD 6.18 billion by 2035, growing at 5.33% a year as training clothes become daily wear.
- The Randstad held a 51.0% share of 2025 value, while East Netherlands grows fastest at 5.7% a year on population growth in Flevoland and Gelderland.
- Athletic footwear held 36.0% of 2025 value because sneakers and running shoes sell to athletes and everyday buyers alike.
- Dutch textile producer responsibility rules have applied since July 1, 2023, and require half of the textile weight placed on the market to be reused or recycled from 2025.
- Nike, ASICS, New Balance and Under Armour run their European operations from Dutch head offices, while Gymshark and Lululemon have opened Amsterdam flagships.
Footwear leads while casual and women's ranges grow fastest
Footwear leads as casual sportswear grows fastest
Based on product type, the market is categorized into performance apparel, casual sportswear, athletic footwear and sports accessories. Athletic Footwear led with 36.0% of 2025 value because a pair of running shoes costs far more than a shirt, and Nike lists its Pegasus 41 road shoe at EUR 139.99 in its Dutch online store. Casual Sportswear grows fastest at 6.0% a year as brands merge sport and street ranges, and Adidas opened a store of about 850 square meters on Kalverstraat in Amsterdam in December 2022 that sells its sport and Originals lines together. Clothes bought for the gym now serve as weekend and office wear, which widens the occasions for each purchase.
Men lead spending while women's ranges gain pace
Based on end user, the market is categorized into men, women, children and teens, and unisex buyers. Men led with 45.0% of 2025 value because football remains a male-heavy club sport, with 21.3% of Dutch men playing it in 2024 against 5.1% of women, according to the CBS. Women grow fastest at 6.3% a year as 28.4% of women did fitness and 23.8% walked for sport in 2024, CBS data show. Brands that cut women's ranges for training and walking, not only for running, reach the larger share of active women.
Online leads as brand-owned stores grow fastest
Based on distribution channel, the market is categorized into brand-owned retail, sporting goods specialists, department and value retail, and online retail. Online Retail led with 35.0% of 2025 value because Dutch shoppers buy most of their shoes online, as the omnichannel data below show. Brand-Owned Retail grows fastest at 6.5% a year as Gymshark opened its first European store, a three-story site of more than 1,000 square meters on Kalverstraat in Amsterdam, on June 21, 2025. Own stores let brands control price, stock and customer data that wholesale partners keep.
Mass market leads as premium grows fastest
Based on price tier, the market is categorized into premium, upper mid-range, mass market and value and discount products. Mass Market led with 32.0% of 2025 value because school sport, club football and casual fitness buyers replace kit often and buy on promotion. Premium products grow fastest at 6.1% a year as Zalando reported in September 2025 that running footwear priced above EUR 100 rose from about 35% of its running category in 2021 to more than 70%. Serious runners trade up even when general clothing spending is flat, which supports brand margins.
| Segment Group | Leading Sub-segment | Share, 2025 | Fastest-growing Sub-segment | CAGR, 2026–2035 |
|---|---|---|---|---|
| By Product Type | Athletic Footwear | 36.0% | Casual Sportswear | 6.0% |
| By End User | Men | 45.0% | Women | 6.3% |
| By Distribution Channel | Online Retail | 35.0% | Brand-Owned Retail | 6.5% |
| By Price Tier | Mass Market | 32.0% | Premium | 6.1% |
Running shoes and leggings set the price ceiling
Pricing in Dutch sportswear follows brand tiers more than material cost. Global brands set suggested retail prices for running shoes and leggings, and they hold them through their own stores and sites while marketplaces and outlets clear older colors at a discount. Own-label ranges from sporting goods chains anchor the low end, and low-cost cross-border platforms add pressure on basics. Footwear carries the highest ticket, so its mix shift toward shoes above EUR 100 lifts average selling prices even in years of flat volume. For brands, the margin sits in full-price direct sales, and for retailers, in the sale of accessories with each pair.
| Product or offer | Typical price or fee | Basis |
|---|---|---|
| Nike Pegasus 41 road running shoe | EUR 139.99 suggested retail | Nike Dutch online store, November 2026 |
| Lululemon Align high-rise legging, 63 cm | EUR 98.00 | Zalando Netherlands listing, November 2026 |
| Running footwear sold on Zalando | More than 70% of category sales above EUR 100 | Zalando, September 2025 |
| Own-label training T-shirts and shorts | About EUR 5 to EUR 20 per item | Credence Research estimate from Dutch retailer listings |
Request a Free Sample
Fill in your details and we'll send you a free sample report.
- Sample data tables & charts
- Research methodology
Weekly training, online buying and athleisure lift sales
High weekly sports participation keeps kit in use
A large weekly sporting population wears out shoes and training clothes on a regular cycle. NOC*NSF found that 60.2% of people aged 5 to 80 played sport every week in 2024, about 9.8 million people, and fitness was the most practiced sport in the country. The CBS found that 30.2% of people aged six and older did fitness in 2024, up from 25.7% in 2014, which favors leggings, training tops and gym shoes. The KNVB reported a record football membership on Nov. 21, 2025, the fourth year of growth in a row. Weekly use means steady replacement demand, so participation keeps footwear and training wear selling even when consumer confidence dips.
Omnichannel buying moves shoes and kit online
Dutch shoppers move easily between stores and screens, and sportswear sales follow them. ABN AMRO reported in February 2026 that more than a third of Dutch clothing spending happens online, and the online share for shoes reaches 57%. The CBS found that online-only web shops raised sales 6.4% in the fourth quarter of 2025, ahead of 4.9% for multichannel retailers. Zalando said in September 2025 that more than 85% of its customers are active in sports every week, which explains its push into running and cycling. Online retail held a 35.0% share of 2025 value, so stock depth, fast delivery and free returns decide which brands win the basket.
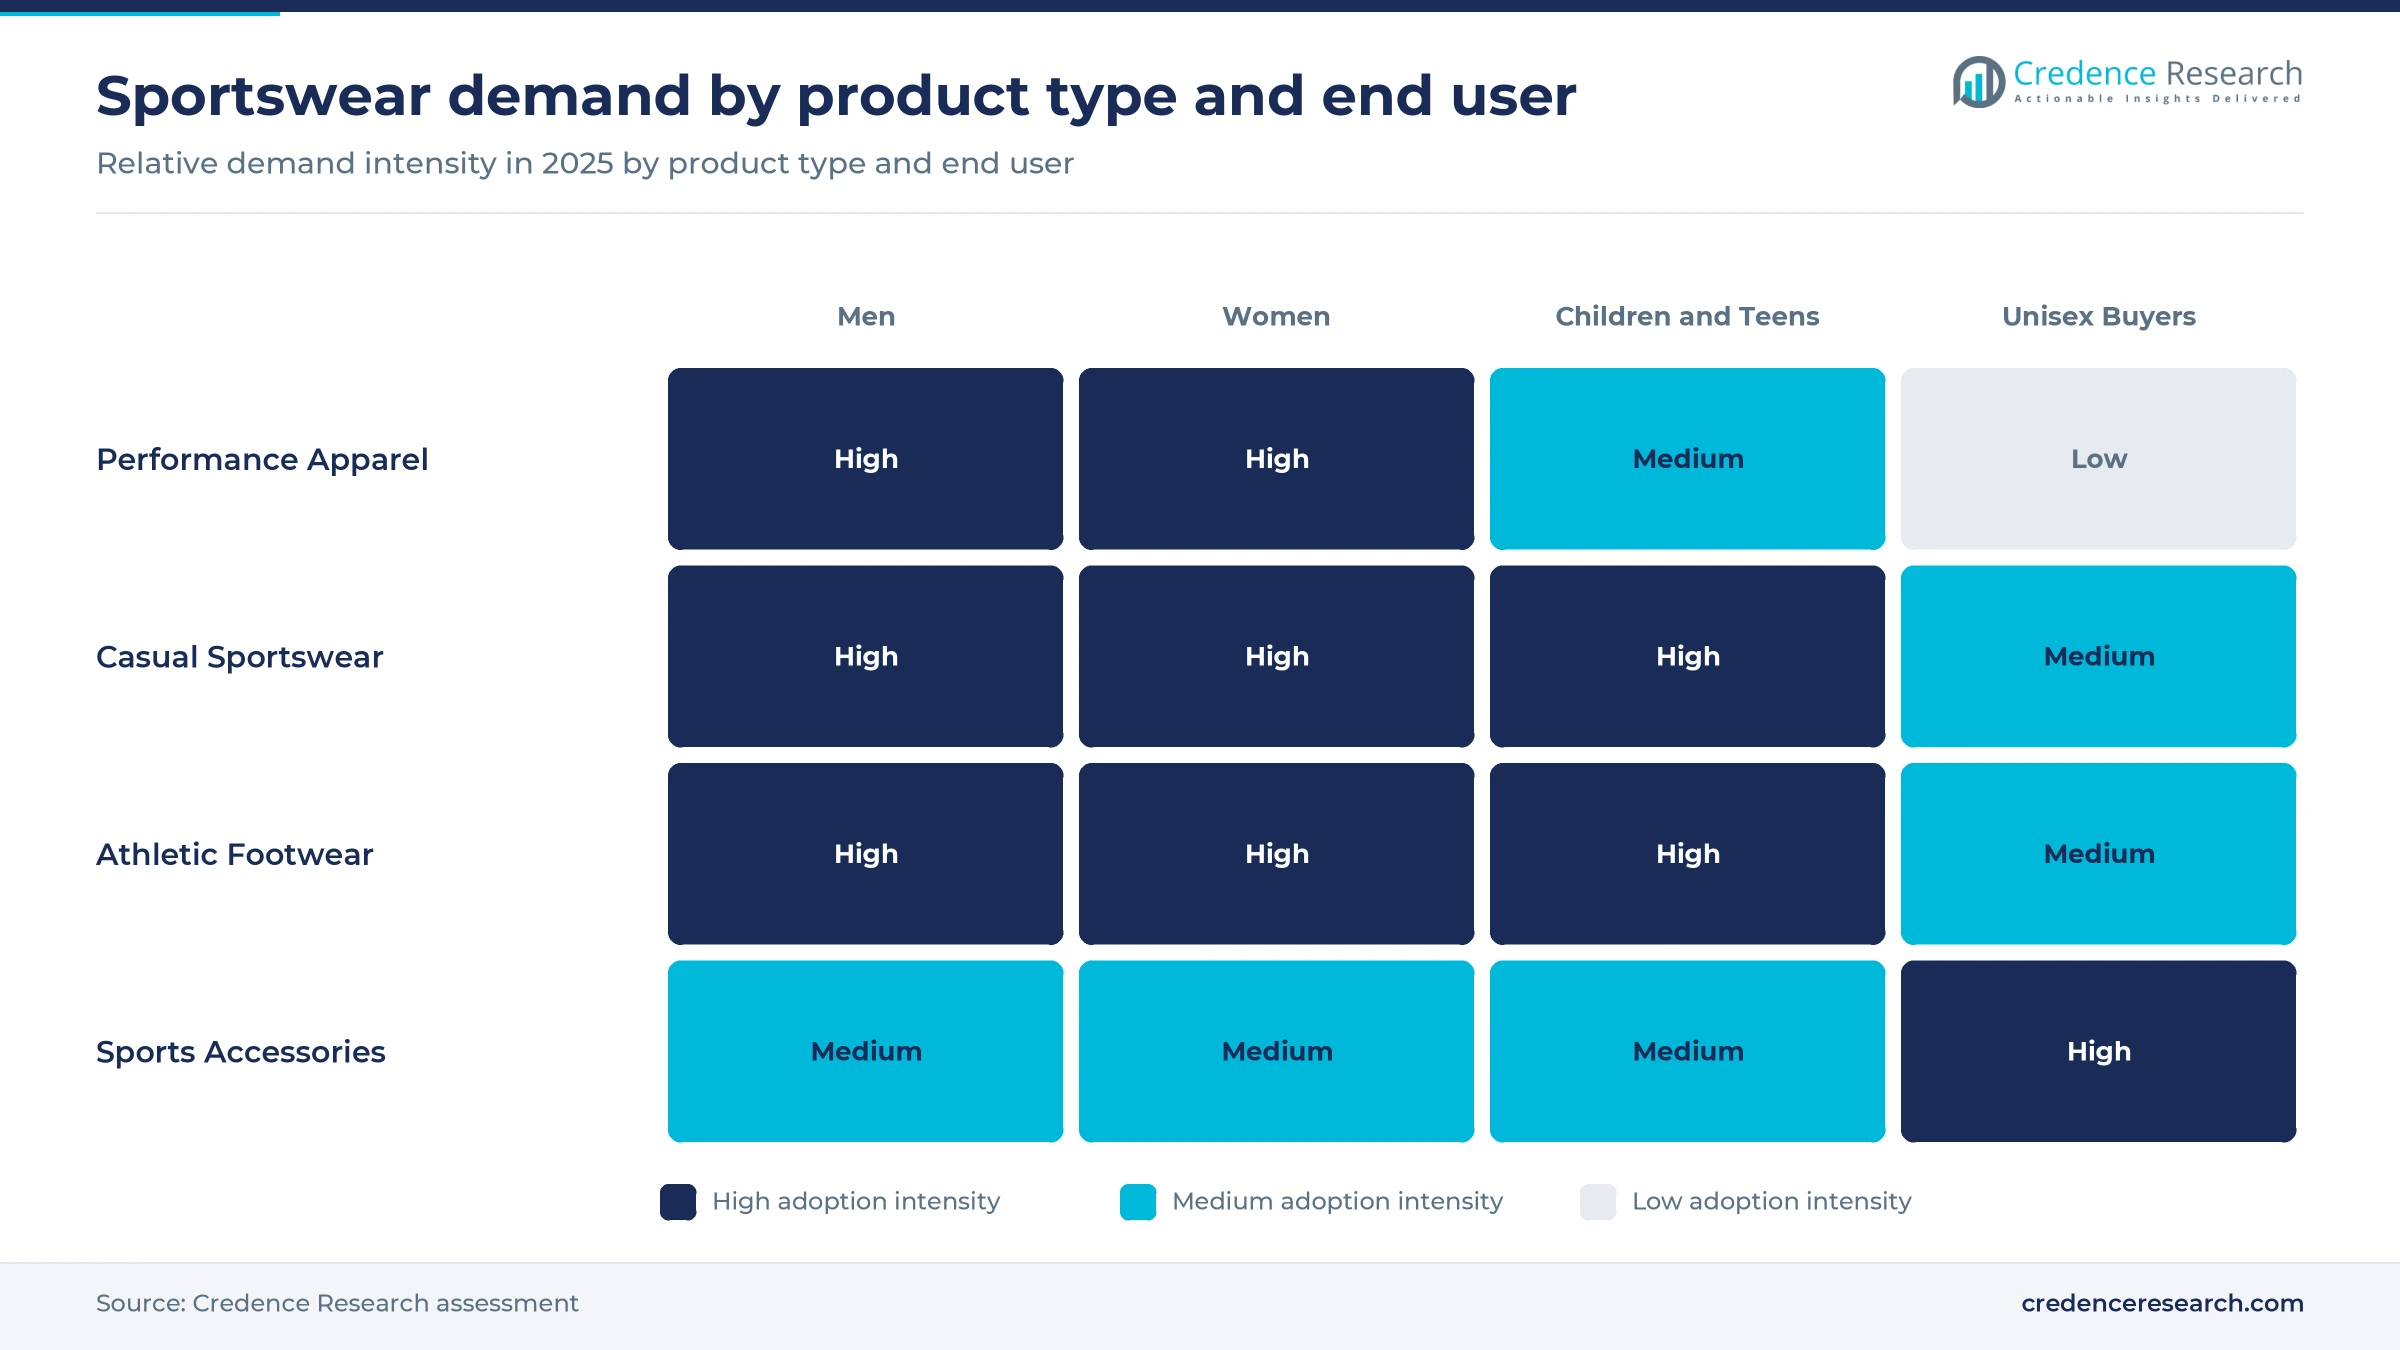
Athleisure and performance convergence widens use
Clothes designed for training now serve as everyday dress, which widens the number of occasions for each purchase. The national wardrobe audit of November 2025 counted about 15 sportswear pieces in the average man's wardrobe and found that 61% of people aged 15 to 24 spend more than EUR 100 on clothing every three months. Gymshark has cited an estimated 17% gym membership rate among the Dutch, one of the highest in Europe. Both figures point to training clothes that are bought for the gym and then worn through the rest of the week. Casual sportswear grows at 6.0% a year, the fastest product rate, as athleisure becomes standard workwear.
Mass running events lift performance footwear
Big city races create a fixed annual calendar of training and kit buying. The TCS Amsterdam Marathon reported a record 22,500 starters for its October 2024 marathon, and more than half of all participants came from abroad. NOS reported in April 2026 that the Rotterdam Marathon starts 18,000 runners, while nearly 32,000 applicants missed out in the ballot. Race training plans run for months and call for at least one pair of running shoes per runner. Visitors from abroad also buy kit at expos and city stores, which lifts sales in the Randstad around race weekends.
Circular rules and low-cost platforms reshape the offer
A shift to circular compliance under textile producer rules
Producer responsibility turns end-of-life clothing into a cost that brands must plan for. The Human Environment and Transport Inspectorate says textile producer responsibility has applied since July 1, 2023, and covers consumer clothing, workwear and household textiles. From 2025, half of the textile weight placed on the market must go to reuse or recycling, and a quarter of the recycled share must be fiber-to-fiber. By 2030, the target rises to three quarters, with 15% reused inside the Netherlands. Brands that design single-fiber garments and fund collection early lower their compliance fees, which favors suppliers of textile recycling and recycled polyester.
The rise of low-cost cross-border platforms in basics
Chinese marketplaces are taking a growing slice of online clothing volume, mostly in basic and low-price items. ABN AMRO found that China's share of Dutch online clothing spending rose from 2% in 2021 to almost 5% in 2025, and its share by volume rose from 4% to more than 9%. Dutch sellers held 82% of online clothing spending in 2025, down from 87% in 2022. The Dutch Payments Association reported in March 2026 that China accounted for 31% of all cross-border online purchases. Value and discount products grow above the mass market tier, so mass-market brands face price pressure from both sides.
Padel growth offers an opening in racket wear and shoes
A fast-growing racket sport creates demand for court shoes, skirts, shorts and grips that general running ranges do not cover. EY and the KNLTB reported in March 2026 that 876,000 people played padel in the Netherlands in 2025. The number of courts rose 25% and the number of providers rose 15% in a year, with North Holland adding 114 new courts. Commercial padel centers average about 5.7 courts per site, so they double as shops for accessories and shoes. EY found that 98% of players expect to still be playing in three years, which points to repeat kit purchases rather than a passing fad. Brands and specialists that stock padel ranges early can win a new player base before it settles on brands.
Women's football and fitness offer an opening in fit
Women are the fastest-growing buyer group, and many still struggle to find kit cut for them. The KNVB counted 180,418 female members in November 2025, a base that needs boots, shin guards and training wear sized for women. Lululemon leases about 670 square meters on Leidsestraat in Amsterdam, of which 500 square meters is sales space, CBRE reported, which gives the brand room for its full women's training range. Women grow at 6.3% a year, the fastest end-user rate. Brands that build women's lasts for football boots and extend sizes in training wear can win loyal buyers in a segment still served by unisex products.
Retail failures, stock rules and import exposure weigh
Specialist chain failures leave gaps on the high street
The collapse of a large specialist group showed how thin the margins of multi-brand sports stores can be. JD Sports' Dutch subsidiary Sports Unlimited Retail went bankrupt in December 2023 with 54 Perry Sport, Aktiesport and Sprinter stores, and the last six closed on March 12, 2024, FashionUnited reported. Frasers Group was reported to be taking up to 20 sites, so fewer than half of the 54 stores were set to return as sports outlets. Brands lost shelf space outside the big cities, so they must rely more on their own stores and online channels.
The ban on destroying unsold stock raises inventory risk
Overstock can no longer be shredded or burned, so forecasting errors now carry a direct cost. The European Commission says the ban on destroying unsold apparel, accessories and footwear applies to large companies from July 19, 2026, with medium-sized firms expected to follow in 2030. It estimates that 4% to 9% of unsold textiles in Europe are destroyed before being worn. Brands must resell, donate or recycle surplus, which favors outlet and resale channels.
Heavy import dependence exposes costs to freight and currency
Almost all sportswear sold in the country is made abroad, so landed costs move with freight rates and the dollar. The CBS found that only 18% of the supply of sports goods was produced in the Netherlands in 2022, and imports of sports clothing reached EUR 1,540 million. Re-exports of sports clothing were EUR 1,370 million, which shows the role of Dutch warehouses in European distribution. Brands that buy in dollars face margin swings when the euro weakens.
Rising entry fees and falling running rates cap demand
The cost of taking part in organized running is rising while casual running declines. NOS reported that the Rotterdam Marathon entry fee rose from EUR 110 in 2024 to EUR 150 in 2025 and EUR 155 in 2026, about 41% in two years. The CBS found that 15.7% of people aged six and older ran or jogged in 2024, down from 20.2% in 2014. Higher costs push occasional runners toward cheaper sports, which slows demand for performance running kit.
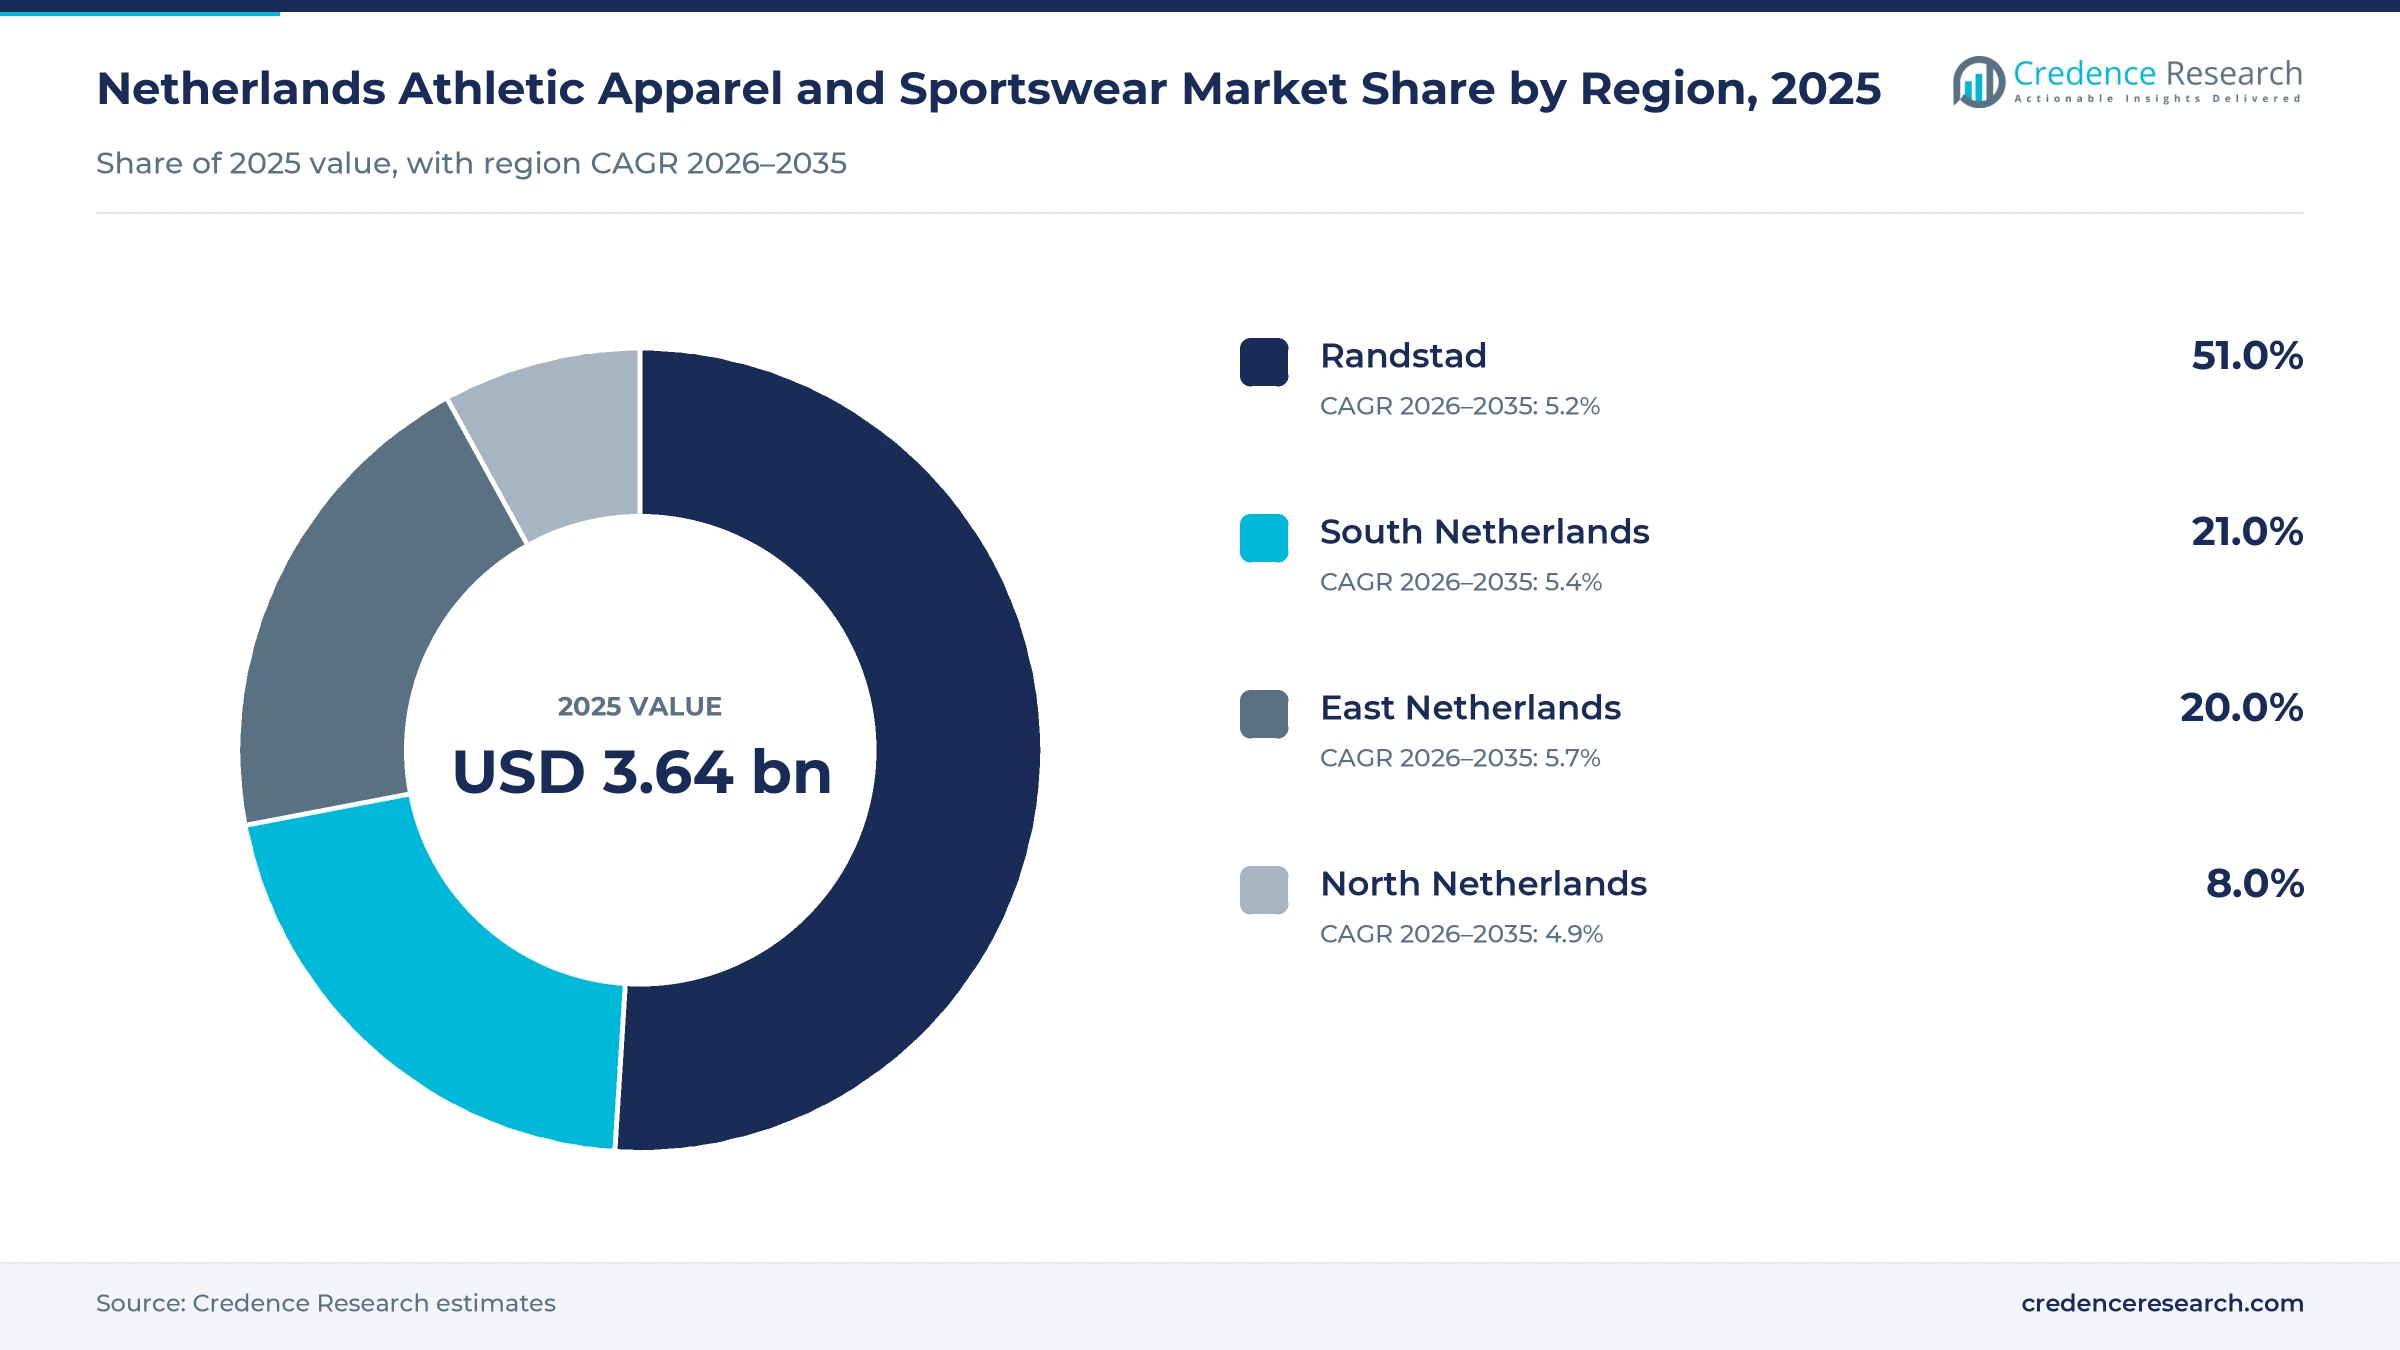
The Randstad leads as the East grows fastest
| Region | Value, 2025 (USD billion) | Share, 2025 | CAGR, 2026–2035 |
|---|---|---|---|
| Randstad | 1.86 | 51.0% | 5.2% |
| South Netherlands | 0.77 | 21.0% | 5.4% |
| East Netherlands | 0.73 | 20.0% | 5.7% |
| North Netherlands | 0.29 | 8.0% | 4.9% |
The Randstad leads on flagship stores and brand offices
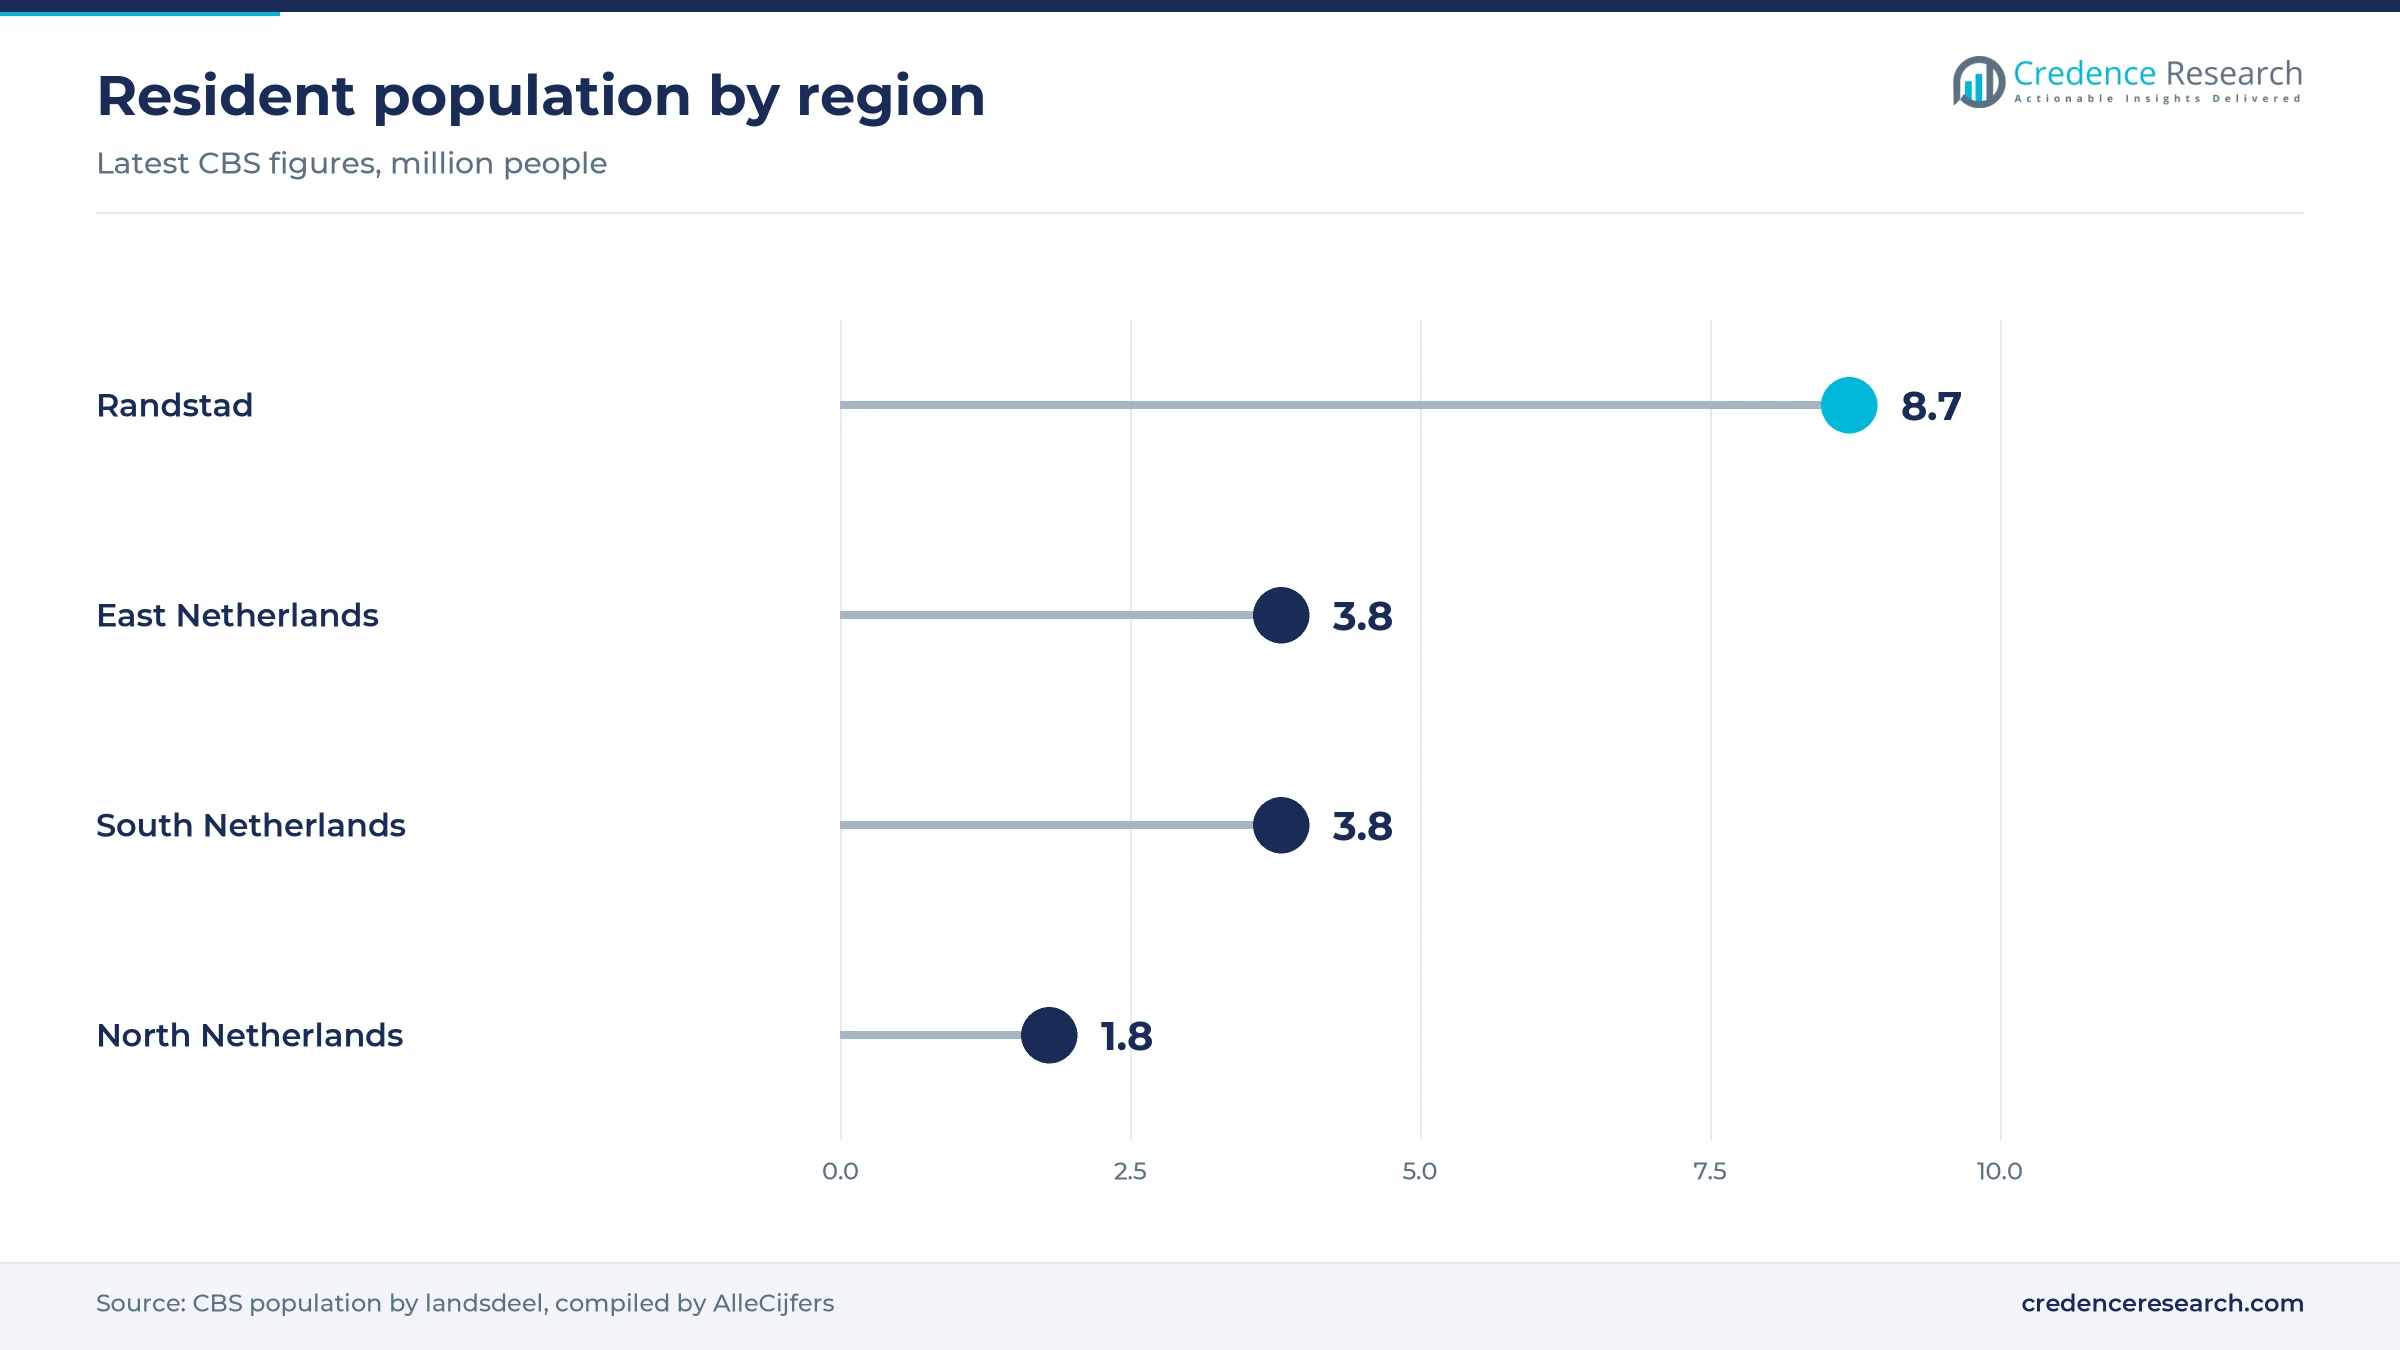
The Randstad held a 51.0% share of 2025 value and grows at 5.2% a year, slightly below the national rate. The western provinces of Utrecht, North Holland, South Holland and Zeeland count about 8.7 million residents, close to half of the national population, CBS figures show. Kalverstraat in Amsterdam draws more than nine million visitors a year, which is why the brand flagships noted above sit there. The region already has dense store coverage, so its growth comes from premium upgrades rather than new buyers.
South Netherlands combines club sport with cross-border shopping
South Netherlands held a 21.0% share of 2025 value and grows at 5.4% a year, close to the national rate. North Brabant and Limburg count about 3.8 million residents, according to CBS figures. The region combines large cities such as Eindhoven and Tilburg with dense networks of village clubs. Club football in Brabant and Limburg towns supports steady demand for football boots, team wear and children's kit, which favors specialists and value chains over flagships. Growth tracks the national rate because demand here is broad rather than concentrated in a few premium shopping streets.
East Netherlands grows fastest on new households
East Netherlands held a 20.0% share of 2025 value and grows at 5.7% a year, the fastest regional CAGR. Overijssel, Flevoland and Gelderland count about 3.8 million residents, CBS figures show. Flevoland towns such as Almere add young families who commute to the Randstad and buy children's and fitness kit close to home. Retail parks and online delivery serve much of this demand, so value chains and web shops gain the most from regional growth.
North Netherlands grows slowly from a dispersed base
North Netherlands held an 8.0% share of 2025 value and grows at 4.9% a year, the slowest regional rate. Groningen, Friesland and Drenthe count about 1.8 million residents, under a tenth of the national population, CBS figures show. The city of Groningen accounts for much of the regional demand for fitness and casual wear, as students train in gyms and campus sports centers. Dispersed rural demand depends on online delivery and on a few retail parks, which keeps brand store openings rare.
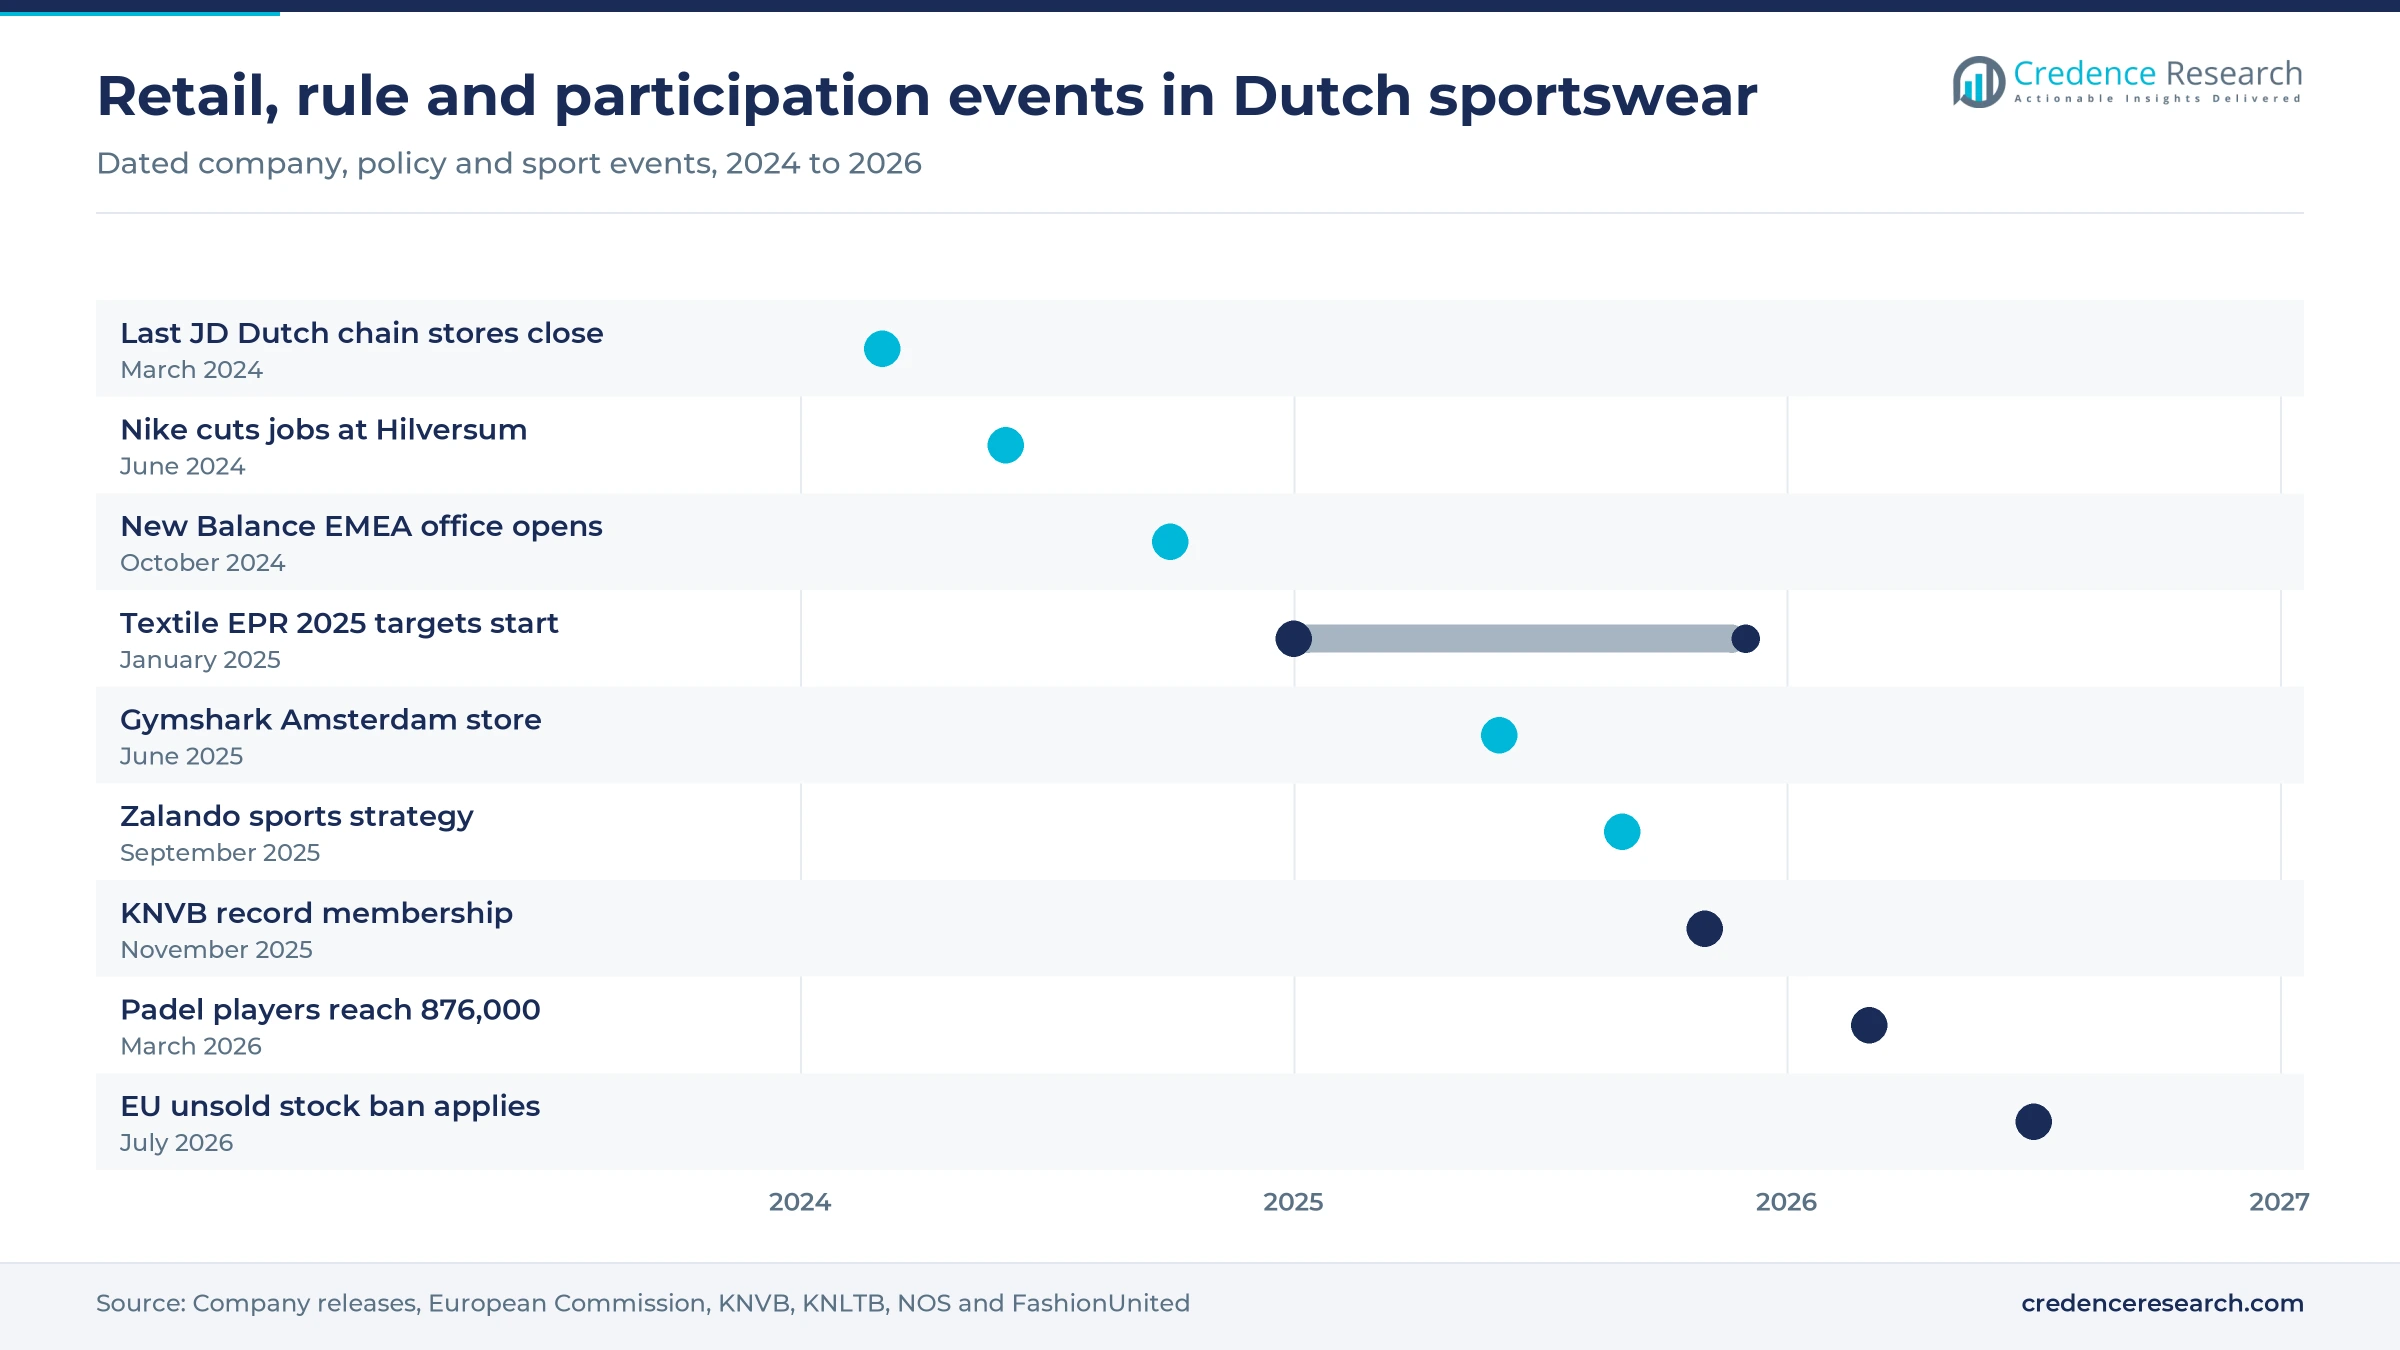
Store openings, closures and head office moves, 2024 to 2026
| Development | Status and market relevance |
|---|---|
| In March 2024, the last Perry Sport, Aktiesport and Sprinter stores of JD Sports' bankrupt Dutch unit closed. | Closed; specialist shelf space lost |
| In June 2024, Nike announced job cuts at its European headquarters in Hilversum. | Cost program; European operations |
| In October 2024, New Balance officially opened its new EMEA headquarters in Amsterdam. | Opened; regional head office |
| In June 2025, Gymshark opened its first European store on Kalverstraat in Amsterdam. | Opened; brand-owned flagship |
| In September 2025, Zalando set out its plan to become Europe's go-to destination for sports. | Strategy; running and cycling focus |
Synthetic blends dominate as recycled fibers gain ground
- Polyester and synthetic fabrics wick sweat and dry fast, so they dominate running shirts, football jerseys and training tops sold by every major brand in the country.
- Cotton remains the base of hoodies, joggers and lifestyle T-shirts, where comfort and a casual look count more than moisture control during hard training.
- Nylon and elastane give leggings, sports bras and compression wear their stretch and recovery, which suits fitness, yoga and padel buyers who move in every direction.
- Recycled and blended materials reuse plastic bottles and post-consumer garments as fiber, which helps brands meet the Dutch reuse and recycling targets, although blends remain hard to recycle fiber to fiber.
Need a Custom Version of This Report?
Tailor the scope, geography, or segments to your exact requirements.
- Custom geography or segment scope
- Direct access to our analyst team
Global brands run Europe from Dutch head offices
Competition in Dutch sportswear turns on brand heat, product fit and direct access to buyers. Nike and Adidas lead in footwear and football, and both sell through their own stores and sites as well as through marketplaces. ASICS and New Balance compete in running and lifestyle shoes, while Puma adds outlet and city stores. Lululemon and Gymshark target fitness buyers with premium and mid-priced ranges sold mainly through their own channels. Decathlon competes on price with own labels and large stores. Under Armour sells training wear through retail partners and its own site. Online platforms such as Zalando set much of the price and delivery standard, so every brand needs strong stock depth, fast delivery and simple returns to keep its share.
Global brands, European offices and thin specialist margins
The supply side is led by a small group of global brands with large design and marketing budgets. Nike, ASICS, New Balance and Under Armour all run their European business from the Netherlands, so Dutch prices and launches are set close to the brands' own planning teams. Brands hold the design, marketing and pricing power, while multi-brand specialists compete on thin margins against brand stores and web shops. Concentration is high in footwear and lower in training clothes, where own labels and fitness brands compete.
Sportswear brands and their Dutch roles
| Company | Type | Role in the market |
|---|---|---|
| Nike | Global brand | European headquarters in Hilversum; Pegasus running shoes sold through its Dutch store |
| Adidas | Global brand | Combined sport and Originals store of about 850 square meters on Kalverstraat |
| Puma | Global brand | Fifth Dutch outlet store at Overvecht shopping center in Utrecht |
| ASICS | Running brand | EMEA head office in Hoofddorp |
| New Balance | Running and lifestyle brand | EMEA headquarters in Amsterdam, opened in October 2024 |
| Under Armour | Training brand | EMEA headquarters in Amsterdam |
| Lululemon | Premium fitness brand | Flagship store on Leidsestraat in Amsterdam |
| Gymshark | Fitness brand | First European store on Kalverstraat in Amsterdam, opened in June 2025 |
| Decathlon | Sports retailer and own-label maker | Large-format stores and own-label ranges sold across the country |
Brand stores and circular compliance decide the next phase
Credence Research's view is that Dutch sportswear will grow on use, not on new buyers, since most of the population already trains every week. Value will move toward premium footwear, women's ranges and brand-owned stores, while multi-brand specialists and basic training wear face pressure from web shops and low-cost platforms. Circular rules are the main new cost, and brands that design for recycling and resell surplus stock will carry lower compliance costs. Padel and women's football are the clearest openings for brands with ranges built for them.
Values built from clothing spend, wardrobe mix and prices
The report uses 2025 as the base year and forecasts to 2035. Market values come from the Credence Research model, built from household clothing and footwear spending, the share of sportswear in Dutch wardrobes and average selling prices by product type. The scope is wider than sport-use clothing alone, since the CBS put Dutch household spending on sports clothing at EUR 990 million in 2022, while this estimate also counts athletic footwear, sneakers and casual sportswear worn as everyday dress, which takes the 2025 value to about EUR 3.2 billion. Regional, segment and channel splits are Credence Research estimates built from public inputs. Inputs include CBS sport participation, retail and sport economy statistics, NOC*NSF participation data, government and European Commission rules on textiles, bank sector studies, company releases and published retail prices. No interviews or primary surveys were conducted for this report.
Premium footwear and women's ranges gain share to 2035
The Netherlands athletic apparel and sportswear market is set to reach USD 6.18 billion by 2035, as weekly training, premium running shoes and casual sportswear keep spending rising. Growth will be strongest in casual sportswear, women's ranges, brand-owned stores and East Netherlands, while multi-brand specialists lose share. The main variables are how fast padel and women's football grow, how far low-cost platforms take volume in basics, and how much the circular rules and the stock destruction ban add to brand costs.
Participation, prices and platforms decide the range
The range of outcomes depends on whether weekly participation keeps rising, how far buyers keep trading up in footwear and how much volume low-cost platforms take in basics. Wider padel and women's football programs would lift demand above the base. A weaker consumer, higher import costs and stricter stock rules would squeeze brands that rely on wholesale and discounting.
| Scenario | CAGR, 2026–2035 | Value, 2035 | What has to hold |
|---|---|---|---|
| Downside | 3.8% | USD 5.43 billion | Flat participation, weaker euro and faster share gains by low-cost cross-border platforms |
| Base | 5.33% | USD 6.18 billion | Steady weekly sport, gradual premium trading up and orderly circular compliance |
| Upside | 6.5% | USD 6.84 billion | Fast padel and women's football growth plus wider brand store expansion |
Frequently Asked Questions
How big is the Netherlands athletic apparel and sportswear market?
Which product type leads Dutch sportswear spending?
Which region leads demand in the Netherlands?
How many Dutch people play sport every week?
How much sportswear do Dutch shoppers buy online?
What do textile producer rules require from sportswear brands?
Who are the main sportswear suppliers in the Netherlands?
What could slow the Netherlands athletic apparel and sportswear market?
Table of Content
Chapter 1 Market Segmentation
- 1.1 Segmentation Framework
- 1.1.1 Product and Service Classification
- 1.1.2 Application and End-Use Classification
- 1.1.3 Technology and Solution Classification
- 1.1.4 Customer and Distribution Channel Classification
- 1.1.5 Geographic Segmentation
- 1.1.6 Market Segment Definitions and Boundaries
- 1.2 By Product Type
- 1.2.1 Performance Apparel
- 1.2.2 Casual Sportswear
- 1.2.3 Athletic Footwear
- 1.2.4 Sports Accessories
- 1.3 By End User
- 1.3.1 Men
- 1.3.2 Women
- 1.3.3 Children and Teens
- 1.3.4 Unisex Buyers
- 1.4 By Price Tier
- 1.4.1 Premium
- 1.4.2 Upper Mid-Range
- 1.4.3 Mass Market
- 1.4.4 Value and Discount
Chapter 2 Introduction
- 2.1 Report Objectives and Scope
- 2.2 Product Definition and Industry Terminology
- 2.3 Market Inclusions and Exclusions
- 2.4 Research Process
- 2.4.1 Primary Research and Expert Interviews
- 2.4.2 Secondary Research and Source Review
- 2.4.3 Top-Down and Bottom-Up Estimation
- 2.4.4 Data Triangulation and Verification
- 2.5 Market Size Measurement Basis
- 2.5.1 2025: USD 3.64 billion → 2035: USD 6.18 billion
- 2.6 Historical and Forecast Reference Periods
- 2.6.1 Historical Period: 2018-2025
- 2.6.2 Base Year: 2025
- 2.6.3 Forecast Period: 2025-2035
- 2.7 Research Assumptions and Limitations
Chapter 3 Executive Summary
- 3.1 Market Snapshot and Key Findings
- 3.2 Base-Year Market Size, 2025
- 3.3 Forecast Market Size, 2035
- 3.4 Revenue and Volume Growth Outlook
- 3.5 Key Demand and Supply Indicators
- 3.6 Leading Market Segments
- 3.7 Fastest-Growing Market Opportunities
- 3.8 Regional Performance Highlights
- 3.9 Technology and Industry Transformation
- 3.10 Competitive Landscape Summary
- 3.11 Analyst View and Strategic Implications
Chapter 4 Netherlands Athletic Apparel and Sportswear Market Trends and Developments
- 4.1 Historical Industry Development, 2018-2025
- 4.2 Recent Market Trends and Developments
- 4.3 Demand and Customer Behavior Trends
- 4.4 Technology and Product Innovation
- 4.5 Artificial Intelligence, Automation and Digitalization
- 4.6 Local Manufacturing and Supply Chain Realignment
- 4.7 Industry Partnerships, Mergers and Acquisitions
- 4.8 Sustainability and Circular Economy Developments
- 4.9 Government and Private Sector Investment Trends
- 4.10 Emerging Business Models and Commercialization
- 4.11 Industry Developments and Announcements
Chapter 5 Netherlands Athletic Apparel and Sportswear Market Production, Supply and Demand Analysis
- 5.1 Demand Trend and Consumption Analysis, 2018-2025
- 5.2 Demand Forecast, 2025-2035
- 5.3 Production and Output Trend, 2018-2025
- 5.4 Production and Output Forecast, 2025-2035
- 5.5 Installed Capacity and Capacity Utilization
- 5.6 Company-Wise Production Plants and Statistics
- 5.6.1 Installed Production Capacity
- 5.6.2 Actual Production
- 5.6.3 Planned Capacity and Expansion Targets
- 5.7 Supply Chain Structure and Procurement Trends
- 5.8 Supply-Demand Gap and Bottlenecks
- 5.9 Import Dependence and Sourcing Structure
- 5.10 Contract Manufacturing and Outsourcing
- 5.11 Regional Supply and Demand Concentration
Chapter 6 Netherlands Athletic Apparel and Sportswear Market Pricing Analysis
- 6.1 Pricing Structure and Measurement
- 6.2 Historical Pricing Trends, 2018-2025
- 6.3 Pricing Outlook, 2025-2035
- 6.4 Average Selling Price and Unit Economics
- 6.5 Pricing by Product and Market Segment
- 6.6 Geographic Pricing Differences
- 6.7 Key Input, Energy, Labor and Logistics Costs
- 6.8 Contract Pricing and Purchasing Models
- 6.9 Pricing Sensitivity and Competitive Positioning
- 6.10 Price, Margin and Profitability Implications
Chapter 7 Netherlands Athletic Apparel and Sportswear Market Dynamics
- 7.1 Market Growth Drivers
- 7.1.1 Demand-Side Drivers
- 7.1.2 Technology and Innovation Drivers
- 7.1.3 Infrastructure and Investment Drivers
- 7.1.4 Regulatory and Policy Drivers
- 7.2 Market Restraints
- 7.2.1 Cost and Affordability Constraints
- 7.2.2 Technology and Adoption Barriers
- 7.2.3 Supply Chain and Operational Constraints
- 7.3 Market Challenges
- 7.3.1 Competitive Pressure and Margin Erosion
- 7.3.2 Skills, Infrastructure and Implementation Gaps
- 7.4 Emerging Market Opportunities
- 7.5 Market Dynamics Impact and Time-Horizon Assessment
Chapter 8 Netherlands Athletic Apparel and Sportswear Value Chain Analysis
- 8.1 Industry Value Chain Overview
- 8.2 Upstream Suppliers and Critical Inputs
- 8.3 Technology and Component Providers
- 8.4 Manufacturing or Service Delivery
- 8.5 Distribution, Channel Partners and Integrators
- 8.6 Downstream Applications and End Users
- 8.7 Value Addition and Profit Pools
- 8.8 Vertical Integration and Outsourcing
- 8.9 Supplier Concentration and Risk
- 8.10 Supply Chain Localization and Resilience
Chapter 9 Netherlands Athletic Apparel and Sportswear Market Regulations and Policies
- 9.1 Relevant Laws, Standards and Compliance Frameworks
- 9.2 Product, Service, Safety and Quality Requirements
- 9.3 Government Policies, Incentives and Subsidies
- 9.4 Imports, Exports and Trade Barriers
- 9.5 Public Procurement and Local Content Requirements
- 9.6 Environmental and Sustainability Compliance
- 9.7 Upcoming Policy Changes and Market Implications
Chapter 10 Netherlands Athletic Apparel and Sportswear Market Hotspots and Opportunities
- 10.1 Market Opportunity Mapping and Growth Hotspots
- 10.2 High-Growth Applications and Customer Groups
- 10.3 Underserved Markets and White-Space Opportunities
- 10.4 Emerging Technology and Product Opportunities
- 10.5 New Capacity and Investment Hotspots
- 10.6 Market Entry and Expansion Opportunities
- 10.7 Distribution and Partnership Opportunities
- 10.8 Near-Term and Long-Term Commercial Potential
- 10.9 Opportunity Attractiveness and Execution Risks
Chapter 11 Netherlands Athletic Apparel and Sportswear Market Outlook, 2025-2035
- 11.1 Market Size and Analysis
- 11.1.1 Revenue (Market Measurement: 2025: USD 3.64 billion → 2035: USD 6.18 billion)
- 11.1.2 Market Volume and Quantity Sold
- 11.1.3 Historical Market Size, 2018-2025
- 11.1.4 Base-Year Market Size, 2025
- 11.2 Market Forecast, 2025-2035
- 11.2.1 Revenue Forecast to 2035
- 11.2.2 Volume Forecast to 2035
- 11.2.3 CAGR and Year-on-Year Growth
- 11.2.4 Incremental Revenue Opportunity
- 11.3 Forecast Assumptions and Scenario Analysis
- 11.3.1 Base-Case Forecast
- 11.3.2 Optimistic and Conservative Scenarios
- 11.3.3 Technology, Pricing and Policy Sensitivities
- 11.4 Market Attractiveness and Growth Outlook
Chapter 12 Netherlands Athletic Apparel and Sportswear Market Segmentation and Outlook
- 12.1 Segmentation Summary and Market Shares, 2025
- 12.2 Largest and Fastest-Growing Segments
- 12.3 By Product Type - Market Size and Forecast, 2025-2035
- 12.3.1 Segment Definition and Scope
- 12.3.2 Historical Market Size, 2018-2025
- 12.3.3 Revenue Forecast, 2025-2035
- 12.3.4 Volume Forecast, 2025-2035
- 12.3.5 Base-Year Market Share, 2025
- 12.3.6 Segment CAGR and Growth Drivers
- 12.3.7 Subsegment Market Size and Forecast
- 12.3.7.1 Performance Apparel
- 12.3.7.2 Casual Sportswear
- 12.3.7.3 Athletic Footwear
- 12.3.7.4 Sports Accessories
- 12.3.8 Subsegment Pricing and Adoption Trends
- 12.3.9 Leading Suppliers and Competition
- 12.3.10 Regional Demand and Opportunities
- 12.4 By End User - Market Size and Forecast, 2025-2035
- 12.4.1 Segment Definition and Scope
- 12.4.2 Historical Market Size, 2018-2025
- 12.4.3 Revenue Forecast, 2025-2035
- 12.4.4 Volume Forecast, 2025-2035
- 12.4.5 Base-Year Market Share, 2025
- 12.4.6 Segment CAGR and Growth Drivers
- 12.4.7 Subsegment Market Size and Forecast
- 12.4.7.1 Men
- 12.4.7.2 Women
- 12.4.7.3 Children and Teens
- 12.4.7.4 Unisex Buyers
- 12.4.8 Subsegment Pricing and Adoption Trends
- 12.4.9 Leading Suppliers and Competition
- 12.4.10 Regional Demand and Opportunities
- 12.5 By Price Tier - Market Size and Forecast, 2025-2035
- 12.5.1 Segment Definition and Scope
- 12.5.2 Historical Market Size, 2018-2025
- 12.5.3 Revenue Forecast, 2025-2035
- 12.5.4 Volume Forecast, 2025-2035
- 12.5.5 Base-Year Market Share, 2025
- 12.5.6 Segment CAGR and Growth Drivers
- 12.5.7 Subsegment Market Size and Forecast
- 12.5.7.1 Premium
- 12.5.7.2 Upper Mid-Range
- 12.5.7.3 Mass Market
- 12.5.7.4 Value and Discount
- 12.5.8 Subsegment Pricing and Adoption Trends
- 12.5.9 Leading Suppliers and Competition
- 12.5.10 Regional Demand and Opportunities
- 12.6 Segment Growth Comparison
- 12.7 Segment Attractiveness and Priority Matrix
Chapter 13 Netherlands Athletic Apparel and Sportswear End-Use and Application Market Outlook
- 13.1 End-Use Industry and Customer Demand Structure
- 13.2 Leading Applications and Customer Groups
- 13.3 End-Use Market Size, Share and Forecast
- 13.4 Major End-Use Industry Deep Dives
- 13.4.1 Customer Requirements and Use Cases
- 13.4.2 Demand and Replacement Cycles
- 13.4.3 Technical and Regulatory Considerations
- 13.4.4 Purchasing and Procurement Models
- 13.4.5 Leading Vendors and Distribution Channels
- 13.4.6 Forecast and Commercial Opportunities
- 13.5 Emerging Applications and Cross-Segment Demand
- 13.6 End-Use Industry Investment Priorities
Chapter 14 Netherlands Athletic Apparel and Sportswear Geographic Market Outlook, 2025-2035
- 14.1 Domestic Market Distribution and Demand Clusters
- 14.2 State- or Province-Wise Market Size and Forecast, 2025-2035
- 14.3 City and Metropolitan Market Outlook
- 14.4 Industrial, Manufacturing and Commercial Clusters
- 14.5 Geographic Concentration of Key End Users
- 14.6 Local Pricing and Purchasing Differences
- 14.7 Domestic Production Facilities and Capacity Map
- 14.8 Local Infrastructure and Project Pipeline
- 14.9 State-Level Policy and Incentive Differences
- 14.10 Subnational Investment Hotspots and Opportunities
- 14.11 Distribution and Logistics Networks
- 14.12 Domestic Competitive Footprint
Chapter 15 Netherlands Athletic Apparel and Sportswear Technology, Innovation and Sustainability Outlook
- 15.1 Technology Landscape and Maturity
- 15.2 Product, Process and Service Innovation
- 15.3 AI, Automation and Digital Tools in the Industry
- 15.4 Technology Adoption and Performance Benchmarking
- 15.5 Innovation Pipeline and R&D Investment
- 15.6 Patent and Intellectual Property Trends
- 15.7 Energy Efficiency and Resource Management
- 15.8 Sustainability, Recycling and Circularity
- 15.9 Technology Roadmap, 2025-2035
- 15.10 Risks of Obsolescence and Technology Substitution
Chapter 16 Netherlands Athletic Apparel and Sportswear Market Key Strategic Imperatives
- 16.1 Growth and Market Entry Priorities
- 16.2 High-Return Products and Segments
- 16.3 Pricing, Profitability and Cost Optimization
- 16.4 Technology Investment and Product Differentiation
- 16.5 Supply Chain Localization and Resilience
- 16.6 Distribution and Customer Acquisition
- 16.7 Partnership, Acquisition and Capacity Strategy
- 16.8 Regional Expansion Priorities
- 16.9 Short-, Medium- and Long-Term Actions
Chapter 17 Competition Outlook
- 17.1 Industry Competition Characteristics
- 17.2 Market Structure and Concentration
- 17.3 Market Share and Competitive Positioning, 2025
- 17.4 Company-Wise Revenue and Product Benchmarking
- 17.5 Production and Service Capacity Benchmarking
- 17.6 Technology, Pricing and Differentiation
- 17.7 Regional Footprint and Distribution Strength
- 17.8 Mergers, Acquisitions and Strategic Alliances
- 17.9 New Entrants and Competitive Threats
- 17.10 Porter's Five Forces and Industry Attractiveness
- 17.11 Competitive Outlook, 2025-2035
Chapter 18 Company Profiles
- 18.1 Company Coverage and Selection Criteria
- 18.2 Nike
- 18.2.1 Business Description
- 18.2.2 Company Ownership and Geographic Presence
- 18.2.3 Product and Service Portfolio
- 18.2.4 Manufacturing and Operating Footprint
- 18.2.5 Production Capacity and Expansion Plans
- 18.2.6 Financial Performance and Investment
- 18.2.7 Market Share and Competitive Position
- 18.2.8 Technology and Innovation Capabilities
- 18.2.9 Strategic Alliances or Partnerships
- 18.2.10 Recent Developments
- 18.2.11 Growth Strategy and Outlook
- 18.3 Adidas
- 18.4 Puma
- 18.5 Under Armour
- 18.6 ASICS
- 18.7 New Balance
- 18.8 Lululemon
- 18.9 Columbia Sportswear
- 18.10 Decathlon
- 18.11 Gymshark
- 18.12 Other Relevant Market Participants
Note: Every listed company is profiled on the structure shown under the first company. The company list is preliminary and may change based on research findings, market developments, data availability and client requirements.
Chapter 19 Disclaimer
- 19.1 Research and Forecast Disclaimer
- 19.2 Data Source and Estimation Limitations
Note: The depth of individual sections depends on data availability for this market. Volume, capacity, trade and other unit-based metrics are included where applicable.