Record participation meets tariff-driven price increases
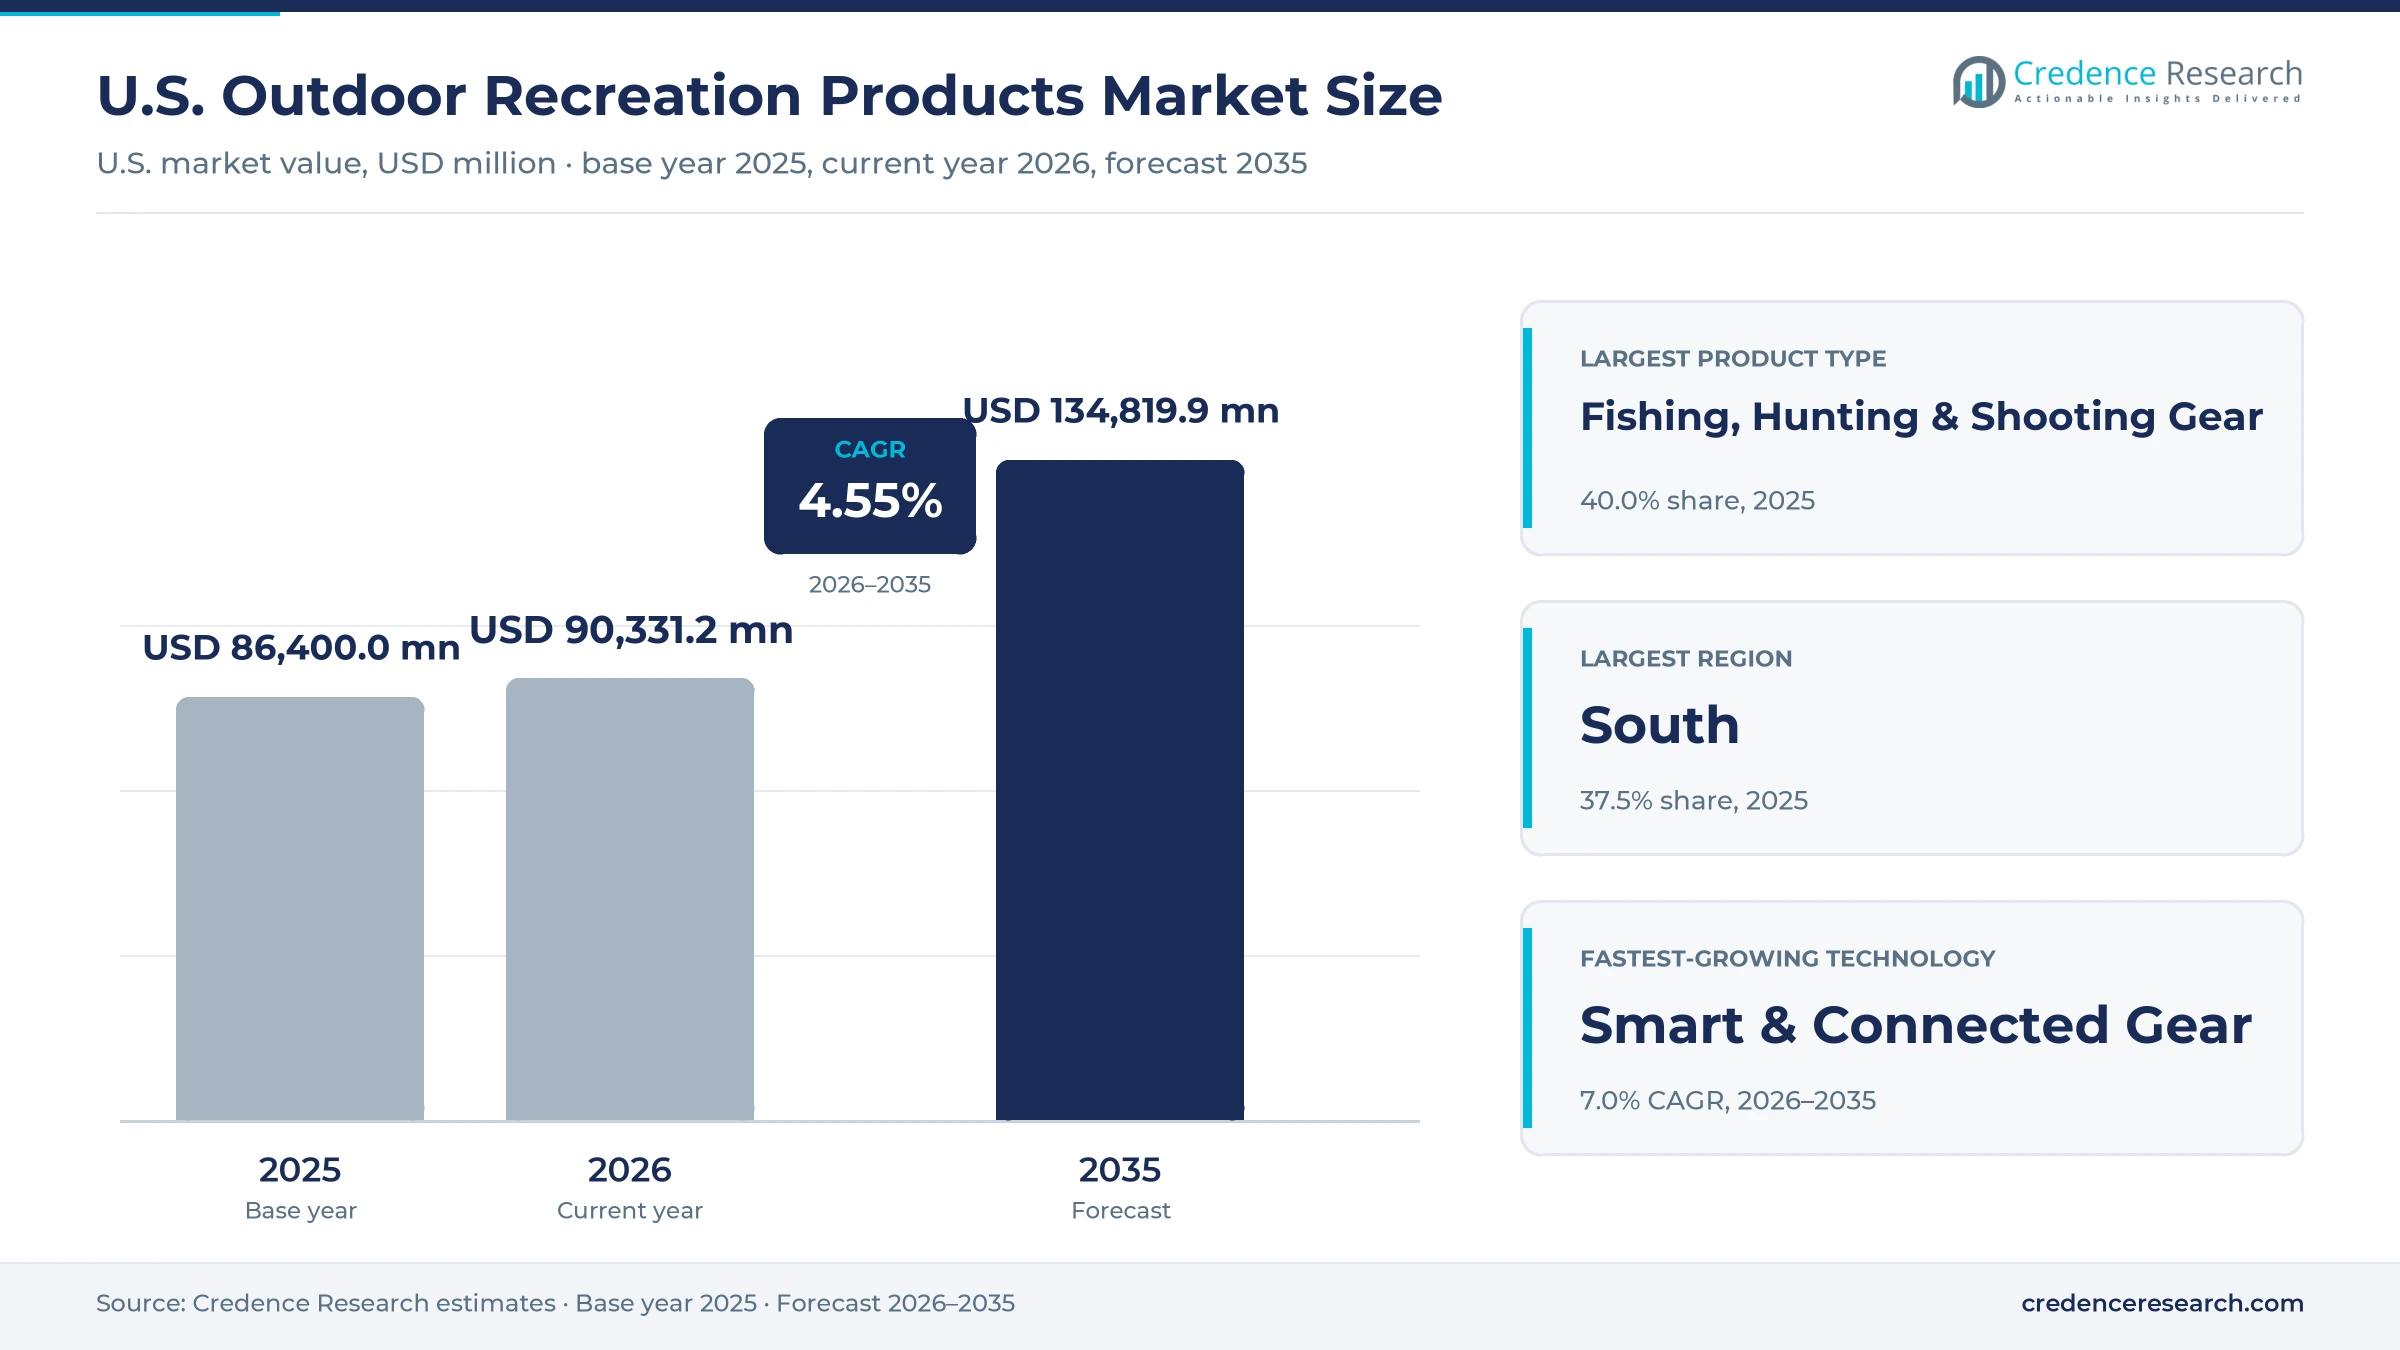
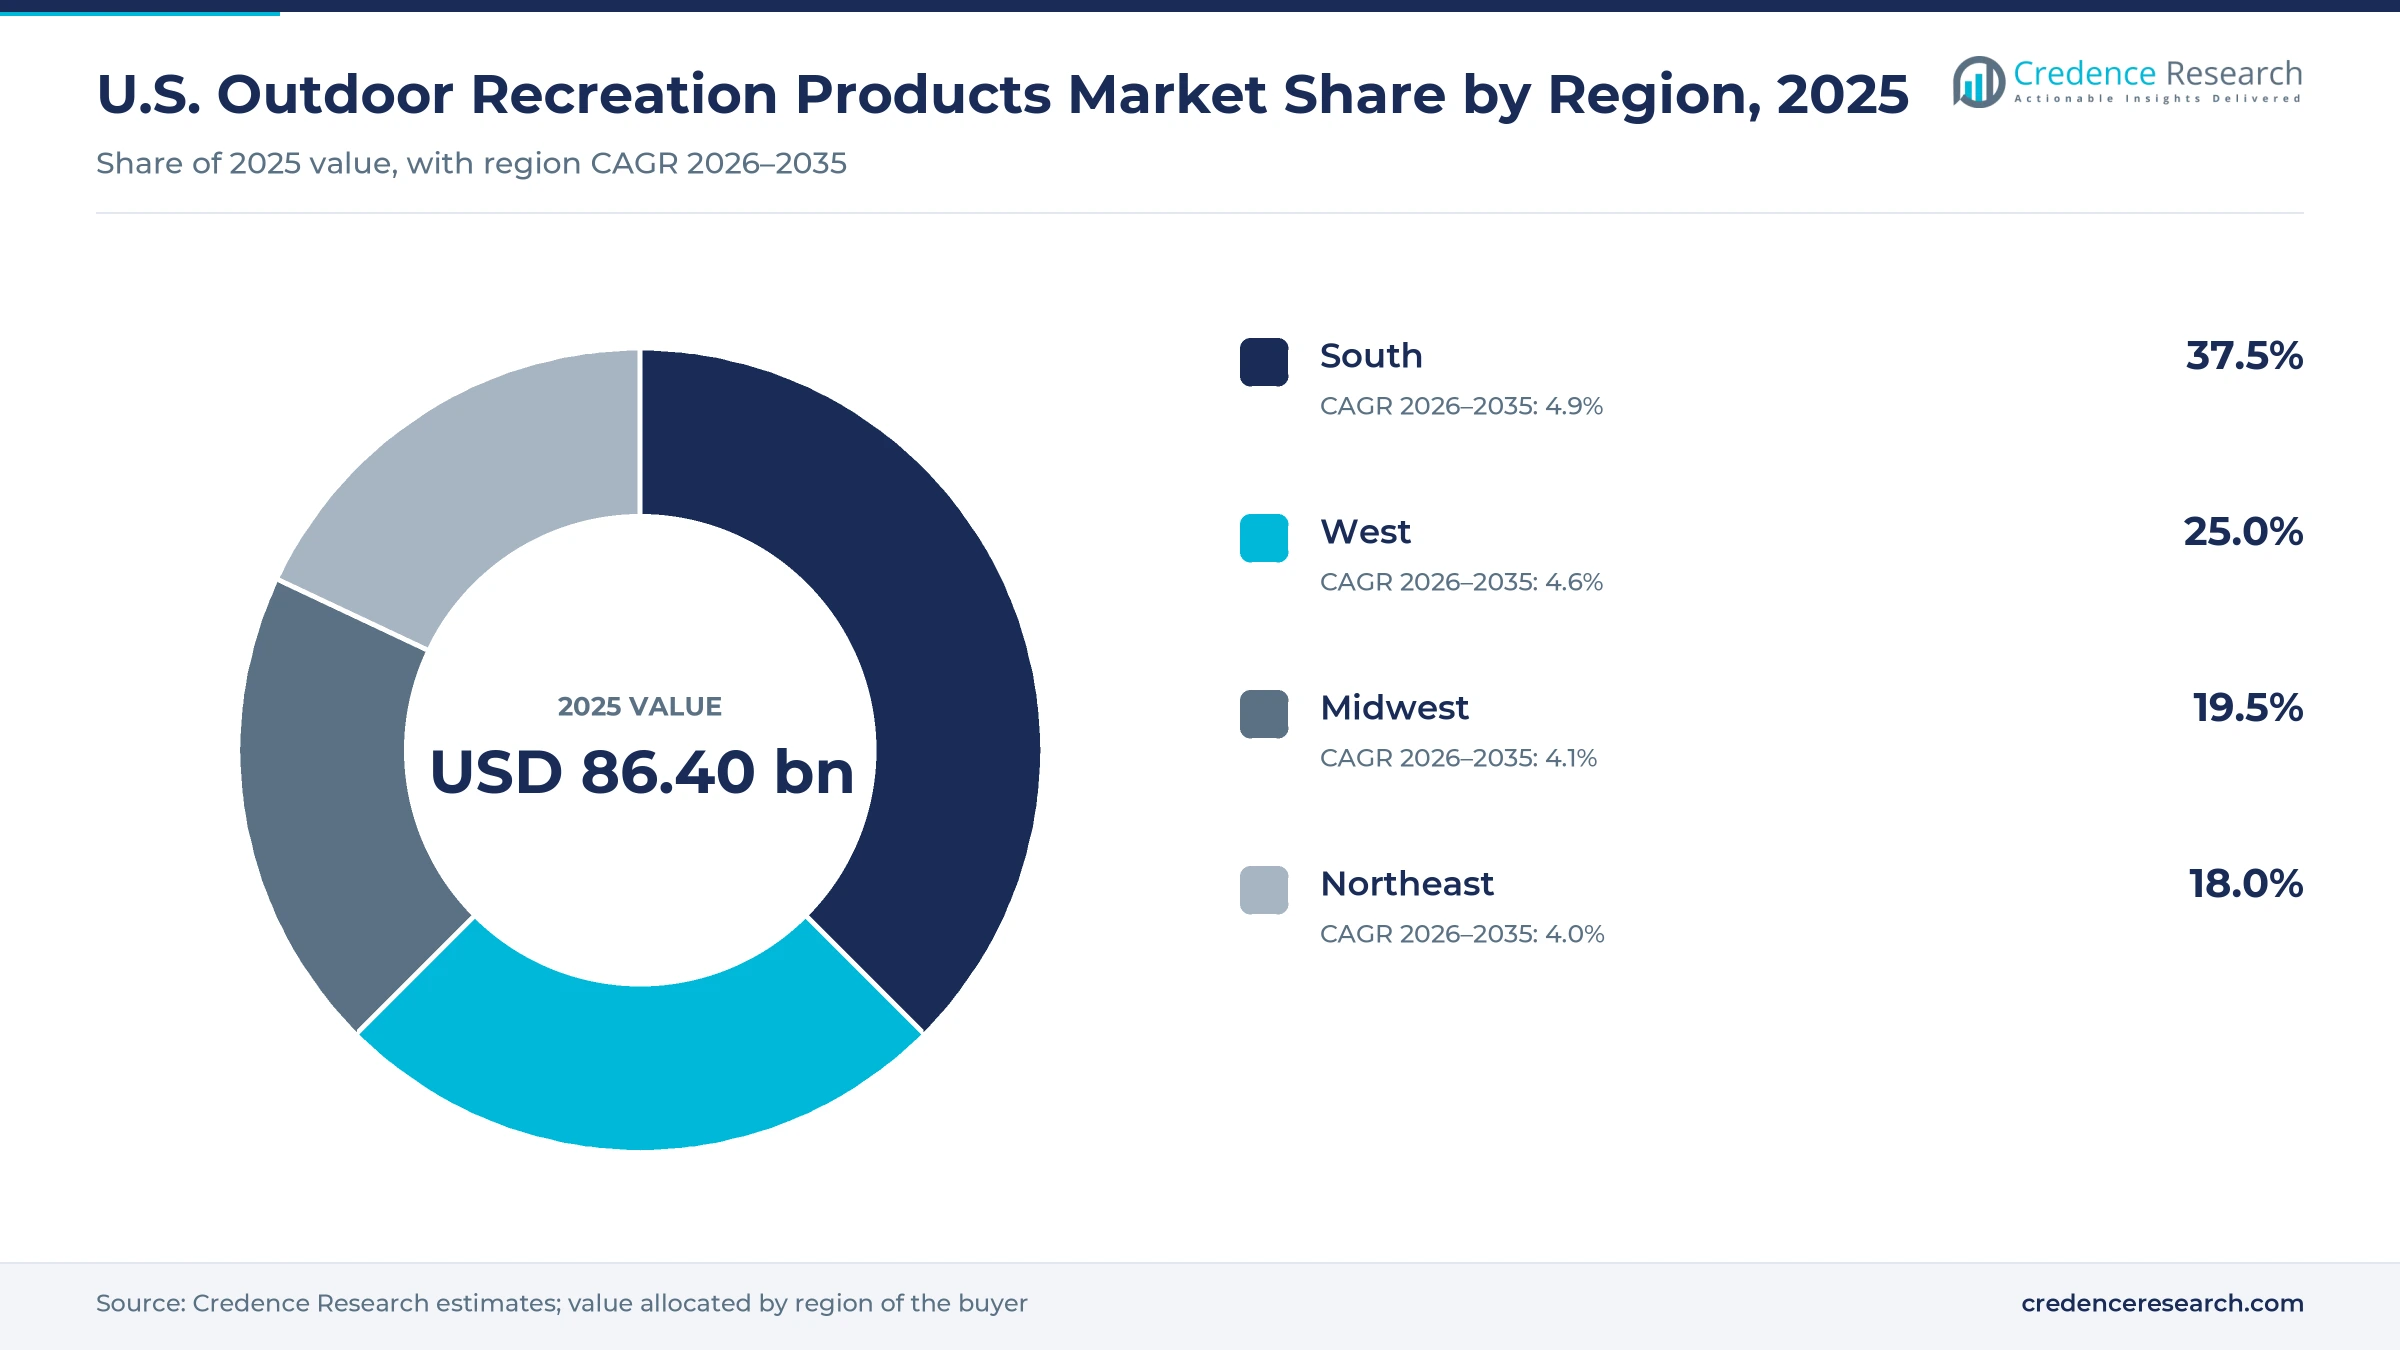
The U.S. outdoor recreation products market was valued at USD 86.40 billion in 2025 and is projected to increase from USD 90.33 billion in 2026 to USD 134.82 billion by 2035, registering a CAGR of 4.55% during 2026–2035. Spending rests on a record number of Americans who hike, camp, fish and hunt, on steady traffic to public lands, and on buyers who pay more for satellite-connected watches, premium shells and insulated coolers. The South held the largest regional share, 37.5% in 2025, and it is also the fastest-growing region at 4.9% a year, as its population grows faster than any other part of the country and fishing and hunting traditions run deep. The West follows with 25.0%, supported by mountain sports and dense specialty retail. Tariffs on imported footwear and apparel are the most important commercial change, pushing brands to raise list prices for 2026 while unit sales soften.
Gear bought for trails, water, snow and hunting grounds sets the scope
The market counts technical apparel and footwear, camping, hiking and climbing equipment, fishing, hunting and shooting gear, and non-motorized wheeled, snow and water recreation products bought in the United States. Buyers range from casual participants who buy a tent once a decade to core enthusiasts, families and youth, and professional and institutional users such as guides, outfitters and public agencies. Products reach them through specialty outdoor retail, sporting goods chains, mass merchants and digital commerce.
Value is counted at retail selling prices for new goods and for pre-owned goods resold through organized channels. The estimate excludes motorized boats, recreational vehicles, all-terrain vehicles and their engines, as well as trips, lodging, park fees, guided services and fuel, which make up most of the wider outdoor recreation economy. Casual fashion without an outdoor function is also excluded from the estimate.
U.S. Outdoor Recreation Products Market Insights
- Outdoor gear, apparel and footwear spending grows from USD 86.40 billion in 2025 to USD 134.82 billion by 2035 at a 4.55% CAGR, as premium and connected products offset softer unit sales.
- The South led with 37.5% of 2025 value and grows fastest at 4.9% a year, helped by 6.0% population growth since 2020, the fastest of any region.
- Fishing, hunting and shooting gear held 40.0% of 2025 value, as boating and fishing remained the largest conventional outdoor activity in 34 states in 2024.
- A record 183.2 million Americans took part in outdoor recreation in 2025, yet they went out less often, which shifts value toward entry kits and first purchases.
- DICK'S Sporting Goods completed its Foot Locker acquisition on Sept. 8, 2025, giving the combined group more than 3,200 stores and wider buying power with brands.
Fishing and hunting gear and sporting goods chains lead
Why does fishing, hunting and shooting gear hold the largest share?
Based on product type, the market is categorized into technical apparel and footwear, camping, hiking and climbing equipment, fishing, hunting and shooting gear, and wheeled, snow and water recreation products. Fishing, Hunting & Shooting Gear led with 40.0% of 2025 value because firearms, ammunition, reels and fishing electronics carry high prices. Boating and fishing, the largest conventional outdoor activity in 34 states, added $38.4 billion of value in 2024, according to the Bureau of Economic Analysis outdoor recreation account. Camping, Hiking & Climbing Equipment grows fastest at 5.4% a year as backpacking was one of the few equipment pockets that grew in 2025, the Outdoor Industry Association reported, lifting demand for camping gear.
Which uses carry the most value, and where is growth fastest?
Based on application, the market is categorized into day hiking and trail recreation, camping and backpacking, fishing and hunting, and adventure and seasonal sports. Fishing & Hunting led with 38.0% of 2025 value because anglers and hunters replace fishing line, lures, ammunition and apparel every season, and fishing outings rose 3% to 918 million in 2025, according to the American Sportfishing Association. Day Hiking & Trail Recreation grows fastest at 5.3% a year as trail running shoe sales rose 22.7% in dollars in July 2025, Outdoor Industry Association data reported by SGB Media show. Light packs, poles and hydration gear follow the same buyers onto trails.
Why do sporting goods chains lead, and why is online gaining?
Based on distribution channel, the market is categorized into specialty outdoor retail, sporting goods chains, mass merchants and digital commerce. Sporting Goods Chains led with 34.0% of 2025 value because large-format stores combine firearms counters, fishing departments and apparel walls under one roof, and Academy Sports and Outdoors alone operated 324 stores in 21 states in May 2026, its filing shows. Digital Commerce grows fastest at 5.7% a year as U.S. e-commerce reached 17.1% of retail sales in the second quarter of 2026, up 12.2% from a year earlier, according to the Census Bureau. Brand webstores now list the same sporting goods ranges at one national price.
How fast does connected gear grow against conventional products?
Based on technology, the market is categorized into conventional outdoor gear, smart and connected gear, advanced performance materials and circular and repairable products. Conventional Outdoor Gear led with 77.5% of 2025 value because most tents, rods, jackets and coolers carry no electronics, and the Outdoor Industry Association found that casual categories drove more 2024 sales than technical gear. Smart & Connected Gear grows fastest at 7.0% a year as Garmin added built-in inReach satellite messaging and LTE to its fenix 8 Pro smartwatch in September 2025, according to Tom's Guide. Each such device also carries a monthly service plan, which gives the maker recurring revenue after the first sale.
| Segment Group | Leading Sub-segment | Share, 2025 | Fastest-growing Sub-segment | CAGR, 2026–2035 |
|---|---|---|---|---|
| By Product Type | Fishing, Hunting & Shooting Gear | 40.0% | Camping, Hiking & Climbing Equipment | 5.4% |
| By Application | Fishing & Hunting | 38.0% | Day Hiking & Trail Recreation | 5.3% |
| By Distribution Channel | Sporting Goods Chains | 34.0% | Digital Commerce | 5.7% |
| By Technology | Conventional Outdoor Gear | 77.5% | Smart & Connected Gear | 7.0% |
Gear prices climb from $500 communicators to $1,999 watches
Pricing works per item, with brands setting suggested retail prices and chains, mass merchants and marketplaces competing on promotions around a few seasonal peaks. The spread between tiers is wide, since the top fenix 8 Pro model costs about three times a premium shell jacket, and connected devices add a recurring service fee to the purchase price. Tariffs now move list prices more than input costs do. Columbia Sportswear told investors in October 2025 that it planned high single-digit U.S. price increases for spring 2026, with similar rises for fall. Buyers respond by trading down or buying used, which favors brands that run both clear value lines and premium lines.
| Product or price element | Typical price or fee | Basis |
|---|---|---|
| Arc'teryx Beta AR men's shell jacket | $650.00 | evo listing, November 2026 |
| Garmin inReach Messenger Plus satellite communicator | $499.99, plus service plans from $14.99 a month | Garmin release, September 2024 |
| Garmin fenix 8 Pro watch with inReach and LTE | $1,199 to $1,999 | Tom's Guide, September 2025 |
Request a Free Sample
Fill in your details and we'll send you a free sample report.
- Sample data tables & charts
- Research methodology
Participants, public lands and premium gear drive demand
A record participant base widens the pool of first buyers
More Americans now take part in outdoor activities than ever before, and each newcomer needs footwear, layers and basic equipment before anything else. A record 183.2 million people aged six and over participated in 2025, 59% of the population and about 30 million more than in 2019, the Outdoor Industry Association reported in June 2026. Fishing remains a large gateway, with 57 million Americans fishing in 2025, 6.3 million of them for the first time, according to the American Sportfishing Association. More than half of all outdoor participants have less than 10 years of experience, the Outdoor Industry Association found. This newer, less loyal base buys entry kits first, so brands that win the first purchase can trade buyers up to better gear over several seasons.
Public lands traffic and park funding sustain gear use
Parks, forests and ski areas are where most outdoor gear gets used, so visitor traffic sets the pace of replacement and upgrades. National Park Service sites recorded 323.0 million recreation visits in 2025, with 26 parks setting records despite a 43-day partial government shutdown. Ski areas logged 61.5 million skier visits in the 2024-25 season, the second-highest total on record, according to the National Ski Areas Association. Funding for upkeep is also moving, since the Senate Energy and Natural Resources Committee advanced the America the Beautiful Act on June 17, 2026, proposing $9.5 billion over five years against a $41 billion maintenance backlog, Outdoor Alliance reported. Better trails and campgrounds keep visitors returning, which sustains demand for day hiking and trail gear.
Premium and connected gear lift spending per buyer
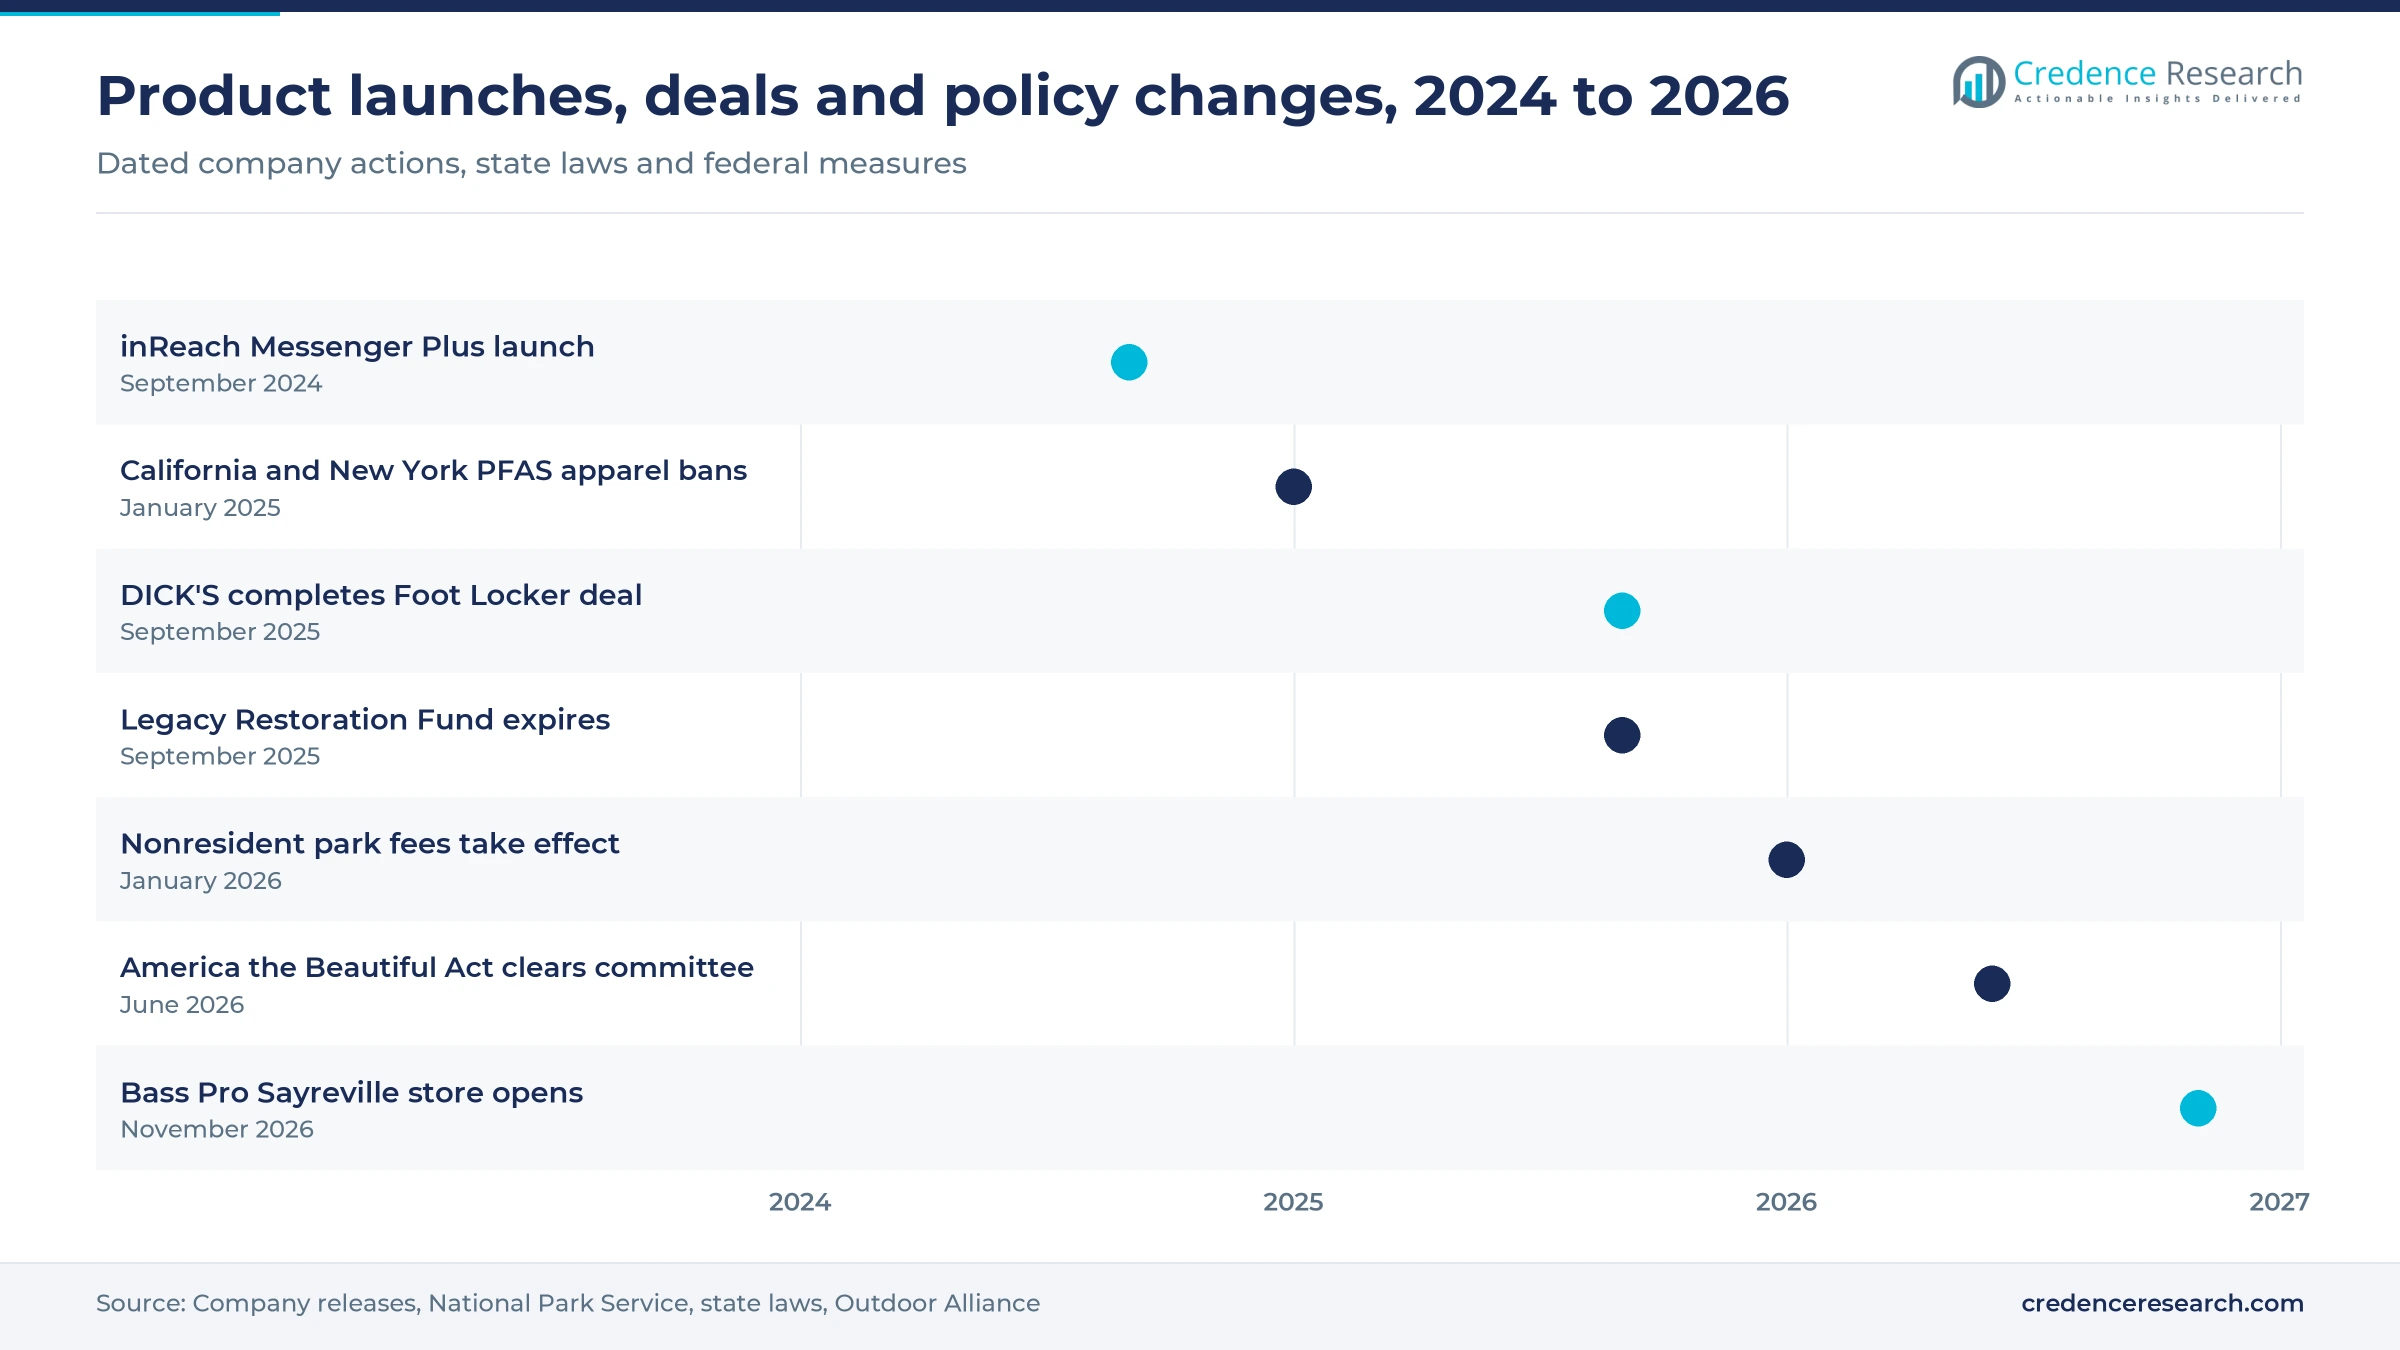
Buyers are paying more for gear that performs better or connects to satellites, so spending per participant rises even when unit sales fall. Garmin's inReach Messenger Plus, launched on Sept. 18, 2024, added photo and voice messages to satellite texting for hikers, hunters and anglers. Premium brands are also building their own U.S. store networks. Amer Sports counts 75 Arc'teryx stores in North America and sees room for about 200, Retail Insider reported in August 2026, while Salomon ran five U.S. stores in November 2025 and planned to roughly double that, according to Glossy. YETI told investors on Sept. 17, 2026, that technical performance apparel and a powered cooler are in its pipeline. Owned stores protect full prices and give staff time to explain connected devices.
Large-format store openings widen access to gear
Sporting goods chains keep opening large stores, which brings full fishing, hunting, camping and apparel ranges to growing suburbs. Academy Sports and Outdoors planned 20 to 25 new stores in fiscal 2026, with most of them in the second half, its June 2026 filing shows. Bass Pro Shops announced a 200,000-square-foot Outdoor World in Sayreville, New Jersey, on June 19, 2026, calling it the largest single-level location in its network of close to 200 stores. DICK'S Sporting Goods, now combined with Foot Locker, also runs its Public Lands outdoor banner and House of Sport format. New stores concentrate buying power, so brands that secure floor space in these chains reach the widest pool of Fishing & Hunting buyers.
Trail footwear and resale reshape what Americans buy
Running-inspired footwear rises as casual outdoor buyers grow
Footwear has become the growth engine of the outdoor category, as casual buyers choose trail and running-inspired shoes over heavy boots and technical equipment. Outdoor retail sales in measured channels rose 1% to $28 billion in 2024, with footwear and accessories posting the strongest gains while equipment declined, the Outdoor Industry Association reported. Road running shoe sales rose 13.4% in dollars in July 2025, the association said in October 2025. Athletic footwear was also the largest category of U.S. sporting goods wholesale sales, at $24.1 billion in 2025, according to the Sports & Fitness Industry Association. Brands that blend trail grip with everyday styling now capture spending that once went to hiking boots, which shifts value toward technical apparel and footwear.
Resale and trade-in programs shift spending toward circular gear
Used and repaired gear is moving from a niche into mainstream outdoor retail, as buyers facing higher prices look for quality at lower cost. Independent specialty retailers finished 2025 in positive territory, helped by a growing used gear market, the Outdoor Industry Association said in March 2026. REI Co-op sold more than 1 million used items through Re/Supply in 2022, opened its second Re/Supply store in Clackamas, Oregon, home to more than 303,000 active members, and targets 50 million members by 2030, Retail Dive reported. DICK'S Sporting Goods and its Public Lands banner launched an in-store buyback program in April 2022. Resale earns brands a second margin on the same product, giving circular and repairable products room to grow from a small base.
Older adults and families form the next core buyer group
Older adults and families offer an opening, because their participation is rising faster than the overall base and they buy for comfort, safety and several users at once. Participation among Americans aged 65 and older rose from 25.7% in 2016 to 41.6% in 2025, reaching 23.9 million people, the Outdoor Industry Association found. Children aged six to 12 rose 5% to 22.6 million participants in 2025. About two-thirds of households with children take part, compared with slightly more than half of those without children, the association reported. Suppliers that design lighter packs, supportive footwear, easy-pitch tents and family bundles can turn these groups into repeat buyers, and the seniors' interest in hiking, birding and fishing favors day-use products.
PFAS-free materials give early movers a shelf advantage
State limits on PFAS chemicals open room for brands that move first to fluorine-free membranes and water repellents. California's AB 1817 has banned new textiles with intentionally added PFAS or more than 100 parts per million of total organic fluorine since Jan. 1, 2025, and the limit falls to 50 ppm in 2027, law firm Venable noted. New York set a similar apparel ban from the same date. Both states end the exemption for outdoor apparel made for severe wet conditions on Jan. 1, 2028. Because the two states hold a large share of premium rainwear buyers, brands that certify compliant shells early can win shelf space while rivals reformulate, which lifts advanced performance materials.
Tariffs, churn and cooling gun sales test sellers
How much do tariffs raise the cost of imported gear?
Outdoor footwear and apparel rely heavily on factories in Asia, so new duties feed straight into shelf prices. Footwear already carried an average tariff of 12%, against about 2% for other consumer goods, and the industry expected tariff payments to pass $5 billion in 2025, the Footwear Distributors and Retailers of America said in July 2025. The group also flagged a new 20% added tariff on Vietnamese-made goods. Brands that cannot shift sourcing quickly lose margin, while price-sensitive buyers delay purchases or trade down to value lines.
Do falling frequency and churn limit repeat purchases?
Participants go outside less often than before the pandemic, which slows wear-driven replacement of boots, tents and tackle. The American Sportfishing Association counted 19 million people who stopped fishing in 2025, the highest churn rate on record, and the angler total slipped from 57.9 million in 2024. The Outdoor Industry Association also found that annual outing frequency remains below pre-pandemic levels. Brands and retailers need clinics, events and loyalty programs to keep new participants active long enough to buy again.
Cooling firearm demand weighs on shooting gear sales
Firearm purchases, a large source of shooting gear spending, have cooled from pandemic peaks. NSSF-adjusted background checks, a proxy for retail firearm sales, fell 4.1% to 14,612,314 in 2025 from 15,239,011 in 2024, the National Shooting Sports Foundation reported in January 2026. Lower gun sales reduce follow-on purchases of ammunition, optics, cases and range apparel. Chains with large firearm counters feel this most, so they are shifting floor space toward fishing, camping and footwear.
Could higher park fees deter international visitors?
Fee changes at national parks may reduce visitor spending in gateway towns, where rental fleets and outfitter shops buy gear in volume. From Jan. 1, 2026, non-U.S. residents pay $250 for an annual pass instead of the $80 resident price, plus a $100 per-person surcharge at 11 popular parks, including Yellowstone and Yosemite, CNN reported. Outfitters near those parks depend on international summer traffic for rentals and retail sales. Fewer foreign visits would leave them more reliant on domestic buyers.
South leads on population growth while West draws skiers
| Region | Value, 2025 (USD billion) | Share, 2025 | CAGR, 2026–2035 |
|---|---|---|---|
| South | 32.40 | 37.5% | 4.9% |
| West | 21.60 | 25.0% | 4.6% |
| Midwest | 16.85 | 19.5% | 4.1% |
| Northeast | 15.55 | 18.0% | 4.0% |
The South leads on population growth and fishing culture
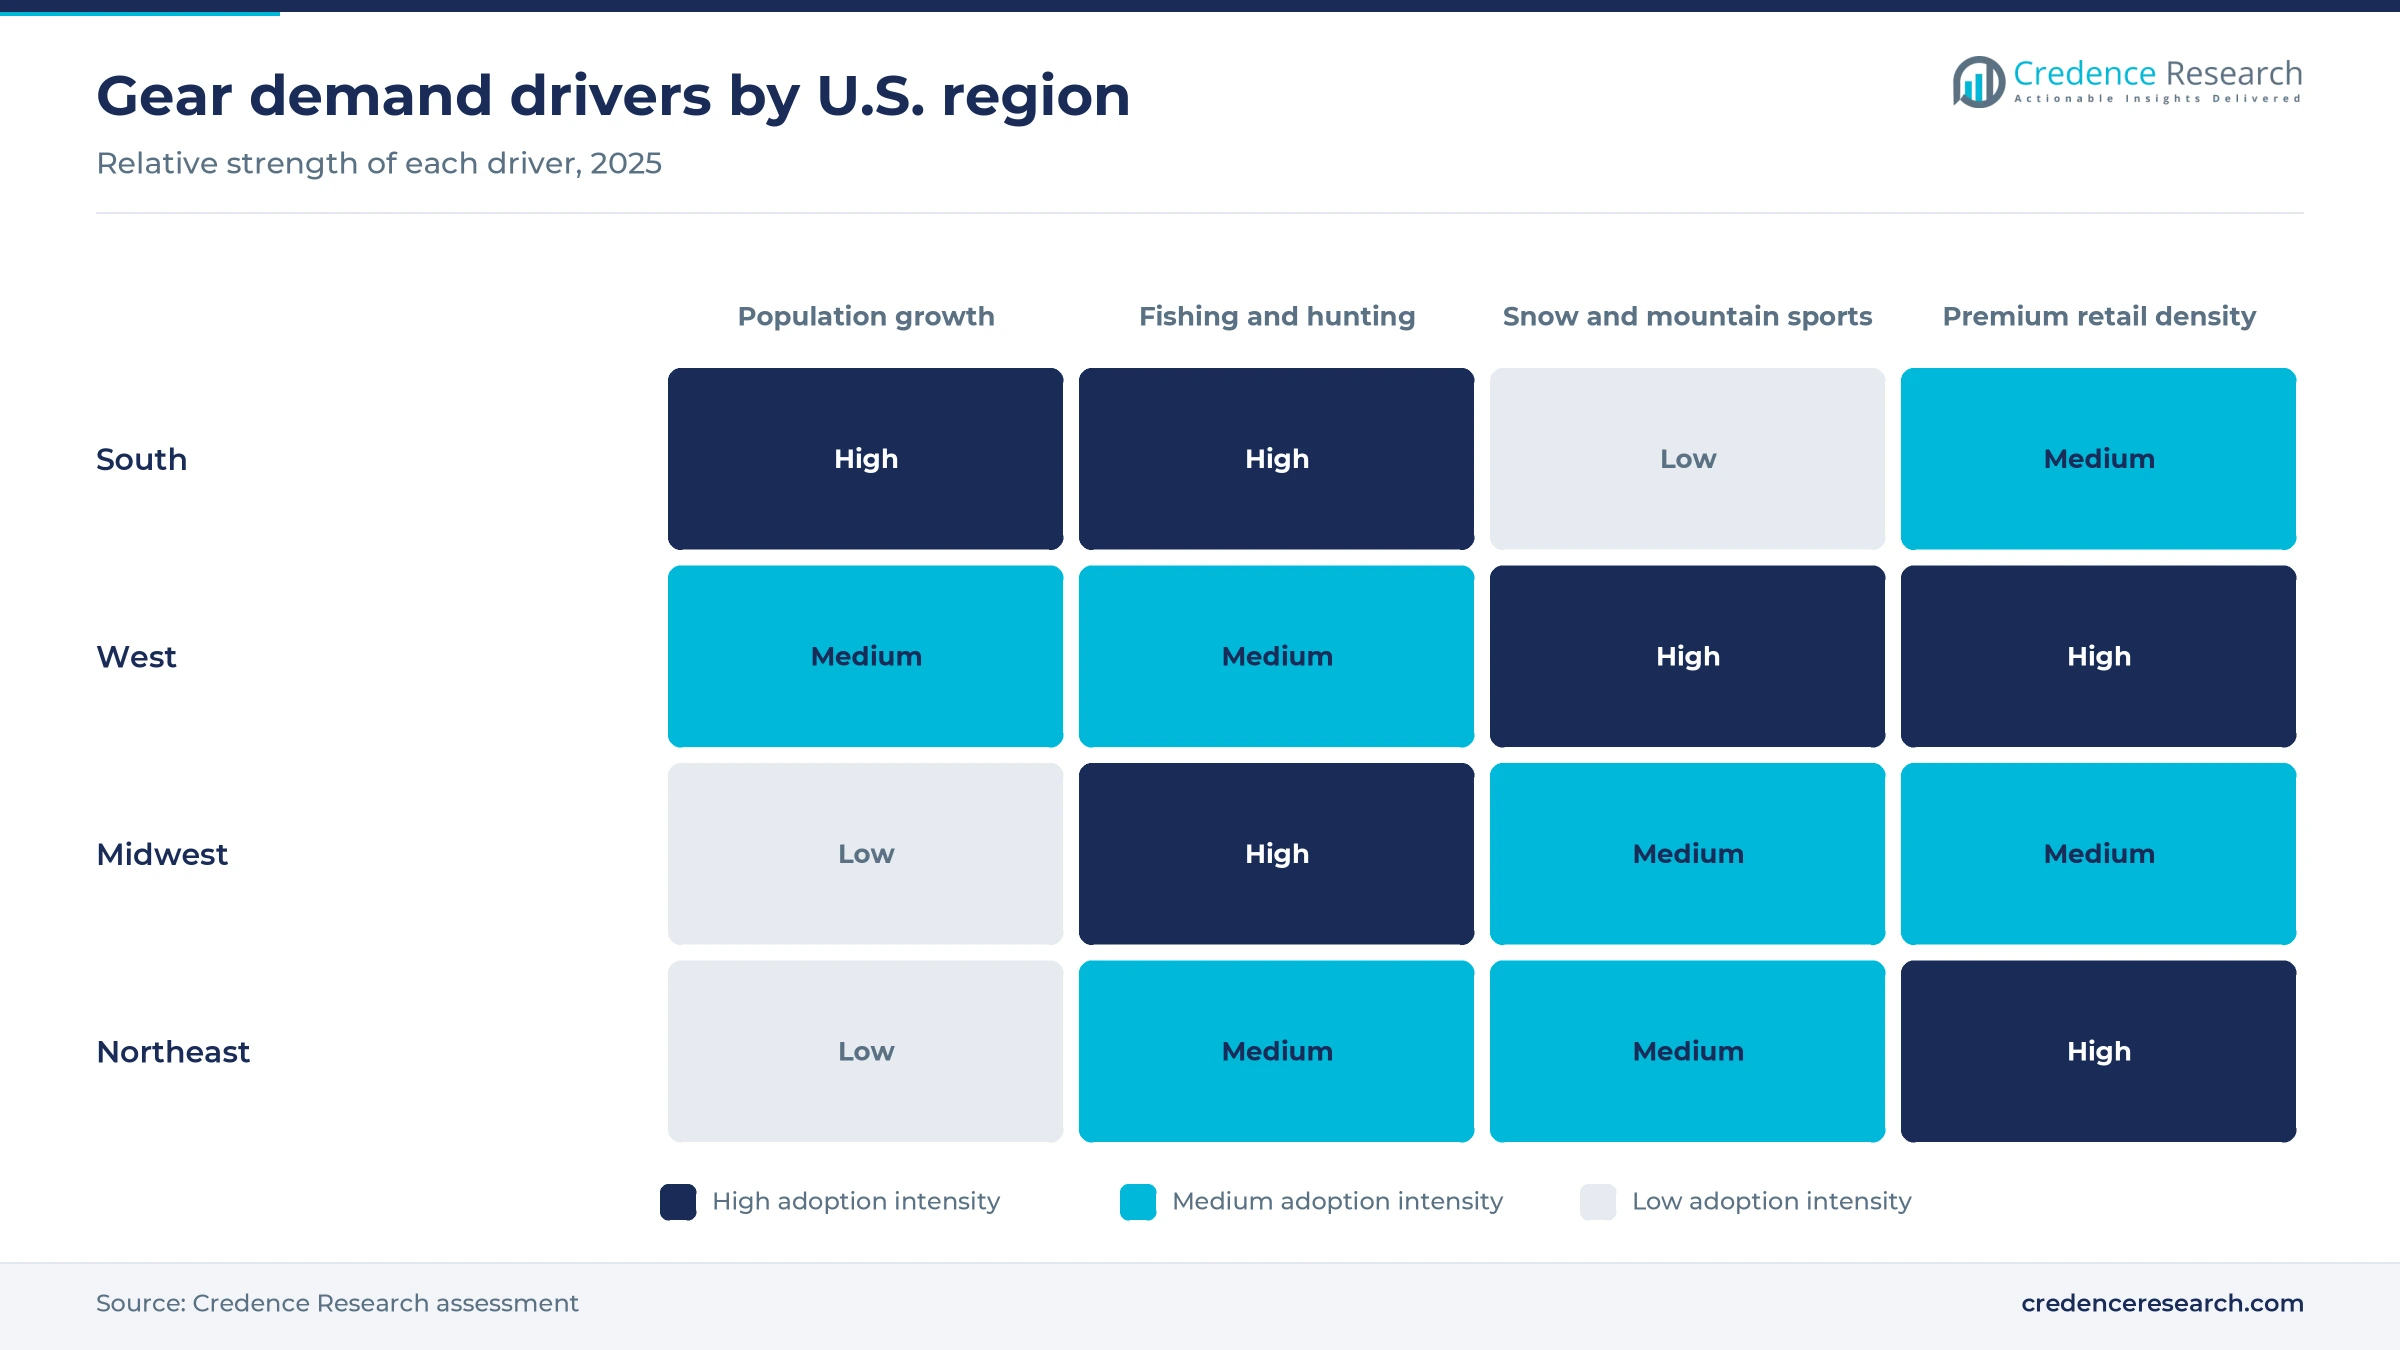
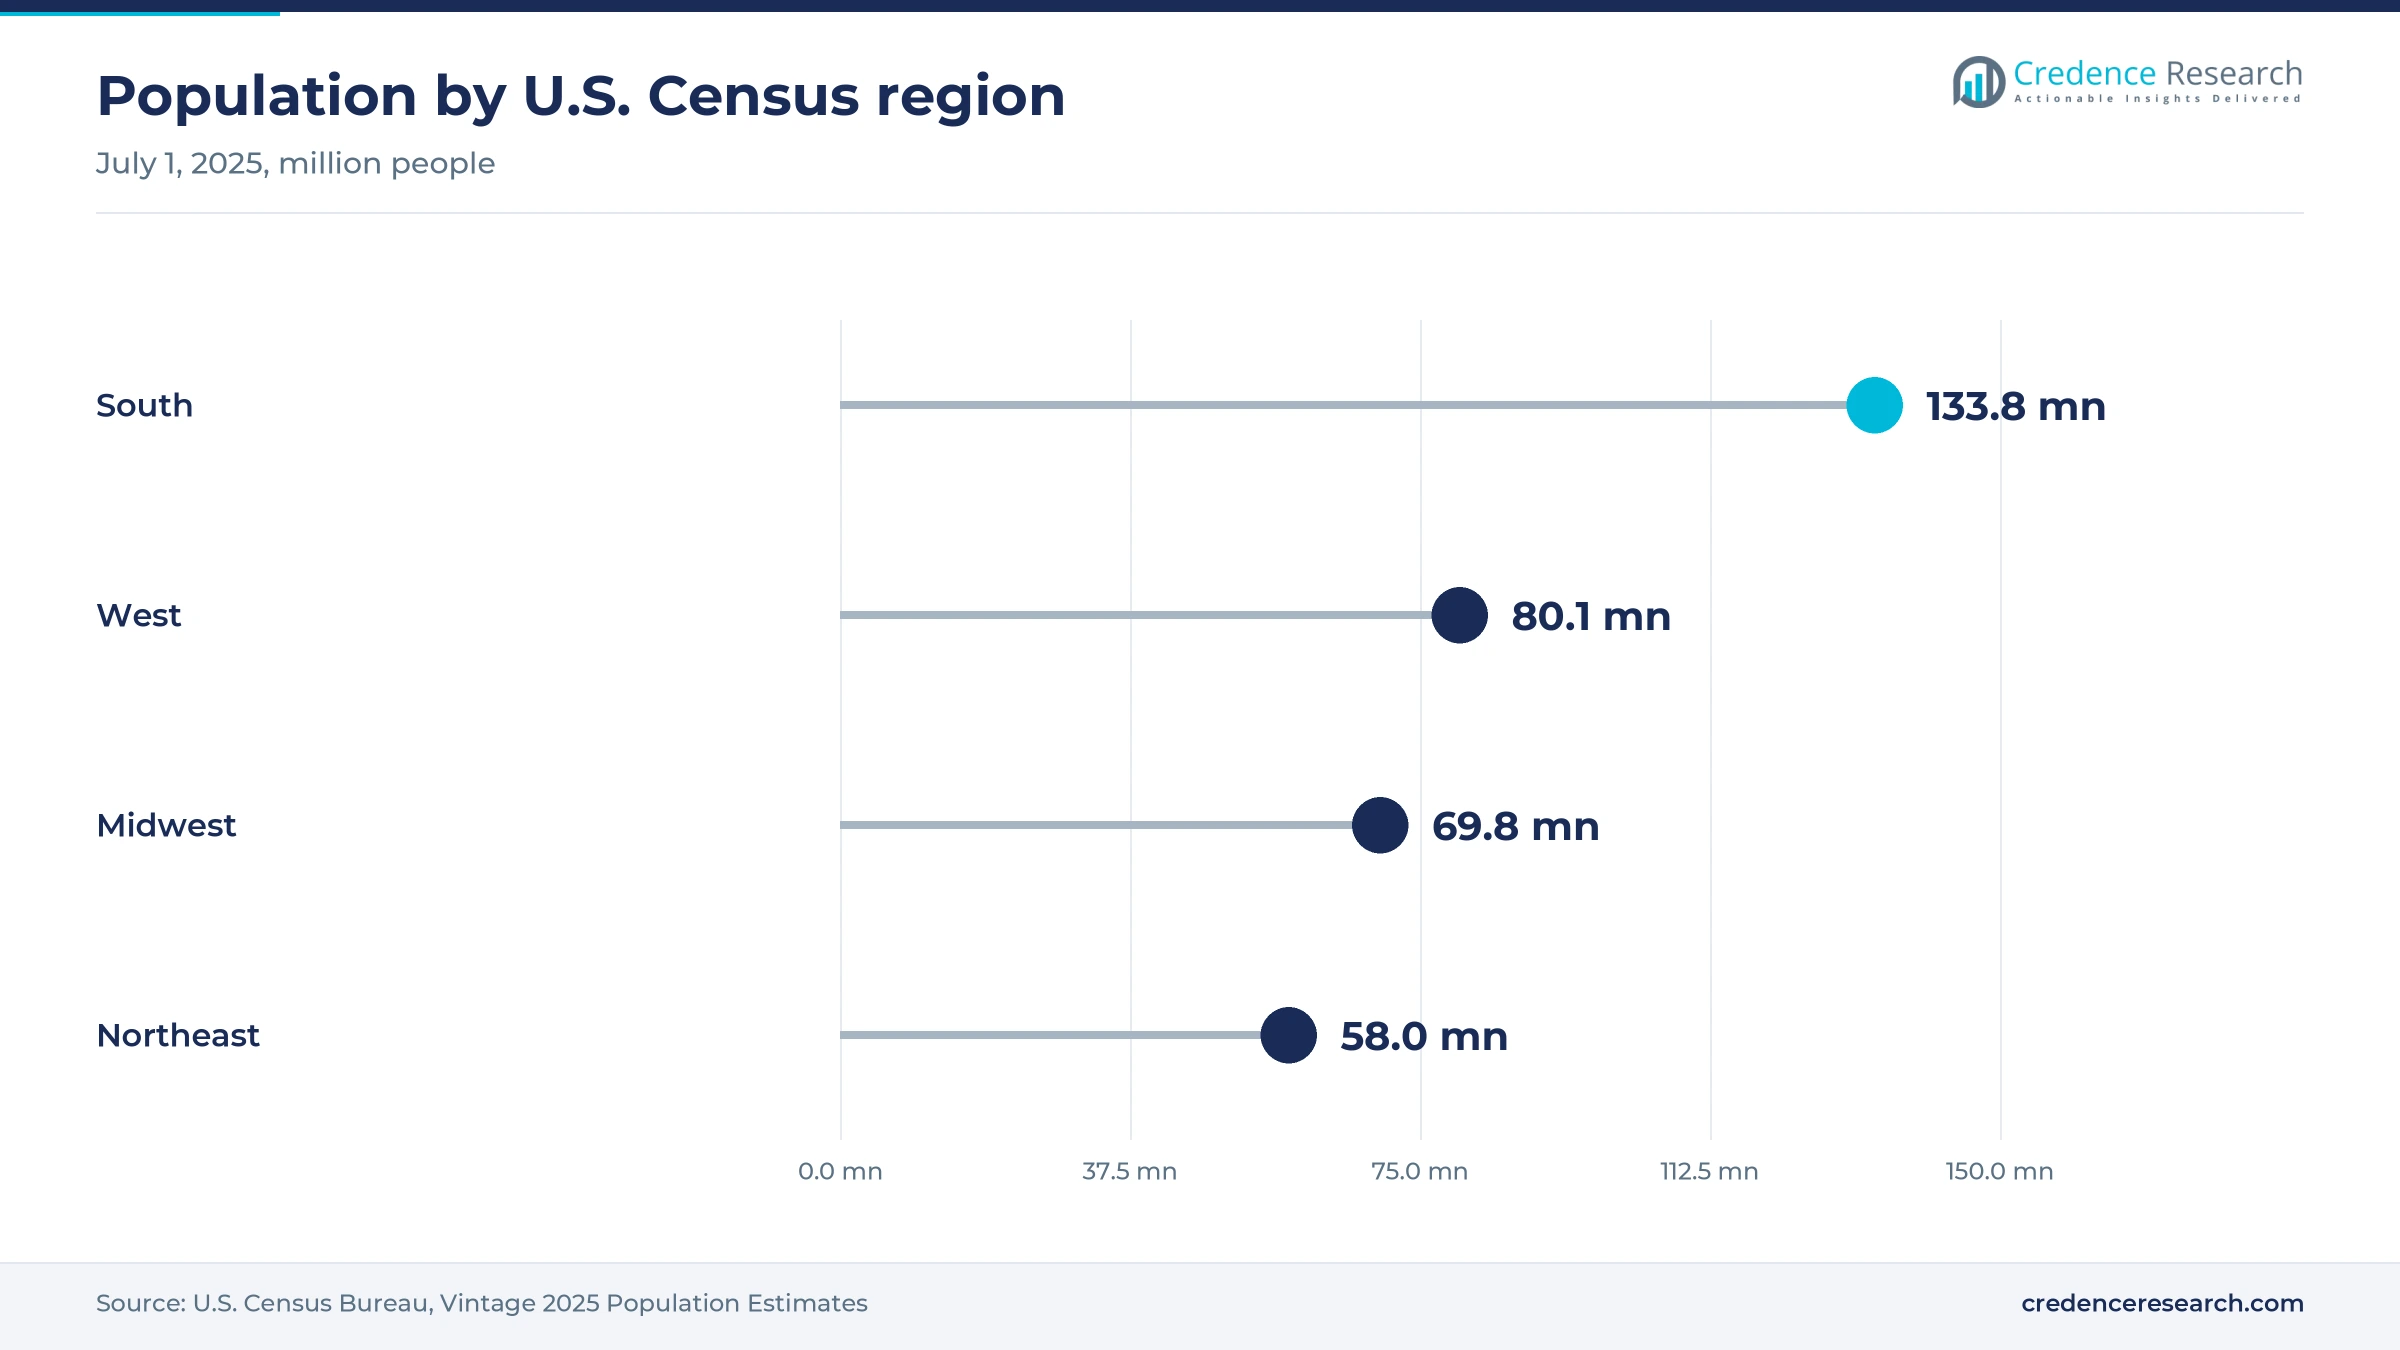
The South held 37.5% of 2025 value and grows fastest at 4.9% a year. The region had 133.8 million residents in July 2025, up 6.0% since 2020, the fastest gain of any region, according to the Census Bureau Vintage 2025 estimates. Florida had the largest boating and fishing economy of any state in 2024, at $4.4 billion of value added, BEA data show and Texas led the country in hunting and shooting. Great Smoky Mountains was the most visited national park in 2025, and that traffic keeps gateway outfitters in Tennessee and North Carolina busy.
The West draws on mountains, snow and specialty stores
The West held 25.0% of 2025 value and grows at 4.6% a year. The region had 80.1 million residents in 2025, the Census Bureau reported. The Rocky Mountain states logged 26.4 million skier visits in the 2024-25 season, 42.9% of the national total, and the Pacific Northwest had its busiest season ever at 4.7 million, according to the National Ski Areas Association. Colorado led snow activities nationally with $1.6 billion of value added in 2024, BEA reported.
The Midwest balances lake fishing, hunting and city retail
The Midwest held 19.5% of 2025 value and grows at 4.1% a year. Its 69.8 million residents grew just 1.1% between 2020 and 2025, the Census Bureau reported, which limits growth in new demand for gear. Premium brands are arriving in its cities, with Salomon opening a Bucktown store in Chicago in August 2025, Glossy reported. Academy Sports and Outdoors opened a new store in Ohio in early 2026, extending large-format hunting and fishing ranges north.
The Northeast grows through flagships and New England uptake
The Northeast held 18.0% of 2025 value and grows at 4.0% a year, the slowest pace of the four regions. Its 58.0 million residents rose only 0.7% between 2020 and 2025, the Census Bureau reported. Participation is improving, however, with New England and East South Central participants each up 6.2% in 2025, the Outdoor Industry Association found. Amer Sports opened the Arc'teryx Rockefeller Alpha Store on Fifth Avenue in New York in 2025, its largest North American retail launch to date, using dense cities as brand showcases.
Satellite devices, mergers and big stores mark 2024 to 2026
| Development | Status and market relevance |
|---|---|
| In September 2024, Garmin introduced the inReach Messenger Plus, adding photo and voice messages to its satellite communicator line. | Available; extends satellite messaging to casual hikers and hunters |
| In June 2025, Thule raised U.S. prices to offset tariffs while expanding bike carrier output at its Connecticut factory. | In effect; shows how carrier makers manage duties |
| In September 2025, DICK'S Sporting Goods completed its acquisition of Foot Locker. | Completed; adds buying scale across footwear and apparel |
| In June 2026, Bass Pro Shops announced its Outdoor World store in Sayreville, New Jersey. | Grand opening set for November 2026; adds large-format space in the Northeast |
| In October 2026, Johnson Outdoors combined its Minn Kota and Humminbird fishing electronics under the Minn Kota name. | Launched; more products due in January 2027 |
Satellite messaging and PFAS-free materials set premiums
- Satellite messaging lets hikers, hunters and anglers send texts and SOS alerts beyond cell coverage, and it now ships inside watches as well as handheld devices.
- Fluorine-free membranes replace PFAS-treated waterproof layers in shells and footwear, which brands need before state exemptions for severe-weather apparel end.
- Wireless fishing electronics link fish finders and trolling motors without cables, so anglers can trace a route on screen and let the motor follow it.
- Powered cooling removes the need for ice in premium coolers, and YETI plans to release its first electric Power Cooler in 2027.
Need a Custom Version of This Report?
Tailor the scope, geography, or segments to your exact requirements.
- Custom geography or segment scope
- Direct access to our analyst team
Brand owners and big-box chains share control of supply
Competition in U.S. outdoor recreation products is split between brand owners and the chains that sell their products. Columbia Sportswear and VF Corporation, through The North Face and Timberland, lead in technical apparel and footwear, while Amer Sports pushes Arc'teryx and Salomon at higher price points through its own stores. YETI competes on premium coolers and drinkware, Garmin on GPS watches and satellite communicators, Thule on bike and cargo carriers, and Johnson Outdoors on trolling motors and fish finders. The Kinetic Group, which Czechoslovak Group bought from Vista Outdoor, supplies Federal and Remington ammunition, a repeat purchase for hunters and sport shooters. DICK'S Sporting Goods, Academy Sports and Outdoors and Bass Pro Shops control much of the large-format shelf space and sell private labels beside national brands. Tariffs have pushed most suppliers to raise prices for 2026, so the ability to hold sell-through at higher prices now separates leaders from the rest.
How is supply organized, and where do margins sit?
Supply is moderately concentrated within individual categories but fragmented across the market overall. Brand owners design products and source most apparel and footwear from Asian factories, so the 12% average footwear tariff noted above lands on them first. Three national chains and REI Co-op control the large-format shelf, and their private labels cap prices in entry tiers. Entry barriers are brand trust, electronics patents and chain shelf access, and margins are highest for premium brands that sell through their own stores.
Companies profiled and their roles in this market
| Company | Type | Role in the market |
|---|---|---|
| Columbia Sportswear Company | Brand owner | Sells Columbia, Sorel and Mountain Hardwear apparel, footwear and gear nationwide |
| VF Corporation | Brand owner | Sells The North Face and Timberland outdoor apparel and footwear |
| YETI Holdings, Inc. | Brand owner | Sells premium coolers, drinkware and bags; powered cooler planned for 2027 |
| Garmin Ltd. | Connected-gear maker | Sells outdoor watches, handheld GPS units and inReach satellite communicators |
| Amer Sports, Inc. | Brand owner | Sells Arc'teryx shells and Salomon footwear through wholesale and own U.S. stores |
| Thule Group AB | Specialist | Makes bike carriers in Connecticut and sells racks, roof boxes and packs |
| Johnson Outdoors Inc. | Specialist | Sells Minn Kota trolling motors and fish finders with Humminbird Imaging |
| The Kinetic Group (CSG) | Ammunition maker | Federal, Remington, CCI and Speer hunting and sport-shooting ammunition |
| DICK'S Sporting Goods, Inc. | Sporting goods chain | Runs DICK'S, House of Sport and Public Lands stores; owns Foot Locker |
| Academy Sports and Outdoors, Inc. | Sporting goods chain | Runs 324 stores in 21 states with national and private-label outdoor brands |
| Bass Pro Shops | Retailer and brand owner | Runs close to 200 Bass Pro Shops and Cabela's stores with own brands |
Repeat buyers will decide market share to 2035
Credence Research's view is that the next decade in U.S. outdoor recreation products will be won on retention rather than recruitment. The participant base is already at a record, but outings are less frequent and churn is high, so the brands and chains that turn first-time buyers into repeat customers will gain share. Connected devices with service plans, resale and trade-in programs, and fluorine-free rainwear are the three levers that both raise spending per buyer and give a reason to return. Fishing, hunting and shooting gear remains the largest pool at 40.0% of 2025 value, yet its slower growth means suppliers there must defend share through store presence and electronics.
Spending, participation and price data anchor the estimate
The report uses 2025 as the base year and forecasts to 2035. Market values come from the Credence Research model, which combines Bureau of Economic Analysis consumer spending on sporting equipment, supplies, guns and ammunition, national bicycle spending data, outdoor retail sales trends and participation counts from trade associations, and retail price observations. Segment, channel and regional splits are Credence Research estimates built from these sources and Census Bureau population data. The sources used are the Bureau of Economic Analysis, the Census Bureau, the National Park Service, trade associations for the outdoor, fishing, shooting, footwear and ski industries, company filings and releases, and national press reports.
Better and connected gear outpaces volume through 2035
Spending on U.S. outdoor recreation products is set to grow from USD 86.40 billion in 2025 to USD 134.82 billion by 2035 at a 4.55% CAGR, a steady pace that reflects a mature category adding value through better and connected products more than through volume. Camping, hiking and climbing equipment grows at 5.4% a year, the fastest product type, while fishing, hunting and shooting gear keeps the largest share. The South gains share because its population keeps growing faster than other regions. Tariffs and record angler churn weigh on demand in 2026 and 2027, so the brands that turn newer participants into repeat buyers should lead the market by 2035.
Tariffs and participation decide the range of outcomes to 2035
The range of outcomes depends mainly on how long tariffs keep prices elevated and whether new participants stay active. A downside path follows if duties remain high, churn stays at record levels and firearm demand keeps falling. The base case assumes participation grows slowly, prices settle at their 2026 levels and chains open stores at announced rates. An upside path needs the Legacy Restoration Fund renewed, connected-gear service plans to spread beyond core users and older adults to keep joining.
| Scenario | CAGR, 2026–2035 | Value, 2035 | What has to hold |
|---|---|---|---|
| Downside | 3.2% | USD 120.46 billion | Tariffs stay high, angler churn persists and firearm background checks keep declining |
| Base | 4.55% | USD 134.82 billion | Participation grows slowly, prices settle and chains open stores at announced rates |
| Upside | 5.8% | USD 149.40 billion | Park maintenance funding is renewed and connected devices spread beyond core users |
Frequently Asked Questions
How big is the U.S. outdoor recreation products market?
Which region leads the market?
Which product type holds the largest share?
Which technology segment grows fastest?
How many Americans take part in outdoor recreation?
How do tariffs affect outdoor gear prices?
Who are the leading companies in this market?
What are the main challenges for sellers?
Table of Content
Chapter 1 Market Segmentation
- 1.1 Segmentation Framework
- 1.1.1 Product and Service Classification
- 1.1.2 Application and End-Use Classification
- 1.1.3 Technology and Solution Classification
- 1.1.4 Customer and Distribution Channel Classification
- 1.1.5 Geographic Segmentation
- 1.1.6 Market Segment Definitions and Boundaries
- 1.2 By Product Type
- 1.2.1 Technical Apparel & Footwear
- 1.2.2 Camping, Hiking & Climbing Equipment
- 1.2.3 Fishing, Hunting & Shooting Gear
- 1.2.4 Wheeled, Snow & Water Recreation Products
- 1.3 By Application
- 1.3.1 Day Hiking & Trail Recreation
- 1.3.2 Camping & Backpacking
- 1.3.3 Fishing & Hunting
- 1.3.4 Adventure & Seasonal Sports
- 1.4 By Technology
- 1.4.1 Conventional Outdoor Gear
- 1.4.2 Smart & Connected Gear
- 1.4.3 Advanced Performance Materials
- 1.4.4 Circular & Repairable Products
Chapter 2 Introduction
- 2.1 Report Objectives and Scope
- 2.2 Product Definition and Industry Terminology
- 2.3 Market Inclusions and Exclusions
- 2.4 Research Process
- 2.4.1 Primary Research and Expert Interviews
- 2.4.2 Secondary Research and Source Review
- 2.4.3 Top-Down and Bottom-Up Estimation
- 2.4.4 Data Triangulation and Verification
- 2.5 Market Size Measurement Basis
- 2.5.1 2025: USD 86.40 billion → 2035: USD 134.82 billion
- 2.6 Historical and Forecast Reference Periods
- 2.6.1 Historical Period: 2018-2025
- 2.6.2 Base Year: 2025
- 2.6.3 Forecast Period: 2025-2035
- 2.7 Research Assumptions and Limitations
Chapter 3 Executive Summary
- 3.1 Market Snapshot and Key Findings
- 3.2 Base-Year Market Size, 2025
- 3.3 Forecast Market Size, 2035
- 3.4 Revenue and Volume Growth Outlook
- 3.5 Key Demand and Supply Indicators
- 3.6 Leading Market Segments
- 3.7 Fastest-Growing Market Opportunities
- 3.8 Regional Performance Highlights
- 3.9 Technology and Industry Transformation
- 3.10 Competitive Landscape Summary
- 3.11 Analyst View and Strategic Implications
Chapter 4 U.S. Outdoor Recreation Products Market Trends and Developments
- 4.1 Historical Industry Development, 2018-2025
- 4.2 Recent Market Trends and Developments
- 4.3 Demand and Customer Behavior Trends
- 4.4 Technology and Product Innovation
- 4.5 Artificial Intelligence, Automation and Digitalization
- 4.6 Local Manufacturing and Supply Chain Realignment
- 4.7 Industry Partnerships, Mergers and Acquisitions
- 4.8 Sustainability and Circular Economy Developments
- 4.9 Government and Private Sector Investment Trends
- 4.10 Emerging Business Models and Commercialization
- 4.11 Industry Developments and Announcements
Chapter 5 U.S. Outdoor Recreation Products Market Production, Supply and Demand Analysis
- 5.1 Demand Trend and Consumption Analysis, 2018-2025
- 5.2 Demand Forecast, 2025-2035
- 5.3 Production and Output Trend, 2018-2025
- 5.4 Production and Output Forecast, 2025-2035
- 5.5 Installed Capacity and Capacity Utilization
- 5.6 Company-Wise Production Plants and Statistics
- 5.6.1 Installed Production Capacity
- 5.6.2 Actual Production
- 5.6.3 Planned Capacity and Expansion Targets
- 5.7 Supply Chain Structure and Procurement Trends
- 5.8 Supply-Demand Gap and Bottlenecks
- 5.9 Import Dependence and Sourcing Structure
- 5.10 Contract Manufacturing and Outsourcing
- 5.11 Regional Supply and Demand Concentration
Chapter 6 U.S. Outdoor Recreation Products Market Pricing Analysis
- 6.1 Pricing Structure and Measurement
- 6.2 Historical Pricing Trends, 2018-2025
- 6.3 Pricing Outlook, 2025-2035
- 6.4 Average Selling Price and Unit Economics
- 6.5 Pricing by Product and Market Segment
- 6.6 Geographic Pricing Differences
- 6.7 Key Input, Energy, Labor and Logistics Costs
- 6.8 Contract Pricing and Purchasing Models
- 6.9 Pricing Sensitivity and Competitive Positioning
- 6.10 Price, Margin and Profitability Implications
Chapter 7 U.S. Outdoor Recreation Products Market Dynamics
- 7.1 Market Growth Drivers
- 7.1.1 Demand-Side Drivers
- 7.1.2 Technology and Innovation Drivers
- 7.1.3 Infrastructure and Investment Drivers
- 7.1.4 Regulatory and Policy Drivers
- 7.2 Market Restraints
- 7.2.1 Cost and Affordability Constraints
- 7.2.2 Technology and Adoption Barriers
- 7.2.3 Supply Chain and Operational Constraints
- 7.3 Market Challenges
- 7.3.1 Competitive Pressure and Margin Erosion
- 7.3.2 Skills, Infrastructure and Implementation Gaps
- 7.4 Emerging Market Opportunities
- 7.5 Market Dynamics Impact and Time-Horizon Assessment
Chapter 8 U.S. Outdoor Recreation Products Value Chain Analysis
- 8.1 Industry Value Chain Overview
- 8.2 Upstream Suppliers and Critical Inputs
- 8.3 Technology and Component Providers
- 8.4 Manufacturing or Service Delivery
- 8.5 Distribution, Channel Partners and Integrators
- 8.6 Downstream Applications and End Users
- 8.7 Value Addition and Profit Pools
- 8.8 Vertical Integration and Outsourcing
- 8.9 Supplier Concentration and Risk
- 8.10 Supply Chain Localization and Resilience
Chapter 9 U.S. Outdoor Recreation Products Market Regulations and Policies
- 9.1 Relevant Laws, Standards and Compliance Frameworks
- 9.2 Product, Service, Safety and Quality Requirements
- 9.3 Government Policies, Incentives and Subsidies
- 9.4 Imports, Exports and Trade Barriers
- 9.5 Public Procurement and Local Content Requirements
- 9.6 Environmental and Sustainability Compliance
- 9.7 Upcoming Policy Changes and Market Implications
Chapter 10 U.S. Outdoor Recreation Products Market Hotspots and Opportunities
- 10.1 Market Opportunity Mapping and Growth Hotspots
- 10.2 High-Growth Applications and Customer Groups
- 10.3 Underserved Markets and White-Space Opportunities
- 10.4 Emerging Technology and Product Opportunities
- 10.5 New Capacity and Investment Hotspots
- 10.6 Market Entry and Expansion Opportunities
- 10.7 Distribution and Partnership Opportunities
- 10.8 Near-Term and Long-Term Commercial Potential
- 10.9 Opportunity Attractiveness and Execution Risks
Chapter 11 U.S. Outdoor Recreation Products Market Outlook, 2025-2035
- 11.1 Market Size and Analysis
- 11.1.1 Revenue (Market Measurement: 2025: USD 86.40 billion → 2035: USD 134.82 billion)
- 11.1.2 Market Volume and Quantity Sold
- 11.1.3 Historical Market Size, 2018-2025
- 11.1.4 Base-Year Market Size, 2025
- 11.2 Market Forecast, 2025-2035
- 11.2.1 Revenue Forecast to 2035
- 11.2.2 Volume Forecast to 2035
- 11.2.3 CAGR and Year-on-Year Growth
- 11.2.4 Incremental Revenue Opportunity
- 11.3 Forecast Assumptions and Scenario Analysis
- 11.3.1 Base-Case Forecast
- 11.3.2 Optimistic and Conservative Scenarios
- 11.3.3 Technology, Pricing and Policy Sensitivities
- 11.4 Market Attractiveness and Growth Outlook
Chapter 12 U.S. Outdoor Recreation Products Market Segmentation and Outlook
- 12.1 Segmentation Summary and Market Shares, 2025
- 12.2 Largest and Fastest-Growing Segments
- 12.3 By Product Type - Market Size and Forecast, 2025-2035
- 12.3.1 Segment Definition and Scope
- 12.3.2 Historical Market Size, 2018-2025
- 12.3.3 Revenue Forecast, 2025-2035
- 12.3.4 Volume Forecast, 2025-2035
- 12.3.5 Base-Year Market Share, 2025
- 12.3.6 Segment CAGR and Growth Drivers
- 12.3.7 Subsegment Market Size and Forecast
- 12.3.7.1 Technical Apparel & Footwear
- 12.3.7.2 Camping, Hiking & Climbing Equipment
- 12.3.7.3 Fishing, Hunting & Shooting Gear
- 12.3.7.4 Wheeled, Snow & Water Recreation Products
- 12.3.8 Subsegment Pricing and Adoption Trends
- 12.3.9 Leading Suppliers and Competition
- 12.3.10 Regional Demand and Opportunities
- 12.4 By Application - Market Size and Forecast, 2025-2035
- 12.4.1 Segment Definition and Scope
- 12.4.2 Historical Market Size, 2018-2025
- 12.4.3 Revenue Forecast, 2025-2035
- 12.4.4 Volume Forecast, 2025-2035
- 12.4.5 Base-Year Market Share, 2025
- 12.4.6 Segment CAGR and Growth Drivers
- 12.4.7 Subsegment Market Size and Forecast
- 12.4.7.1 Day Hiking & Trail Recreation
- 12.4.7.2 Camping & Backpacking
- 12.4.7.3 Fishing & Hunting
- 12.4.7.4 Adventure & Seasonal Sports
- 12.4.8 Subsegment Pricing and Adoption Trends
- 12.4.9 Leading Suppliers and Competition
- 12.4.10 Regional Demand and Opportunities
- 12.5 By Technology - Market Size and Forecast, 2025-2035
- 12.5.1 Segment Definition and Scope
- 12.5.2 Historical Market Size, 2018-2025
- 12.5.3 Revenue Forecast, 2025-2035
- 12.5.4 Volume Forecast, 2025-2035
- 12.5.5 Base-Year Market Share, 2025
- 12.5.6 Segment CAGR and Growth Drivers
- 12.5.7 Subsegment Market Size and Forecast
- 12.5.7.1 Conventional Outdoor Gear
- 12.5.7.2 Smart & Connected Gear
- 12.5.7.3 Advanced Performance Materials
- 12.5.7.4 Circular & Repairable Products
- 12.5.8 Subsegment Pricing and Adoption Trends
- 12.5.9 Leading Suppliers and Competition
- 12.5.10 Regional Demand and Opportunities
- 12.6 Segment Growth Comparison
- 12.7 Segment Attractiveness and Priority Matrix
Chapter 13 U.S. Outdoor Recreation Products End-Use and Application Market Outlook
- 13.1 End-Use Industry and Customer Demand Structure
- 13.2 Leading Applications and Customer Groups
- 13.3 End-Use Market Size, Share and Forecast
- 13.4 Major End-Use Industry Deep Dives
- 13.4.1 Customer Requirements and Use Cases
- 13.4.2 Demand and Replacement Cycles
- 13.4.3 Technical and Regulatory Considerations
- 13.4.4 Purchasing and Procurement Models
- 13.4.5 Leading Vendors and Distribution Channels
- 13.4.6 Forecast and Commercial Opportunities
- 13.5 Emerging Applications and Cross-Segment Demand
- 13.6 End-Use Industry Investment Priorities
Chapter 14 U.S. Outdoor Recreation Products Geographic Market Outlook, 2025-2035
- 14.1 Domestic Market Distribution and Demand Clusters
- 14.2 State- or Province-Wise Market Size and Forecast, 2025-2035
- 14.3 City and Metropolitan Market Outlook
- 14.4 Industrial, Manufacturing and Commercial Clusters
- 14.5 Geographic Concentration of Key End Users
- 14.6 Local Pricing and Purchasing Differences
- 14.7 Domestic Production Facilities and Capacity Map
- 14.8 Local Infrastructure and Project Pipeline
- 14.9 State-Level Policy and Incentive Differences
- 14.10 Subnational Investment Hotspots and Opportunities
- 14.11 Distribution and Logistics Networks
- 14.12 Domestic Competitive Footprint
Chapter 15 U.S. Outdoor Recreation Products Technology, Innovation and Sustainability Outlook
- 15.1 Technology Landscape and Maturity
- 15.2 Product, Process and Service Innovation
- 15.3 AI, Automation and Digital Tools in the Industry
- 15.4 Technology Adoption and Performance Benchmarking
- 15.5 Innovation Pipeline and R&D Investment
- 15.6 Patent and Intellectual Property Trends
- 15.7 Energy Efficiency and Resource Management
- 15.8 Sustainability, Recycling and Circularity
- 15.9 Technology Roadmap, 2025-2035
- 15.10 Risks of Obsolescence and Technology Substitution
Chapter 16 U.S. Outdoor Recreation Products Market Key Strategic Imperatives
- 16.1 Growth and Market Entry Priorities
- 16.2 High-Return Products and Segments
- 16.3 Pricing, Profitability and Cost Optimization
- 16.4 Technology Investment and Product Differentiation
- 16.5 Supply Chain Localization and Resilience
- 16.6 Distribution and Customer Acquisition
- 16.7 Partnership, Acquisition and Capacity Strategy
- 16.8 Regional Expansion Priorities
- 16.9 Short-, Medium- and Long-Term Actions
Chapter 17 Competition Outlook
- 17.1 Industry Competition Characteristics
- 17.2 Market Structure and Concentration
- 17.3 Market Share and Competitive Positioning, 2025
- 17.4 Company-Wise Revenue and Product Benchmarking
- 17.5 Production and Service Capacity Benchmarking
- 17.6 Technology, Pricing and Differentiation
- 17.7 Regional Footprint and Distribution Strength
- 17.8 Mergers, Acquisitions and Strategic Alliances
- 17.9 New Entrants and Competitive Threats
- 17.10 Porter's Five Forces and Industry Attractiveness
- 17.11 Competitive Outlook, 2025-2035
Chapter 18 Company Profiles
- 18.1 Company Coverage and Selection Criteria
- 18.2 Columbia Sportswear Company
- 18.2.1 Business Description
- 18.2.2 Company Ownership and Geographic Presence
- 18.2.3 Product and Service Portfolio
- 18.2.4 Manufacturing and Operating Footprint
- 18.2.5 Production Capacity and Expansion Plans
- 18.2.6 Financial Performance and Investment
- 18.2.7 Market Share and Competitive Position
- 18.2.8 Technology and Innovation Capabilities
- 18.2.9 Strategic Alliances or Partnerships
- 18.2.10 Recent Developments
- 18.2.11 Growth Strategy and Outlook
- 18.3 VF Corporation
- 18.4 YETI Holdings, Inc.
- 18.5 Garmin Ltd.
- 18.6 Amer Sports, Inc.
- 18.7 Thule Group AB
- 18.8 Johnson Outdoors Inc.
- 18.9 The Kinetic Group (CSG)
- 18.10 DICK'S Sporting Goods, Inc.
- 18.11 Academy Sports and Outdoors, Inc.
- 18.12 Bass Pro Shops
- 18.13 Other Relevant Market Participants
Note: Every listed company is profiled on the structure shown under the first company. The company list is preliminary and may change based on research findings, market developments, data availability and client requirements.
Chapter 19 Disclaimer
- 19.1 Research and Forecast Disclaimer
- 19.2 Data Source and Estimation Limitations
Note: The depth of individual sections depends on data availability for this market. Volume, capacity, trade and other unit-based metrics are included where applicable.