App ordering has become a routine habit for U.S. households
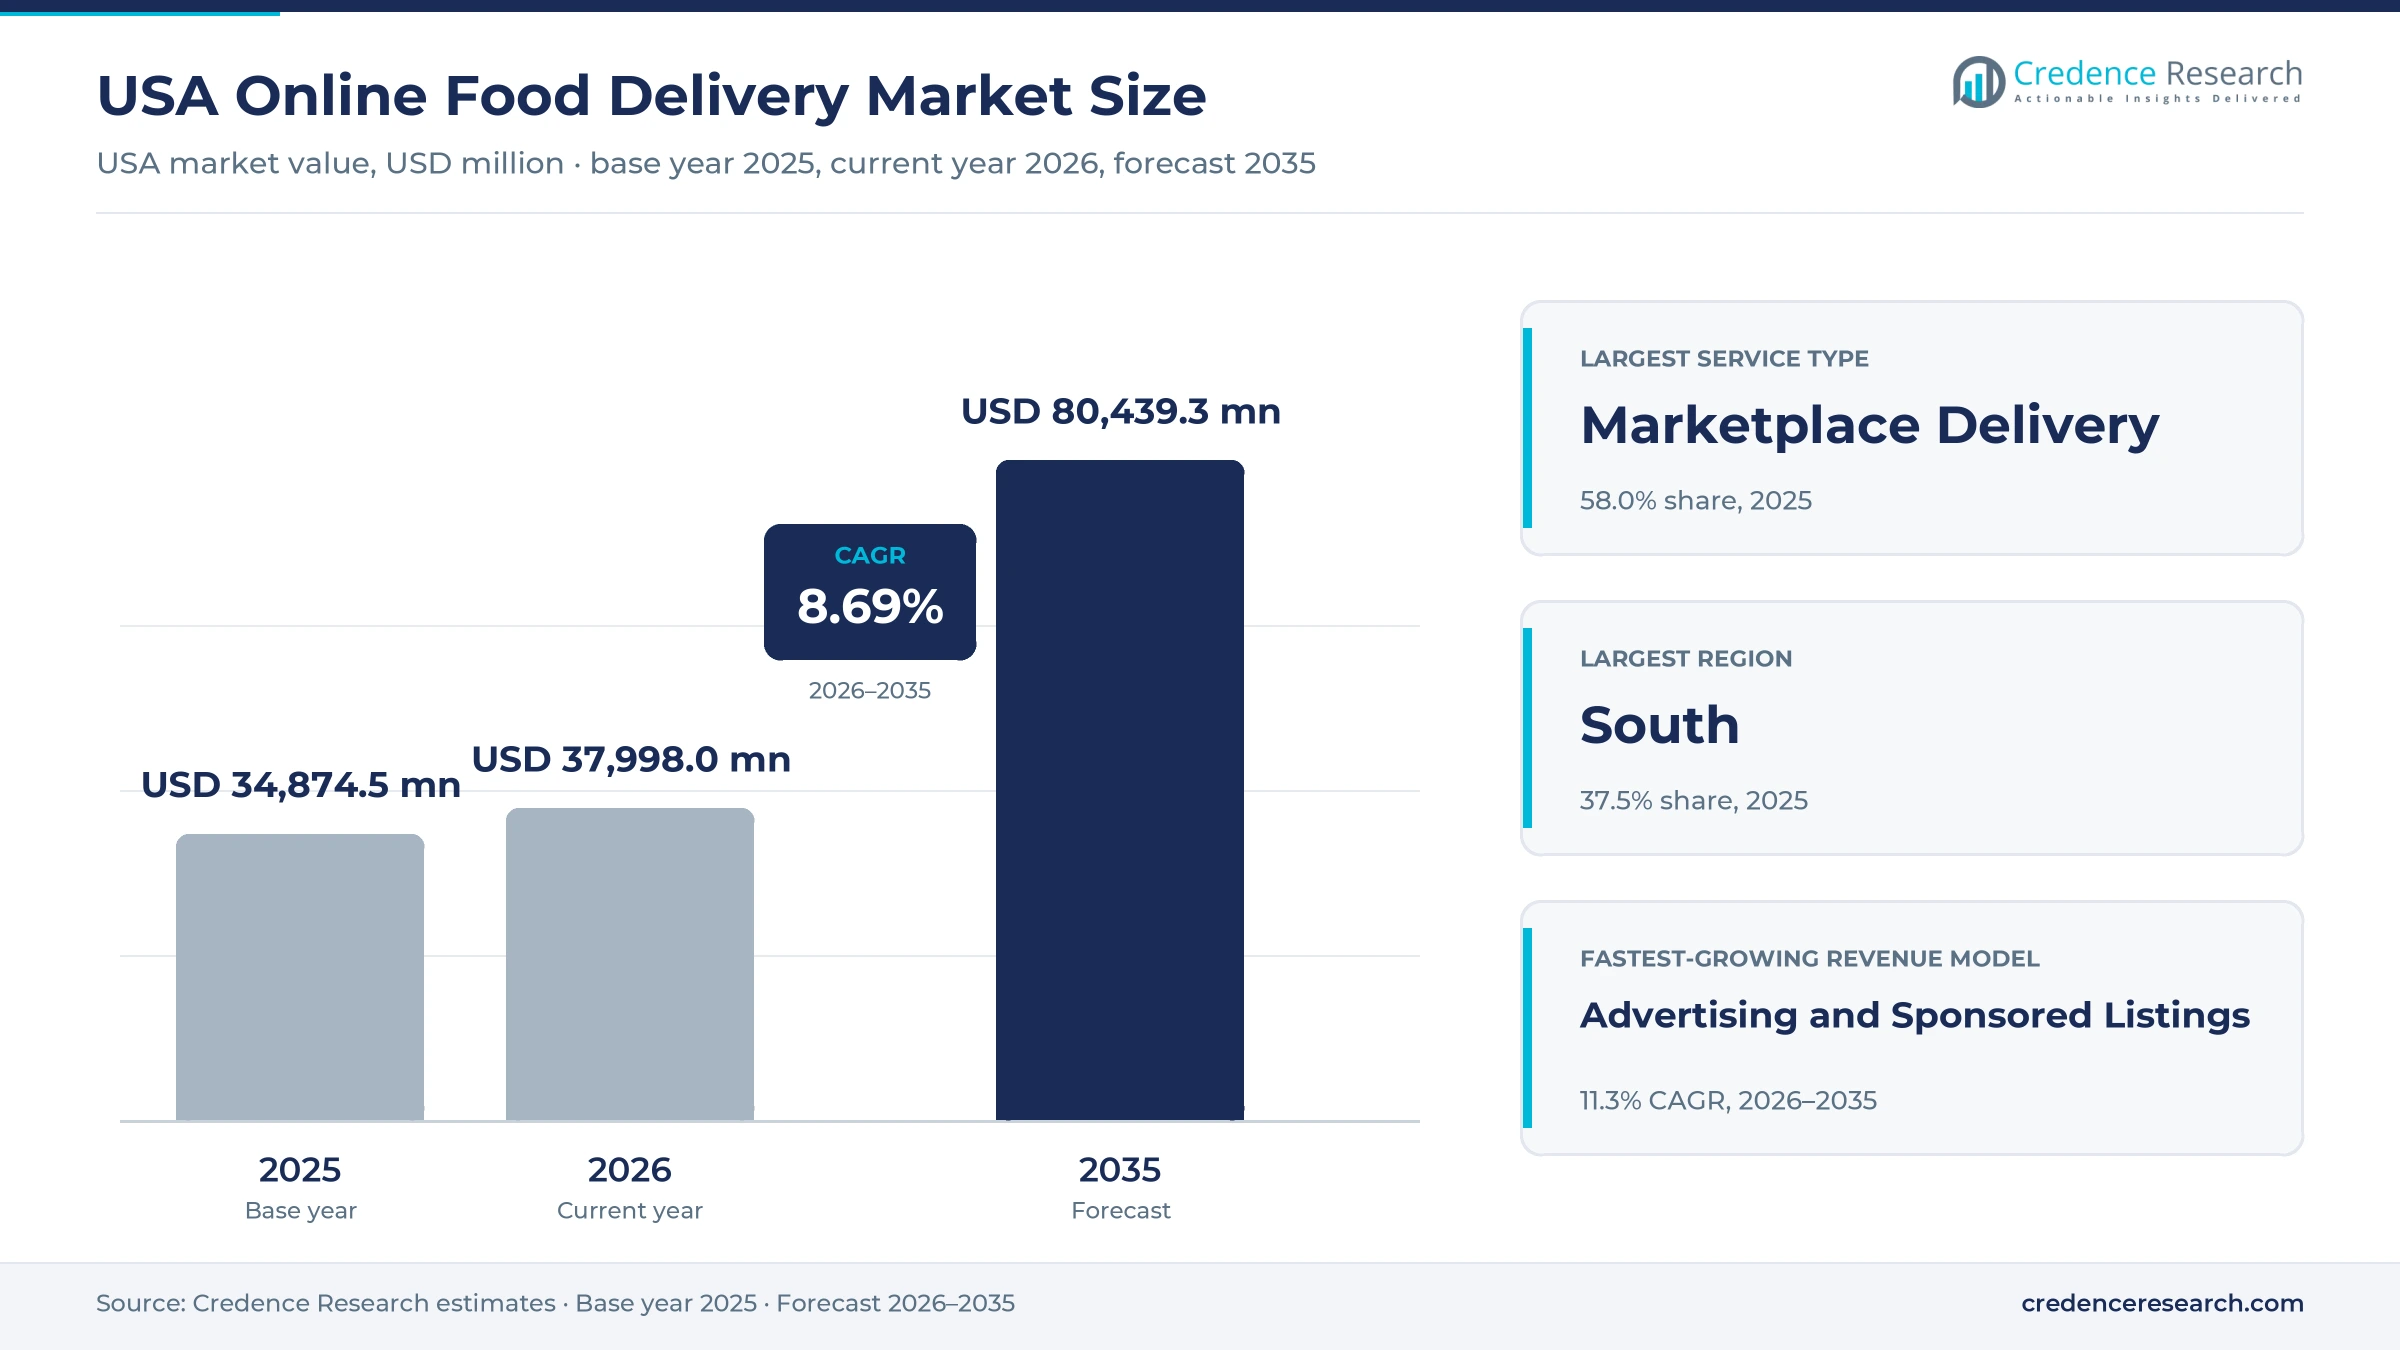
The USA online food delivery market was valued at USD 34.87 billion in 2025 and is projected to increase from USD 38.00 billion in 2026 to USD 80.44 billion by 2035, registering a CAGR of 8.69% during 2026–2035. Demand rests on three habits that now hold across most households, ordering dinner from a phone, paying a monthly membership to avoid delivery fees, and adding groceries and household goods to the same app. Restaurants supply that demand because off-premise orders fill kitchens on slow dine-in nights, while platforms earn from commissions, consumer fees and a fast-growing advertising business. The South held 37.5% of 2025 value, the largest share of any region, because it has the largest and fastest-growing population and dense suburban restaurant corridors. The same region is also the fastest-growing at 9.1% a year. On the commercial side, the leading platforms are pushing into grocery and retail, testing sidewalk and road robots, and opening checkout inside AI assistants, which is widening the range of orders that reach a doorstep within an hour.
Platform fees, commissions and ads form one estimate
The estimate measures what delivery services earn from orders placed online in the United States, meaning merchant commissions, consumer delivery and service fees, membership fees and advertising paid by merchants and brands. It covers restaurant marketplaces, first-party restaurant delivery, grocery and convenience delivery, and scheduled catering delivery ordered through apps, websites, embedded restaurant ordering and connected devices.
The estimate excludes the food and grocery value itself, tips paid to couriers, phone orders, dine-in sales and meal kits shipped by parcel carriers. The value chain runs from restaurants, grocers and retailers through ordering platforms and dispatch software to independent couriers, store drivers, robots and drones.
USA Online Food Delivery Market Insights
- The USA online food delivery market was valued at USD 34.87 billion in 2025 and is projected to reach USD 80.44 billion by 2035, registering a CAGR of 8.69% during 2026–2035.
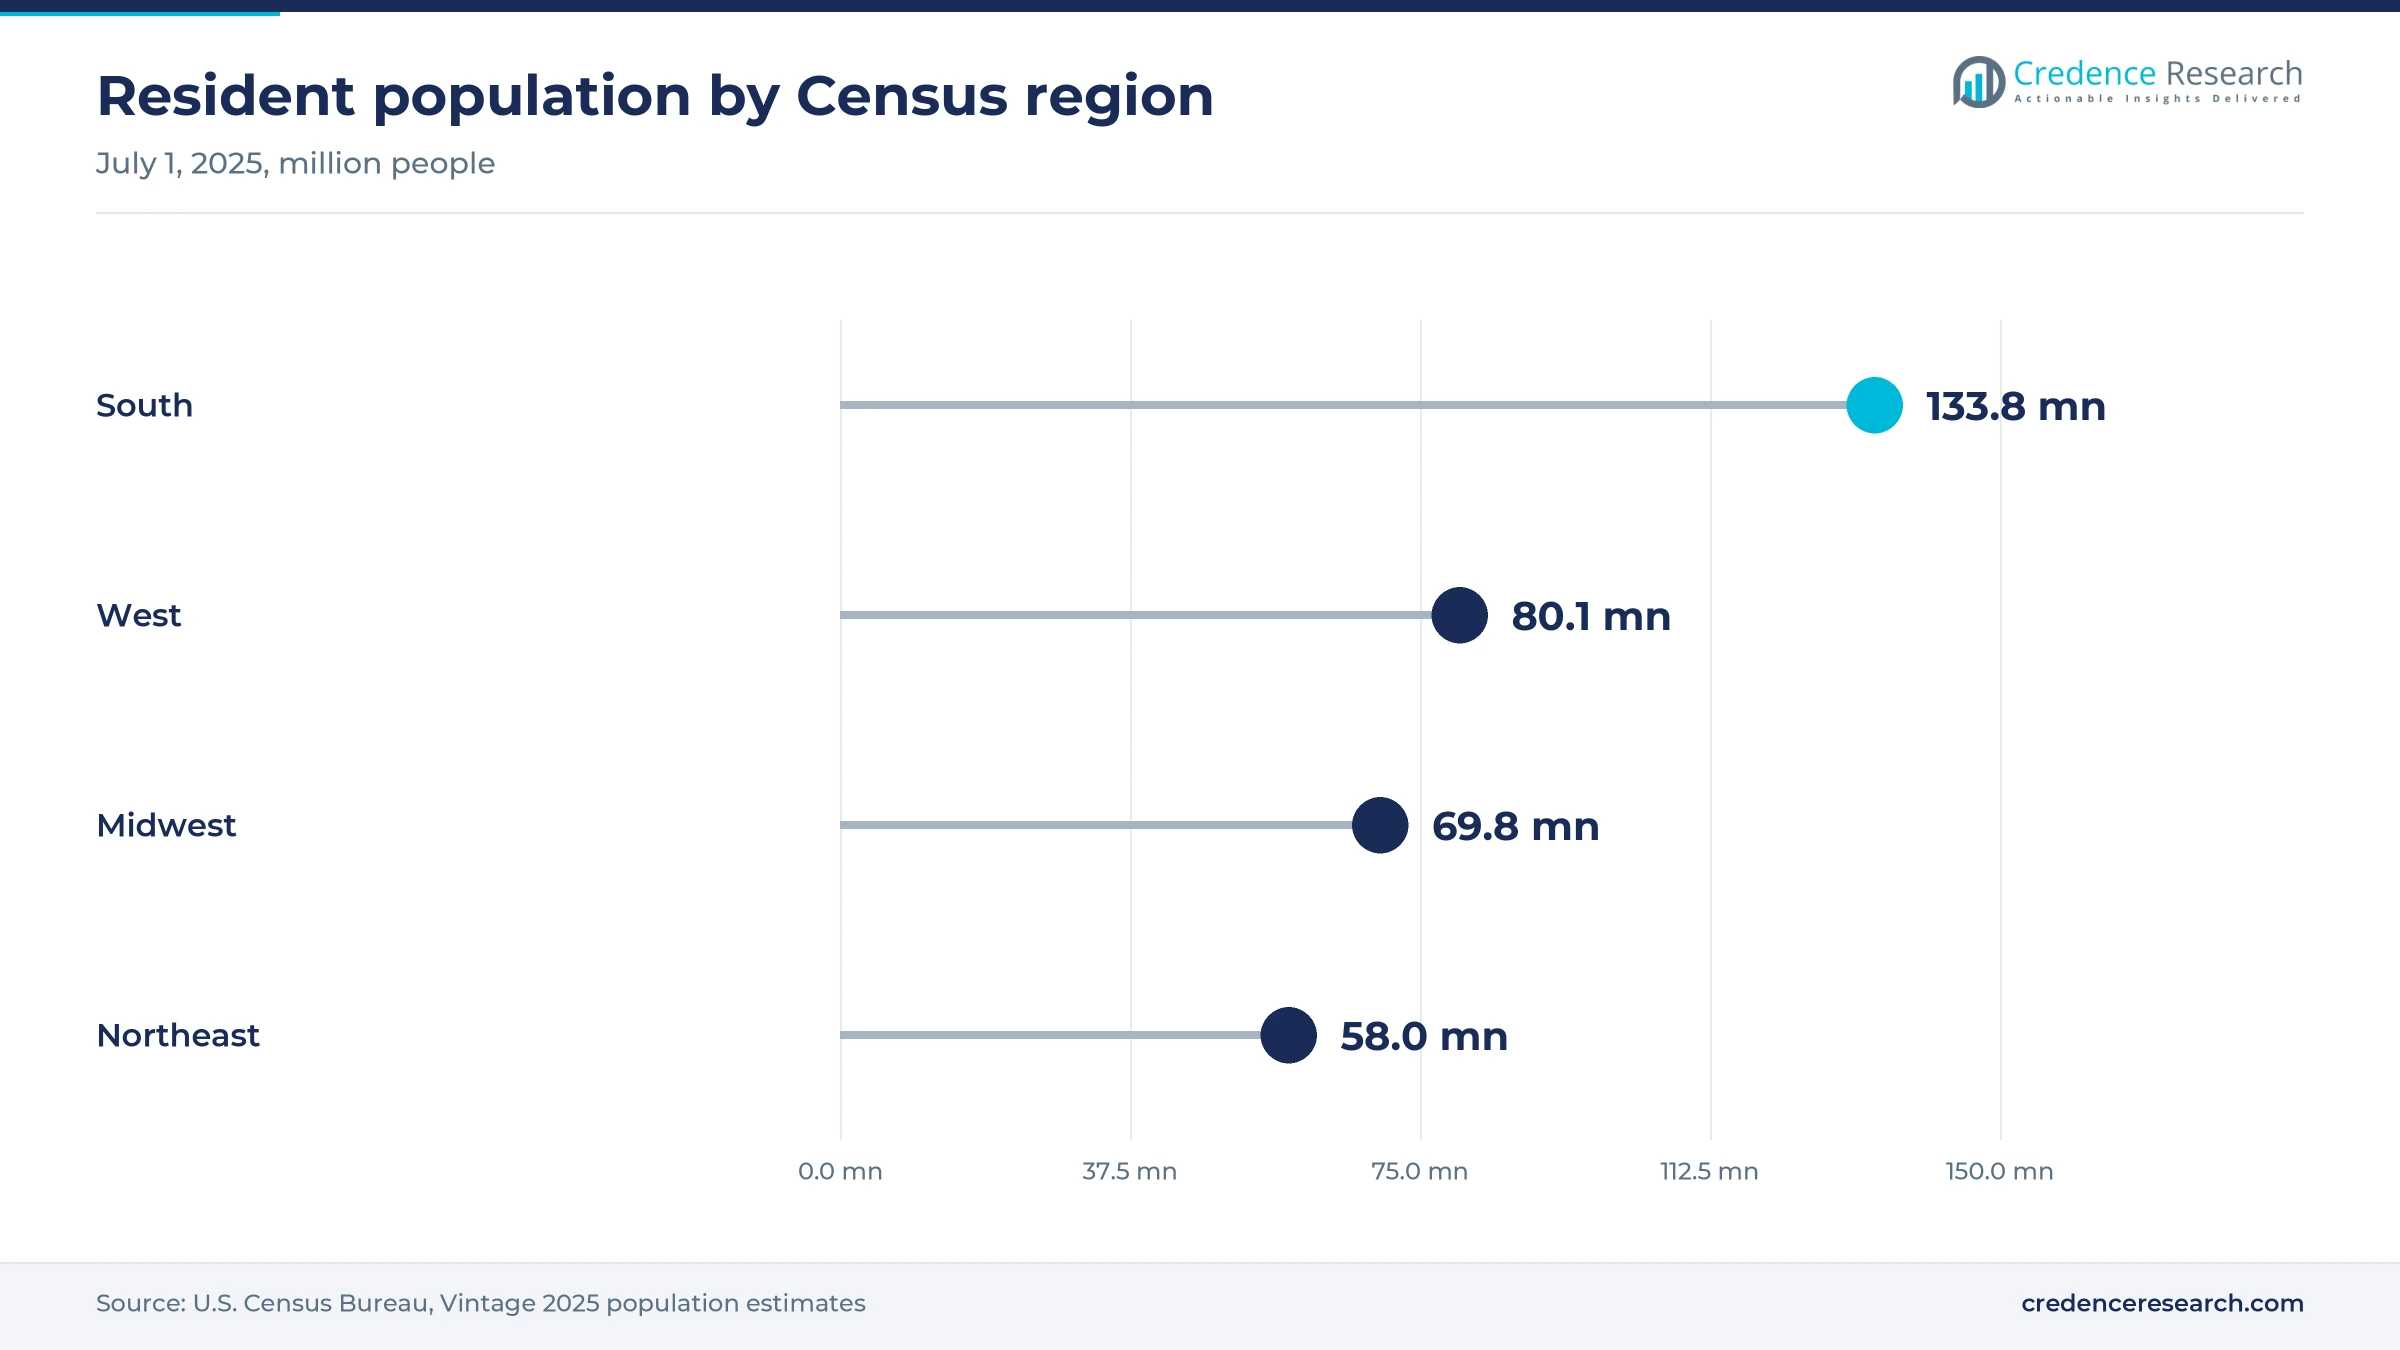
- The South held 37.5% of 2025 value, because its population reached 133.8 million in July 2025 after growing 6.0% since 2020, the fastest of any region.
- Marketplace delivery led with 58.0% of 2025 value, because DoorDash, Uber Eats and Grubhub carry most restaurant orders across U.S. metro areas.
- Uber One reached 36 million members by November 2025, and members drove about two-thirds of Uber delivery gross bookings, according to Uber.
- In December 2025, the Federal Trade Commission secured a $60 million refund settlement from Instacart over fee and subscription disclosures.
Restaurant marketplaces lead as grocery grows fastest
Why do restaurant marketplaces still earn the most?
Based on service type, the market is categorized into marketplace delivery, first-party restaurant delivery, grocery and convenience delivery, and scheduled catering delivery. Marketplace Delivery led with 58.0% of 2025 value, because one app gives diners thousands of restaurants, and DoorDash said U.S. restaurant Marketplace order value grew in the fourth quarter of 2025 at its second-highest rate in fifteen quarters. Grocery and Convenience Delivery grows fastest at 10.3% a year, as Walmart said in February 2026 that 35% of its store-fulfilled U.S. orders arrived in under three hours. Faster grocery drops pull weekly baskets onto the same apps.
How do households and campus users split the order flow?
Based on customer type, the market is categorized into individual households, workplace and corporate buyers, students and campus users, and institutional buyers. Individual Households led with 74.0% of 2025 value, because dinner and weekend orders come from homes, and DoorDash reported double-digit growth in new U.S. restaurant consumers in the fourth quarter of 2025. Students and Campus Users grow fastest at 9.8% a year, as Grubhub worked with 360 universities in November 2024, according to Restaurant Dive. Campus meal plans that load into an app turn dining dollars into delivery and pickup orders.
Why do commissions lead while ads gain ground?
Based on revenue model, the market is categorized into merchant commissions, consumer delivery and service fees, subscription memberships and advertising and sponsored listings. Merchant Commissions led with 46.0% of 2025 value, because restaurants pay a commission on every marketplace order, and Wonder paid $650 million in January 2025 for Grubhub, a commission business with about 375,000 merchants. Advertising and Sponsored Listings grows fastest at 11.3% a year, as DoorDash said it nearly doubled the number of advertising partners on its Symbiosis platform from June to December 2025. Sponsored listings earn high margins because they use traffic the platform already has.
Why do phone apps carry most orders?
Based on distribution channel, the market is categorized into mobile applications, websites, embedded restaurant ordering and voice and connected devices. Mobile Applications led with 72.0% of 2025 value, because push alerts, saved cards and live tracking make repeat ordering easy, and DoorDash said over 30% of its U.S. monthly active users engaged with grocery and retail items in December 2025, a habit built inside the app. Voice and Connected Devices grow fastest at 11.7% a year, as Instacart opened full checkout inside ChatGPT on Dec. 8, 2025. Assistants that build a cart from a request start from a small base.
| Segment Group | Leading Sub-segment | Share, 2025 | Fastest-growing Sub-segment | CAGR, 2026–2035 |
|---|---|---|---|---|
| By Service Type | Marketplace Delivery | 58.0% | Grocery and Convenience Delivery | 10.3% |
| By Customer Type | Individual Households | 74.0% | Students and Campus Users | 9.8% |
| By Revenue Model | Merchant Commissions | 46.0% | Advertising and Sponsored Listings | 11.3% |
| By Distribution Channel | Mobile Applications | 72.0% | Voice and Connected Devices | 11.7% |
Restaurants pay 15% to 30% while diners pay per order
Pricing in the USA online food delivery market has two sides. Restaurants pay a commission on each order, set by the visibility and delivery radius they buy, or a flat monthly fee for direct-ordering software that charges no commission. Diners pay delivery and service fees per order or a membership that removes delivery fees above a minimum basket. Courier pay floors, restaurant pushback on commissions and fee disclosure rules move these prices. The gap between pickup and delivery commission rates shows how much of the cost sits in the last mile, which is why platforms invest in batching, robots and memberships.
| Offer or fee | Typical price or fee | Basis |
|---|---|---|
| DoorDash Basic plan, delivery | 15% commission per order | DoorDash merchant pricing page, November 2026 |
| DoorDash Plus plan, delivery | 25% commission per order | DoorDash merchant pricing page, November 2026 |
| DoorDash Premier plan, delivery | 30% commission per order | DoorDash merchant pricing page, November 2026 |
| DoorDash pickup orders | 6% commission per order | DoorDash merchant pricing page, November 2026 |
| ChowNow direct ordering plans | $179 to $399 a month, no commission | ChowNow and U.S. Foods offer sheet, 2026 |
| Amazon same-day perishable delivery | Free over $25 for Prime, $2.99 below, $12.99 non-Prime | GeekWire, December 2025 |
| ezCater average catering order | About $420 an order | ezCater Feeding the Workplace report, May 2025 |
Request a Free Sample
Fill in your details and we'll send you a free sample report.
- Sample data tables & charts
- Research methodology
Phones, dense restaurant supply and memberships lift orders
How does near-universal phone ownership lift app orders?
Smartphone access is no longer a limit on demand, so growth now depends on how often each household orders rather than on reaching new users. According to the Pew Research Center, 91% of U.S. adults owned a smartphone in a survey run from February to June 2025, a share that has held at about 91% since June 2024. Ownership reached 97% among adults under 50 and 78% among adults 65 and older, which leaves older households as the main group still to win. Mobile applications carry 72.0% of 2025 value, so app design, saved payment and live tracking decide which platform wins the repeat order. Older users who order groceries by phone are the next source of frequency.
Why does a large restaurant base keep supply deep?
A large and varied restaurant base gives delivery apps the selection that keeps diners returning, and many operators now need off-premise orders to fill kitchen capacity. The National Restaurant Association projects restaurant and foodservice sales of $1.55 trillion in 2026, with 15.8 million jobs. The same February 2026 report found that 60% of operators saw softer customer traffic in the prior year, which pushes them toward delivery to make up lost covers. Grubhub alone listed about 375,000 merchants when Wonder agreed to buy it, according to Restaurant Dive. Deep supply lets platforms promote local favorites in every suburb, which keeps basket sizes and order counts rising.
How do memberships and ads raise platform earnings?
Memberships and advertising turn occasional users into frequent ones and add earnings on top of each order. Uber said in November 2025 that Uber One had reached 36 million members, and that members drove about two-thirds of its delivery gross bookings. DoorDash exited 2025 with over 35 million DashPass, Wolt+ and Deliveroo Plus members after record DashPass signups during the year. Members order more often because delivery fees fall away above a minimum basket, which spreads courier costs over more orders. Subscription memberships grow faster than the market as a whole, and the extra traffic makes sponsored listings more valuable to restaurants and consumer brands.
Why do big-box retailers widen the delivery map?
Walmart and Amazon have turned national store and warehouse networks into fast grocery delivery, which brings online ordering to suburbs and small towns that restaurant apps serve less densely. Walmart said on Feb. 19, 2026, that U.S. ecommerce sales rose 27% and that customers using delivery in under three hours grew more than 60% for the year. Its store footprint lets 95% of customers receive delivery in three hours or less. Amazon reached 2,300 cities and towns with same-day perishable grocery delivery in December 2025, with free delivery for Prime members on orders over $25. These networks raise the speed buyers expect from every app.
Grocery, robots and AI assistants reshape the order flow
Shift of delivery apps into grocery and retail baskets
Restaurant apps are moving into grocery and household goods, which adds daytime and weekday orders to a business built on dinner. DoorDash said it won more new grocery and retail customers in the fourth quarter of 2025 than in any earlier quarter. Uber said on its November 2025 earnings call that grocery and retail was growing significantly faster than restaurant delivery and was bringing new users into the app. Instacart reaches more than 1,800 retailers and nearly 100,000 stores, covering over 98% of North American households, according to the company. Grocery and convenience delivery therefore gains share, while restaurant marketplaces stay the base of the market.
Rise of robots and drones on short urban routes
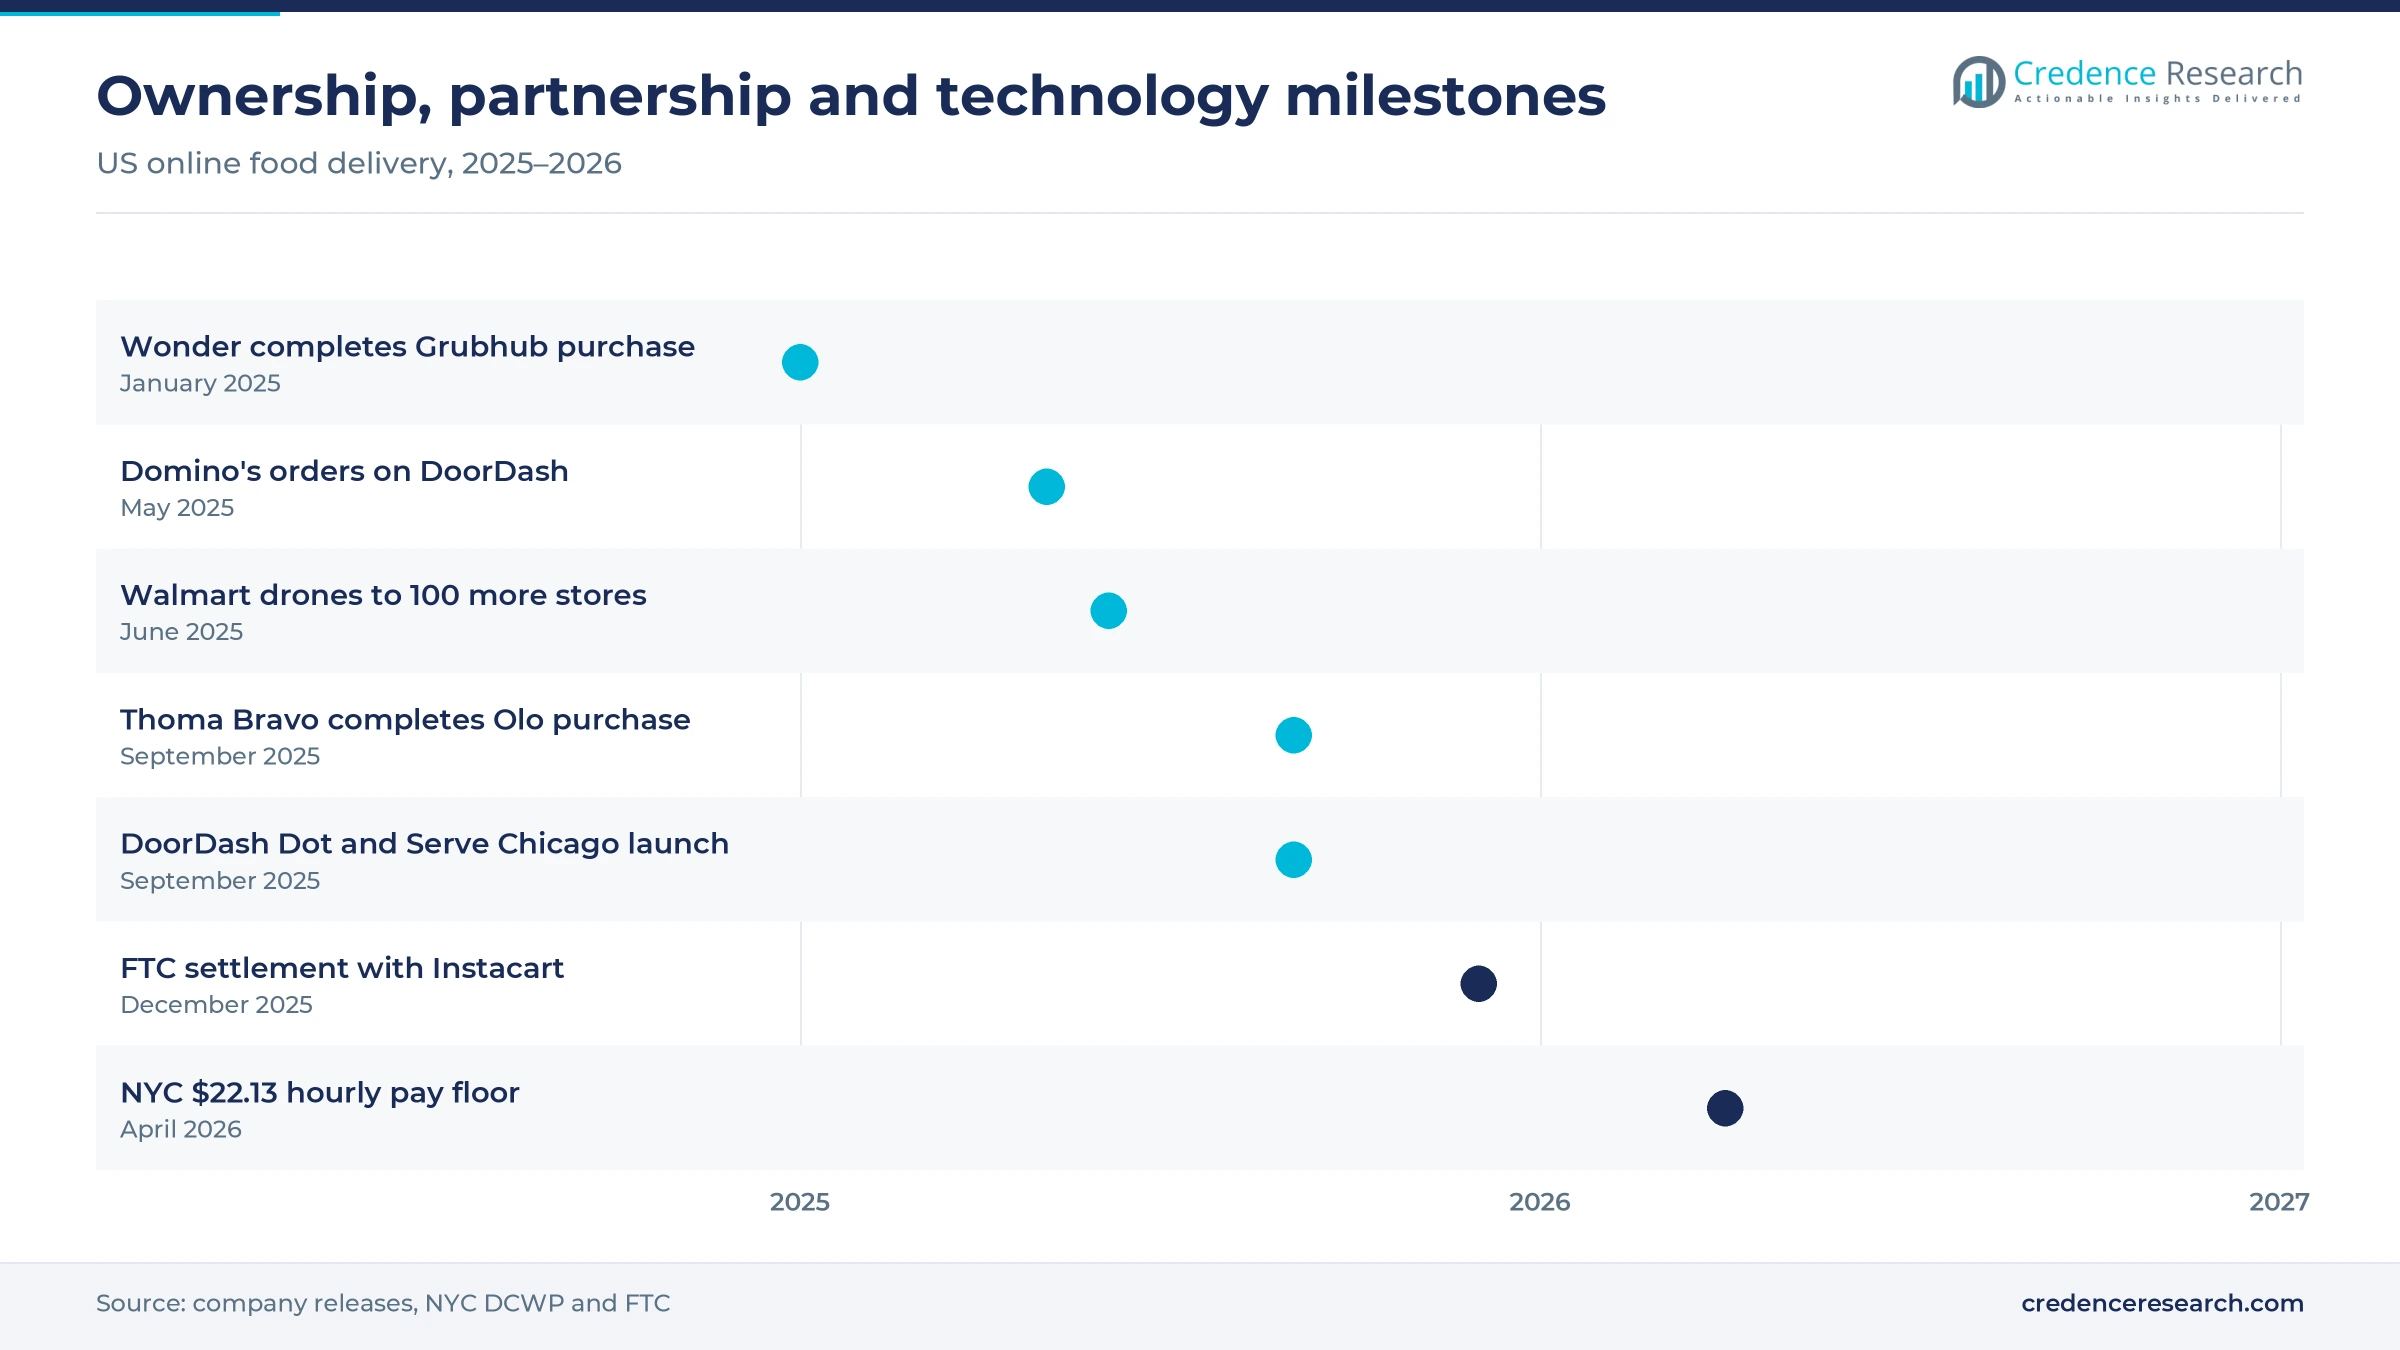
Platforms are testing robots and drones on short trips, because a large part of each order cost is the courier. DoorDash unveiled Dot, a road and sidewalk robot that can travel at up to 20 mph, on Sept. 30, 2025, and began testing it with early partners in metro Phoenix. Serve Robotics launched Uber Eats deliveries in 14 Chicago neighborhoods on the same day and holds an agreement to place up to 2,000 robots on Uber Eats. Walmart announced drone delivery from 100 more stores in Atlanta, Charlotte, Houston, Orlando and Tampa on June 5, 2025. Robots will handle a small share of orders, but they set a lower cost floor for dense routes.
Can embedded and AI-assisted ordering become a larger opening?
Ordering is spreading beyond the big apps into restaurant websites and AI assistants, which opens room for software firms that power checkout. Instacart launched an app inside ChatGPT with Instant Checkout on Dec. 8, 2025, so users can build and pay for a grocery cart within a chat. Thoma Bravo completed its purchase of Olo on Sept. 12, 2025, gaining an ordering platform used by more than 750 restaurant brands, much of it restaurant ordering software for chains. DoorDash closed its purchase of SevenRooms on June 13, 2025, adding guest data tools used at more than 13,000 venues. Suppliers that own checkout data can lower the cost of winning each repeat order.
Is workplace catering an underserved opening?
Office meals and group orders carry large baskets and repeat on a schedule, which makes them attractive to restaurants and platforms alike. ezCater reported in May 2025 that 43% of surveyed organizations ran a recurring employee meal program, up 17% from 2024. Its average order value rose 12% to $420, many times a typical household dinner order. The network covers more than 100,000 restaurants, and Five Guys joined it in January 2026 to serve workplaces nationwide. Workplace and corporate buyers grow faster than households in this estimate, and return-to-office policies give caterers and quick-service chains a reason to build dedicated group menus.
Courier pay rules and fee scrutiny raise the cost to serve
How do courier pay floors raise the cost of each order?
City pay floors lift courier costs in the densest markets, which squeezes platform margins or pushes fees onto diners. New York City set a minimum pay rate of $22.13 an hour before tips for app delivery workers from April 1, 2026, and extended the rules to grocery apps, with the aggregate pay test applying from July 1, 2026. Platforms answer with higher service fees, tighter courier scheduling and pickup incentives. Operators that batch orders and cut idle time absorb these costs best.
Why does fee scrutiny threaten subscription and fee income?
Regulators are watching how platforms present fees and memberships, which limits the scope for drip pricing. The Federal Trade Commission alleged in December 2025 that Instacart advertised free delivery while charging service fees as high as 15% of an order, and Instacart agreed to pay $60 million in refunds while denying wrongdoing. The order also requires explicit consent before charging for renewing memberships. Platforms must now show total cost earlier in checkout, which may lower conversion on small baskets.
How do weak restaurant margins limit commission increases?
Restaurants pay the commissions that fund delivery, but many cannot afford higher rates. The National Restaurant Association reported in February 2026 that 42% of operators said their restaurant was unprofitable the previous year. Menu prices also keep rising, with the Bureau of Labor Statistics recording a 3.7% rise in food away from home prices in the 12 months to November 2025. Restaurants respond by raising app menu prices or steering diners to commission-free direct ordering.
Why do city-by-city rules make costs hard to predict?
Pay rules now differ by city, so a platform can face very different costs on similar routes. Seattle's app worker pay ordinance took effect in January 2024, and a city report covered by GeekWire found that network company fees averaged 19.3% of total order payments there. DoorDash says Seattle now has the highest delivery fees in the country, more than 3.5 times those of comparable cities. Platforms must price each city separately and lobby state lawmakers for common rules.
The South leads on population gains and new drone routes
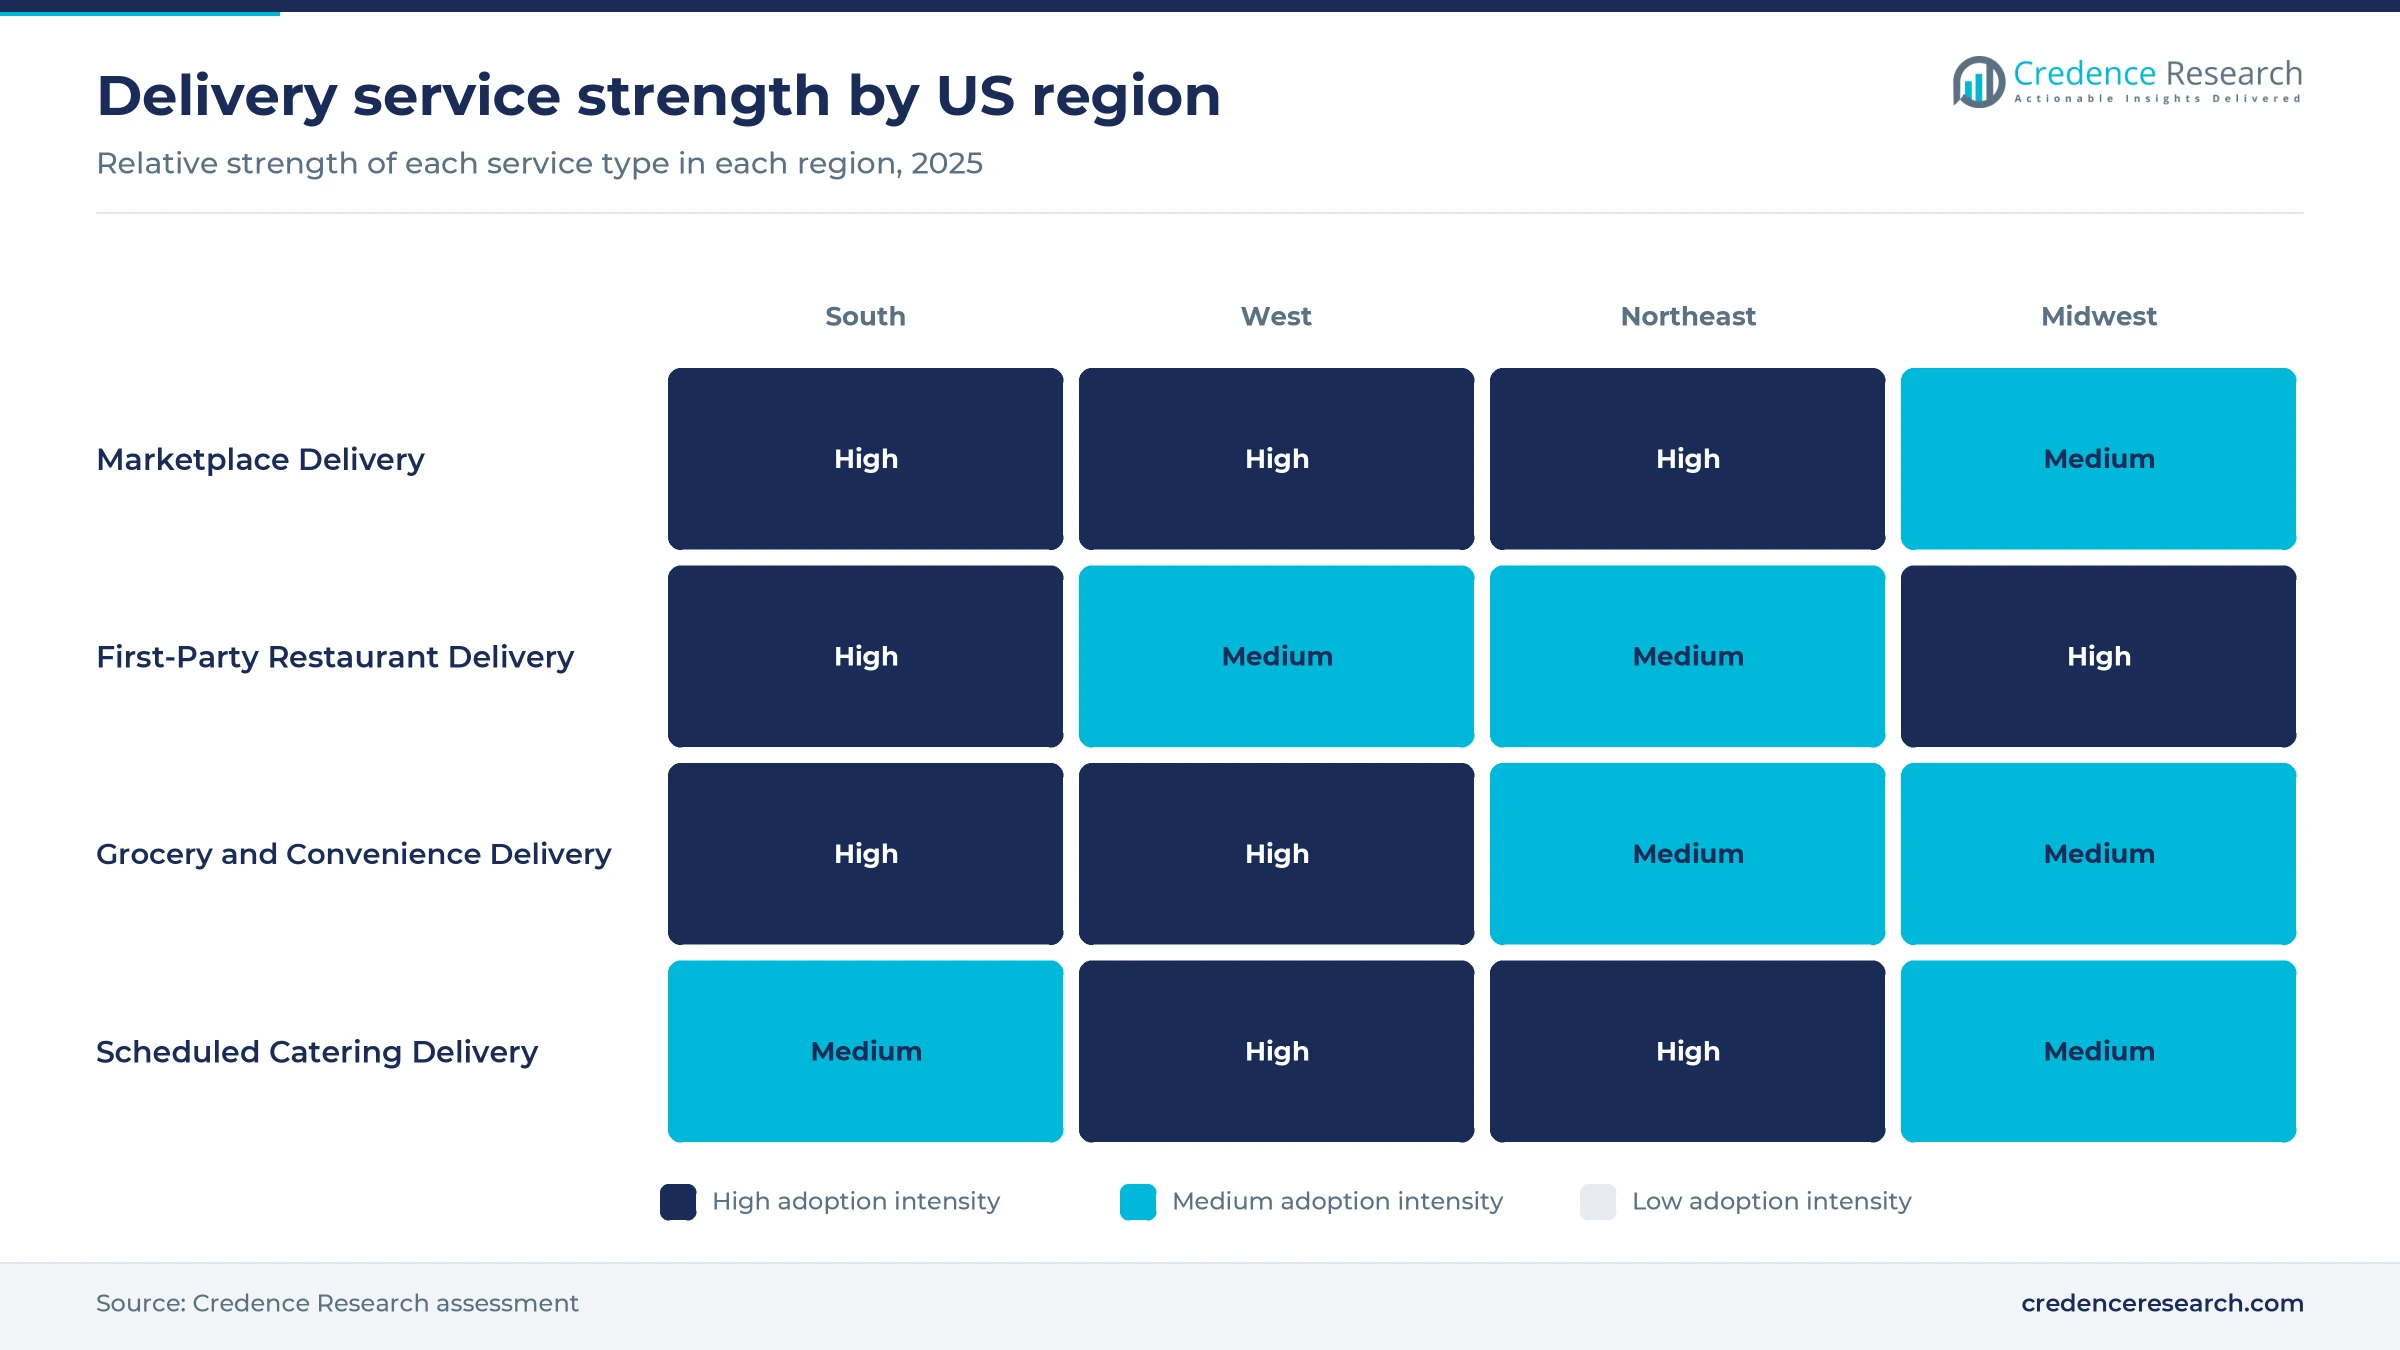
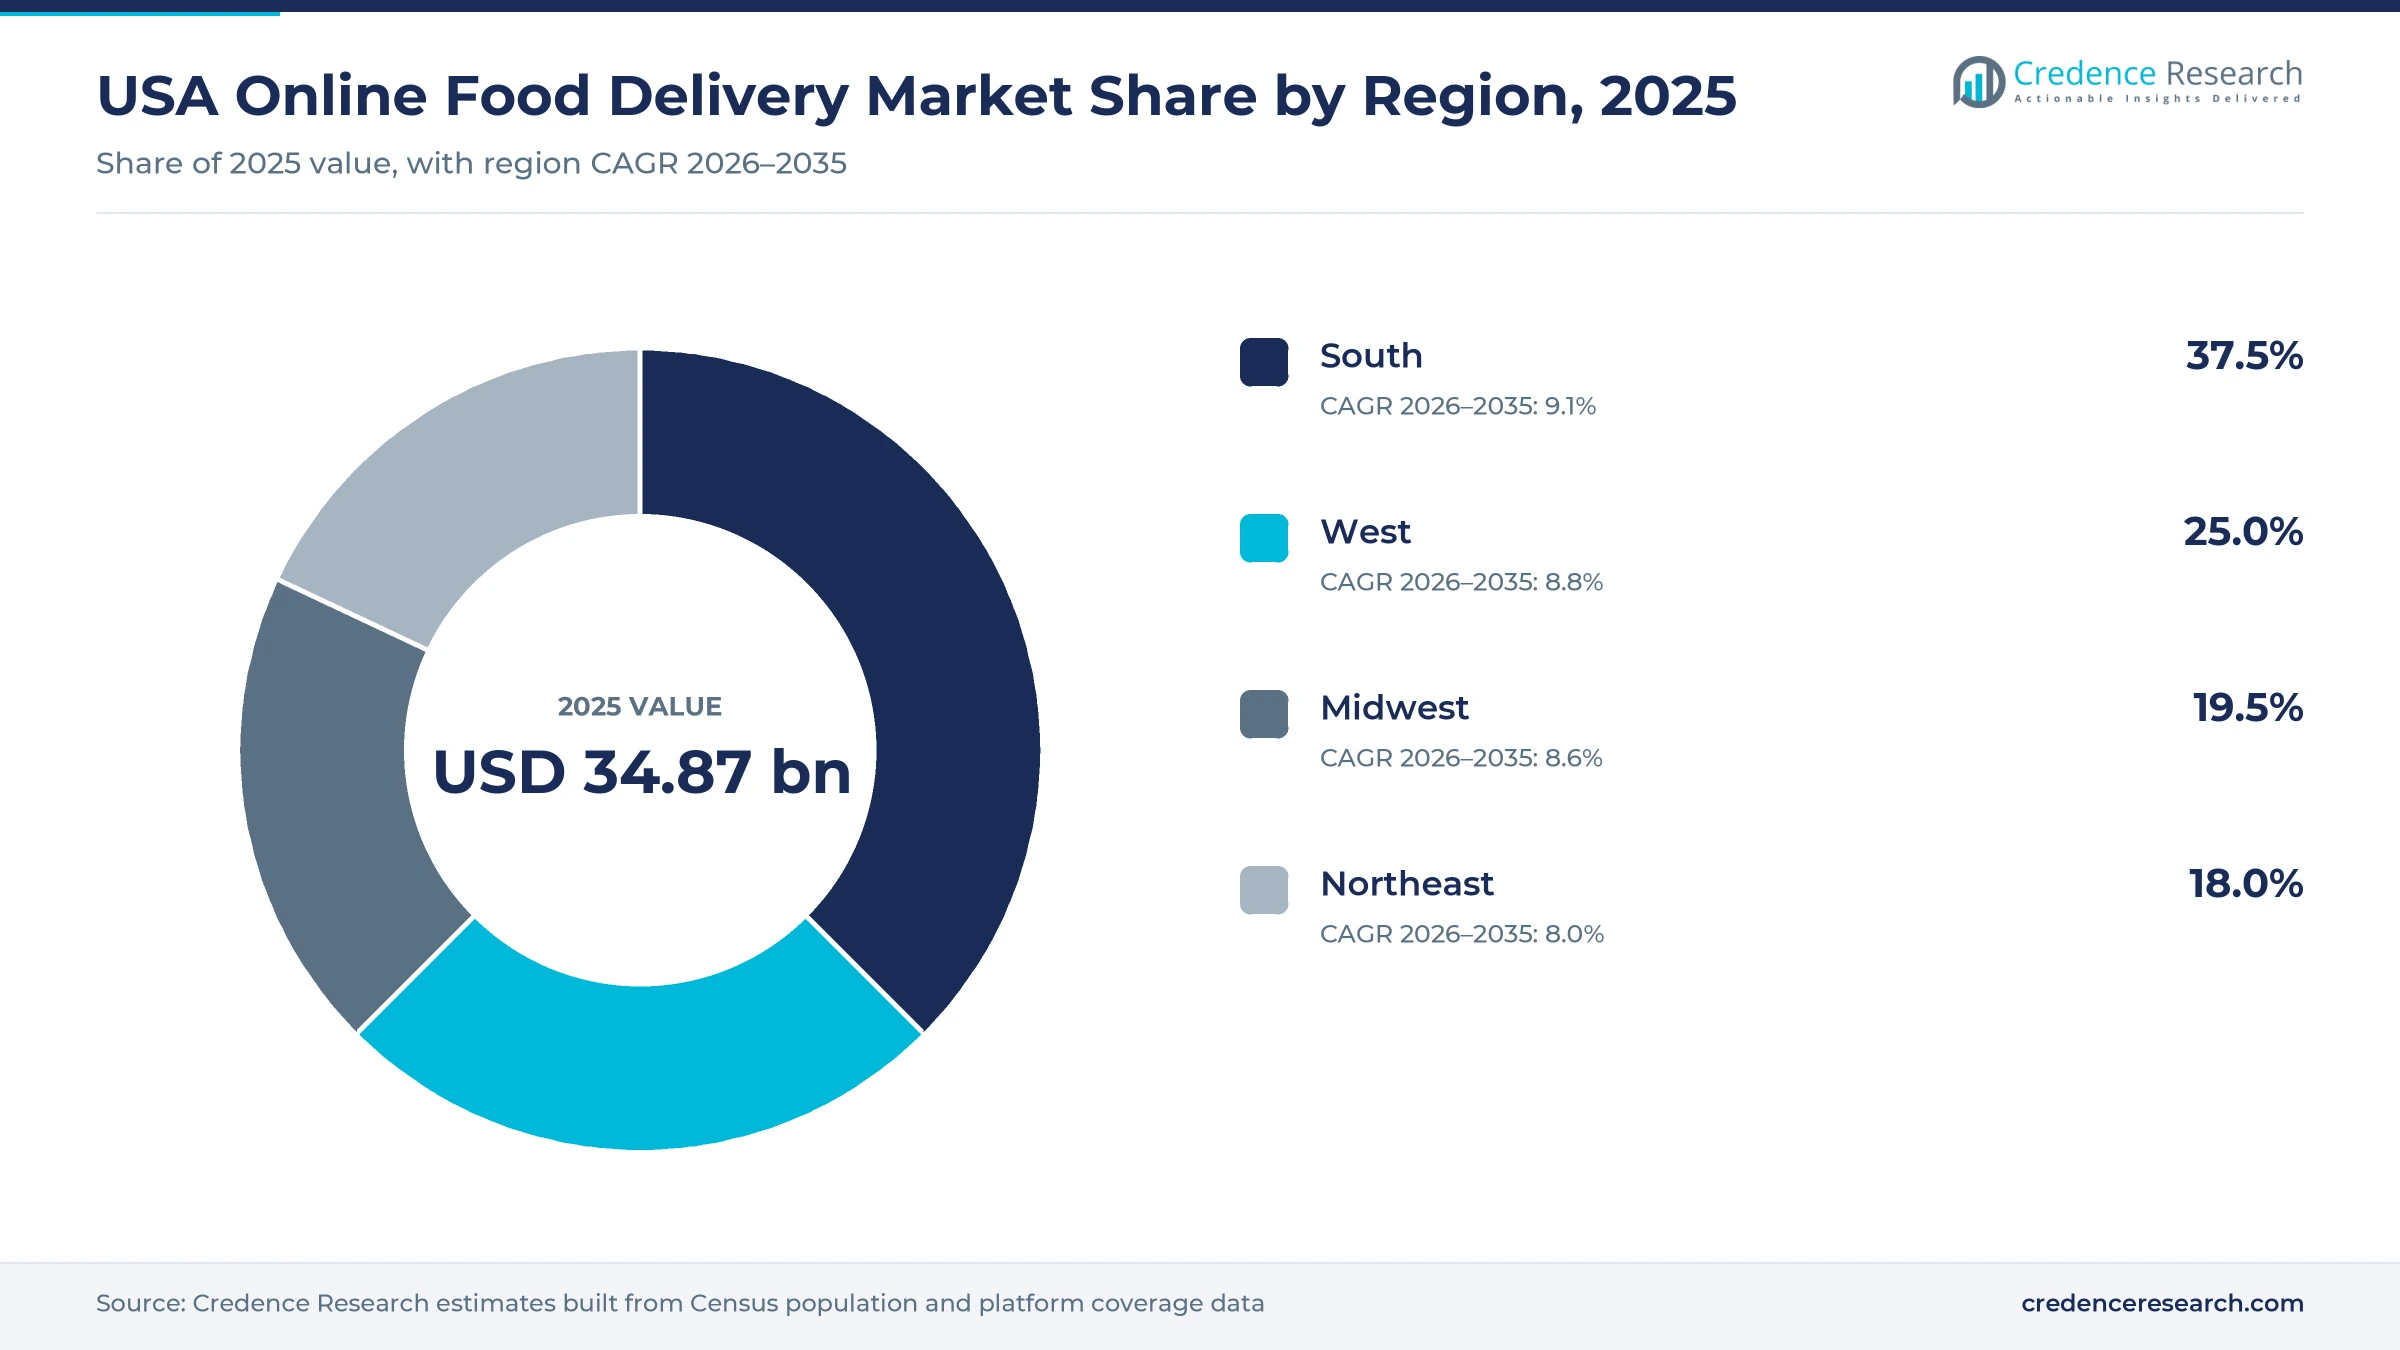
The USA online food delivery market is split into the four Census regions, which follow population, restaurant density and the reach of grocery and robot networks. Regional shares and growth rates are Credence Research estimates built from Census population counts, platform coverage announcements and city pay rules. The South and West together held more than three-fifths of 2025 value in the USA online food delivery market, led by a South that adds residents faster than any other region.
| Region | Value, 2025 (USD billion) | Share, 2025 | CAGR, 2026–2035 |
|---|---|---|---|
| South | 13.08 | 37.5% | 9.1% |
| West | 8.72 | 25.0% | 8.8% |
| Midwest | 6.80 | 19.5% | 8.6% |
| Northeast | 6.28 | 18.0% | 8.0% |
Why does the South order the most delivery?
The South held 37.5% of 2025 value and grows fastest at 9.1% a year, because it has the largest and fastest-growing population. According to the U.S. Census Bureau, the South reached 133.8 million residents on July 1, 2025, up 6.0% since 2020, nearly double the national pace of 3.1%. Walmart's drone expansion to Atlanta, Charlotte, Houston, Orlando and Tampa, noted above, also centers on this region. Suburban growth adds new rooftops faster than new restaurants, which raises demand for delivery.
How do tech-heavy metros shape the West?
The West held 25.0% of 2025 value and grows at 8.8% a year, as its large coastal metros adopted app ordering early and remain test beds for new formats. The region had 80.1 million residents in July 2025, up 1.9% since 2020, according to the Census Bureau. DoorDash chose metro Phoenix for its first Dot robot trials, and the California Supreme Court upheld Proposition 22 on July 25, 2024, keeping app couriers as independent contractors in the largest state. The Seattle pay rules discussed above show how local policy can still raise costs.
Why does the Midwest offer steady suburban demand?
The Midwest held 19.5% of 2025 value and grows at 8.6% a year, as suburban households and college towns provide steady demand at lower courier costs than coastal cities. The region had 69.8 million residents in July 2025, up 1.1% since 2020, according to the Census Bureau. Serve Robotics made Chicago its first Midwest market in September 2025, with more than 100 restaurants available for robot delivery. Big Ten and state university meal plans also support campus ordering across the region.
How do NYC pay rules shape the Northeast?
The Northeast held 18.0% of 2025 value and grows at 8.0% a year, the slowest pace, because population growth is low and New York City pay rules raise the cost of each trip. The region had 58.0 million residents in July 2025, up only 0.7% since 2020, according to the Census Bureau. The New York City pay floor noted above now covers grocery apps as well. Dense walkable neighborhoods still give platforms short trips and high order counts per hour.
Deals, robots and chat checkout, 2025
| Development | Status and market relevance |
|---|---|
| In January 2025, Wonder completed its $650 million purchase of Grubhub from Just Eat Takeaway.com. | Delivery-first food halls joined a national marketplace |
| In April 2025, Domino's and DoorDash announced a partnership under which Domino's drivers fulfill DoorDash orders, with a U.S. launch from May 2025. | First-party fleet joins the largest marketplace |
| In June 2025, DoorDash completed its acquisition of SevenRooms, a reservations and guest data platform. | Moves the platform into in-store restaurant software |
| In September 2025, Thoma Bravo completed its acquisition of Olo for about $2.0 billion in equity value. | Ordering software for more than 750 restaurant brands taken private |
| In December 2025, Instacart launched its app inside ChatGPT with Instant Checkout. | First grocery checkout inside an AI assistant |
Dispatch, robots and embedded checkout cut cost per order
- Order batching and dispatch algorithms pair nearby pickups and drop-offs, which cuts courier idle time under hourly pay floors.
- Road and sidewalk robots carry short trips in dense neighborhoods, which lowers the cost of small orders over time.
- Store-launched drones deliver light grocery baskets within a few miles of a store in minutes.
- Embedded checkout and ordering APIs let restaurants and AI assistants take orders while platforms handle payment and dispatch.
- Retail media and sponsored listing tools sell search placement to restaurants and consumer brands using first-party order data.
Need a Custom Version of This Report?
Tailor the scope, geography, or segments to your exact requirements.
- Custom geography or segment scope
- Direct access to our analyst team
DoorDash scale and Uber memberships set the pace
Competition in the USA online food delivery market turns on restaurant selection, courier density, membership value and the advertising tools offered to merchants. DoorDash leads restaurant delivery and is expanding into grocery, reservations and robots. Uber Eats uses Uber One to link rides and meals, and it partners with Serve Robotics on sidewalk delivery. Grubhub, owned by Wonder since January 2025, pairs a national marketplace with Wonder's ghost kitchens and food halls. Instacart leads grocery delivery from partner stores, while Walmart and Amazon use their own stores and warehouses. Domino's runs its own driver fleet and now also takes orders through DoorDash. Olo, ChowNow and Slice power direct ordering for restaurants, which lets them avoid marketplace commissions, and ezCater leads workplace catering.
Two national marketplaces face retailers and software firms
Supply in the USA online food delivery market is organized in three layers. DoorDash and Uber Eats run the two national restaurant marketplaces, with Grubhub, now owned by Wonder, a distant third. Instacart, Walmart and Amazon compete in grocery delivery from store and warehouse networks, while Domino's and other chains run their own fleets. Olo, ChowNow and Slice power direct ordering for chains, independents and pizzerias, and ezCater serves workplace catering. Courier networks, membership bases and ad tools are costly to build, so margins sit with the marketplaces that control the most repeat demand.
Companies profiled and their roles in this market
| Company | Type | Role in the market |
|---|---|---|
| DoorDash, Inc. | National marketplace | Restaurant, grocery and retail delivery with DashPass, ads and Dot robots |
| Uber Technologies, Inc. (Uber Eats) | National marketplace | Uber Eats restaurant and grocery delivery bundled with Uber One |
| Wonder Group, Inc. (Grubhub) | Marketplace and food hall operator | Grubhub marketplace, campus dining and Wonder delivery-first food halls |
| Maplebear Inc. (Instacart) | Grocery marketplace | Same-day grocery delivery from partner stores with Instacart+ membership |
| Amazon.com, Inc. | Retailer and marketplace | Same-day perishable grocery delivery for Prime members in 2,300 cities |
| Walmart Inc. | Retailer | Store-fulfilled grocery delivery, Walmart+ membership and drone delivery |
| Domino's Pizza, Inc. | First-party restaurant fleet | Own-driver pizza delivery through its app and DoorDash |
| Olo Inc. (Thoma Bravo) | Ordering software | Ordering, dispatch and payments software for restaurant brands |
| ChowNow, Inc. | Ordering software | Commission-free direct ordering for independent restaurants |
| Slice Solutions, Inc. | Specialist marketplace | Ordering platform and services for independent pizzerias |
| ezCater, Inc. | Catering marketplace | Workplace catering orders and employee meal programs |
Ads and grocery will carry the next leg of growth
Credence Research's view is that the USA online food delivery market will keep growing faster than restaurant sales, because memberships, advertising and grocery baskets add earnings to each household relationship. Restaurant marketplaces keep the largest share, while grocery delivery, sponsored listings and assistant-led ordering gain from smaller bases. Advertising and sponsored listings grow at 11.3% a year, the fastest revenue model in the USA online food delivery market. The South remains the largest and fastest-growing region on population gains. Winners will hold courier costs down under city pay floors, show fees clearly at checkout and give restaurants ad tools that pay back within weeks.
Census, company filings and city rules anchor the model
The report uses 2025 as the base year on a calendar basis, and market values come from the Credence Research model. That model combines U.S. Census Bureau population estimates, Bureau of Labor Statistics price data, Pew Research Center survey data, company earnings releases and filings, city labor rules, Federal Trade Commission actions, published merchant pricing and trade press. Segment splits, regional shares and regional growth rates are Credence Research estimates built from population, platform coverage and pricing data, and no interviews or surveys were used for this report.
Memberships, grocery and ads carry growth to 2035
Online food delivery earnings in the United States are expected to reach USD 80.44 billion by 2035, an 8.69% CAGR during 2026–2035, as households keep ordering through apps, memberships spread and grocery baskets join restaurant orders. Advertising and sponsored listings should gain share of platform earnings, while merchant commissions stay the largest revenue model. Grocery and convenience delivery grows at 10.3% a year, the quickest pace of any service type in this market. Voice and connected devices grow fastest among channels from a small base. Growth would slow if more cities adopted high courier pay floors, while cheaper robot delivery would lift results toward the upside case.
Pay rules and grocery uptake set the range of outcomes
In the base case, earnings grow from the 2026 value along the central forecast as memberships, advertising and grocery orders keep their recent pace. The downside case assumes that more cities adopt high courier pay floors, fee rules cut small-basket orders and restaurants shift volume to direct ordering. The upside case adds faster grocery uptake, robot delivery on dense routes and wider use of AI assistants that place orders.
| Scenario | CAGR, 2026–2035 | Value, 2035 | What has to hold |
|---|---|---|---|
| Downside | 7.1% | USD 70.39 billion | More cities adopt pay floors and fee rules cut small-basket orders |
| Base | 8.69% | USD 80.44 billion | Memberships, ads and grocery orders keep their recent pace |
| Upside | 10.1% | USD 90.26 billion | Grocery uptake speeds up and robots and AI ordering lower cost per order |
Frequently Asked Questions
How big is the USA online food delivery market?
Which service type leads U.S. online food delivery?
Which region holds the largest share?
How much do restaurants pay delivery platforms?
Why do memberships matter so much in this market?
What rules raise costs for delivery platforms?
Who are the main companies in this market?
Are robots and drones delivering food in the United States?
Table of Content
Chapter 1 Market Segmentation
- 1.1 Segmentation Framework
- 1.1.1 Product and Service Classification
- 1.1.2 Application and End-Use Classification
- 1.1.3 Technology and Solution Classification
- 1.1.4 Customer and Distribution Channel Classification
- 1.1.5 Geographic Segmentation
- 1.1.6 Market Segment Definitions and Boundaries
- 1.2 By Service Type
- 1.2.1 Marketplace Delivery
- 1.2.2 First-Party Restaurant Delivery
- 1.2.3 Grocery and Convenience Delivery
- 1.2.4 Scheduled Catering Delivery
- 1.3 By Customer Type
- 1.3.1 Individual Households
- 1.3.2 Workplace and Corporate Buyers
- 1.3.3 Students and Campus Users
- 1.3.4 Institutional Buyers
- 1.4 By Revenue Model
- 1.4.1 Merchant Commissions
- 1.4.2 Consumer Delivery and Service Fees
- 1.4.3 Subscription Memberships
- 1.4.4 Advertising and Sponsored Listings
Chapter 2 Introduction
- 2.1 Report Objectives and Scope
- 2.2 Product Definition and Industry Terminology
- 2.3 Market Inclusions and Exclusions
- 2.4 Research Process
- 2.4.1 Primary Research and Expert Interviews
- 2.4.2 Secondary Research and Source Review
- 2.4.3 Top-Down and Bottom-Up Estimation
- 2.4.4 Data Triangulation and Verification
- 2.5 Market Size Measurement Basis
- 2.5.1 2025: USD 34.87 billion → 2035: USD 80.44 billion
- 2.6 Historical and Forecast Reference Periods
- 2.6.1 Historical Period: 2018-2025
- 2.6.2 Base Year: 2025
- 2.6.3 Forecast Period: 2025-2035
- 2.7 Research Assumptions and Limitations
Chapter 3 Executive Summary
- 3.1 Market Snapshot and Key Findings
- 3.2 Base-Year Market Size, 2025
- 3.3 Forecast Market Size, 2035
- 3.4 Revenue and Volume Growth Outlook
- 3.5 Key Demand and Supply Indicators
- 3.6 Leading Market Segments
- 3.7 Fastest-Growing Market Opportunities
- 3.8 Regional Performance Highlights
- 3.9 Technology and Industry Transformation
- 3.10 Competitive Landscape Summary
- 3.11 Analyst View and Strategic Implications
Chapter 4 USA Online Food Delivery Market Trends and Developments
- 4.1 Historical Industry Development, 2018-2025
- 4.2 Recent Market Trends and Developments
- 4.3 Demand and Customer Behavior Trends
- 4.4 Technology and Product Innovation
- 4.5 Artificial Intelligence, Automation and Digitalization
- 4.6 Local Manufacturing and Supply Chain Realignment
- 4.7 Industry Partnerships, Mergers and Acquisitions
- 4.8 Sustainability and Circular Economy Developments
- 4.9 Government and Private Sector Investment Trends
- 4.10 Emerging Business Models and Commercialization
- 4.11 Industry Developments and Announcements
Chapter 5 USA Online Food Delivery Market Production, Supply and Demand Analysis
- 5.1 Demand Trend and Consumption Analysis, 2018-2025
- 5.2 Demand Forecast, 2025-2035
- 5.3 Production and Output Trend, 2018-2025
- 5.4 Production and Output Forecast, 2025-2035
- 5.5 Installed Capacity and Capacity Utilization
- 5.6 Company-Wise Production Plants and Statistics
- 5.6.1 Installed Production Capacity
- 5.6.2 Actual Production
- 5.6.3 Planned Capacity and Expansion Targets
- 5.7 Supply Chain Structure and Procurement Trends
- 5.8 Supply-Demand Gap and Bottlenecks
- 5.9 Import Dependence and Sourcing Structure
- 5.10 Contract Manufacturing and Outsourcing
- 5.11 Regional Supply and Demand Concentration
Chapter 6 USA Online Food Delivery Market Pricing Analysis
- 6.1 Pricing Structure and Measurement
- 6.2 Historical Pricing Trends, 2018-2025
- 6.3 Pricing Outlook, 2025-2035
- 6.4 Average Selling Price and Unit Economics
- 6.5 Pricing by Product and Market Segment
- 6.6 Geographic Pricing Differences
- 6.7 Key Input, Energy, Labor and Logistics Costs
- 6.8 Contract Pricing and Purchasing Models
- 6.9 Pricing Sensitivity and Competitive Positioning
- 6.10 Price, Margin and Profitability Implications
Chapter 7 USA Online Food Delivery Market Dynamics
- 7.1 Market Growth Drivers
- 7.1.1 Demand-Side Drivers
- 7.1.2 Technology and Innovation Drivers
- 7.1.3 Infrastructure and Investment Drivers
- 7.1.4 Regulatory and Policy Drivers
- 7.2 Market Restraints
- 7.2.1 Cost and Affordability Constraints
- 7.2.2 Technology and Adoption Barriers
- 7.2.3 Supply Chain and Operational Constraints
- 7.3 Market Challenges
- 7.3.1 Competitive Pressure and Margin Erosion
- 7.3.2 Skills, Infrastructure and Implementation Gaps
- 7.4 Emerging Market Opportunities
- 7.5 Market Dynamics Impact and Time-Horizon Assessment
Chapter 8 USA Online Food Delivery Value Chain Analysis
- 8.1 Industry Value Chain Overview
- 8.2 Upstream Suppliers and Critical Inputs
- 8.3 Technology and Component Providers
- 8.4 Manufacturing or Service Delivery
- 8.5 Distribution, Channel Partners and Integrators
- 8.6 Downstream Applications and End Users
- 8.7 Value Addition and Profit Pools
- 8.8 Vertical Integration and Outsourcing
- 8.9 Supplier Concentration and Risk
- 8.10 Supply Chain Localization and Resilience
Chapter 9 USA Online Food Delivery Market Regulations and Policies
- 9.1 Relevant Laws, Standards and Compliance Frameworks
- 9.2 Product, Service, Safety and Quality Requirements
- 9.3 Government Policies, Incentives and Subsidies
- 9.4 Imports, Exports and Trade Barriers
- 9.5 Public Procurement and Local Content Requirements
- 9.6 Environmental and Sustainability Compliance
- 9.7 Upcoming Policy Changes and Market Implications
Chapter 10 USA Online Food Delivery Market Hotspots and Opportunities
- 10.1 Market Opportunity Mapping and Growth Hotspots
- 10.2 High-Growth Applications and Customer Groups
- 10.3 Underserved Markets and White-Space Opportunities
- 10.4 Emerging Technology and Product Opportunities
- 10.5 New Capacity and Investment Hotspots
- 10.6 Market Entry and Expansion Opportunities
- 10.7 Distribution and Partnership Opportunities
- 10.8 Near-Term and Long-Term Commercial Potential
- 10.9 Opportunity Attractiveness and Execution Risks
Chapter 11 USA Online Food Delivery Market Outlook, 2025-2035
- 11.1 Market Size and Analysis
- 11.1.1 Revenue (Market Measurement: 2025: USD 34.87 billion → 2035: USD 80.44 billion)
- 11.1.2 Market Volume and Quantity Sold
- 11.1.3 Historical Market Size, 2018-2025
- 11.1.4 Base-Year Market Size, 2025
- 11.2 Market Forecast, 2025-2035
- 11.2.1 Revenue Forecast to 2035
- 11.2.2 Volume Forecast to 2035
- 11.2.3 CAGR and Year-on-Year Growth
- 11.2.4 Incremental Revenue Opportunity
- 11.3 Forecast Assumptions and Scenario Analysis
- 11.3.1 Base-Case Forecast
- 11.3.2 Optimistic and Conservative Scenarios
- 11.3.3 Technology, Pricing and Policy Sensitivities
- 11.4 Market Attractiveness and Growth Outlook
Chapter 12 USA Online Food Delivery Market Segmentation and Outlook
- 12.1 Segmentation Summary and Market Shares, 2025
- 12.2 Largest and Fastest-Growing Segments
- 12.3 By Service Type - Market Size and Forecast, 2025-2035
- 12.3.1 Segment Definition and Scope
- 12.3.2 Historical Market Size, 2018-2025
- 12.3.3 Revenue Forecast, 2025-2035
- 12.3.4 Volume Forecast, 2025-2035
- 12.3.5 Base-Year Market Share, 2025
- 12.3.6 Segment CAGR and Growth Drivers
- 12.3.7 Subsegment Market Size and Forecast
- 12.3.7.1 Marketplace Delivery
- 12.3.7.2 First-Party Restaurant Delivery
- 12.3.7.3 Grocery and Convenience Delivery
- 12.3.7.4 Scheduled Catering Delivery
- 12.3.8 Subsegment Pricing and Adoption Trends
- 12.3.9 Leading Suppliers and Competition
- 12.3.10 Regional Demand and Opportunities
- 12.4 By Customer Type - Market Size and Forecast, 2025-2035
- 12.4.1 Segment Definition and Scope
- 12.4.2 Historical Market Size, 2018-2025
- 12.4.3 Revenue Forecast, 2025-2035
- 12.4.4 Volume Forecast, 2025-2035
- 12.4.5 Base-Year Market Share, 2025
- 12.4.6 Segment CAGR and Growth Drivers
- 12.4.7 Subsegment Market Size and Forecast
- 12.4.7.1 Individual Households
- 12.4.7.2 Workplace and Corporate Buyers
- 12.4.7.3 Students and Campus Users
- 12.4.7.4 Institutional Buyers
- 12.4.8 Subsegment Pricing and Adoption Trends
- 12.4.9 Leading Suppliers and Competition
- 12.4.10 Regional Demand and Opportunities
- 12.5 By Revenue Model - Market Size and Forecast, 2025-2035
- 12.5.1 Segment Definition and Scope
- 12.5.2 Historical Market Size, 2018-2025
- 12.5.3 Revenue Forecast, 2025-2035
- 12.5.4 Volume Forecast, 2025-2035
- 12.5.5 Base-Year Market Share, 2025
- 12.5.6 Segment CAGR and Growth Drivers
- 12.5.7 Subsegment Market Size and Forecast
- 12.5.7.1 Merchant Commissions
- 12.5.7.2 Consumer Delivery and Service Fees
- 12.5.7.3 Subscription Memberships
- 12.5.7.4 Advertising and Sponsored Listings
- 12.5.8 Subsegment Pricing and Adoption Trends
- 12.5.9 Leading Suppliers and Competition
- 12.5.10 Regional Demand and Opportunities
- 12.6 Segment Growth Comparison
- 12.7 Segment Attractiveness and Priority Matrix
Chapter 13 USA Online Food Delivery End-Use and Application Market Outlook
- 13.1 End-Use Industry and Customer Demand Structure
- 13.2 Leading Applications and Customer Groups
- 13.3 End-Use Market Size, Share and Forecast
- 13.4 Major End-Use Industry Deep Dives
- 13.4.1 Customer Requirements and Use Cases
- 13.4.2 Demand and Replacement Cycles
- 13.4.3 Technical and Regulatory Considerations
- 13.4.4 Purchasing and Procurement Models
- 13.4.5 Leading Vendors and Distribution Channels
- 13.4.6 Forecast and Commercial Opportunities
- 13.5 Emerging Applications and Cross-Segment Demand
- 13.6 End-Use Industry Investment Priorities
Chapter 14 USA Online Food Delivery Geographic Market Outlook, 2025-2035
- 14.1 Domestic Market Distribution and Demand Clusters
- 14.2 State- or Province-Wise Market Size and Forecast, 2025-2035
- 14.3 City and Metropolitan Market Outlook
- 14.4 Industrial, Manufacturing and Commercial Clusters
- 14.5 Geographic Concentration of Key End Users
- 14.6 Local Pricing and Purchasing Differences
- 14.7 Domestic Production Facilities and Capacity Map
- 14.8 Local Infrastructure and Project Pipeline
- 14.9 State-Level Policy and Incentive Differences
- 14.10 Subnational Investment Hotspots and Opportunities
- 14.11 Distribution and Logistics Networks
- 14.12 Domestic Competitive Footprint
Chapter 15 USA Online Food Delivery Technology, Innovation and Sustainability Outlook
- 15.1 Technology Landscape and Maturity
- 15.2 Product, Process and Service Innovation
- 15.3 AI, Automation and Digital Tools in the Industry
- 15.4 Technology Adoption and Performance Benchmarking
- 15.5 Innovation Pipeline and R&D Investment
- 15.6 Patent and Intellectual Property Trends
- 15.7 Energy Efficiency and Resource Management
- 15.8 Sustainability, Recycling and Circularity
- 15.9 Technology Roadmap, 2025-2035
- 15.10 Risks of Obsolescence and Technology Substitution
Chapter 16 USA Online Food Delivery Market Key Strategic Imperatives
- 16.1 Growth and Market Entry Priorities
- 16.2 High-Return Products and Segments
- 16.3 Pricing, Profitability and Cost Optimization
- 16.4 Technology Investment and Product Differentiation
- 16.5 Supply Chain Localization and Resilience
- 16.6 Distribution and Customer Acquisition
- 16.7 Partnership, Acquisition and Capacity Strategy
- 16.8 Regional Expansion Priorities
- 16.9 Short-, Medium- and Long-Term Actions
Chapter 17 Competition Outlook
- 17.1 Industry Competition Characteristics
- 17.2 Market Structure and Concentration
- 17.3 Market Share and Competitive Positioning, 2025
- 17.4 Company-Wise Revenue and Product Benchmarking
- 17.5 Production and Service Capacity Benchmarking
- 17.6 Technology, Pricing and Differentiation
- 17.7 Regional Footprint and Distribution Strength
- 17.8 Mergers, Acquisitions and Strategic Alliances
- 17.9 New Entrants and Competitive Threats
- 17.10 Porter's Five Forces and Industry Attractiveness
- 17.11 Competitive Outlook, 2025-2035
Chapter 18 Company Profiles
- 18.1 Company Coverage and Selection Criteria
- 18.2 DoorDash, Inc.
- 18.2.1 Business Description
- 18.2.2 Company Ownership and Geographic Presence
- 18.2.3 Product and Service Portfolio
- 18.2.4 Manufacturing and Operating Footprint
- 18.2.5 Production Capacity and Expansion Plans
- 18.2.6 Financial Performance and Investment
- 18.2.7 Market Share and Competitive Position
- 18.2.8 Technology and Innovation Capabilities
- 18.2.9 Strategic Alliances or Partnerships
- 18.2.10 Recent Developments
- 18.2.11 Growth Strategy and Outlook
- 18.3 Uber Technologies, Inc. (Uber Eats)
- 18.4 Wonder Group, Inc. (Grubhub)
- 18.5 Maplebear Inc. (Instacart)
- 18.6 Amazon.com, Inc.
- 18.7 Walmart Inc.
- 18.8 Domino's Pizza, Inc.
- 18.9 Olo Inc. (Thoma Bravo)
- 18.10 ChowNow, Inc.
- 18.11 Slice Solutions, Inc.
- 18.12 ezCater, Inc.
- 18.13 Other Relevant Market Participants
Note: Every listed company is profiled on the structure shown under the first company. The company list is preliminary and may change based on research findings, market developments, data availability and client requirements.
Chapter 19 Disclaimer
- 19.1 Research and Forecast Disclaimer
- 19.2 Data Source and Estimation Limitations
Note: The depth of individual sections depends on data availability for this market. Volume, capacity, trade and other unit-based metrics are included where applicable.