
Testing and tracing have become a budget line for AI teams
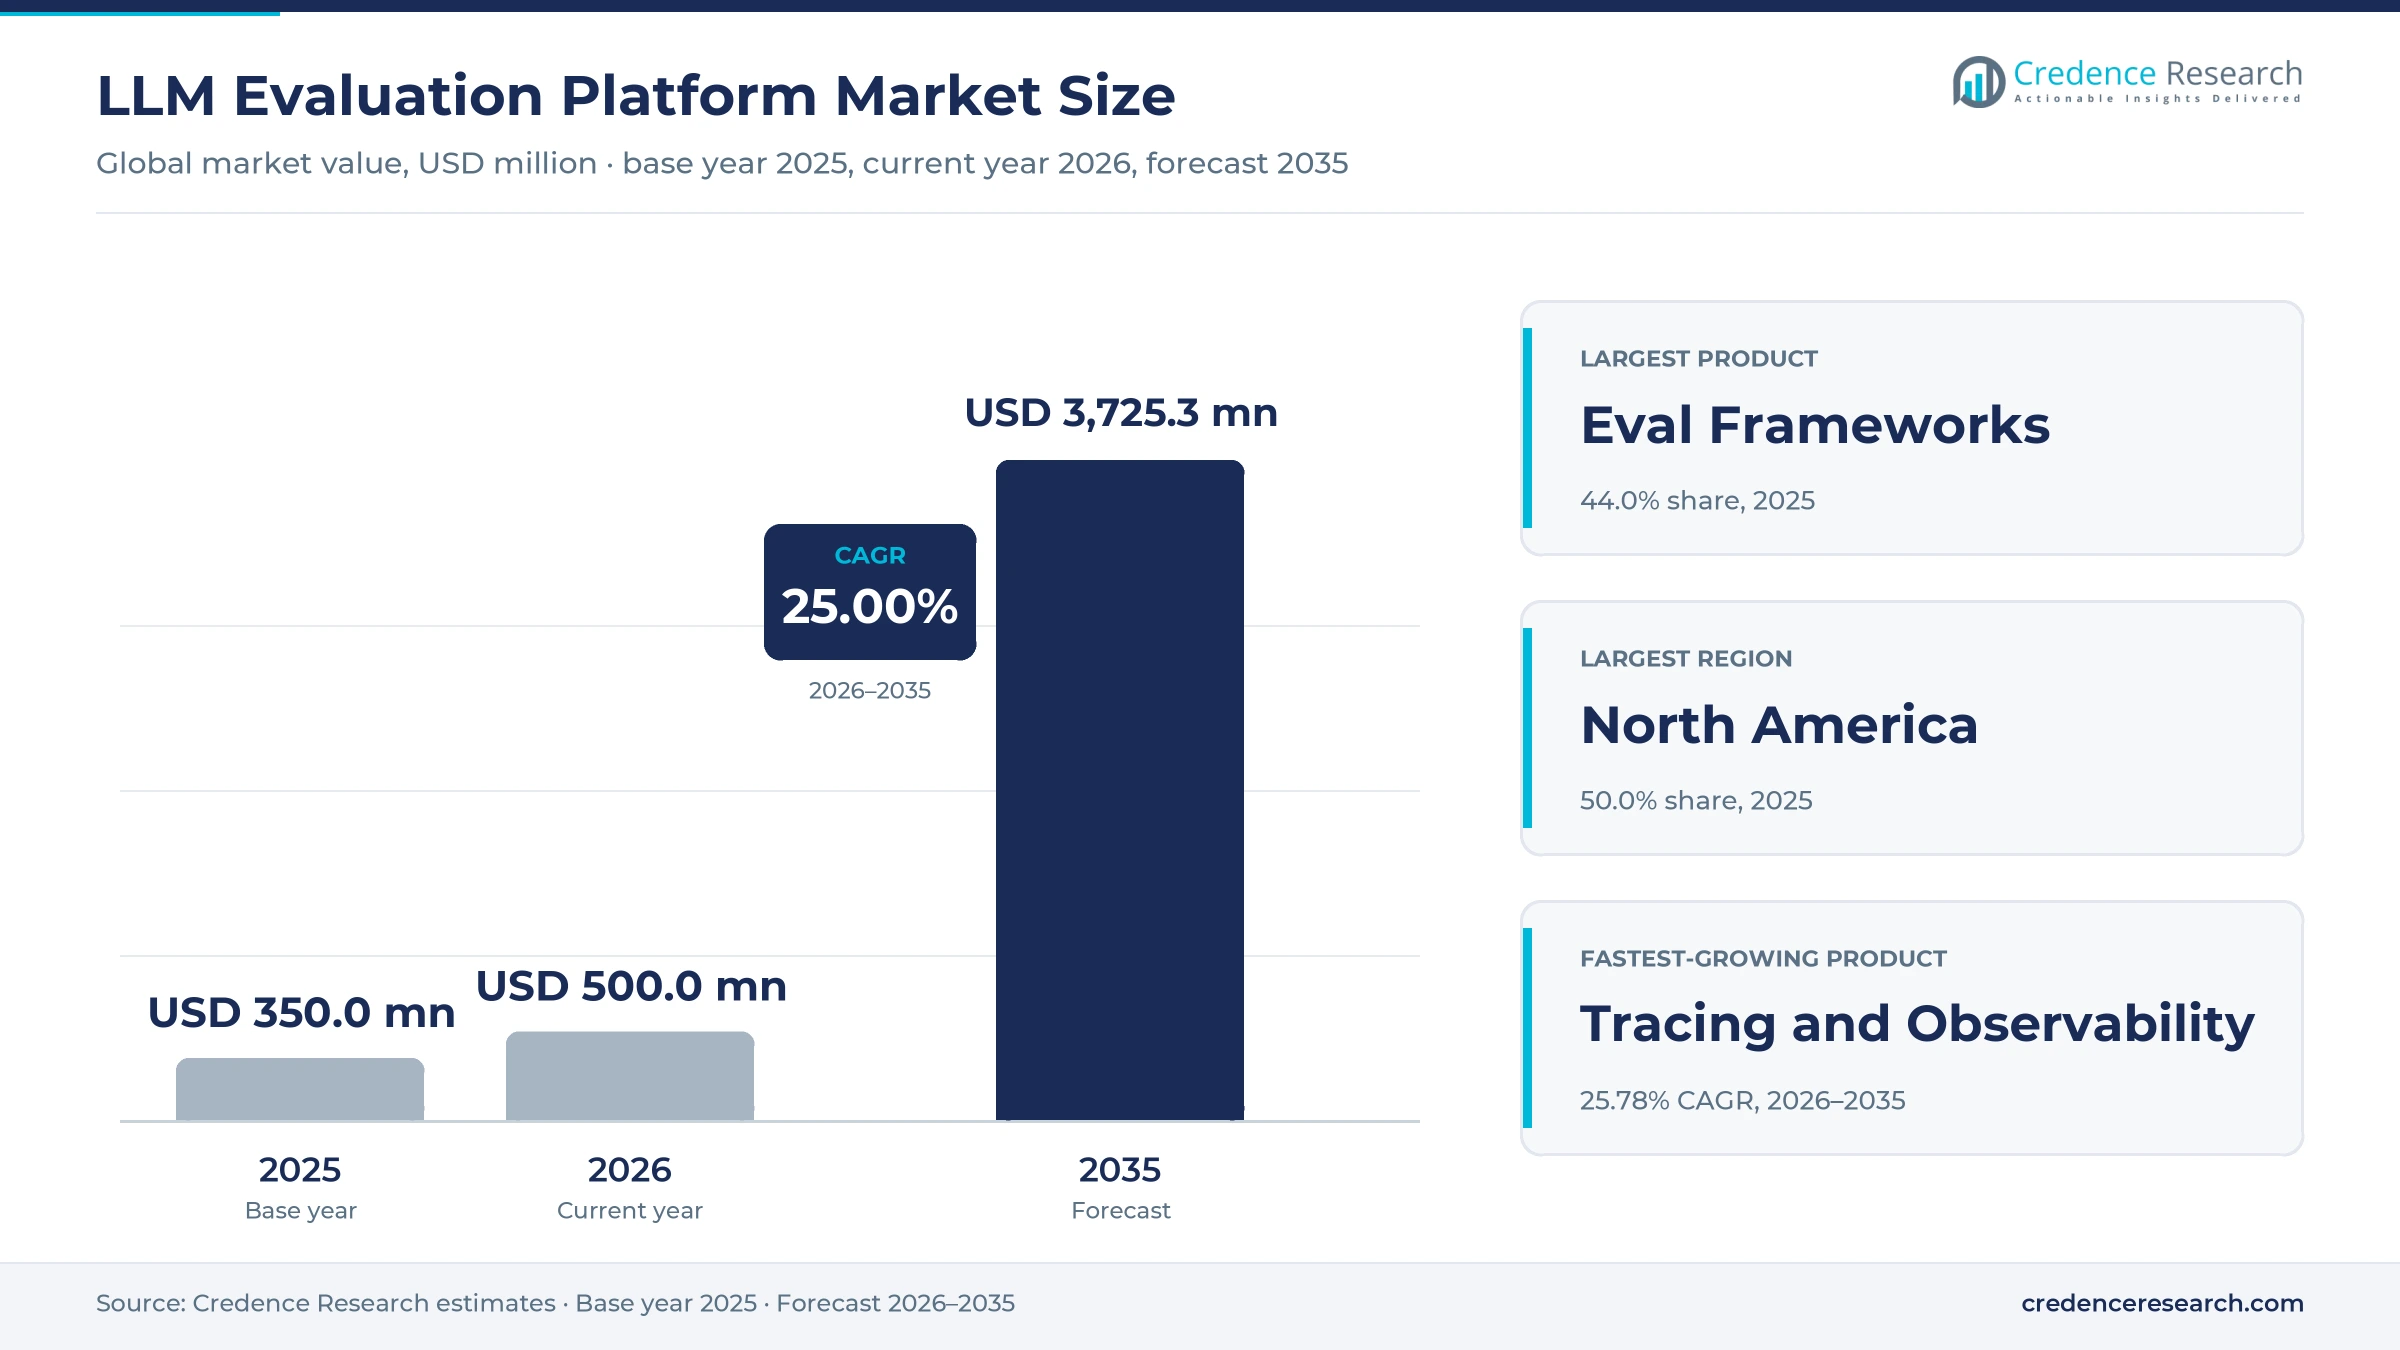
The global LLM evaluation platform market was valued at USD 400.0 million in 2025 and is projected to increase from USD 500.0 million in 2026 to USD 3.73 billion by 2035, registering a CAGR of 25.00% during 2026–2035. Spending comes from software teams and enterprises that test, score and monitor large language model applications before and after release, as chatbots, coding assistants and AI agents move into production. North America held the largest regional share, 50.0% in 2025, because U.S. private AI investment reached $109.1 billion in 2024, according to Stanford HAI. Asia Pacific is the fastest-growing region at 26.50% a year as Singapore, Japan and India build national testing programs. A major regulatory change came on Aug. 2, 2025, when EU obligations for providers of general-purpose AI models began to apply. Buyers are also moving from one-off benchmark runs to continuous scoring of live traffic and multi-step agent traces.
Which testing, tracing and review tools are counted here?
The LLM evaluation platform market covers software that tests, scores and monitors the outputs of applications built on large language models. This includes evaluation frameworks with test datasets and automated scorers, tracing and observability tools that log prompts, responses and tool calls in production, and human-review tools that route samples to reviewers for grading. Buyers pay through seat, usage or trace-volume subscriptions, or through enterprise licenses for self-hosted deployments.
The scope excludes model training compute, general application performance monitoring without language model features and outsourced human data labeling services. Free open-source tools are counted only where vendors sell paid cloud, support or enterprise editions around them, so value reflects what buyers actually pay to software providers.
LLM Evaluation Platform Market Insights
- The market is valued at USD 400.0 million in 2025 and is projected to reach USD 3.73 billion by 2035, growing at a 25.00% CAGR as production AI applications multiply.
- North America led with 50.0% of 2025 value, while Asia Pacific grows fastest at 26.50% a year through 2035 on national testing programs.
- Eval Frameworks held 44.0% of 2025 value, and Tracing and Observability is the fastest-growing product at 25.78% a year to 2035.
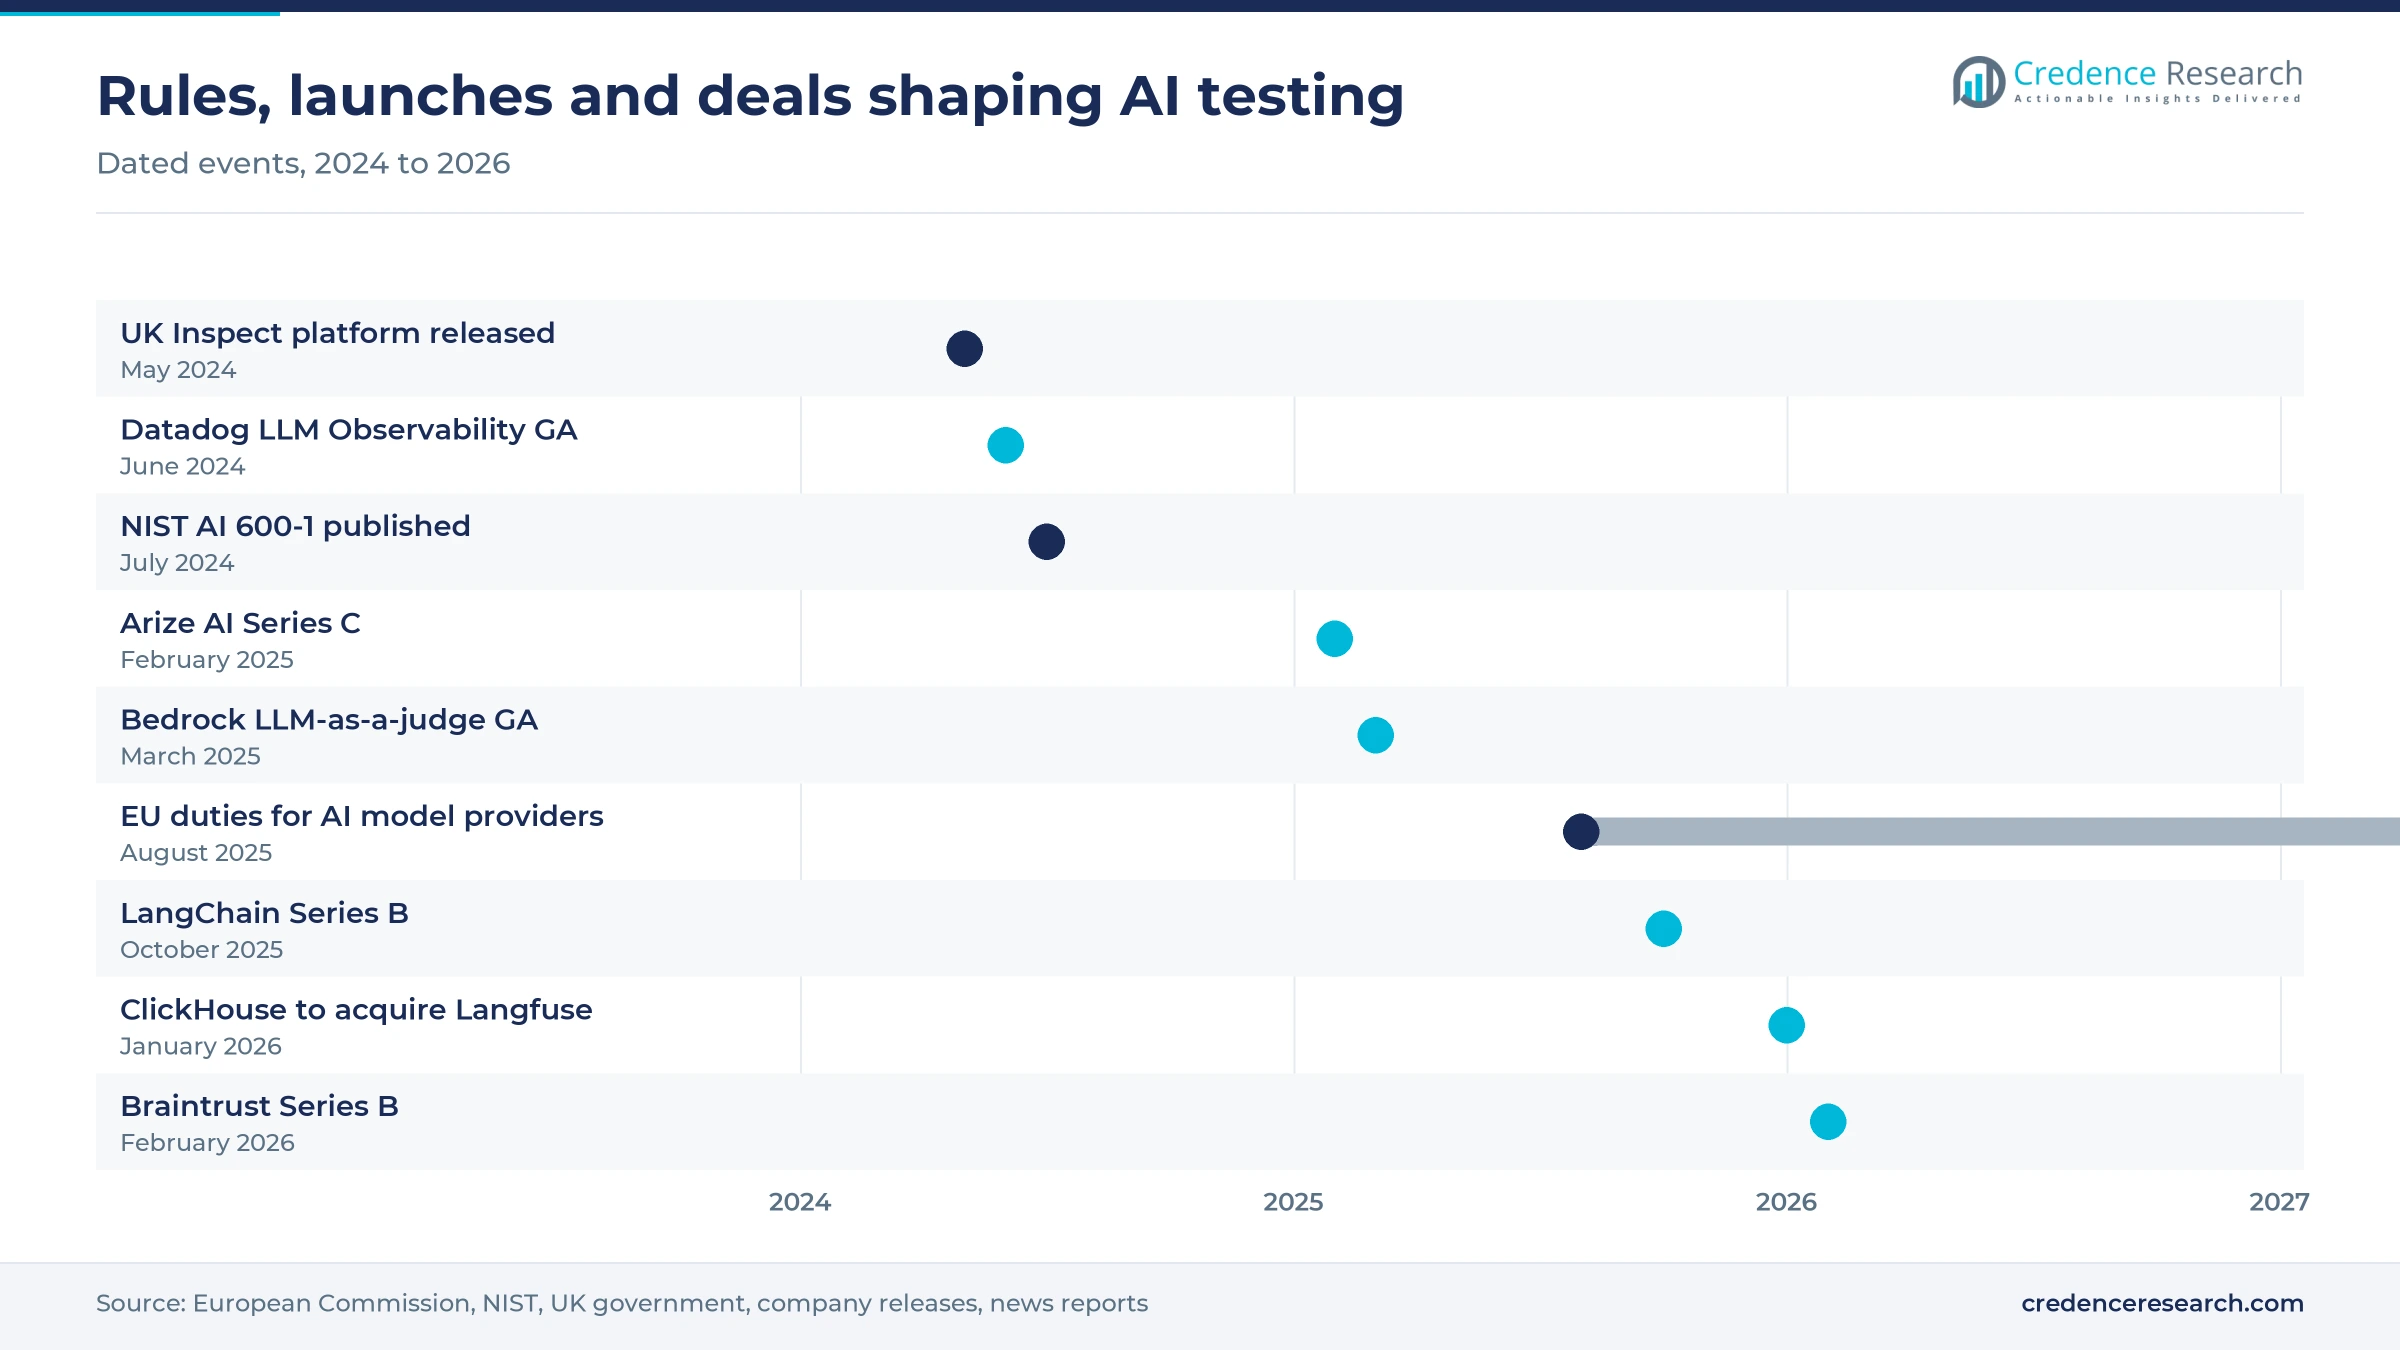
- ClickHouse agreed to acquire Langfuse in January 2026, and OpenAI agreed to acquire Promptfoo in March 2026, which signals rapid consolidation.
- Braintrust raised $80 million at an $800 million valuation in February 2026, showing strong investor appetite for evaluation and tracing tools.
Eval frameworks lead while tracing tools grow fastest
Why do eval frameworks hold the largest share?
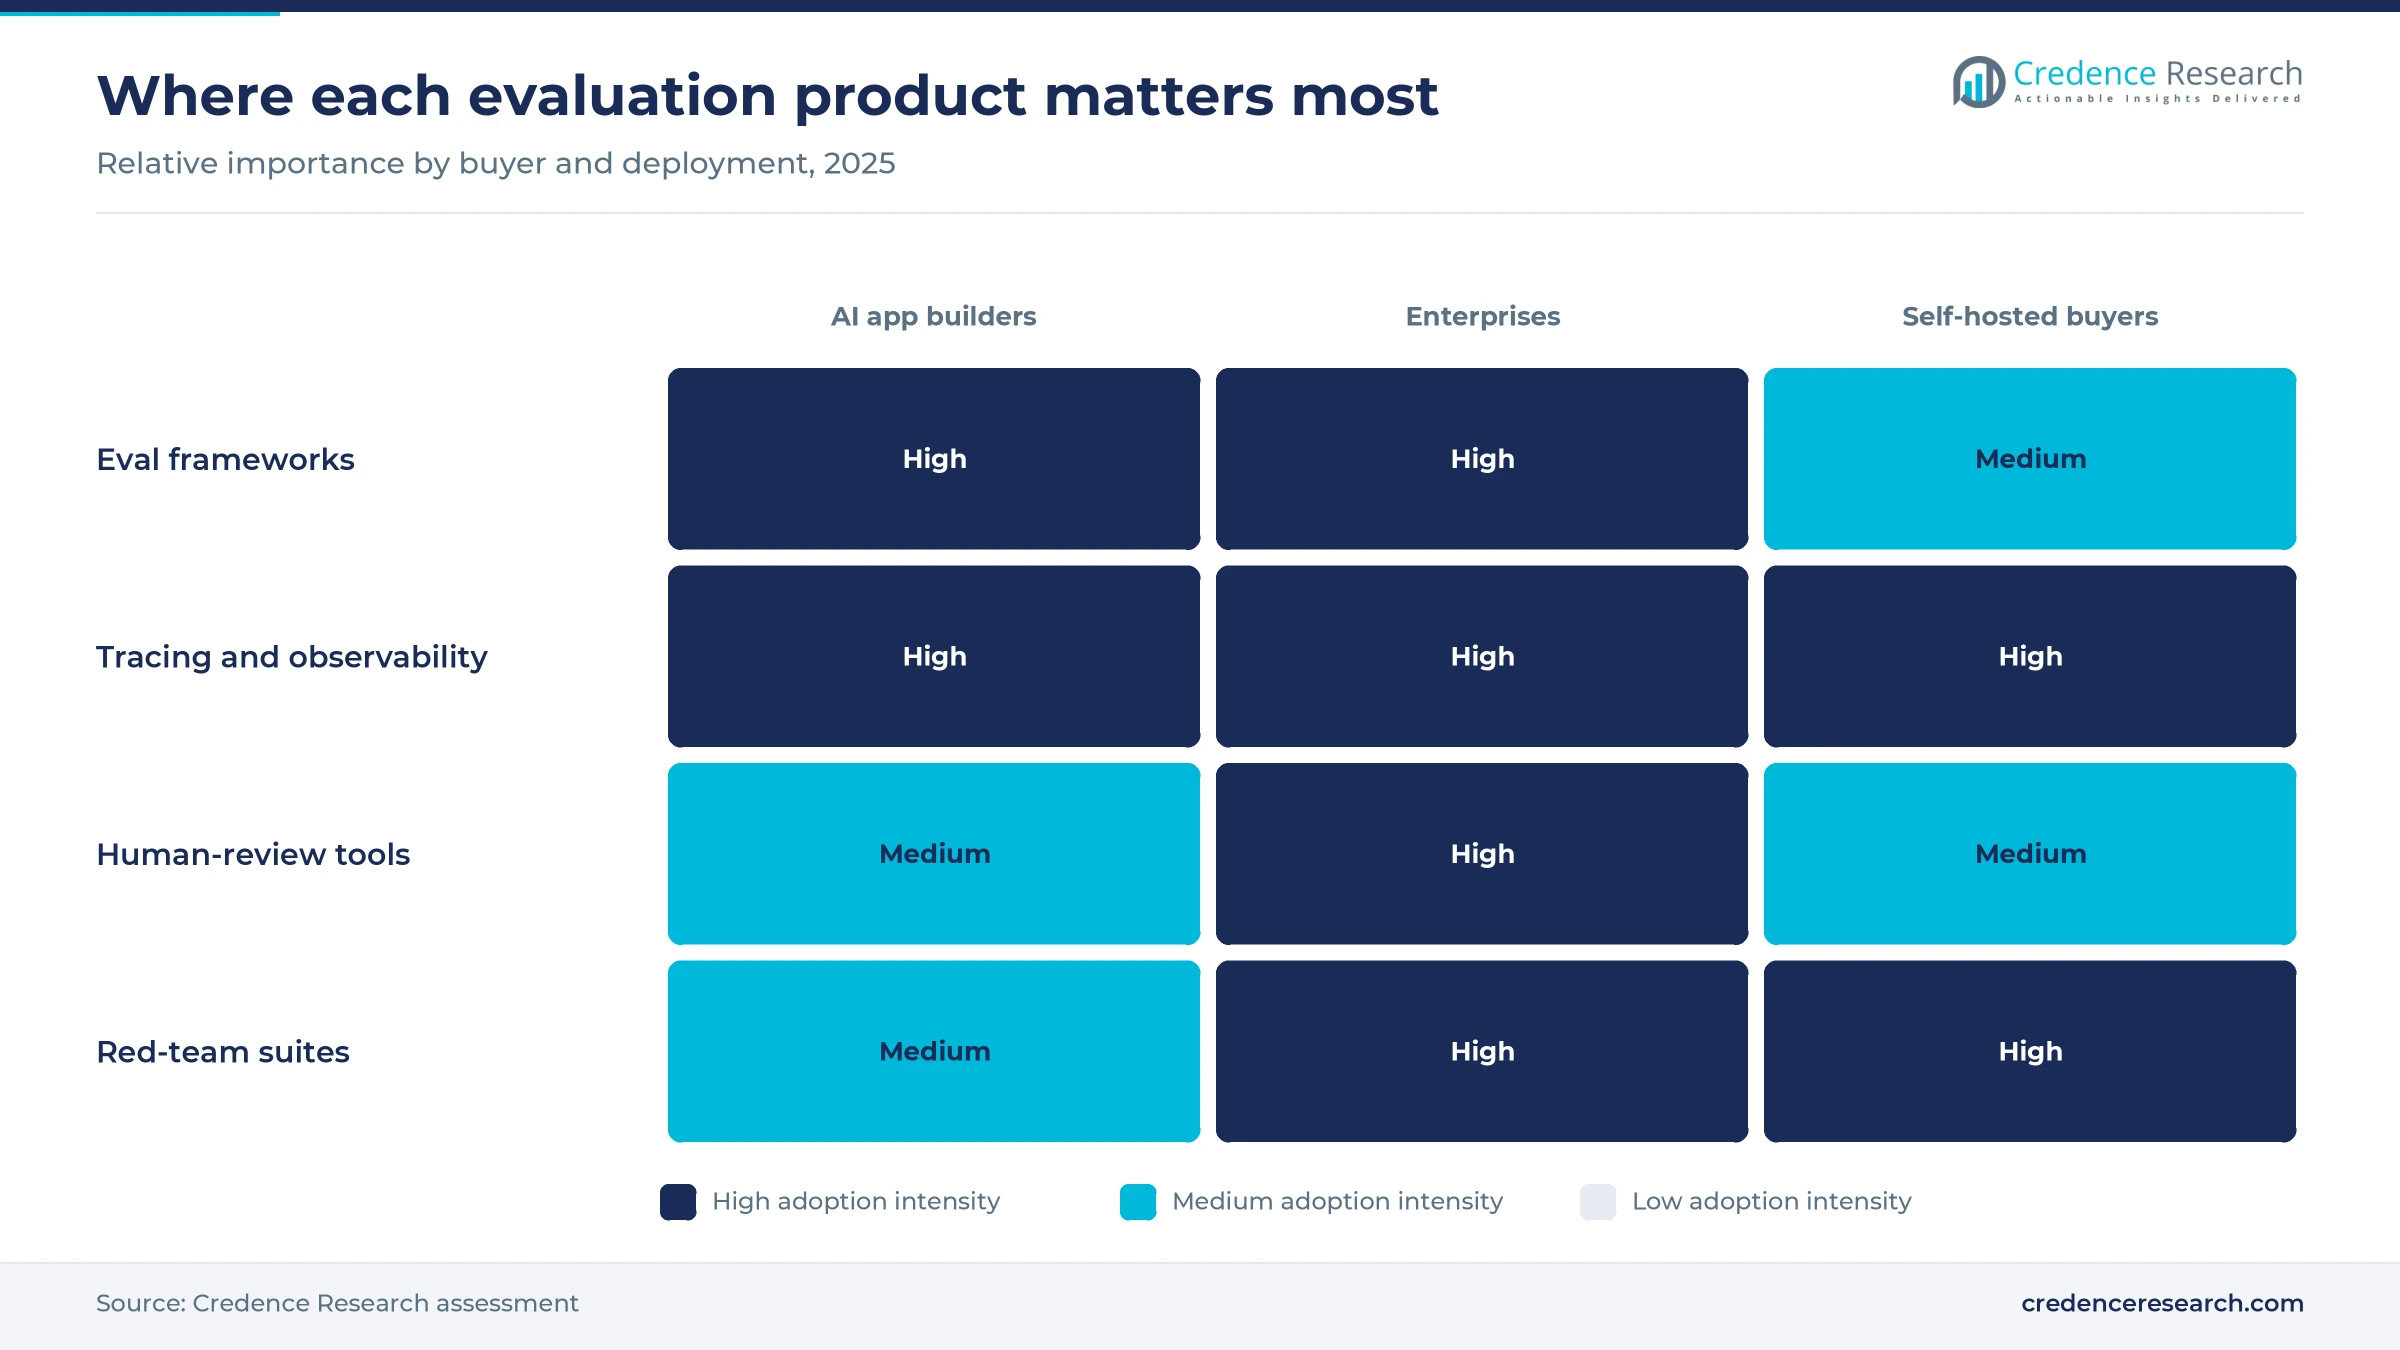
Based on product, the market is categorized into eval frameworks, tracing and observability, and human-review tools. Eval Frameworks led with 44.0% of 2025 value because teams buy test suites first, before an application reaches users. LangChain sells LangSmith with built-in testing features that check whether a new agent meets project requirements, according to SiliconANGLE in October 2025. Tracing and Observability grows fastest at 25.78% a year as agents create long, multi-step traces. Braintrust said its Brainstore database queries complex AI traces 80% faster when it raised $80 million in February 2026.
Why does SaaS lead while self-hosted grows faster?
Based on deployment, the market is categorized into SaaS and self-hosted. SaaS led with 68.0% of 2025 value because AI-native companies prefer managed tools that start in minutes. Braintrust counts Notion, Replit, Cloudflare, Ramp and Dropbox among its cloud customers, according to SiliconANGLE in February 2026. Self-Hosted grows fastest at 25.87% a year as regulated buyers keep prompts and traces in their own systems. Langfuse reported more than 6 million Docker pulls before ClickHouse agreed to acquire it in January 2026.
Why do AI app builders lead and enterprises grow faster?
Based on buyer, the market is categorized into AI app builders and enterprises. AI App Builders led with 55.0% of 2025 value because software companies that ship AI features test every model and prompt change. Datadog named WHOOP and AppFolio as early users when its LLM Observability product became generally available in June 2024. Enterprises grow fastest at 25.75% a year as large firms move pilots into regulated work. Galileo said in October 2024 that it had signed six Fortune 50 companies, while Langfuse reported 63 of the Fortune 500 as users in January 2026.
| Segment Group | Leading Sub-segment | Share, 2025 | Fastest-growing Sub-segment | CAGR, 2026–2035 |
|---|---|---|---|---|
| By Product | Eval Frameworks | 44.0% | Tracing and Observability | 25.78% |
| By Deployment | SaaS | 68.0% | Self-Hosted | 25.87% |
| By Buyer | AI App Builders | 55.0% | Enterprises | 25.75% |
Request a Free Sample
Fill in your details and we'll send you a free sample report.
- Sample data tables & charts
- Research methodology
Production LLM use and hallucination risk drive spending
LLM deployment growth creates automated test pipelines
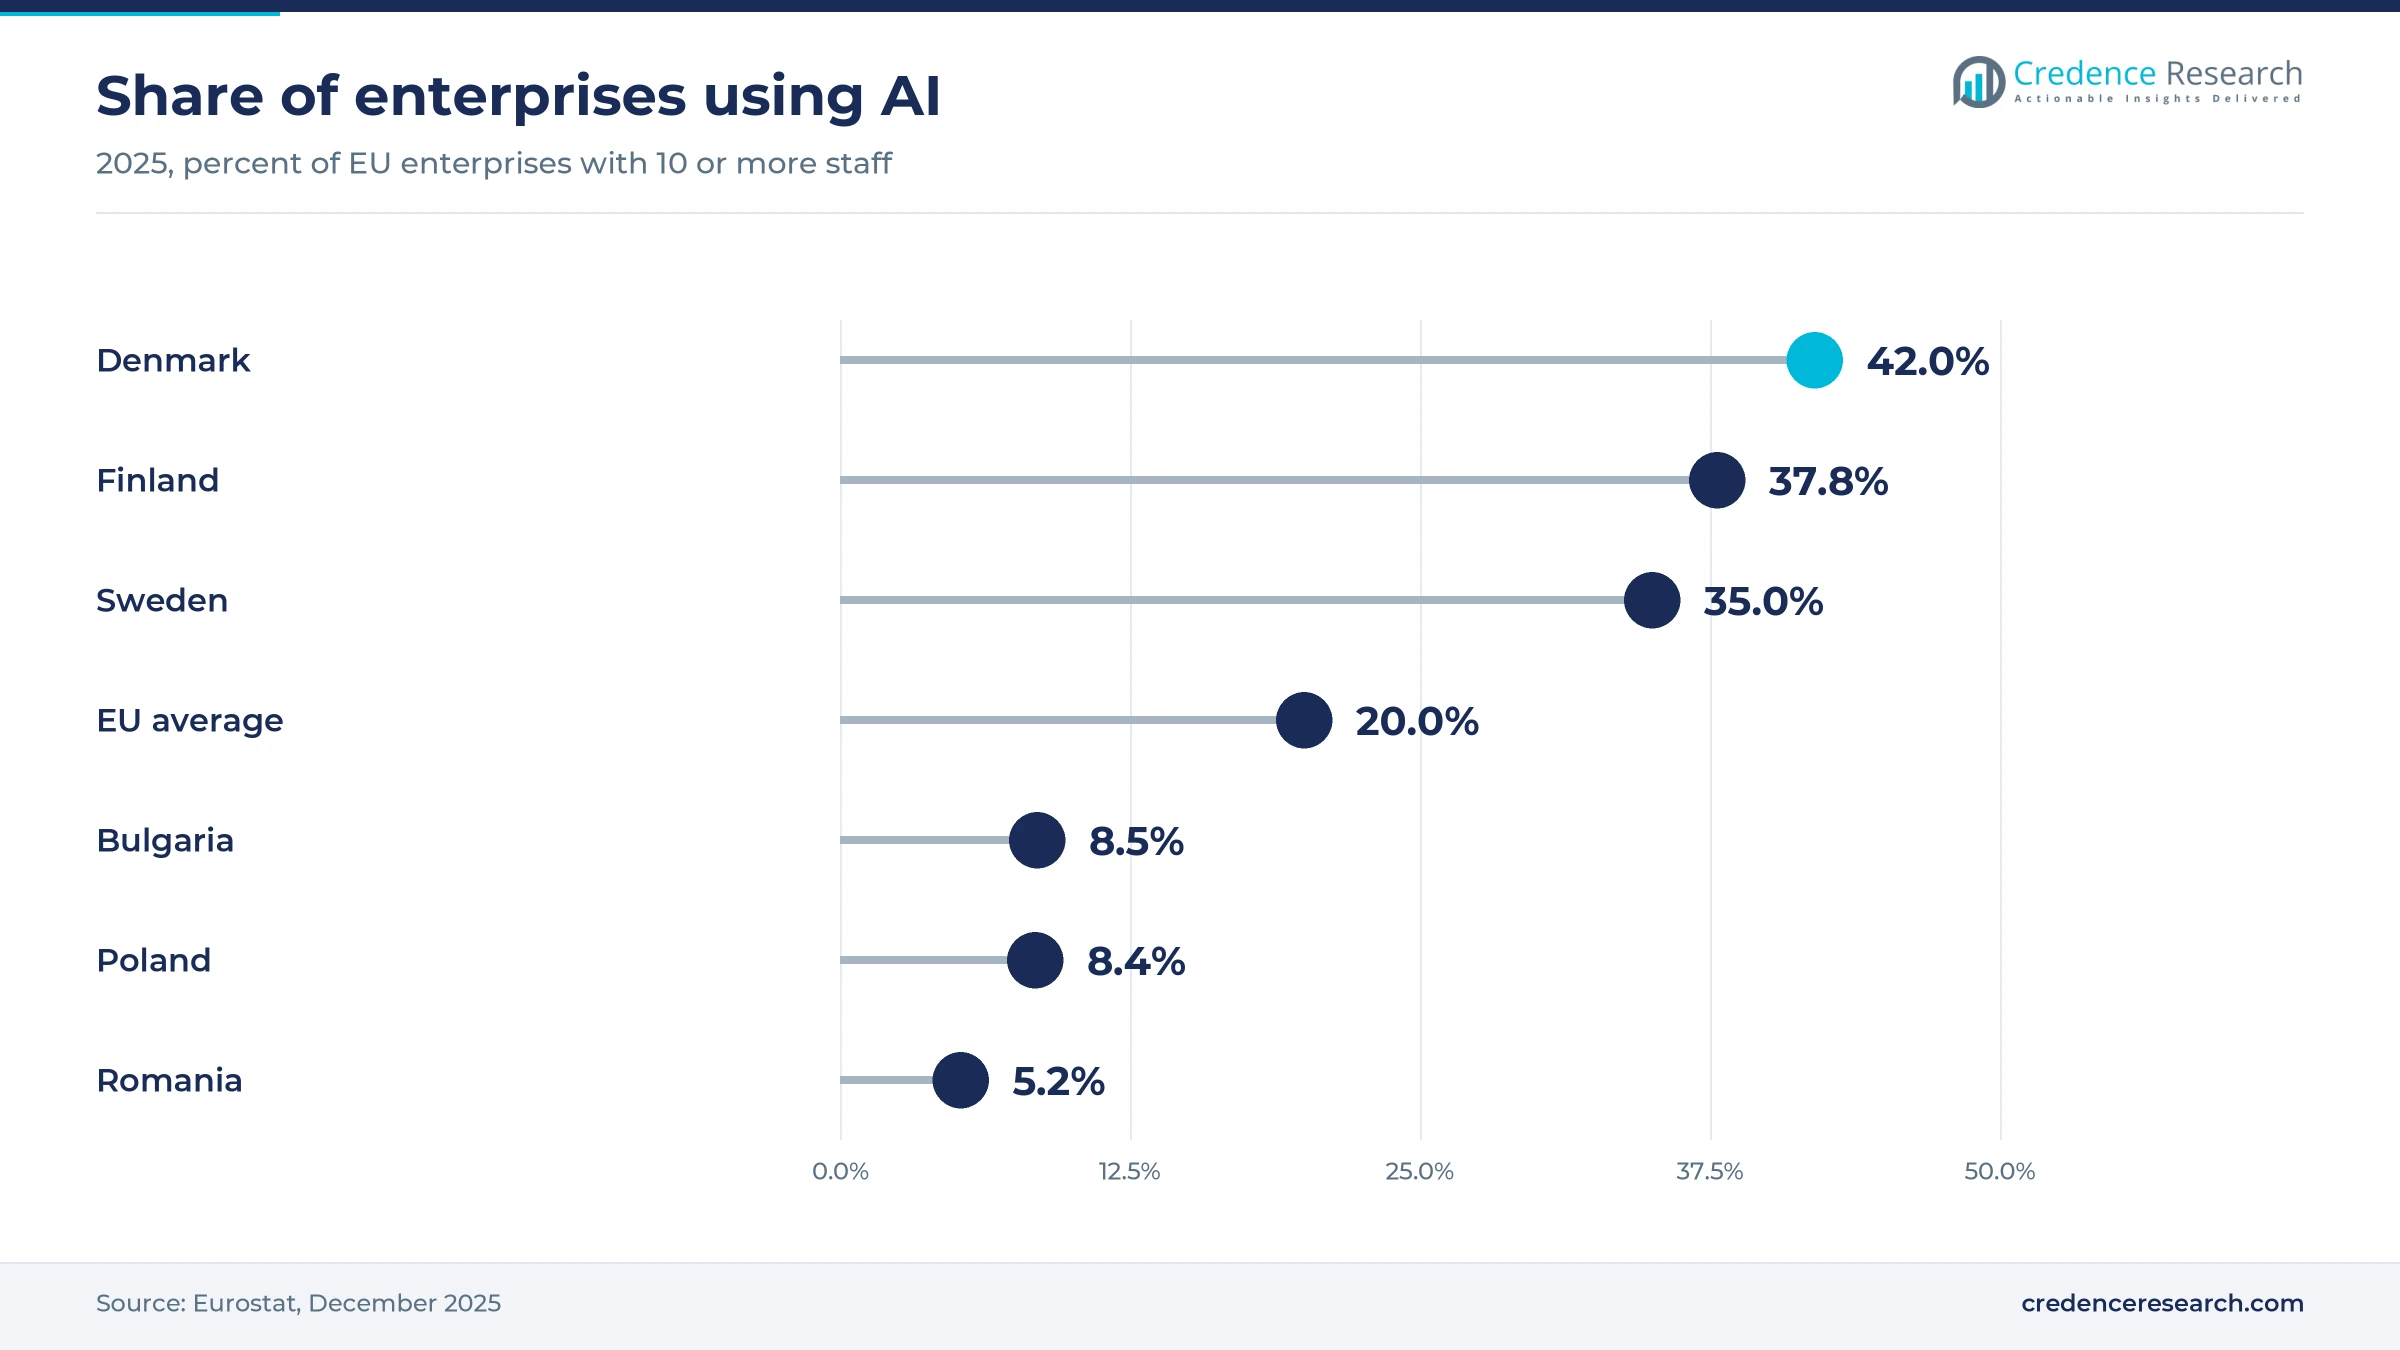
Each new production application built on large language models needs automated tests that run on every model, prompt and data change. Stanford HAI reported that 78% of organizations used AI in 2024, up from 55% a year earlier, which widens the pool of teams that need test pipelines. Eurostat data show that 20% of EU enterprises with 10 or more staff used AI in 2025, up from 13.5% in 2024. Amazon Web Services made LLM-as-a-judge evaluation generally available in Amazon Bedrock on March 20, 2025, which shows that automated scoring is now a standard cloud feature. In the Credence Research model this driver adds about 10.0 percentage points to annual growth to 2035.
Hallucination monitoring raises test volumes
Reliability failures make continuous monitoring a business requirement, because a wrong answer can carry legal and financial costs. The AI Incident Database recorded 233 AI-related incidents in 2024, a 56.4% rise over 2023, according to Stanford HAI. In February 2024, British Columbia's Civil Resolution Tribunal ordered Air Canada to pay a customer about C$812 after its website chatbot gave wrong bereavement fare advice, as Daily Hive reported. Datadog built hallucination and drift checks into its LLM Observability product at launch in June 2024, and Galileo's Luna models score hallucinations without ground truth data. In the Credence Research model this driver adds about 7.0 percentage points to annual growth to 2035.
Developer workflow integrations build recurring subscriptions
Tools that sit inside the daily developer workflow turn evaluation into a recurring subscription rather than a one-time project. Langfuse reported more than 23.1 million SDK installs a month and 20,000 GitHub stars, according to ClickHouse's acquisition announcement in January 2026. Weights & Biases now traces agents built with the OpenAI Agents SDK, Claude Agent SDK and Google ADK automatically once its Weave toolkit is started, as its PyPI listing shows. Promptfoo offers an open-source command-line tool that runs tests inside existing code workflows, according to SecurityWeek. In the Credence Research model this driver adds about 4.5 percentage points to annual growth to 2035.
AI safety rules and testing institutes formalize evaluation
Governments are turning model testing into documented practice, which pushes buyers toward tools that keep audit-ready records. EU obligations for general-purpose AI providers began on Aug. 2, 2025, with extra duties for models above 10^25 FLOP, according to the European Commission. NIST published its Generative AI Profile, NIST AI 600-1, on July 26, 2024, as a companion to the AI Risk Management Framework. The U.K. AI Safety Institute released its Inspect testing platform under an open-source licence on May 10, 2024. These steps make repeatable scoring a compliance task for providers and buyers rather than an optional engineering choice.
Agent tracing and platform consolidation reshape the field
Shift from prompt tests to agent trace analysis
Buyers are shifting from single prompt tests to analysis of full agent runs, because agents call tools and take many steps. Patronus AI launched Percival on May 14, 2025 to find the exact substep where an agent fails, covering more than 20 types of malfunctions, according to SiliconANGLE. Arize AI raised a $70 million Series C in February 2025, which it called the largest investment yet in AI observability, with Microsoft's M12 and Datadog among investors. Braintrust set out to become the observability layer for AI when it raised an $80 million Series B in February 2026. As a result, Tracing and Observability grows at 25.78% a year in the Credence Research model.
Rise of consolidation into data and model platforms
A rising number of evaluation vendors are being bought by data, cloud and model companies that want to own the feedback loop. CoreWeave completed its acquisition of Weights & Biases on May 5, 2025, adding a developer platform to its AI cloud, according to HPCwire. ClickHouse agreed to acquire Langfuse in January 2026, noting that Langfuse already ran entirely on the ClickHouse database in cloud and self-hosted form and counted 19 of the Fortune 50 as users. OpenAI agreed to acquire Promptfoo, which had raised more than $23 million, in March 2026 and plans to add automated red-teaming to its Frontier platform, as SecurityWeek reported. This shift puts pressure on independent vendors to prove neutrality across models.
Compliance-grade testing opens enterprise demand
Regulated enterprises offer a large opening for vendors that can turn test results into audit evidence for boards and regulators. Models already on the EU market before Aug. 2, 2025 must comply with general-purpose AI rules by Aug. 2, 2027, according to the European Commission. Galileo drew investment from Amex Ventures and Citi Ventures in its $45 million Series B in October 2024, which shows financial buyers backing evaluation tools they also use. Langfuse counted Intuit, Twilio, Merck and 7-Eleven among enterprise users in January 2026. Enterprises grow at 25.75% a year in the Credence Research model as these programs scale.
Sovereign and multilingual testing opens new regions
National AI programs open demand for testing in local languages and cultural contexts that English benchmarks miss. Singapore launched Project Moonshot on May 31, 2024, an open-source toolkit that tests local language understanding, built with IBM, DataRobot, Singtel and Temasek, according to the U.S.-ASEAN Business Council. India announced the IndiaAI Safety Institute in January 2025, and Saudi Arabia launched HUMAIN under the Public Investment Fund on May 12, 2025 with an Arabic language model as a stated aim, according to Argaam. These programs sit alongside wider generative AI investment, and Asia Pacific grows fastest in the Credence Research model.
Open-source tools, bundling and data rules weigh on vendors
Free open-source tools cap pricing power
Free open-source tools limit what vendors can charge for basic tracing and test runs. Langfuse had more than 20,000 GitHub stars in January 2026, the U.K. AI Safety Institute gives Inspect away under an open-source licence, and OpenAI said it would keep improving the open-source Promptfoo tool after its March 2026 deal, according to SecurityWeek. As a result, paid vendors must sell security, scale and support rather than core features. Many vendors respond with usage-based pricing, managed hosting and paid enterprise editions.
Cloud and monitoring vendors bundle evaluation
Bundling by large cloud and monitoring vendors squeezes stand-alone specialists in many accounts. Amazon Web Services added LLM-as-a-judge scoring to Amazon Bedrock in March 2025, and Datadog folded LLM tracing into its existing monitoring platform in June 2024. In turn, buyers that already pay these vendors may see evaluation as a free add-on. Specialists answer with deeper agent analysis, model-neutral scorers and integrations that work across clouds.
Traces carry sensitive data and residency rules
Production traces often hold personal data, contract text and source code, which raises privacy and residency risks. Datadog shipped a Sensitive Data Scanner with its June 2024 release to stop leaks of emails, IP addresses and other personal data in prompts. As a result, banks, insurers and public agencies often refuse multi-tenant SaaS for trace storage. Vendors respond with self-hosted editions, regional data centers and masking before data leaves the customer network.
Fast-changing agent risks outpace test suites
Agent behavior changes with every model and tool update, so test suites age quickly. Japan's AI Safety Institute stressed in its red-teaming guide, reported by BABL AI in October 2024, that testing must continue after deployment because threats change as systems are updated. Patronus AI found more than 20 types of agent malfunctions when it launched Percival in May 2025. This raises maintenance costs for buyers, and vendors now sell curated test libraries and automatic test generation.
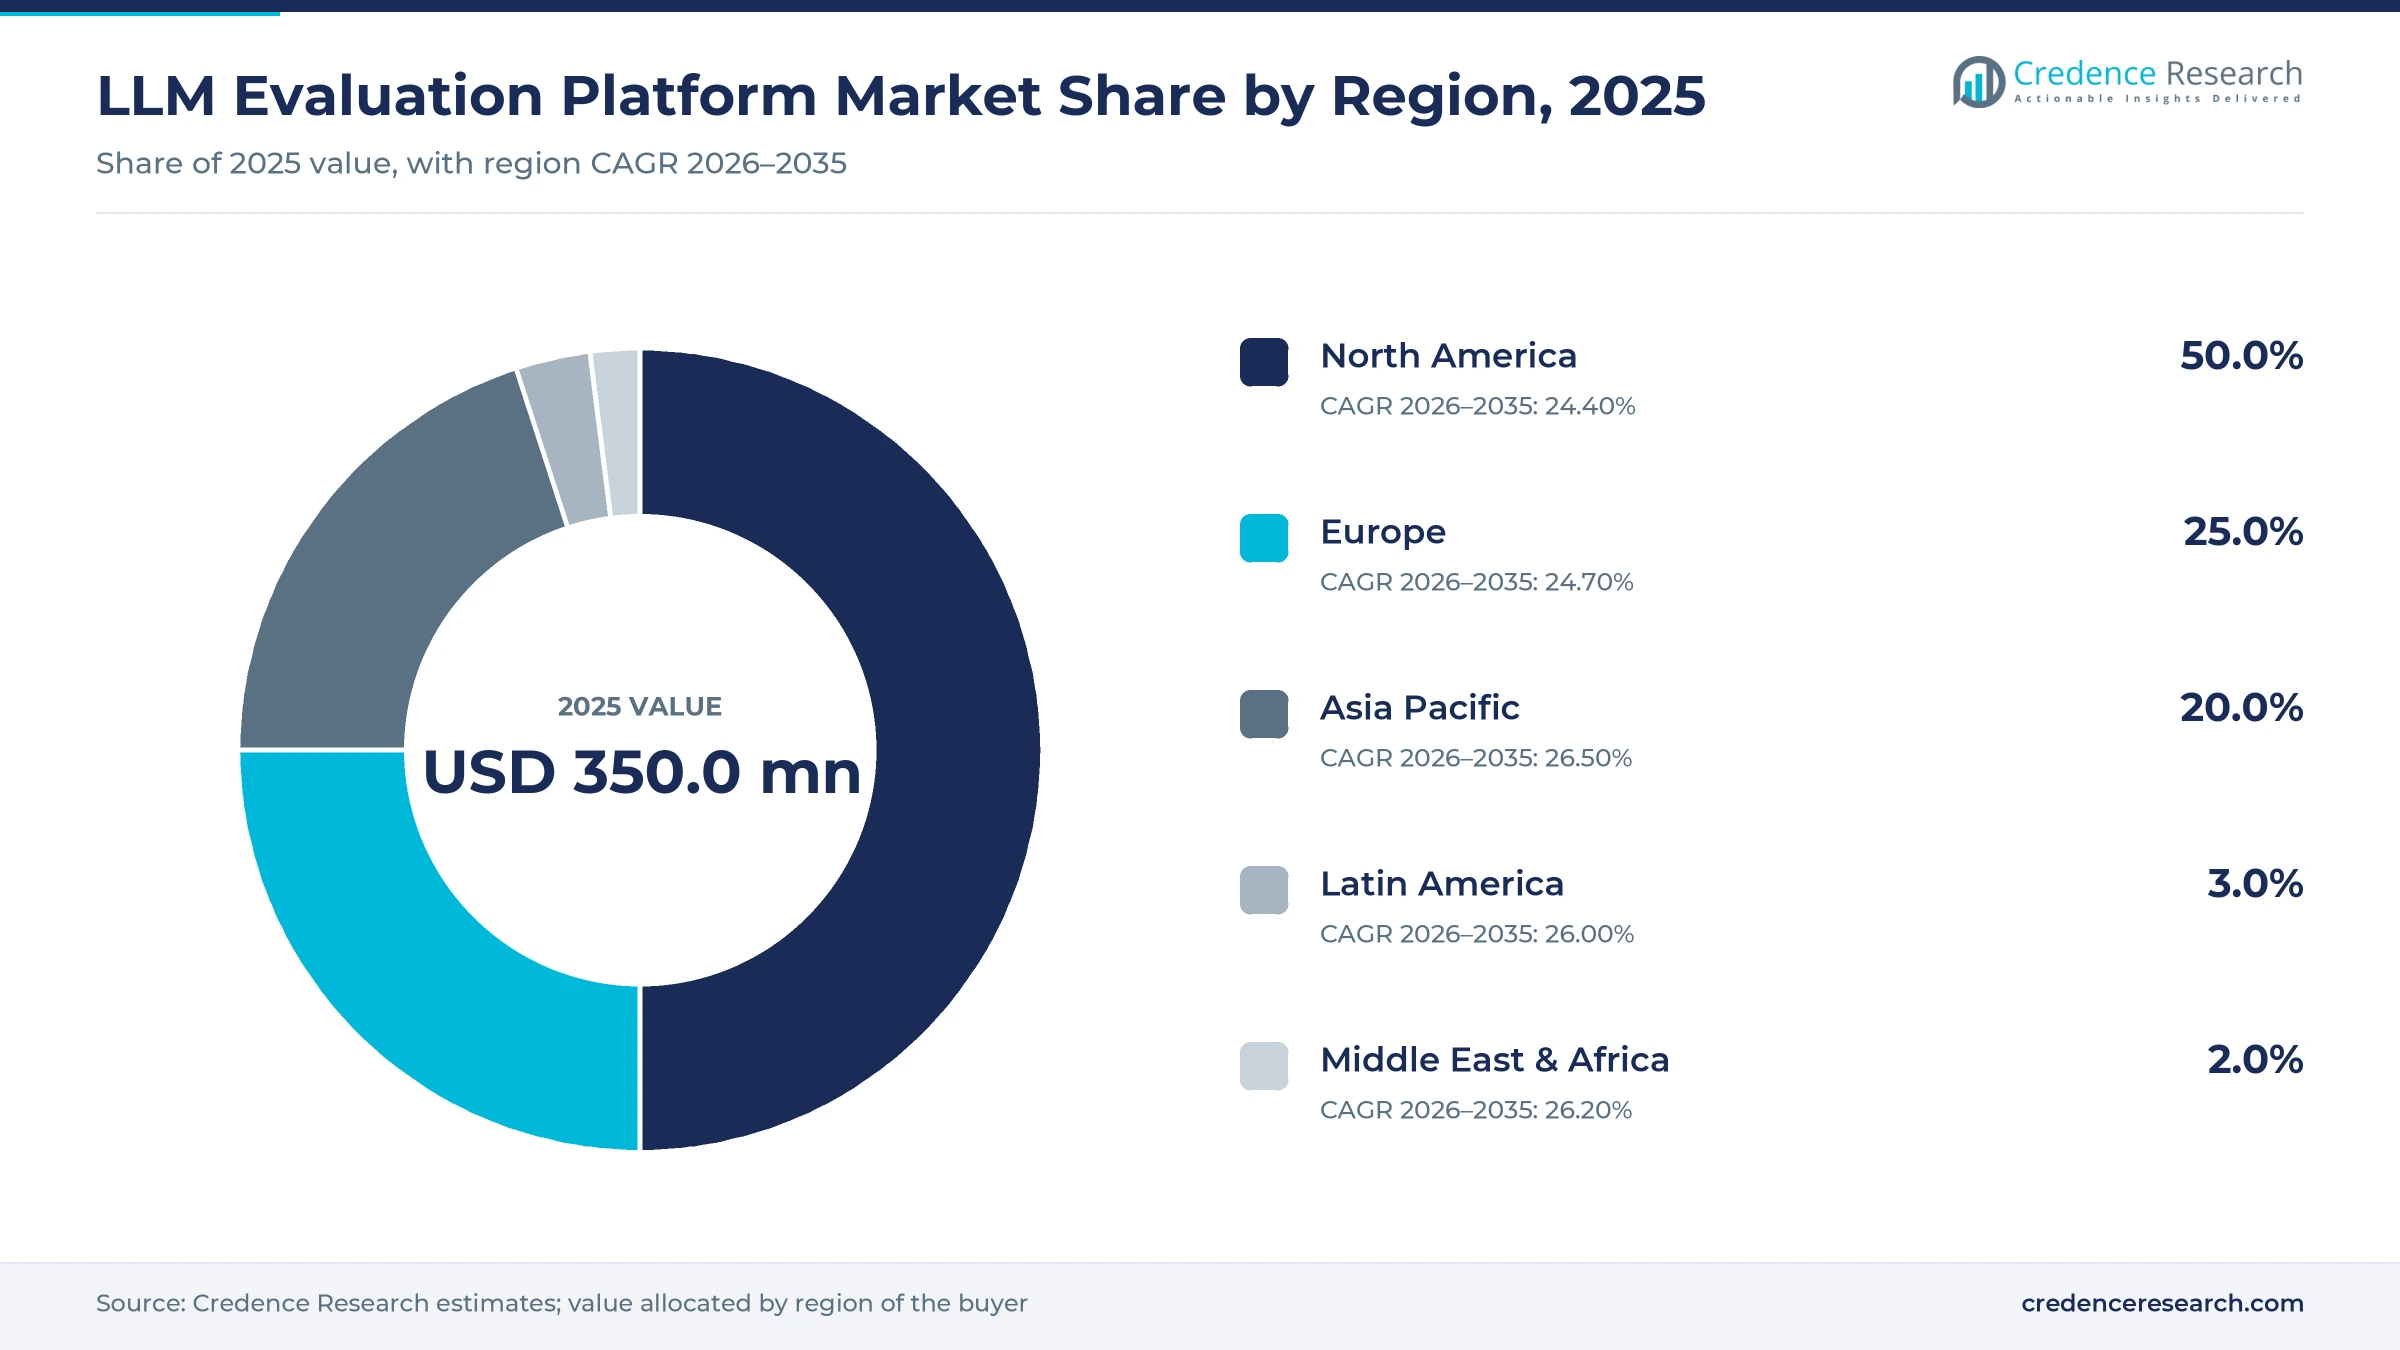
North America leads as Asia Pacific grows fastest
| Region | Value, 2025 (USD million) | Share, 2025 | CAGR, 2026–2035 |
|---|---|---|---|
| North America | 200.0 | 50.0% | 24.40% |
| Europe | 100.0 | 25.0% | 24.70% |
| Asia Pacific | 80.0 | 20.0% | 26.50% |
| Latin America | 12.0 | 3.0% | 26.00% |
| Middle East & Africa | 8.0 | 2.0% | 26.20% |
North America leads on AI investment and vendors
North America held 50.0% of 2025 value and grows at 24.40% a year to 2035. The region leads because U.S. private AI investment reached $109.1 billion in 2024, nearly 12 times China's $9.3 billion, according to Stanford HAI. Most specialist vendors, including Braintrust, Arize AI, LangChain, Galileo and Patronus AI, sell first to U.S. software companies. NIST's Generative AI Profile of July 2024 also gives U.S. enterprises a common checklist for testing.
Europe grows on EU compliance testing for AI models
Europe held 25.0% of 2025 value and grows at 24.70% a year to 2035. Eurostat data show AI use by enterprises ranged from 42% in Denmark to 5.2% in Romania in 2025, which leaves large room for growth. EU obligations for general-purpose AI providers that began in August 2025 raise demand for documented testing. The United Kingdom adds public tooling through the Inspect platform, and European buyers lean toward self-hosted deployments for data residency.
Asia Pacific grows fastest on national testing programs
Asia Pacific held 20.0% of 2025 value and is the fastest-growing region at 26.50% a year to 2035. Singapore released Project Moonshot in May 2024 to test models on local languages and safety. Japan's AI Safety Institute published a red-teaming methodology guide in 2024, and India announced the IndiaAI Safety Institute in January 2025. China drew $9.3 billion of private AI investment in 2024, according to Stanford HAI, which funds local model and application teams.
Latin America grows on public AI investment plans
Latin America held 3.0% of 2025 value and grows at 26.00% a year to 2035. Brazil presented its AI plan on July 30, 2024, with R$23 billion of investment planned for 2024 to 2028, according to Agência Gov. This funds public and private AI projects that will need testing in Portuguese. Of that sum, R$1.06 billion is expected to come from the private sector, according to the same source.
Middle East & Africa gains from Arabic model programs
Middle East & Africa held 2.0% of 2025 value and grows at 26.20% a year to 2035. HUMAIN, launched by Saudi Arabia's Public Investment Fund on May 12, 2025, plans Arabic language models, data centers and AI services for energy, health care and finance. These programs need tools that score answers in Arabic and track errors in regulated settings.
Funding rounds and acquisitions marked 2025 and 2026
| Development | Status and market relevance |
|---|---|
| In February 2025, Arize AI raised a $70 million Series C led by Adams Street Partners, with M12, Datadog and PagerDuty taking part. | Expands its AI evaluation and observability platform for agents |
| In May 2025, Patronus AI launched Percival, a tool that finds the failing step in AI agent workflows. | Covers more than 20 types of agent malfunctions |
| In October 2025, LangChain raised $125 million at a $1.25 billion valuation in a Series B led by IVP. | Funds LangSmith testing and monitoring for AI agents |
| In January 2026, ClickHouse agreed to acquire Langfuse, the open-source LLM tracing and evaluation project. | Ties trace storage to an analytics database used in cloud and self-hosted form |
| In February 2026, Braintrust raised an $80 million Series B led by Iconiq at an $800 million valuation. | Supports its evaluation and observability tools for AI products |
Judges, traces and red-team suites define the toolset
- LLM-as-a-judge scoring uses one model to grade another model's answers on correctness, completeness and tone, as in Amazon Bedrock evaluations.
- Small evaluator models such as Galileo's Luna suite check hallucinations and retrieval quality quickly and at lower cost than large judges.
- Distributed tracing records each prompt, response, tool call and latency step of a request so teams can find the root cause of errors.
- Red-team test suites simulate prompt injections, jailbreaks and data leaks, as in Promptfoo and Singapore's Project Moonshot.
Need a Custom Version of This Report?
Tailor the scope, geography, or segments to your exact requirements.
- Custom geography or segment scope
- Direct access to our analyst team
Specialists compete with cloud and monitoring vendors
Competition centers on depth of agent analysis, ease of setup inside developer workflows and trust in model-neutral scoring. Braintrust and LangChain's LangSmith sell to AI-native software companies, while Arize AI and Galileo target enterprises with monitoring and evaluator models. Patronus AI focuses on automated agent debugging, and Weights & Biases extends its developer platform with the Weave tracing toolkit under CoreWeave ownership. Specialists also face general IT observability tools vendors such as Datadog and cloud providers that bundle scoring into their AI services. Open-source projects shape pricing, and acquisitions by ClickHouse and OpenAI show that larger platforms want these tools in-house. Vendors that can store large trace volumes cheaply and explain failures in plain language are winning the largest accounts.
Companies profiled and their roles in this market
| Company | Type | Role in the market |
|---|---|---|
| Braintrust | Specialist vendor | Evaluation and observability for AI-native software teams |
| Arize AI | Specialist vendor | AI evaluation and observability with the open-source Phoenix project |
| LangChain (LangSmith) | Framework and tools vendor | Agent testing, tracing and monitoring through LangSmith |
| Weights & Biases | Developer platform (CoreWeave) | Weave toolkit for tracing and evaluating agents |
| Patronus AI | Specialist vendor | Automated agent debugging with Percival |
| Galileo | Specialist vendor | Luna evaluator models and enterprise monitoring |
Agent reliability will decide vendor share to 2035
Credence Research's view is that agent reliability, not raw benchmark scores, will decide vendor share through 2035. Buyers now need to know why a multi-step task failed, which favors vendors that combine tracing, automated judges and human review in one workflow. Human feedback for model training, sold as RLHF data services, remains a separate market from the software covered here. Consolidation will continue as data and model companies buy testing tools, so independent vendors must prove neutrality and lower cost per trace to grow faster than the market.
Model-based sizing checked against vendor activity
The report uses 2025 as the base year and forecasts values from 2026 to 2035 in U.S. dollars. Market values come from the Credence Research model, and the regional, product, deployment and buyer splits are Credence Research estimates. Inputs include public company announcements, funding releases, government and regulator publications, Eurostat statistics and the Stanford HAI AI Index. The 2025 value was checked against public vendor activity and funding signals. No interviews or surveys were conducted for this edition of the report.
Agents and compliance testing extend demand to 2035
The LLM evaluation platform market is expected to grow from USD 500.0 million in 2026 to USD 3.73 billion by 2035 as testing becomes a standing step in AI software delivery. Tracing and observability tools should gain share as agents take on longer tasks with more tool calls. Enterprises will buy more self-hosted and compliance-grade testing as EU rules reach older models in August 2027. Automated judges will cut the cost per test, which will raise test volumes rather than reduce spending. Asia Pacific and the Middle East will add demand for local language testing through 2035.
Frequently Asked Questions
How big is the LLM evaluation platform market?
Which product holds the largest share?
Which product grows fastest?
Which region leads the market?
Which region grows fastest?
Why is self-hosted deployment growing faster?
Who are the key companies in the market?
What are the main challenges for vendors?
Table of Content
Chapter 1 Market Segmentation
- 1.1 Segmentation Framework
- 1.1.1 Product and Service Classification
- 1.1.2 Application and End-Use Classification
- 1.1.3 Technology and Solution Classification
- 1.1.4 Customer and Distribution Channel Classification
- 1.1.5 Geographic Segmentation
- 1.1.6 Market Segment Definitions and Boundaries
- 1.2 By Product
- 1.2.1 Eval Frameworks
- 1.2.2 Tracing and Observability
- 1.2.3 Human-Review Tools
- 1.3 By Deployment
- 1.3.1 SaaS
- 1.3.2 Self-Hosted
- 1.4 By Buyer
- 1.4.1 AI App Builders
- 1.4.2 Enterprises
Chapter 2 Introduction
- 2.1 Report Objectives and Scope
- 2.2 Product Definition and Industry Terminology
- 2.3 Market Inclusions and Exclusions
- 2.4 Research Process
- 2.4.1 Primary Research and Expert Interviews
- 2.4.2 Secondary Research and Source Review
- 2.4.3 Top-Down and Bottom-Up Estimation
- 2.4.4 Data Triangulation and Verification
- 2.5 Market Size Measurement Basis
- 2.5.1 2025: USD 400.0 million → 2035: USD 3.73 billion
- 2.6 Historical and Forecast Reference Periods
- 2.6.1 Historical Period: 2018-2025
- 2.6.2 Base Year: 2025
- 2.6.3 Forecast Period: 2025-2035
- 2.7 Research Assumptions and Limitations
Chapter 3 Executive Summary
- 3.1 Market Snapshot and Key Findings
- 3.2 Base-Year Market Size, 2025
- 3.3 Forecast Market Size, 2035
- 3.4 Revenue and Volume Growth Outlook
- 3.5 Key Demand and Supply Indicators
- 3.6 Leading Market Segments
- 3.7 Fastest-Growing Market Opportunities
- 3.8 Regional Performance Highlights
- 3.9 Technology and Industry Transformation
- 3.10 Competitive Landscape Summary
- 3.11 Analyst View and Strategic Implications
Chapter 4 Global LLM Evaluation Platform Market Trends and Developments
- 4.1 Historical Industry Development, 2018-2025
- 4.2 Recent Market Trends and Developments
- 4.3 Demand and Customer Behavior Trends
- 4.4 Technology and Product Innovation
- 4.5 Artificial Intelligence, Automation and Digitalization
- 4.6 Local Manufacturing and Supply Chain Realignment
- 4.7 Industry Partnerships, Mergers and Acquisitions
- 4.8 Sustainability and Circular Economy Developments
- 4.9 Government and Private Sector Investment Trends
- 4.10 Emerging Business Models and Commercialization
- 4.11 Industry Developments and Announcements
Chapter 5 Global LLM Evaluation Platform Market Supply and Demand Analysis
- 5.1 Demand Trend and Consumption Analysis, 2018-2025
- 5.2 Demand Forecast, 2025-2035
- 5.3 Supply Chain Structure and Procurement Trends
- 5.4 Supply-Demand Gap and Bottlenecks
- 5.5 Import Dependence and Sourcing Structure
- 5.6 Regional Supply and Demand Concentration
Chapter 6 Global LLM Evaluation Platform Market Pricing Analysis
- 6.1 Pricing Structure and Measurement
- 6.2 Historical Pricing Trends, 2018-2025
- 6.3 Pricing Outlook, 2025-2035
- 6.4 Pricing by Product and Market Segment
- 6.5 Geographic Pricing Differences
- 6.6 Key Input, Energy, Labor and Logistics Costs
- 6.7 Contract Pricing and Purchasing Models
- 6.8 Pricing Sensitivity and Competitive Positioning
- 6.9 Price, Margin and Profitability Implications
Chapter 7 Global LLM Evaluation Platform Market Dynamics
- 7.1 Market Growth Drivers
- 7.1.1 Demand-Side Drivers
- 7.1.2 Technology and Innovation Drivers
- 7.1.3 Infrastructure and Investment Drivers
- 7.1.4 Regulatory and Policy Drivers
- 7.2 Market Restraints
- 7.2.1 Cost and Affordability Constraints
- 7.2.2 Technology and Adoption Barriers
- 7.2.3 Supply Chain and Operational Constraints
- 7.3 Market Challenges
- 7.3.1 Competitive Pressure and Margin Erosion
- 7.3.2 Skills, Infrastructure and Implementation Gaps
- 7.4 Emerging Market Opportunities
- 7.5 Market Dynamics Impact and Time-Horizon Assessment
Chapter 8 Global LLM Evaluation Platform Value Chain Analysis
- 8.1 Industry Value Chain Overview
- 8.2 Upstream Suppliers and Critical Inputs
- 8.3 Technology and Component Providers
- 8.4 Manufacturing or Service Delivery
- 8.5 Distribution, Channel Partners and Integrators
- 8.6 Downstream Applications and End Users
- 8.7 Value Addition and Profit Pools
- 8.8 Vertical Integration and Outsourcing
- 8.9 Supplier Concentration and Risk
- 8.10 Supply Chain Localization and Resilience
Chapter 9 Global LLM Evaluation Platform Market Regulations and Policies
- 9.1 Relevant Laws, Standards and Compliance Frameworks
- 9.2 Product, Service, Safety and Quality Requirements
- 9.3 Government Policies, Incentives and Subsidies
- 9.4 Imports, Exports and Trade Barriers
- 9.5 Public Procurement and Local Content Requirements
- 9.6 Data Protection, AI and Cybersecurity Compliance
- 9.7 Upcoming Policy Changes and Market Implications
Chapter 10 Global LLM Evaluation Platform Market Hotspots and Opportunities
- 10.1 Market Opportunity Mapping and Growth Hotspots
- 10.2 High-Growth Applications and Customer Groups
- 10.3 Underserved Markets and White-Space Opportunities
- 10.4 Emerging Technology and Product Opportunities
- 10.5 New Capacity and Investment Hotspots
- 10.6 Market Entry and Expansion Opportunities
- 10.7 Distribution and Partnership Opportunities
- 10.8 Near-Term and Long-Term Commercial Potential
- 10.9 Opportunity Attractiveness and Execution Risks
Chapter 11 Global LLM Evaluation Platform Market Outlook, 2025-2035
- 11.1 Market Size and Analysis
- 11.1.1 Revenue (Market Measurement: 2025: USD 400.0 million → 2035: USD 3.73 billion)
- 11.1.2 Historical Market Size, 2018-2025
- 11.1.3 Base-Year Market Size, 2025
- 11.2 Market Forecast, 2025-2035
- 11.2.1 Revenue Forecast to 2035
- 11.2.2 CAGR and Year-on-Year Growth
- 11.2.3 Incremental Revenue Opportunity
- 11.3 Forecast Assumptions and Scenario Analysis
- 11.3.1 Base-Case Forecast
- 11.3.2 Optimistic and Conservative Scenarios
- 11.3.3 Technology, Pricing and Policy Sensitivities
- 11.4 Market Attractiveness and Growth Outlook
Chapter 12 Global LLM Evaluation Platform Market Segmentation and Outlook
- 12.1 Segmentation Summary and Market Shares, 2025
- 12.2 Largest and Fastest-Growing Segments
- 12.3 By Product - Market Size and Forecast, 2025-2035
- 12.3.1 Segment Definition and Scope
- 12.3.2 Historical Market Size, 2018-2025
- 12.3.3 Revenue Forecast, 2025-2035
- 12.3.4 Base-Year Market Share, 2025
- 12.3.5 Segment CAGR and Growth Drivers
- 12.3.6 Subsegment Market Size and Forecast
- 12.3.6.1 Eval Frameworks
- 12.3.6.2 Tracing and Observability
- 12.3.6.3 Human-Review Tools
- 12.3.7 Subsegment Pricing and Adoption Trends
- 12.3.8 Leading Suppliers and Competition
- 12.3.9 Regional Demand and Opportunities
- 12.4 By Deployment - Market Size and Forecast, 2025-2035
- 12.4.1 Segment Definition and Scope
- 12.4.2 Historical Market Size, 2018-2025
- 12.4.3 Revenue Forecast, 2025-2035
- 12.4.4 Base-Year Market Share, 2025
- 12.4.5 Segment CAGR and Growth Drivers
- 12.4.6 Subsegment Market Size and Forecast
- 12.4.6.1 SaaS
- 12.4.6.2 Self-Hosted
- 12.4.7 Subsegment Pricing and Adoption Trends
- 12.4.8 Leading Suppliers and Competition
- 12.4.9 Regional Demand and Opportunities
- 12.5 By Buyer - Market Size and Forecast, 2025-2035
- 12.5.1 Segment Definition and Scope
- 12.5.2 Historical Market Size, 2018-2025
- 12.5.3 Revenue Forecast, 2025-2035
- 12.5.4 Base-Year Market Share, 2025
- 12.5.5 Segment CAGR and Growth Drivers
- 12.5.6 Subsegment Market Size and Forecast
- 12.5.6.1 AI App Builders
- 12.5.6.2 Enterprises
- 12.5.7 Subsegment Pricing and Adoption Trends
- 12.5.8 Leading Suppliers and Competition
- 12.5.9 Regional Demand and Opportunities
- 12.6 Segment Growth Comparison
- 12.7 Segment Attractiveness and Priority Matrix
Chapter 13 Global LLM Evaluation Platform Geographic Market Outlook, 2025-2035
- 13.1 Regional Market Size and Share, 2025
- 13.2 Regional Market Forecast, 2025-2035
- 13.3 Regional Pricing, Production and Demand Differences
- 13.4 North America
- 13.4.1 United States
- 13.4.2 Canada
- 13.4.3 Mexico
- 13.5 Europe
- 13.5.1 Germany
- 13.5.2 France
- 13.5.3 Italy
- 13.5.4 United Kingdom
- 13.5.5 Spain
- 13.5.6 Poland
- 13.5.7 Russia
- 13.5.8 Netherlands
- 13.5.9 Belgium
- 13.5.10 Sweden
- 13.5.11 Denmark
- 13.5.12 Norway
- 13.5.13 Rest of Europe
- 13.6 Asia Pacific
- 13.6.1 China
- 13.6.2 India
- 13.6.3 Japan
- 13.6.4 South Korea
- 13.6.5 Thailand
- 13.6.6 Indonesia
- 13.6.7 Vietnam
- 13.6.8 Malaysia
- 13.6.9 Australia
- 13.6.10 Rest of Asia Pacific
- 13.7 Latin America
- 13.7.1 Brazil
- 13.7.2 Argentina
- 13.7.3 Colombia
- 13.7.4 Chile
- 13.7.5 Rest of Latin America
- 13.8 Middle East
- 13.8.1 Saudi Arabia
- 13.8.2 United Arab Emirates
- 13.8.3 Turkey
- 13.8.4 Israel
- 13.8.5 Iran
- 13.8.6 Rest of the Middle East
- 13.9 Africa
- 13.9.1 South Africa
- 13.9.2 Egypt
- 13.9.3 Nigeria
- 13.9.4 Morocco
- 13.9.5 Rest of Africa
- 13.10 Regional Investment, Policy and Supply Chain Differences
- 13.11 Regional Competitive Landscape
- 13.12 Geographic Growth Hotspots
Chapter 14 Global LLM Evaluation Platform Technology, Innovation and Sustainability Outlook
- 14.1 Technology Landscape and Maturity
- 14.2 Product, Process and Service Innovation
- 14.3 AI, Automation and Digital Tools in the Industry
- 14.4 Technology Adoption and Performance Benchmarking
- 14.5 Innovation Pipeline and R&D Investment
- 14.6 Patent and Intellectual Property Trends
- 14.7 Energy Efficiency and Resource Management
- 14.8 Sustainability, Recycling and Circularity
- 14.9 Technology Roadmap, 2025-2035
- 14.10 Risks of Obsolescence and Technology Substitution
Chapter 15 Global LLM Evaluation Platform Market Key Strategic Imperatives
- 15.1 Growth and Market Entry Priorities
- 15.2 High-Return Products and Segments
- 15.3 Pricing, Profitability and Cost Optimization
- 15.4 Technology Investment and Product Differentiation
- 15.5 Supply Chain Localization and Resilience
- 15.6 Distribution and Customer Acquisition
- 15.7 Partnership, Acquisition and Capacity Strategy
- 15.8 Regional Expansion Priorities
- 15.9 Short-, Medium- and Long-Term Actions
Chapter 16 Competition Outlook
- 16.1 Industry Competition Characteristics
- 16.2 Market Structure and Concentration
- 16.3 Market Share and Competitive Positioning, 2025
- 16.4 Company-Wise Revenue and Product Benchmarking
- 16.5 Production and Service Capacity Benchmarking
- 16.6 Technology, Pricing and Differentiation
- 16.7 Regional Footprint and Distribution Strength
- 16.8 Mergers, Acquisitions and Strategic Alliances
- 16.9 New Entrants and Competitive Threats
- 16.10 Porter's Five Forces and Industry Attractiveness
- 16.11 Competitive Outlook, 2025-2035
Chapter 17 Company Profiles
- 17.1 Company Coverage and Selection Criteria
- 17.2 Braintrust
- 17.2.1 Business Description
- 17.2.2 Company Ownership and Geographic Presence
- 17.2.3 Product and Service Portfolio
- 17.2.4 Manufacturing and Operating Footprint
- 17.2.5 Financial Performance and Investment
- 17.2.6 Market Share and Competitive Position
- 17.2.7 Technology and Innovation Capabilities
- 17.2.8 Strategic Alliances or Partnerships
- 17.2.9 Recent Developments
- 17.2.10 Growth Strategy and Outlook
- 17.3 Arize AI
- 17.4 LangChain (LangSmith)
- 17.5 Weights & Biases
- 17.6 Patronus AI
- 17.7 Galileo
- 17.8 Other Relevant Market Participants
Note: Every listed company is profiled on the structure shown under the first company. The company list is preliminary and may change based on research findings, market developments, data availability and client requirements.
Chapter 18 Disclaimer
- 18.1 Research and Forecast Disclaimer
- 18.2 Data Source and Estimation Limitations
Note: The depth of individual sections depends on data availability for this market. Volume, capacity, trade and other unit-based metrics are included where applicable.

