
Brokered GPU capacity has become a low-cost AI compute layer
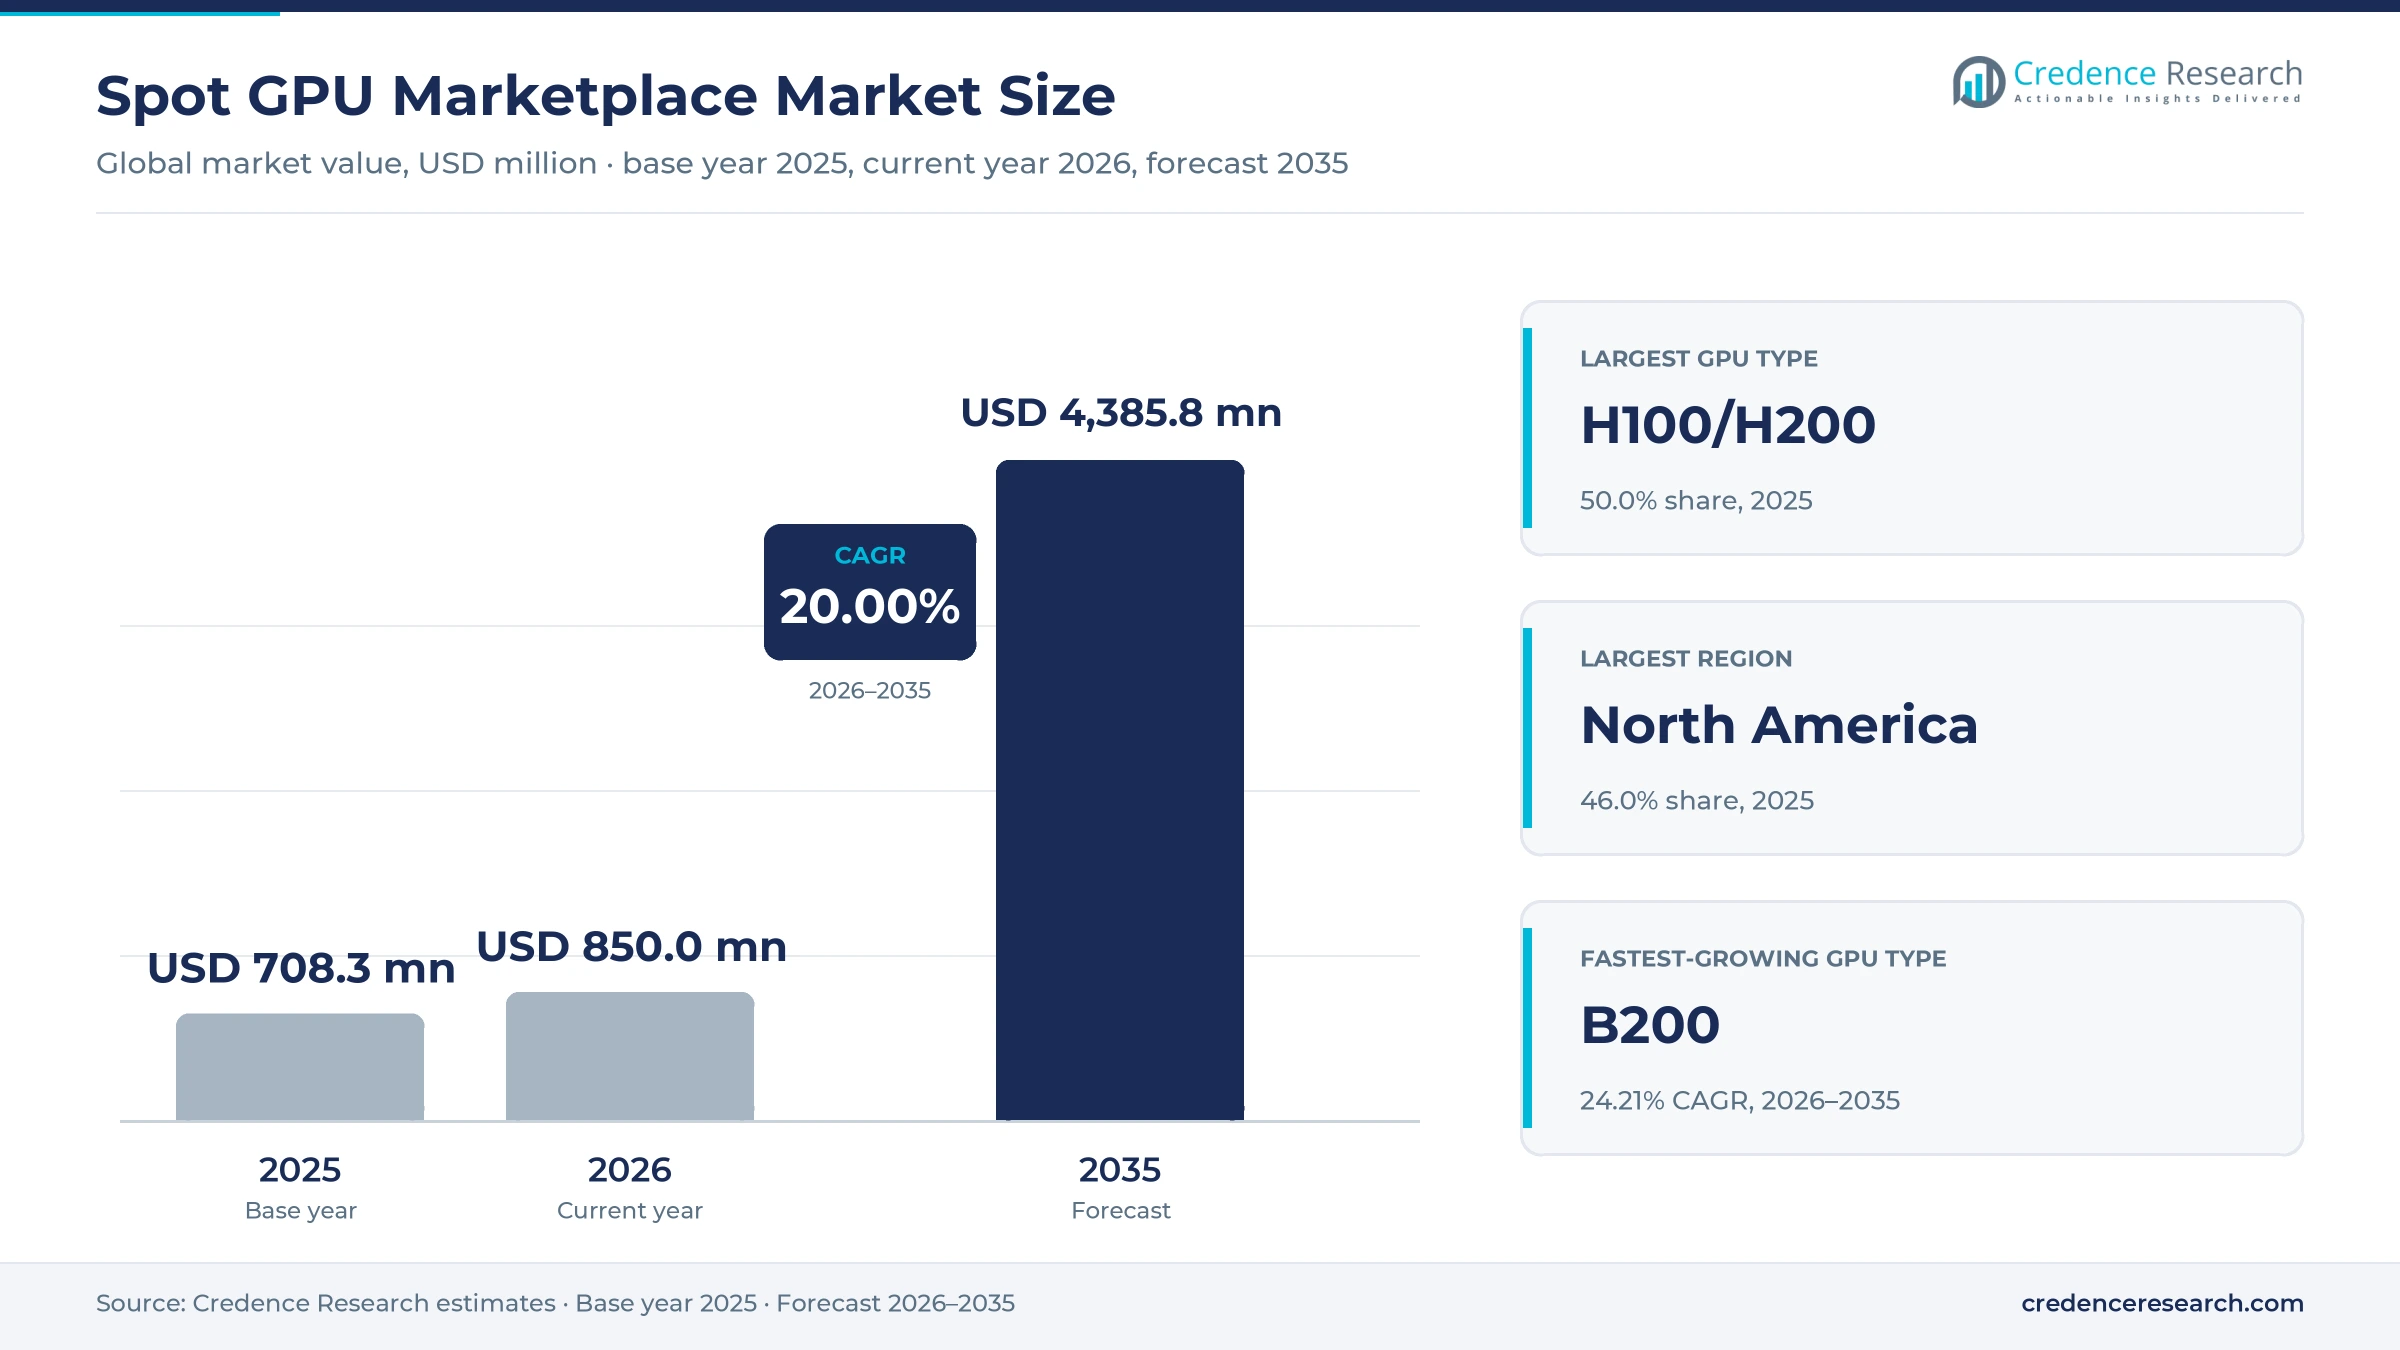
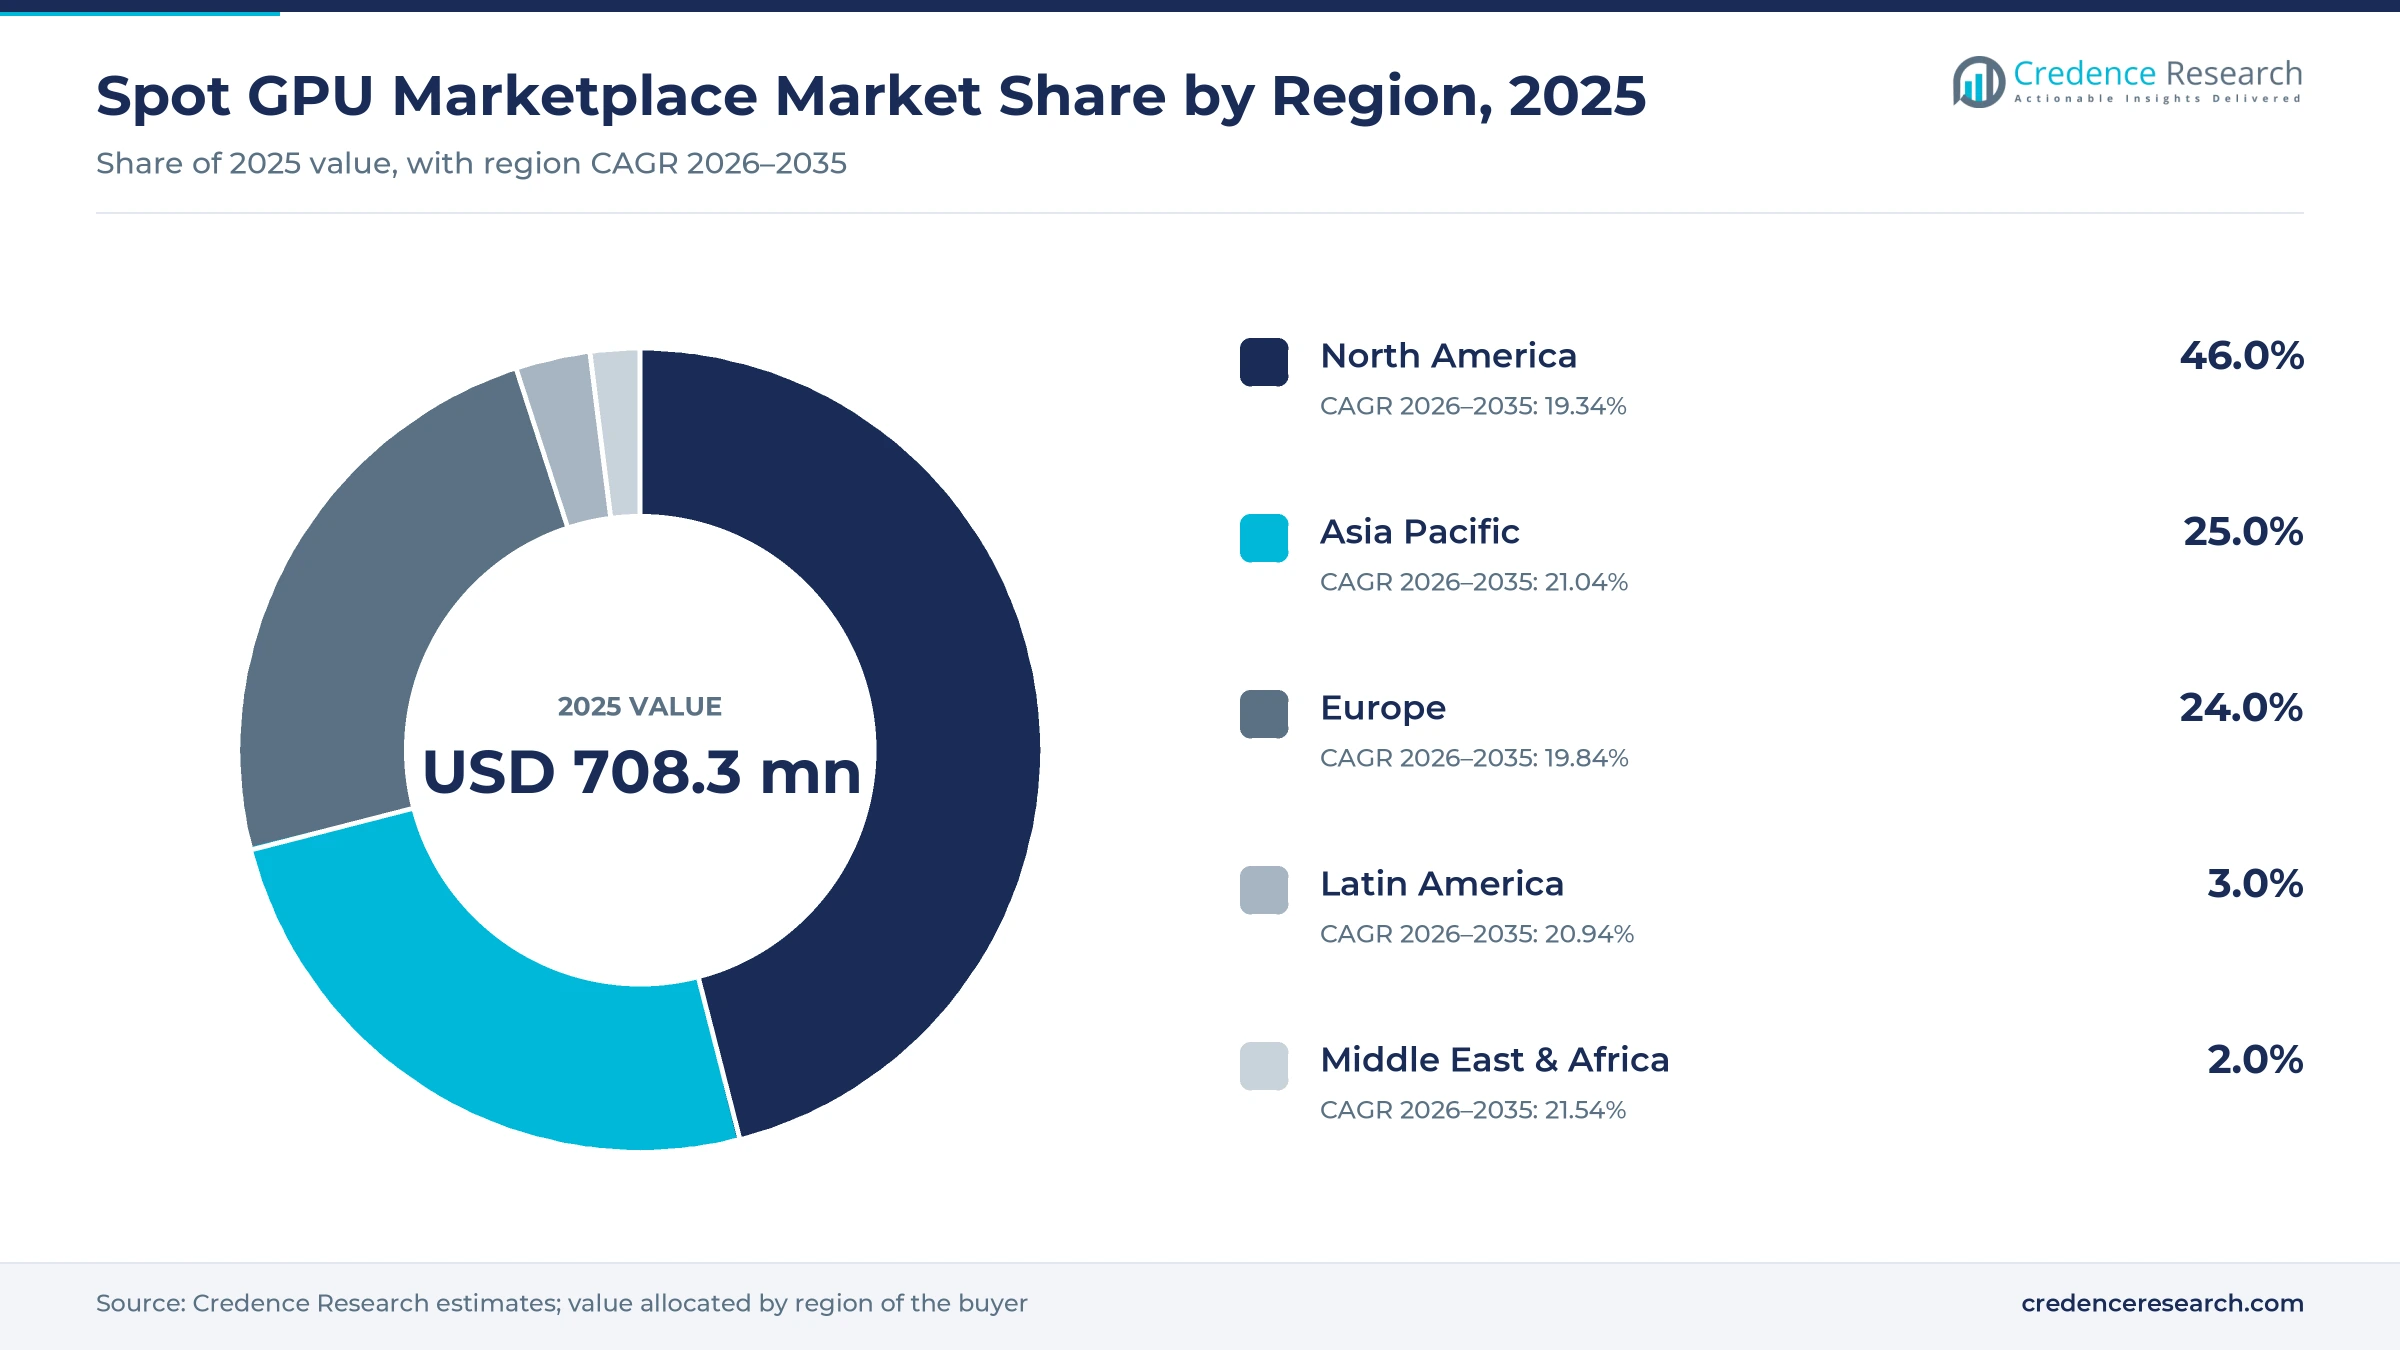
The global spot GPU marketplace market was valued at USD 708.3 million in 2025 and is projected to increase from USD 850.0 million in 2026 to USD 4.39 billion by 2035, registering a CAGR of 20.00% during 2026–2035. Spending comes from AI startups, university labs and independent developers that rent graphics processors by the hour from brokers that pool idle capacity from data centers, cloud resellers and individual owners. North America held the largest regional share, 46.0% in 2025, because most marketplace operators and the startups they serve are based in the United States. Middle East & Africa is the fastest-growing region at 21.54% a year as new national AI data centers in Saudi Arabia and South Africa begin to sell capacity. A key commercial change came in June 2025, when Amazon Web Services cut on-demand H100 instance prices by 44%, which narrowed the price gap that marketplaces had used to win customers. Platforms have responded with serverless inference and the resale of reserved clusters.
Which GPU rentals and platform fees are counted here?
The spot GPU marketplace market covers platform fees and rental payments for accelerator time sold through brokered marketplaces, where third-party hosts list H100, H200, B200 and consumer graphics cards. Buyers rent interruptible spot instances, on-demand instances or short slices of reserved clusters that original contract holders resell. Payment is usually per GPU-hour, billed by the second or minute, with storage and networking charged on top.
The scope excludes capacity sold directly by large cloud providers under their own long-term contracts, hardware sales and colocation leases. Value is counted at the gross rental price paid by the buyer, so the share passed to hosts is included.
Spot GPU Marketplace Market Insights
- The market is valued at USD 708.3 million in 2025 and is projected to reach USD 4.39 billion by 2035, growing at a 20.00% CAGR as AI teams rent idle capacity.
- North America led with 46.0% of 2025 value, while Middle East & Africa grows fastest at 21.54% a year on new national AI data centers.
- H100/H200 capacity held 50.0% of 2025 value, and B200 rentals grow fastest at 24.21% a year through 2035.
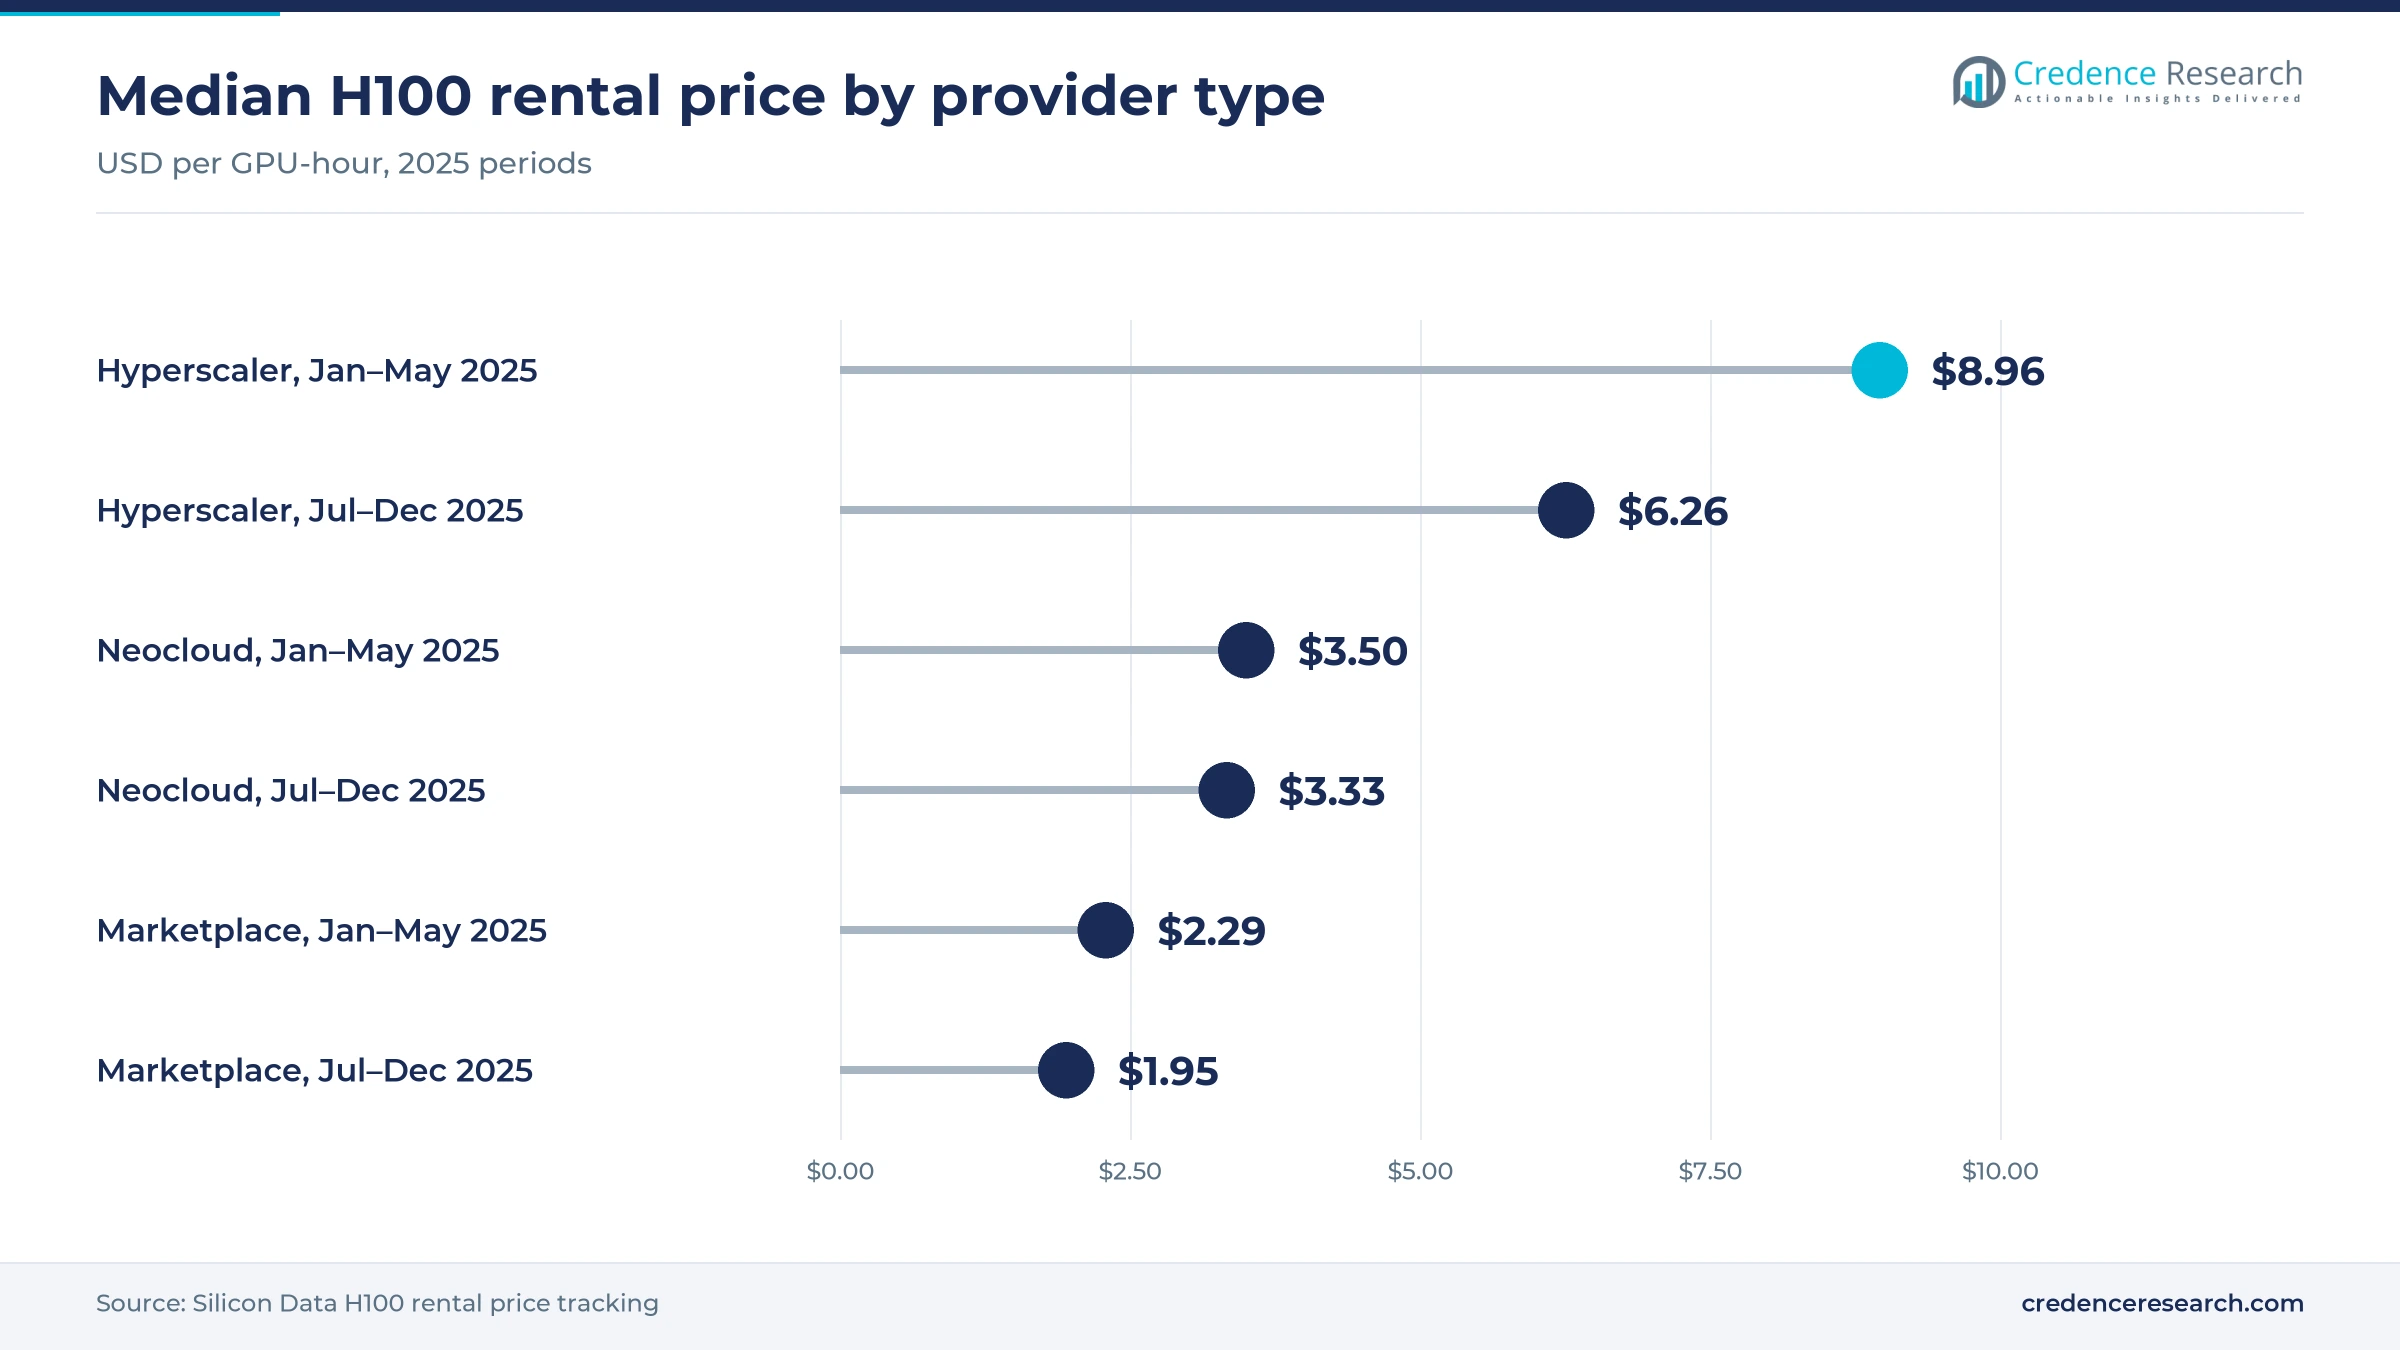
- Silicon Data tracked median marketplace H100 rates at about one third of the hyperscaler median in the second half of 2025.
- SF Compute closed a Series A round in November 2025 to let buyers resell unused reserved capacity through a real-time exchange.
H100 and H200 capacity leads while B200 rentals grow fastest
Why do H100 and H200 rentals hold the largest share?
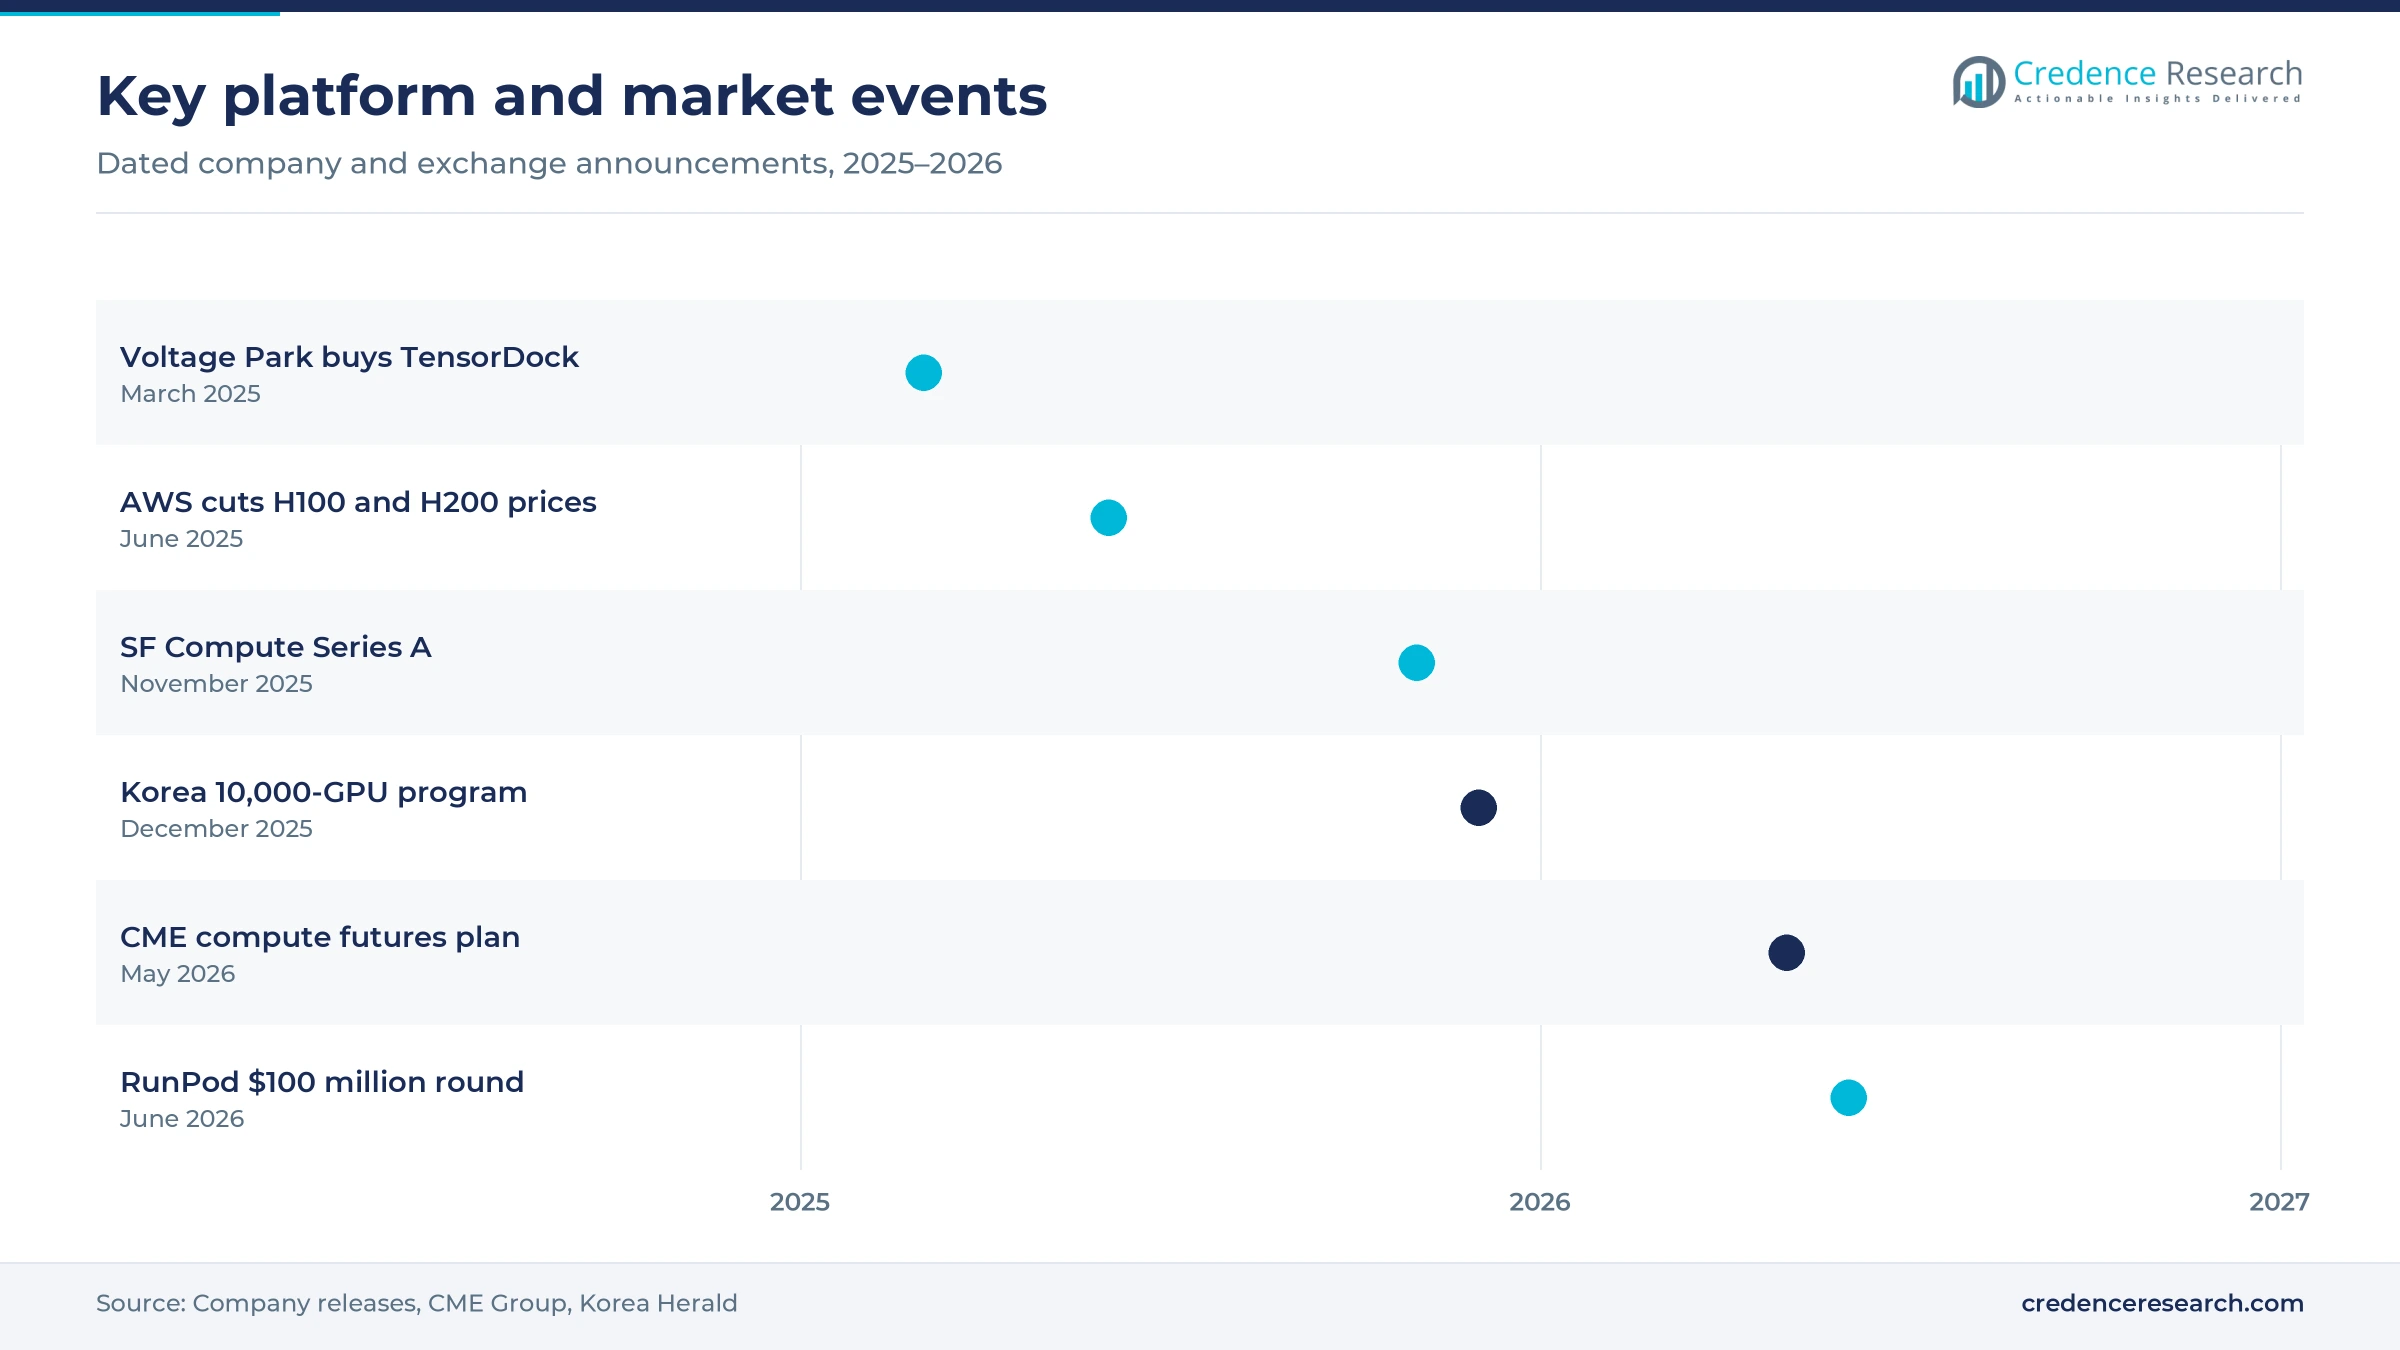
Based on GPU, the market is categorized into H100/H200, B200 and consumer GPUs. H100/H200 led with 50.0% of 2025 value because Hopper cards were the most widely installed data center accelerators when marketplace demand took off. TensorDock, acquired by Voltage Park on March 26, 2025, was among the first platforms to offer on-demand H100s below $3 an hour, according to the deal announcement. B200 rentals grow fastest at 24.21% a year as Blackwell supply reaches hosts. Vast.ai said in its 2025 year in review that it added H200 and B200 listings, while Akash Network made B200 support live for its decentralized market.
Why does spot pricing lead and reserved resale grow fastest?
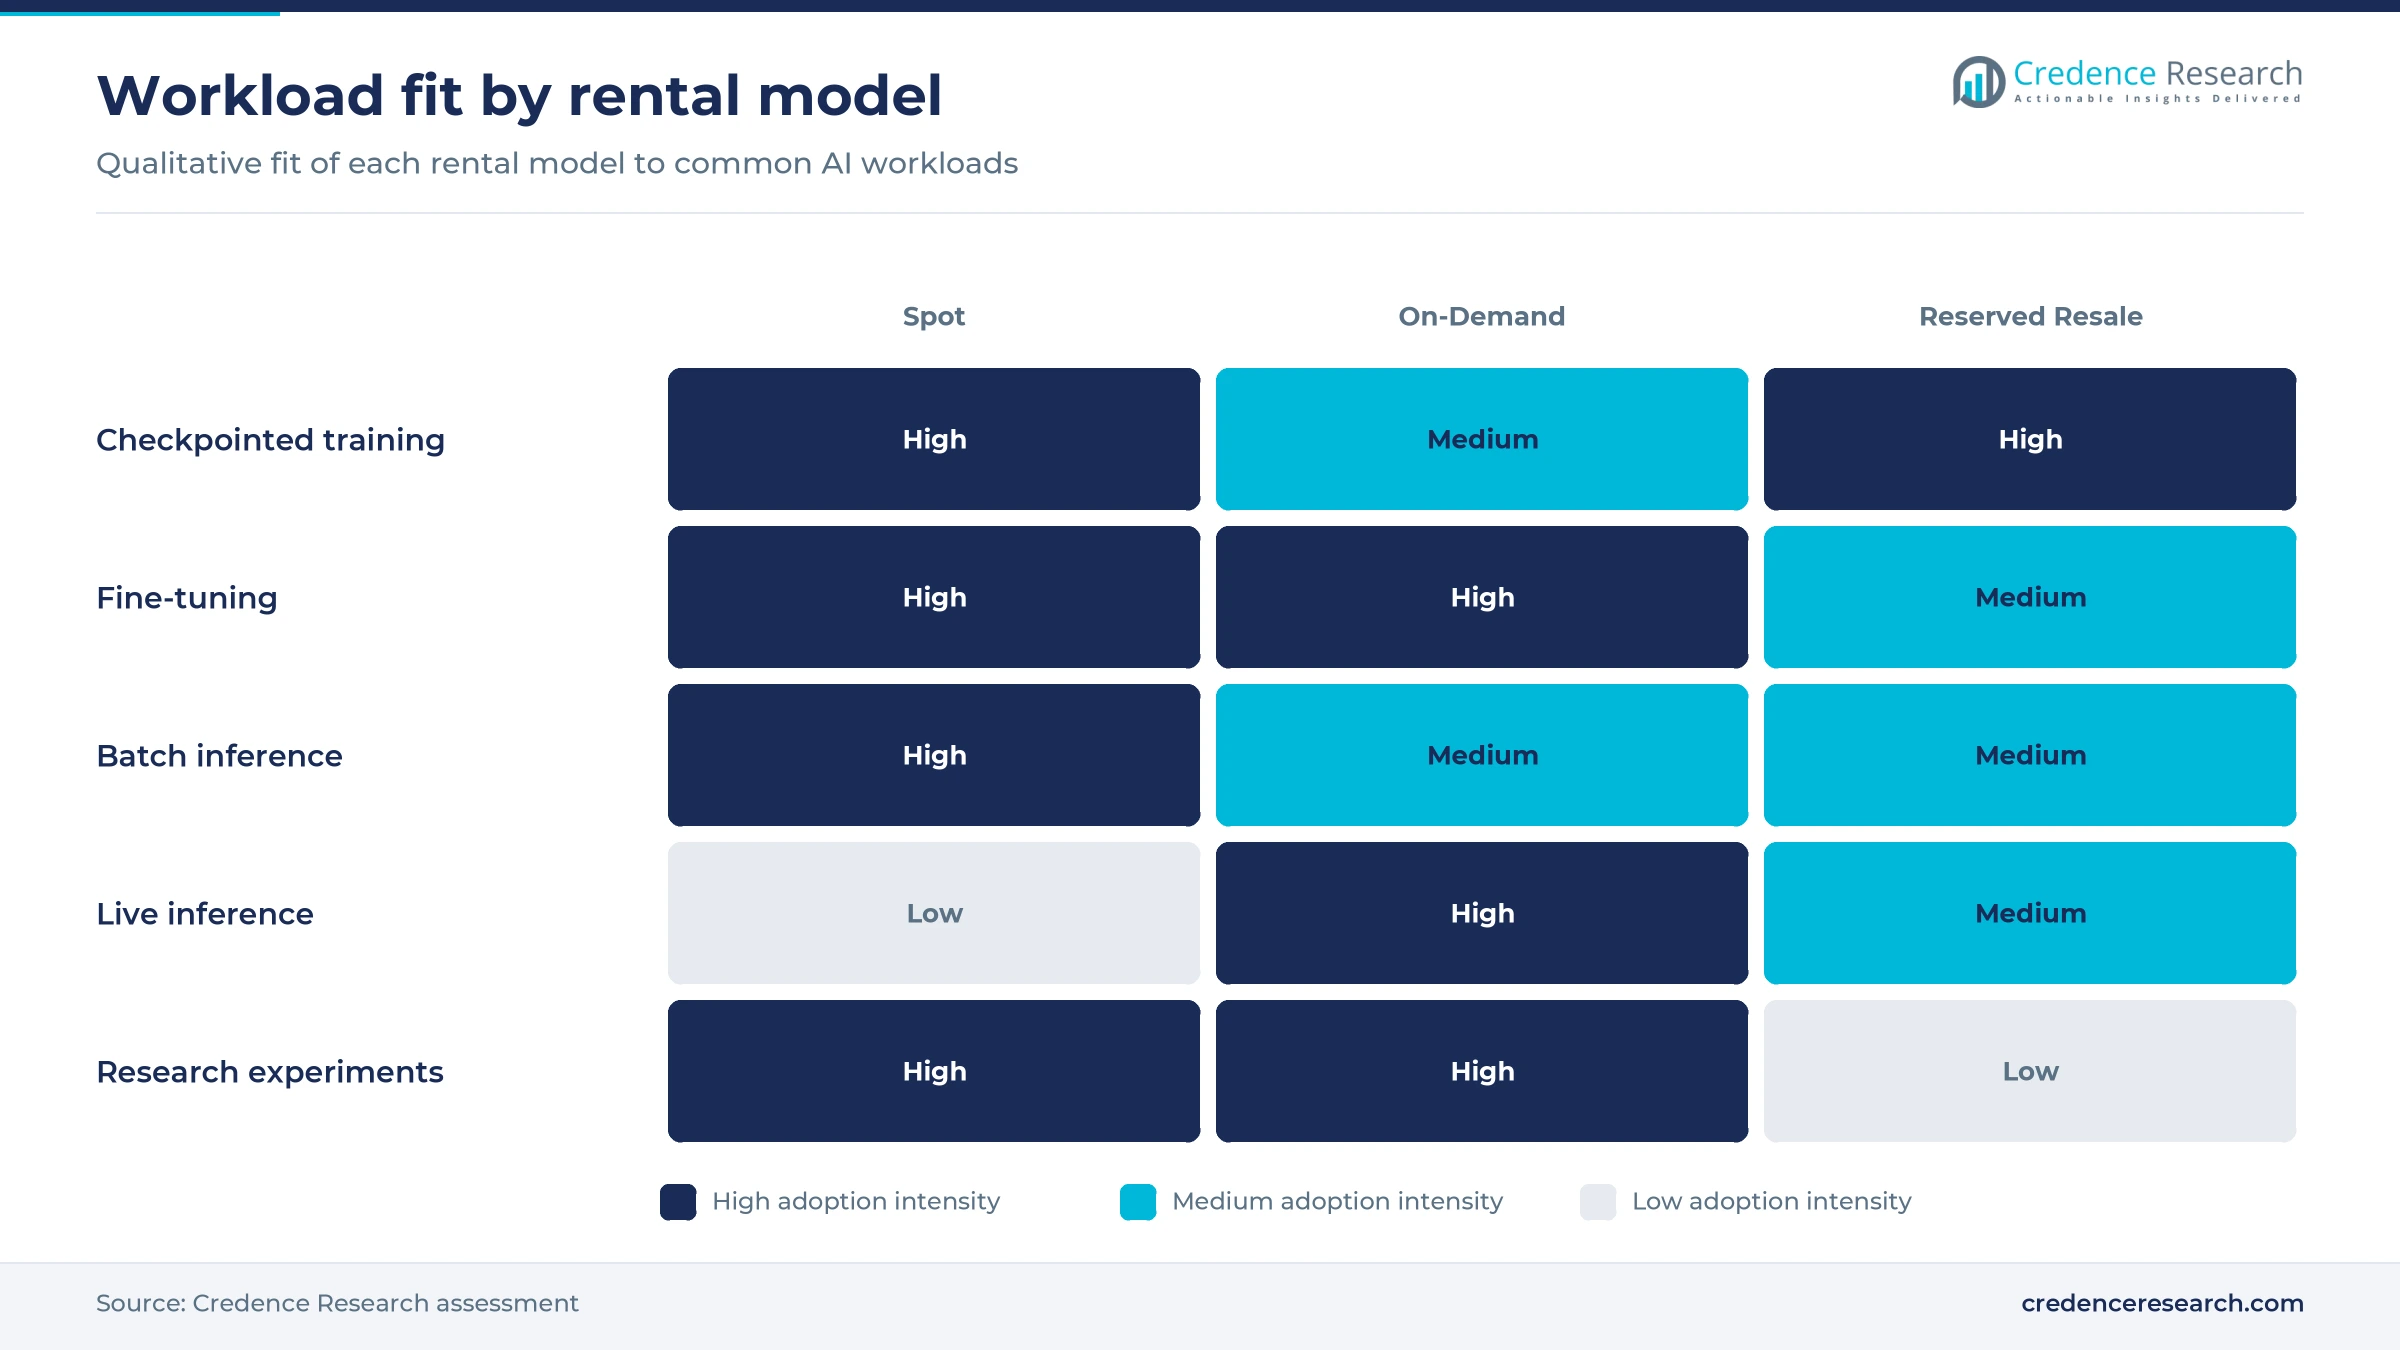
Based on model, the market is categorized into spot, on-demand and reserved resale. Spot led with 44.0% of 2025 value because interruptible capacity carries the deepest discounts for checkpointed training and batch jobs. Hyperbolic noted in March 2025 that spot or interruptible pricing can cut compute costs by up to 50%. Reserved Resale grows fastest at 22.33% a year as holders of long contracts look to recover idle hours. SF Compute, which raised a $40 million Series A in November 2025, lets buyers sublease unused capacity in real time and takes about 10% of each transaction, according to eWEEK.
Why do startups dominate demand from these platforms?
Based on buyer, the market is categorized into startups and researchers. Startups led with 66.0% of 2025 value because young AI companies rent capacity in bursts instead of signing multi-year cloud commitments. Stanford HAI reported that private investment in generative AI reached $33.9 billion in 2024, up 18.7% from 2023, which funds many such teams. Researchers grow fastest at 20.65% a year as university labs look for affordable accelerator hours. The U.S. NAIRR Pilot listed Voltage Park H100 clusters among its new resources in its September 2025 newsletter, linking academic users to commercial capacity.
| Segment Group | Leading Sub-segment | Share, 2025 | Fastest-growing Sub-segment | CAGR, 2026–2035 |
|---|---|---|---|---|
| By GPU | H100/H200 | 50.0% | B200 | 24.21% |
| By Model | Spot | 44.0% | Reserved Resale | 22.33% |
| By Buyer | Startups | 66.0% | Researchers | 20.65% |
Request a Free Sample
Fill in your details and we'll send you a free sample report.
- Sample data tables & charts
- Research methodology
Fragmented supply and price gaps drive brokered rentals
Fragmented GPU capacity creates demand for brokerage
GPU supply is spread across thousands of data centers, resellers and private owners, which creates demand for brokers that can match idle capacity with buyers in minutes. SF Compute does not own GPUs but brokers several thousand of them for other contract holders, according to eWEEK in November 2025. Voltage Park bought the TensorDock marketplace in March 2025, and TensorDock sources capacity from a network of global suppliers. Akash Network recorded 126,025 new leases in 2025 with average GPU utilization of about 60%, according to its 2025 year in review, which shows how much idle supply hosts still hold. In the Credence Research model this driver adds about 8.0 percentage points to annual growth to 2035.
AI teams seek lower-cost compute for burst workloads
AI teams rent capacity on marketplaces because short training runs, fine-tuning jobs and demos rarely justify long contracts with large clouds. Silicon Data price tracking showed a median marketplace H100 rate of $1.95 per GPU-hour from July to December 2025, against $6.26 for hyperscalers and $3.33 for specialist clouds. RunPod reported more than one million developers and a 155% rise in signups in January 2026, according to a RunPod press release. Stanford HAI also found that 78% of organizations used AI in 2024, up from 55% a year earlier, which widens the pool of occasional buyers that need large language models trained or served cheaply. In the Credence Research model this driver adds about 5.6 percentage points to annual growth to 2035.
Real-time pricing and provisioning deepen liquidity
Live price feeds and instant provisioning turn scattered GPUs into a liquid market, because buyers can compare offers and launch jobs without sales calls. CME Group and Silicon Data announced on May 12, 2026 a plan for compute futures based on daily GPU rental benchmarks, pending regulatory review. RunPod said its serverless endpoints scale from zero to thousands of concurrent GPUs with cold starts under 500 milliseconds. Vast.ai launched Vast.ai Serverless in 2025 as an automated layer for inference, according to its December 2025 review. In the Credence Research model this driver adds about 3.6 percentage points to annual growth to 2035, mostly through repeat buyers who now treat rented capacity as routine.
Blackwell rollout pushes Hopper capacity into resale
Each new chip generation pushes older accelerators down the price curve and into brokered resale, which enlarges the supply that marketplaces can list. Lambda agreed in early November 2025 to supply Microsoft with tens of thousands of Nvidia GPUs, including GB300 NVL72 systems, according to AI Business. Amazon Web Services cut on-demand P5 H100 prices by 44% and P5en H200 prices by 25% in a June 5, 2025 announcement, which reset reference rates for Hopper hours. Silicon Data recorded the hyperscaler H100 median falling from $8.96 in January to May 2025 to the second-half level, freeing older fleets for resale. This driver supports H100/H200 capacity, which held 50.0% of 2025 value.
Tradable compute contracts and serverless layers emerge
Shift from hourly rental to tradable compute contracts
GPU time is starting to trade like a commodity, as platforms and exchanges add contracts that let buyers lock in future prices. CME Group said in May 2026 that it would base its planned futures on Silicon Data indices, described as the first daily GPU benchmarks for on-demand rental rates. SF Compute signs long-term compute contracts funded by outside investors and then sells unused slices through a real-time market, according to eWEEK. Its Series A in November 2025 valued the company at $300 million, and it manages more than $100 million in hardware without owning it, which signals investor appetite for this model. The trend supports Reserved Resale, the fastest-growing model at 22.33% a year.
Rise of serverless inference on shared capacity
Marketplaces are moving from raw virtual machines toward serverless inference, which lets developers pay only for requests served on pooled hardware. Akash Network launched AkashML in November 2025 and counted 3,135,110 deployments created during 2025, up 466% from the year before. Vast.ai called its serverless launch the headline story of 2025, while RunPod made batch inference generally available on its serverless product. Stanford HAI found that the cost of running a GPT-3.5-level system fell more than 280-fold between November 2022 and October 2024, which makes inference on cheaper consumer cards practical. This shift lifts demand for short, frequent rentals across all three rental models.
Opportunity in public compute programs that rent capacity
Government compute programs create an opening for platforms that can aggregate and resell subsidized capacity to startups and labs. South Korea's 10,000-GPU program, announced Dec. 18, 2025 with 1.46 trillion won in funding, charges startups and SMEs about 5% to 10% of the market price. The IndiaAI Mission has onboarded more than 38,000 GPUs on its AI compute portal under a Rs 10,372 crore outlay, according to Digital India. In Europe, AI-optimized supercomputers in the EU AI Factories network prioritize access for AI startups and SMEs. Brokers that plug into these schemes can widen their supply base.
Opportunity in certified tiers for enterprise buyers
Enterprise buyers want the low prices of marketplaces but need security assurances, which opens room for certified premium tiers. Vast.ai achieved SOC 2 Type I and Type II certification in 2025, according to its year in review, and its RTX 5090 inventory passed 1,000 machines in the same year. RunPod expanded its enterprise platform with governance controls and ISO 27001 certification on Sept. 24, 2026. Investors are backing this move, as RunPod raised $100 million at a $1 billion valuation in June 2026, led by Summit Partners, according to The Next Web. Certified pools can serve regulated teams in finance and health.
Failures, falling rates and power limits weigh on hosts
Hardware failures interrupt long training jobs
Hardware faults remain a serious risk for buyers who run long jobs on rented accelerators of uneven quality. Meta reported 419 unexpected interruptions during a 54-day Llama 3 pre-training run on 16,384 H100 GPUs, as Tom's Hardware reported in July 2024. GPU faults caused 30.1% of those stops and HBM3 memory 17.2%. On community hosts with less monitoring, such failures cost buyers time and money. Platforms answer with automatic checkpointing, host scoring and refunds for failed sessions.
Falling rental rates squeeze host returns
Rental prices have fallen fast, which squeezes the returns that hosts earn and can push smaller suppliers to leave marketplaces. Silicon Data recorded a marketplace H100 median of $2.58 per GPU-hour for June to December 2024 and about $2.29 in the first five months of 2025. Larger price cuts by major clouds in mid-2025 pushed rates lower again. Hosts with older cards face payback periods that stretch beyond useful life, so platforms add longer commitments and minimum price floors.
Power limits slow new data center capacity
Electricity limits are slowing the growth of new GPU capacity, which in turn caps the supply that marketplaces can list in busy hubs. The International Energy Agency estimated that data centers used about 415 TWh in 2024 and could reach about 945 TWh by 2030, as Down To Earth reported on April 10, 2025. Grid connection queues in major U.S. and European hubs delay new halls. Brokers respond by adding hosts in regions with spare power and lower energy prices.
Export rules shape where advanced GPUs can be hosted
Export rules decide where advanced accelerators can be installed, which limits supply growth in some regions and adds compliance work for global platforms. Tom's Hardware reported on May 13, 2025 that the United States had rescinded the pending AI Diffusion export rule in the same week that Nvidia announced 18,000 GPUs for Saudi Arabia's HUMAIN. Rules can still change quickly, so platforms must screen hosts and buyers by country. This raises costs for smaller marketplaces that lack dedicated compliance teams.
North America leads as Middle East & Africa grows fastest
| Region | Value, 2025 (USD million) | Share, 2025 | CAGR, 2026–2035 |
|---|---|---|---|
| North America | 325.8 | 46.0% | 19.34% |
| Asia Pacific | 177.1 | 25.0% | 21.04% |
| Europe | 170.0 | 24.0% | 19.84% |
| Latin America | 21.2 | 3.0% | 20.94% |
| Middle East & Africa | 14.2 | 2.0% | 21.54% |
North America leads on startups and platform operators
North America held 46.0% of 2025 value and grows at 19.34% a year because most marketplace operators, including Vast.ai, RunPod and SF Compute, are based in the United States. Stanford HAI reported U.S. private AI investment of $109.1 billion in 2024, about 12 times China's $9.3 billion, which keeps startup demand high. Lambda operates data centers in 14 locations across North America and raised more than $1.5 billion in a Series E round on Nov. 20, 2025. Dense supply of hyperscale data centers also feeds resale capacity.
Asia Pacific grows on national compute programs
Asia Pacific held 25.0% of 2025 value and grows at 21.04% a year as governments fund shared compute for startups. South Korea will offer applicants up to 256 Nvidia H200 or 128 B200 GPUs for one year, with free access for universities, under its program announced in December 2025. India has made more than 38,000 GPUs available through the IndiaAI compute portal at affordable rates for startups and academia. These programs set public reference prices that private brokers must match or undercut across the region.
Europe builds shared capacity through AI Factories
Europe held 24.0% of 2025 value and grows at 19.84% a year as public and private capacity expands. The EU is setting up 19 AI Factories and 13 Antennas, and the Commission, Member States and Associated Countries expect to invest EUR 10 billion in supercomputing and AI Factories between 2021 and 2027. A separate call for up to seven AI Gigafactories targets sites with more than 100,000 advanced AI processors each. Marketplace demand in Europe also reflects data residency needs, which favor hosts located inside the bloc.
Latin America starts from a small base with Brazil
Latin America held 3.0% of 2025 value and grows at 20.94% a year from a small base led by Brazil. The Brazilian government presented an AI plan in July 2024 with investments of R$23 billion through 2028, aiming to place Brazil among the five countries with the largest computing capacity, as Estadão reported. AWS also cut P5 H100 prices in its São Paulo region in June 2025, which made local Hopper capacity cheaper. Startups in Brazil and Mexico still rent much of their capacity from U.S.-based platforms.
Middle East & Africa grows fastest on new AI data centers
Middle East & Africa held 2.0% of 2025 value and grows fastest at 21.54% a year as new AI data centers open. Nvidia announced 18,000 GPUs for Saudi Arabia's HUMAIN in May 2025 for a 500-megawatt data center, according to Tom's Hardware. Cassava Technologies said on March 24, 2025 that it would deploy Nvidia computing at its South African data centers by June 2025, then expand to Egypt, Kenya, Morocco and Nigeria, as Nairametrics reported. Local startups gain nearer capacity as these sites come online.
Funding rounds and a compute futures plan marked 2025-2026
| Development | Status and market relevance |
|---|---|
| In March 2025, Voltage Park acquired the TensorDock GPU cloud marketplace and said the marketplace would keep operating as usual. | Completed; combines owned H100 fleets with third-party host supply |
| In November 2025, Lambda raised more than $1.5 billion in a Series E round led by TWG Global to expand its AI factories. | Completed; adds capacity that feeds on-demand rentals |
| In November 2025, SF Compute raised a $40 million Series A led by DCVC and Wing Venture Capital at a $300 million valuation. | Completed; funds real-time resale of reserved clusters |
| In May 2026, CME Group and Silicon Data announced plans for compute futures based on daily GPU rental benchmarks. | Pending regulatory review; adds price hedging for rented capacity |
| In June 2026, RunPod raised $100 million at a $1 billion valuation in a round led by Summit Partners. | Completed; supports enterprise features and global expansion |
Schedulers, price feeds and containers run the platforms
- Container scheduling lets buyers launch prebuilt images for training or inference on any listed host within minutes.
- Live price feeds show bids and asks per GPU-hour, so buyers can compare spot, on-demand and resale offers in one view.
- Host verification runs benchmark and reliability checks on each machine before listing, which lowers the risk of failed jobs.
- Serverless runtimes scale inference endpoints from zero to many GPUs and bill only for the requests that are served.
Need a Custom Version of This Report?
Tailor the scope, geography, or segments to your exact requirements.
- Custom geography or segment scope
- Direct access to our analyst team
Platforms compete on price, supply depth and reliability
Competition centers on price, depth of supply and the reliability of rented machines. Vast.ai runs an open market where hosts set prices for cards ranging from consumer RTX models to B200 systems, while RunPod pairs community capacity with secure data center pods and a serverless layer. SF Compute focuses on reselling reserved clusters through a real-time exchange, and TensorDock now operates inside Voltage Park, which adds owned H100 fleets to third-party supply. Lambda competes from the on-demand side with its own data centers and large contracts. Akash Network offers a decentralized alternative that settles leases between providers and tenants on chain. Buyers switch easily between platforms, so operators invest in certifications, faster provisioning and host scoring to keep repeat customers. Partnerships with sovereign programs and with high-performance computing centers are becoming a further source of supply.
Companies profiled and their roles in this market
| Company | Type | Role in the market |
|---|---|---|
| Vast.ai | Open marketplace | Lists third-party hosts from consumer cards to H200 and B200 systems with serverless inference |
| RunPod | GPU cloud and marketplace | Serves more than one million developers across 31 regions with pods and serverless endpoints |
| SF Compute | Compute exchange | Resells unused capacity from long-term contracts through a real-time market |
| Lambda | On-demand GPU cloud | Rents capacity from 14 North American locations and supplies large enterprise buyers |
| Voltage Park | GPU cloud provider | Rents owned H100 clusters on demand and acquired the TensorDock marketplace in March 2025 |
| TensorDock | GPU marketplace | Lists RTX and H100 capacity from global suppliers as part of Voltage Park |
| Akash Network | Decentralized marketplace | Matches GPU providers and tenants through on-chain leases with B200 support |
Liquidity and trust will decide platform share to 2035
Credence Research's view is that liquidity and trust, more than raw price, will decide which platforms gain share to 2035. The price gap with large clouds narrowed in 2025, so marketplaces can no longer win on discounts alone. Platforms that offer verified hosts, quick refunds and serverless tools will keep startups as they grow into larger buyers. Resale of reserved clusters and futures-linked pricing should give hosts steadier income and buyers more predictable budgets. The main risk is a sharp fall in rental rates if new Blackwell capacity outruns demand, which would push weaker hosts out.
Model-based sizing checked against public platform data
The report uses 2025 as the base year and forecasts to 2035. Market values come from the Credence Research model, which combines estimates of listed GPU capacity, utilization and paid rates per GPU-hour by GPU type. Segment and regional splits are Credence Research estimates based on public company announcements, platform documentation, price trackers and government program releases. Sources include company press releases, the European Commission, Stanford HAI, trade press and published price indices. No interviews or surveys were used to prepare this edition of the report.
Inference and resale contracts extend growth to 2035
The market is expected to grow from USD 850.0 million in 2026 to USD 4.39 billion by 2035 as rented capacity becomes a routine part of AI work. Inference will take a growing share of demand as serverless tools spread and as cheaper cards handle smaller models. Reserved resale and futures-linked contracts should mature into a standard way for contract holders to recover idle hours. Public programs in Asia and Europe will add capacity that brokers can route to startups. Platforms that keep host quality high and settle disputes fast are best placed to win share through 2035.
Frequently Asked Questions
How big is the spot GPU marketplace market?
Which region leads the spot GPU marketplace market?
Which region grows fastest?
Which GPU type leads rentals on these platforms?
How much cheaper are marketplace rentals than large clouds?
What is reserved resale in this market?
What are the main challenges for the market?
Who are the key companies in the market?
Table of Content
Chapter 1 Market Segmentation
- 1.1 Segmentation Framework
- 1.1.1 Product and Service Classification
- 1.1.2 Application and End-Use Classification
- 1.1.3 Technology and Solution Classification
- 1.1.4 Customer and Distribution Channel Classification
- 1.1.5 Geographic Segmentation
- 1.1.6 Market Segment Definitions and Boundaries
- 1.2 By GPU
- 1.2.1 H100/H200
- 1.2.2 Consumer GPUs
- 1.2.3 B200
- 1.3 By Model
- 1.3.1 Spot
- 1.3.2 On-Demand
- 1.3.3 Reserved Resale
- 1.4 By Buyer
- 1.4.1 Startups
- 1.4.2 Researchers
Chapter 2 Introduction
- 2.1 Report Objectives and Scope
- 2.2 Product Definition and Industry Terminology
- 2.3 Market Inclusions and Exclusions
- 2.4 Research Process
- 2.4.1 Primary Research and Expert Interviews
- 2.4.2 Secondary Research and Source Review
- 2.4.3 Top-Down and Bottom-Up Estimation
- 2.4.4 Data Triangulation and Verification
- 2.5 Market Size Measurement Basis
- 2.5.1 2025: USD 708.3 million → 2035: USD 4.39 billion
- 2.6 Historical and Forecast Reference Periods
- 2.6.1 Historical Period: 2018-2025
- 2.6.2 Base Year: 2025
- 2.6.3 Forecast Period: 2025-2035
- 2.7 Research Assumptions and Limitations
Chapter 3 Executive Summary
- 3.1 Market Snapshot and Key Findings
- 3.2 Base-Year Market Size, 2025
- 3.3 Forecast Market Size, 2035
- 3.4 Revenue and Volume Growth Outlook
- 3.5 Key Demand and Supply Indicators
- 3.6 Leading Market Segments
- 3.7 Fastest-Growing Market Opportunities
- 3.8 Regional Performance Highlights
- 3.9 Technology and Industry Transformation
- 3.10 Competitive Landscape Summary
- 3.11 Analyst View and Strategic Implications
Chapter 4 Global Spot GPU Marketplace Market Trends and Developments
- 4.1 Historical Industry Development, 2018-2025
- 4.2 Recent Market Trends and Developments
- 4.3 Demand and Customer Behavior Trends
- 4.4 Technology and Product Innovation
- 4.5 Artificial Intelligence, Automation and Digitalization
- 4.6 Local Manufacturing and Supply Chain Realignment
- 4.7 Industry Partnerships, Mergers and Acquisitions
- 4.8 Sustainability and Circular Economy Developments
- 4.9 Government and Private Sector Investment Trends
- 4.10 Emerging Business Models and Commercialization
- 4.11 Industry Developments and Announcements
Chapter 5 Global Spot GPU Marketplace Market Supply and Demand Analysis
- 5.1 Demand Trend and Consumption Analysis, 2018-2025
- 5.2 Demand Forecast, 2025-2035
- 5.3 Supply Chain Structure and Procurement Trends
- 5.4 Supply-Demand Gap and Bottlenecks
- 5.5 Import Dependence and Sourcing Structure
- 5.6 Regional Supply and Demand Concentration
Chapter 6 Global Spot GPU Marketplace Market Pricing Analysis
- 6.1 Pricing Structure and Measurement
- 6.2 Historical Pricing Trends, 2018-2025
- 6.3 Pricing Outlook, 2025-2035
- 6.4 Pricing by Product and Market Segment
- 6.5 Geographic Pricing Differences
- 6.6 Key Input, Energy, Labor and Logistics Costs
- 6.7 Contract Pricing and Purchasing Models
- 6.8 Pricing Sensitivity and Competitive Positioning
- 6.9 Price, Margin and Profitability Implications
Chapter 7 Global Spot GPU Marketplace Market Dynamics
- 7.1 Market Growth Drivers
- 7.1.1 Demand-Side Drivers
- 7.1.2 Technology and Innovation Drivers
- 7.1.3 Infrastructure and Investment Drivers
- 7.1.4 Regulatory and Policy Drivers
- 7.2 Market Restraints
- 7.2.1 Cost and Affordability Constraints
- 7.2.2 Technology and Adoption Barriers
- 7.2.3 Supply Chain and Operational Constraints
- 7.3 Market Challenges
- 7.3.1 Competitive Pressure and Margin Erosion
- 7.3.2 Skills, Infrastructure and Implementation Gaps
- 7.4 Emerging Market Opportunities
- 7.5 Market Dynamics Impact and Time-Horizon Assessment
Chapter 8 Global Spot GPU Marketplace Value Chain Analysis
- 8.1 Industry Value Chain Overview
- 8.2 Upstream Suppliers and Critical Inputs
- 8.3 Technology and Component Providers
- 8.4 Manufacturing or Service Delivery
- 8.5 Distribution, Channel Partners and Integrators
- 8.6 Downstream Applications and End Users
- 8.7 Value Addition and Profit Pools
- 8.8 Vertical Integration and Outsourcing
- 8.9 Supplier Concentration and Risk
- 8.10 Supply Chain Localization and Resilience
Chapter 9 Global Spot GPU Marketplace Market Regulations and Policies
- 9.1 Relevant Laws, Standards and Compliance Frameworks
- 9.2 Product, Service, Safety and Quality Requirements
- 9.3 Government Policies, Incentives and Subsidies
- 9.4 Imports, Exports and Trade Barriers
- 9.5 Public Procurement and Local Content Requirements
- 9.6 Data Protection, AI and Cybersecurity Compliance
- 9.7 Upcoming Policy Changes and Market Implications
Chapter 10 Global Spot GPU Marketplace Market Hotspots and Opportunities
- 10.1 Market Opportunity Mapping and Growth Hotspots
- 10.2 High-Growth Applications and Customer Groups
- 10.3 Underserved Markets and White-Space Opportunities
- 10.4 Emerging Technology and Product Opportunities
- 10.5 New Capacity and Investment Hotspots
- 10.6 Market Entry and Expansion Opportunities
- 10.7 Distribution and Partnership Opportunities
- 10.8 Near-Term and Long-Term Commercial Potential
- 10.9 Opportunity Attractiveness and Execution Risks
Chapter 11 Global Spot GPU Marketplace Market Outlook, 2025-2035
- 11.1 Market Size and Analysis
- 11.1.1 Revenue (Market Measurement: 2025: USD 708.3 million → 2035: USD 4.39 billion)
- 11.1.2 Historical Market Size, 2018-2025
- 11.1.3 Base-Year Market Size, 2025
- 11.2 Market Forecast, 2025-2035
- 11.2.1 Revenue Forecast to 2035
- 11.2.2 CAGR and Year-on-Year Growth
- 11.2.3 Incremental Revenue Opportunity
- 11.3 Forecast Assumptions and Scenario Analysis
- 11.3.1 Base-Case Forecast
- 11.3.2 Optimistic and Conservative Scenarios
- 11.3.3 Technology, Pricing and Policy Sensitivities
- 11.4 Market Attractiveness and Growth Outlook
Chapter 12 Global Spot GPU Marketplace Market Segmentation and Outlook
- 12.1 Segmentation Summary and Market Shares, 2025
- 12.2 Largest and Fastest-Growing Segments
- 12.3 By GPU - Market Size and Forecast, 2025-2035
- 12.3.1 Segment Definition and Scope
- 12.3.2 Historical Market Size, 2018-2025
- 12.3.3 Revenue Forecast, 2025-2035
- 12.3.4 Base-Year Market Share, 2025
- 12.3.5 Segment CAGR and Growth Drivers
- 12.3.6 Subsegment Market Size and Forecast
- 12.3.6.1 H100/H200
- 12.3.6.2 Consumer GPUs
- 12.3.6.3 B200
- 12.3.7 Subsegment Pricing and Adoption Trends
- 12.3.8 Leading Suppliers and Competition
- 12.3.9 Regional Demand and Opportunities
- 12.4 By Model - Market Size and Forecast, 2025-2035
- 12.4.1 Segment Definition and Scope
- 12.4.2 Historical Market Size, 2018-2025
- 12.4.3 Revenue Forecast, 2025-2035
- 12.4.4 Base-Year Market Share, 2025
- 12.4.5 Segment CAGR and Growth Drivers
- 12.4.6 Subsegment Market Size and Forecast
- 12.4.6.1 Spot
- 12.4.6.2 On-Demand
- 12.4.6.3 Reserved Resale
- 12.4.7 Subsegment Pricing and Adoption Trends
- 12.4.8 Leading Suppliers and Competition
- 12.4.9 Regional Demand and Opportunities
- 12.5 By Buyer - Market Size and Forecast, 2025-2035
- 12.5.1 Segment Definition and Scope
- 12.5.2 Historical Market Size, 2018-2025
- 12.5.3 Revenue Forecast, 2025-2035
- 12.5.4 Base-Year Market Share, 2025
- 12.5.5 Segment CAGR and Growth Drivers
- 12.5.6 Subsegment Market Size and Forecast
- 12.5.6.1 Startups
- 12.5.6.2 Researchers
- 12.5.7 Subsegment Pricing and Adoption Trends
- 12.5.8 Leading Suppliers and Competition
- 12.5.9 Regional Demand and Opportunities
- 12.6 Segment Growth Comparison
- 12.7 Segment Attractiveness and Priority Matrix
Chapter 13 Global Spot GPU Marketplace Geographic Market Outlook, 2025-2035
- 13.1 Regional Market Size and Share, 2025
- 13.2 Regional Market Forecast, 2025-2035
- 13.3 Regional Pricing, Production and Demand Differences
- 13.4 North America
- 13.4.1 United States
- 13.4.2 Canada
- 13.4.3 Mexico
- 13.5 Europe
- 13.5.1 Germany
- 13.5.2 France
- 13.5.3 Italy
- 13.5.4 United Kingdom
- 13.5.5 Spain
- 13.5.6 Poland
- 13.5.7 Russia
- 13.5.8 Netherlands
- 13.5.9 Belgium
- 13.5.10 Sweden
- 13.5.11 Denmark
- 13.5.12 Norway
- 13.5.13 Rest of Europe
- 13.6 Asia Pacific
- 13.6.1 China
- 13.6.2 India
- 13.6.3 Japan
- 13.6.4 South Korea
- 13.6.5 Thailand
- 13.6.6 Indonesia
- 13.6.7 Vietnam
- 13.6.8 Malaysia
- 13.6.9 Australia
- 13.6.10 Rest of Asia Pacific
- 13.7 Latin America
- 13.7.1 Brazil
- 13.7.2 Argentina
- 13.7.3 Colombia
- 13.7.4 Chile
- 13.7.5 Rest of Latin America
- 13.8 Middle East
- 13.8.1 Saudi Arabia
- 13.8.2 United Arab Emirates
- 13.8.3 Turkey
- 13.8.4 Israel
- 13.8.5 Iran
- 13.8.6 Rest of the Middle East
- 13.9 Africa
- 13.9.1 South Africa
- 13.9.2 Egypt
- 13.9.3 Nigeria
- 13.9.4 Morocco
- 13.9.5 Rest of Africa
- 13.10 Regional Investment, Policy and Supply Chain Differences
- 13.11 Regional Competitive Landscape
- 13.12 Geographic Growth Hotspots
Chapter 14 Global Spot GPU Marketplace Technology, Innovation and Sustainability Outlook
- 14.1 Technology Landscape and Maturity
- 14.2 Product, Process and Service Innovation
- 14.3 AI, Automation and Digital Tools in the Industry
- 14.4 Technology Adoption and Performance Benchmarking
- 14.5 Innovation Pipeline and R&D Investment
- 14.6 Patent and Intellectual Property Trends
- 14.7 Energy Efficiency and Resource Management
- 14.8 Sustainability, Recycling and Circularity
- 14.9 Technology Roadmap, 2025-2035
- 14.10 Risks of Obsolescence and Technology Substitution
Chapter 15 Global Spot GPU Marketplace Market Key Strategic Imperatives
- 15.1 Growth and Market Entry Priorities
- 15.2 High-Return Products and Segments
- 15.3 Pricing, Profitability and Cost Optimization
- 15.4 Technology Investment and Product Differentiation
- 15.5 Supply Chain Localization and Resilience
- 15.6 Distribution and Customer Acquisition
- 15.7 Partnership, Acquisition and Capacity Strategy
- 15.8 Regional Expansion Priorities
- 15.9 Short-, Medium- and Long-Term Actions
Chapter 16 Competition Outlook
- 16.1 Industry Competition Characteristics
- 16.2 Market Structure and Concentration
- 16.3 Market Share and Competitive Positioning, 2025
- 16.4 Company-Wise Revenue and Product Benchmarking
- 16.5 Production and Service Capacity Benchmarking
- 16.6 Technology, Pricing and Differentiation
- 16.7 Regional Footprint and Distribution Strength
- 16.8 Mergers, Acquisitions and Strategic Alliances
- 16.9 New Entrants and Competitive Threats
- 16.10 Porter's Five Forces and Industry Attractiveness
- 16.11 Competitive Outlook, 2025-2035
Chapter 17 Company Profiles
- 17.1 Company Coverage and Selection Criteria
- 17.2 Vast.ai
- 17.2.1 Business Description
- 17.2.2 Company Ownership and Geographic Presence
- 17.2.3 Product and Service Portfolio
- 17.2.4 Manufacturing and Operating Footprint
- 17.2.5 Financial Performance and Investment
- 17.2.6 Market Share and Competitive Position
- 17.2.7 Technology and Innovation Capabilities
- 17.2.8 Strategic Alliances or Partnerships
- 17.2.9 Recent Developments
- 17.2.10 Growth Strategy and Outlook
- 17.3 RunPod
- 17.4 SF Compute
- 17.5 Lambda
- 17.6 TensorDock
- 17.7 Voltage Park
- 17.8 Akash Network
- 17.9 Other Relevant Market Participants
Note: Every listed company is profiled on the structure shown under the first company. The company list is preliminary and may change based on research findings, market developments, data availability and client requirements.
Chapter 18 Disclaimer
- 18.1 Research and Forecast Disclaimer
- 18.2 Data Source and Estimation Limitations
Note: The depth of individual sections depends on data availability for this market. Volume, capacity, trade and other unit-based metrics are included where applicable.

