
Expert human data has become a core input for AI labs
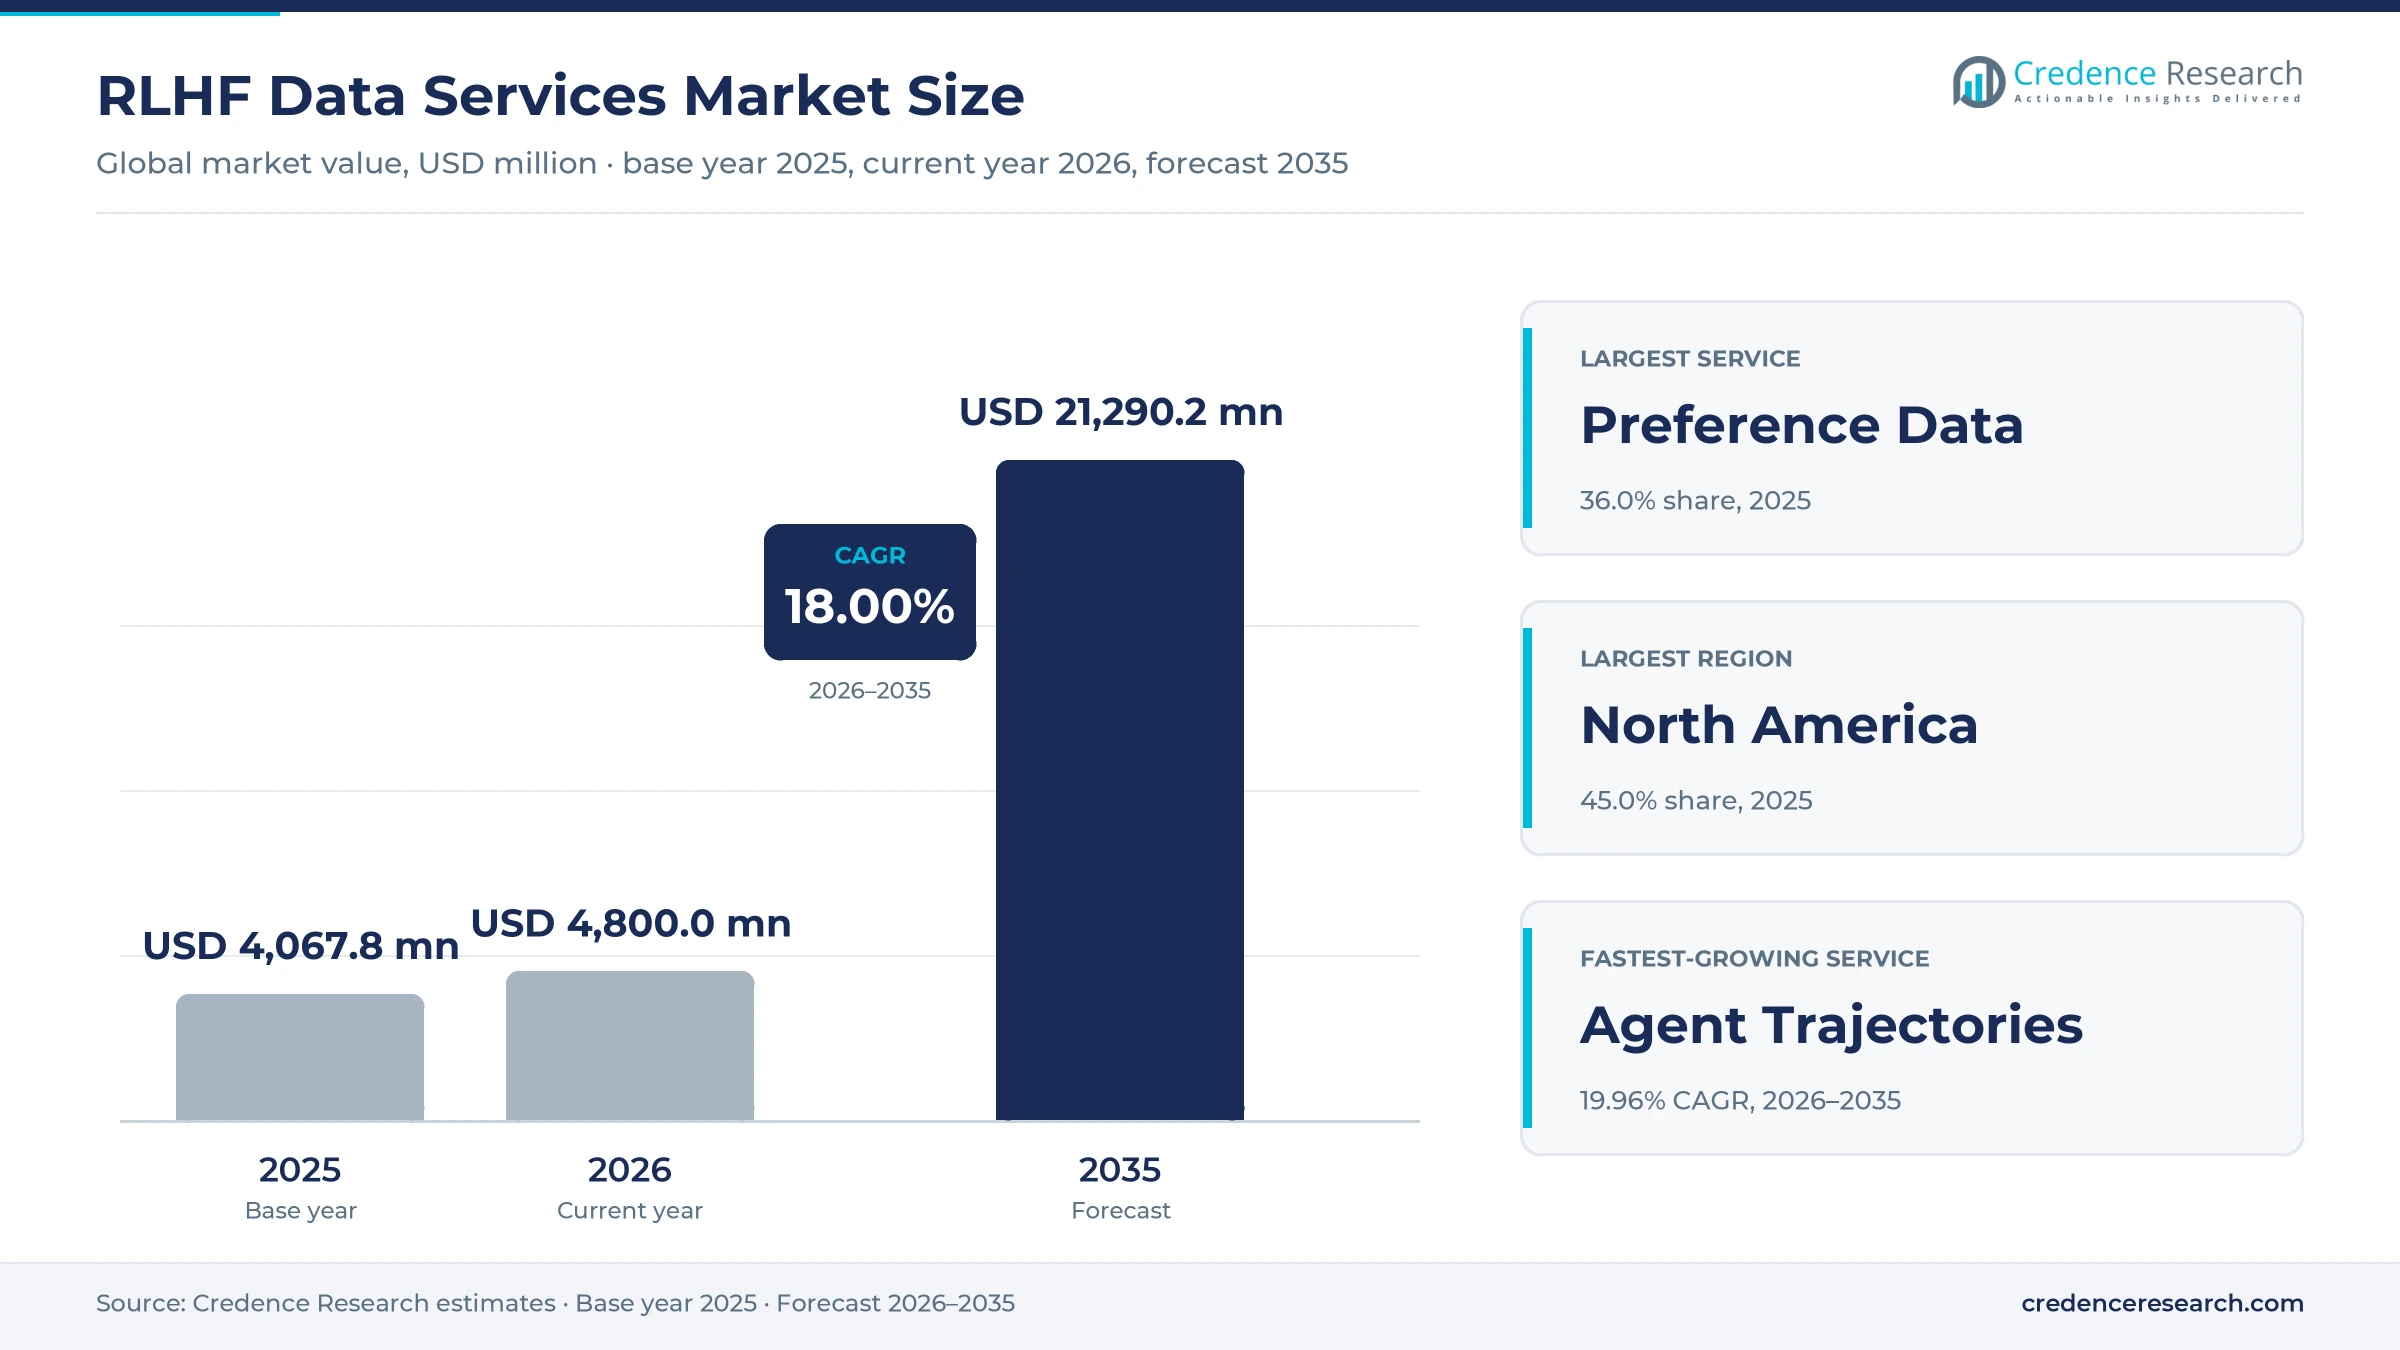
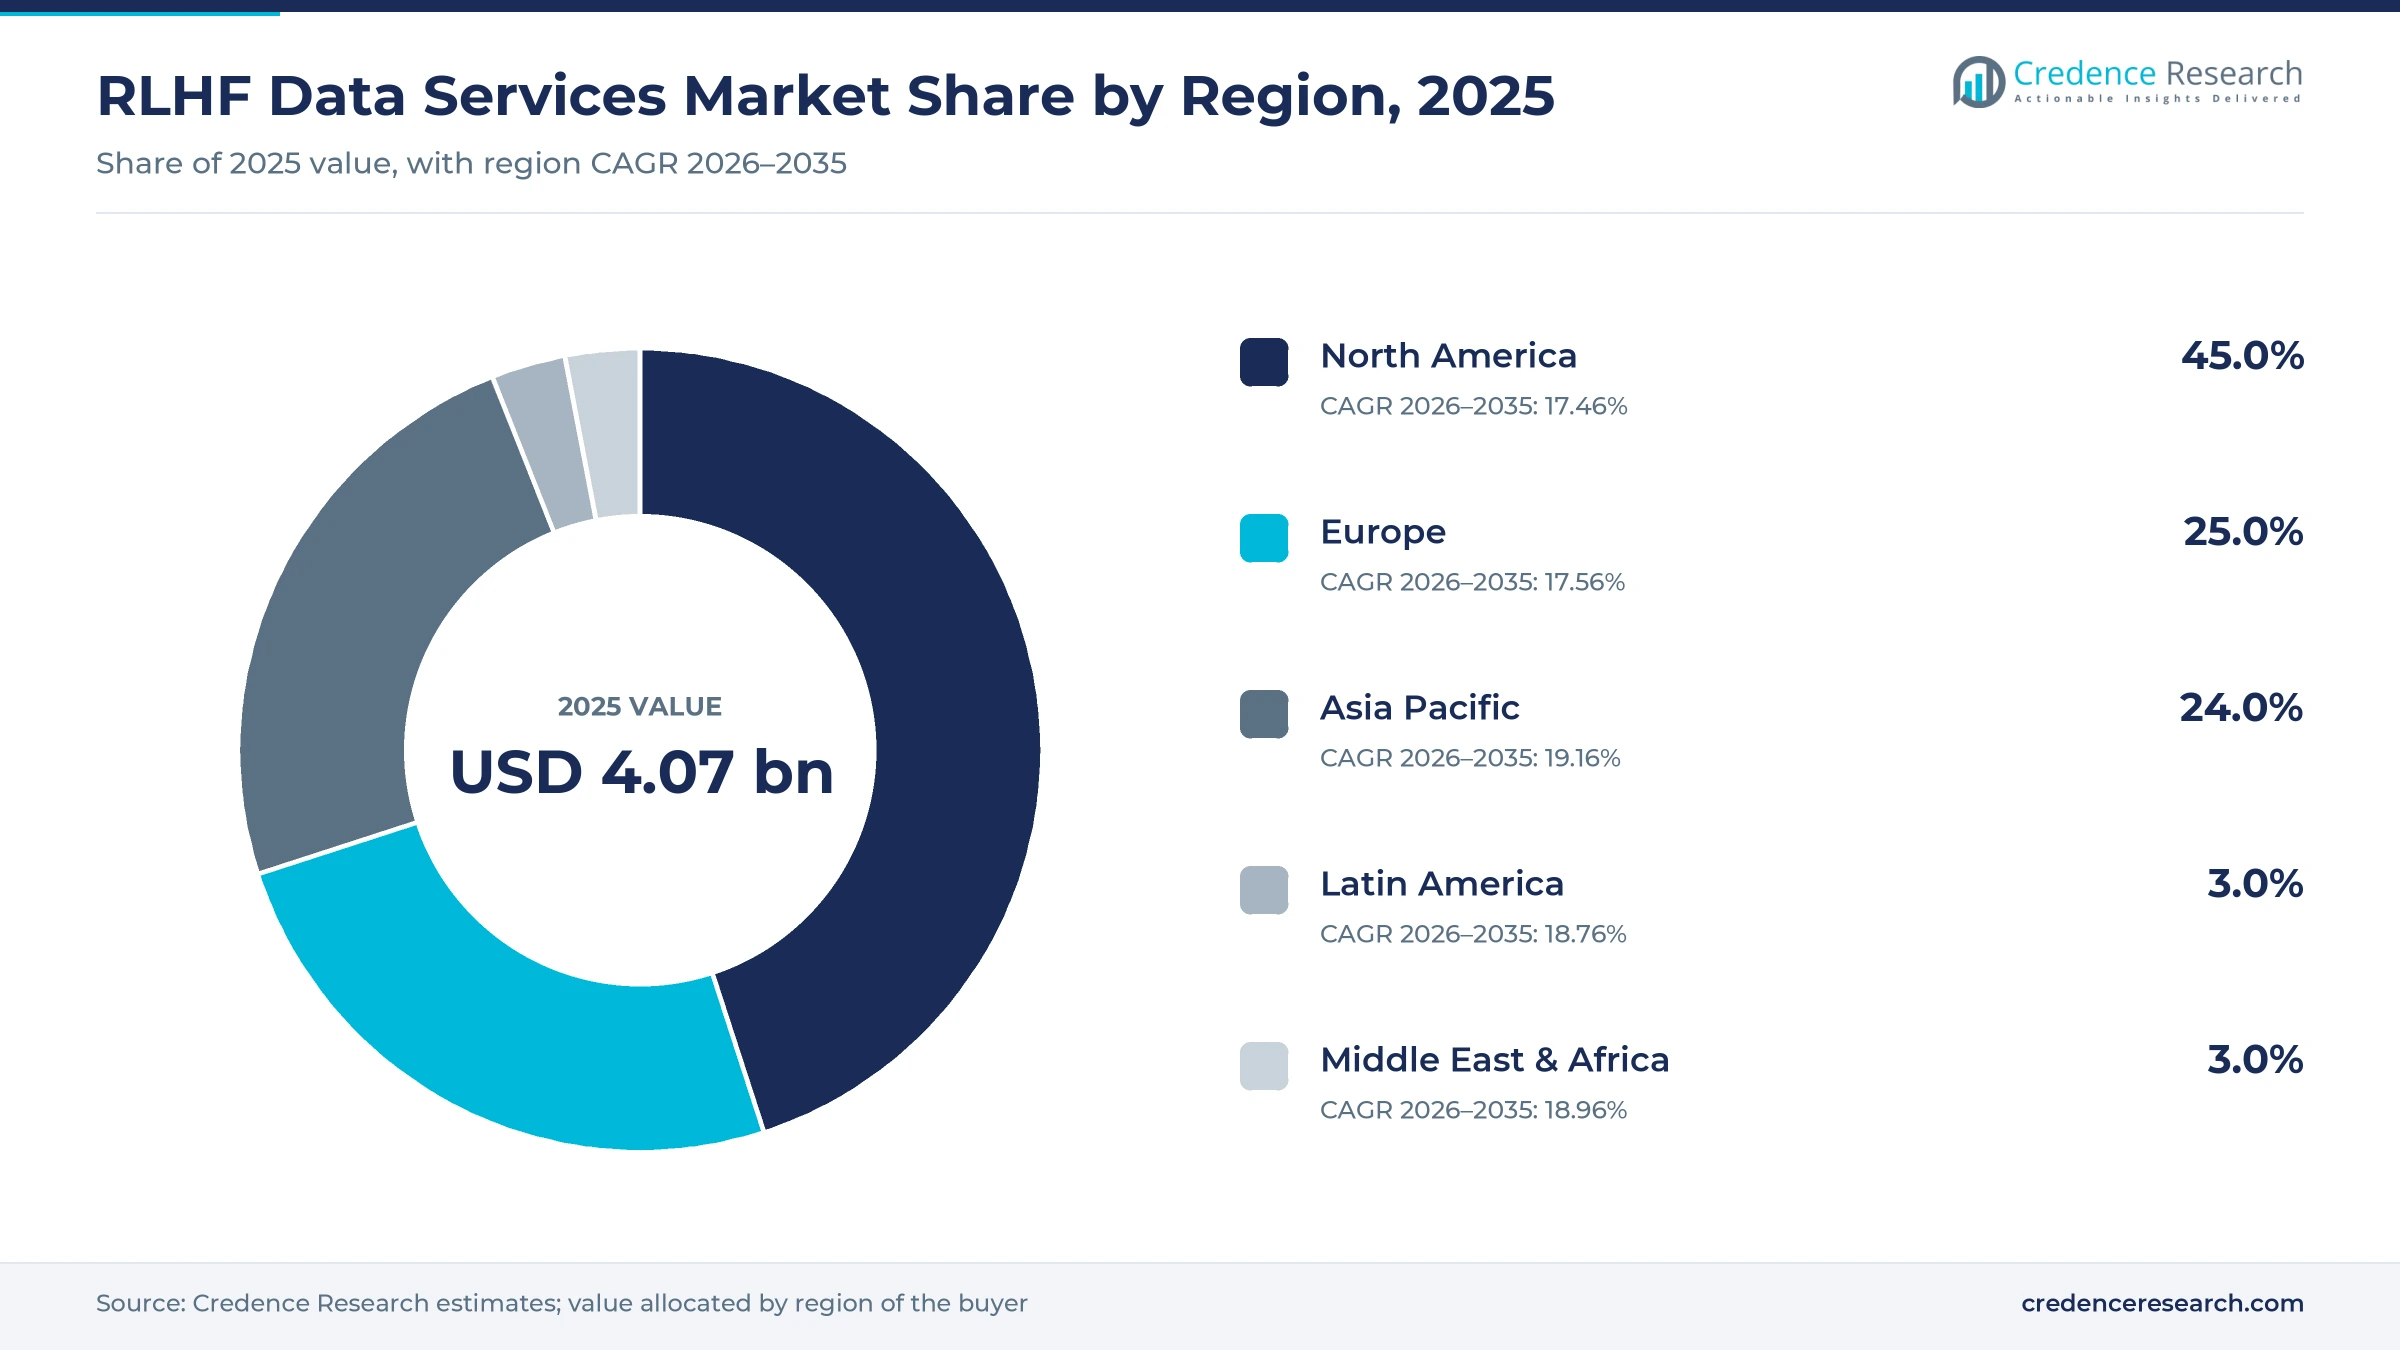
The global RLHF data services market was valued at USD 4.07 billion in 2025 and is projected to increase from USD 4.80 billion in 2026 to USD 21.29 billion by 2035, registering a CAGR of 18.00% during 2026–2035. Spending comes from model developers that buy ranked answers, expert-written solutions, graded test sets and recorded agent tasks to train and check large language models before release. North America held the largest regional share, 45.0% in 2025, because the United States drew $109.08 billion of private AI investment in 2024, according to Stanford HAI. Asia Pacific is the fastest-growing region at 19.16% a year as China, India and Malaysia fund national model and talent programs. A major commercial change came in June 2025, when Meta took a 49% stake in Scale AI and several labs moved work to other suppliers. Buyers are also shifting budgets toward credentialed experts in coding, STEM, medicine and law rather than generalist crowds.
What does the RLHF data services market include?
The RLHF data services market covers paid work that supplies human judgment for training and testing AI models after pretraining. This includes pairwise preference rankings, expert-written answers and corrections, rubric-graded evaluation sets and recorded agent trajectories in browsers, code editors and business software. Buyers contract per task, per expert hour or through managed programs with quality guarantees and confidentiality terms.
The scope excludes general image and text labeling for classic machine learning, annotation software sold as a stand-alone license and model training compute. Value is counted at the vendor level, so payments that vendors pass to contract experts are included in the service price paid by the lab or enterprise.
RLHF Data Services Market Insights
- The market is valued at USD 4.07 billion in 2025 and is projected to reach USD 21.29 billion by 2035, growing at an 18.00% CAGR as labs expand post-training rounds.
- North America led with 45.0% of 2025 value, while Asia Pacific grows fastest at 19.16% a year through 2035 on national model programs.
- Preference Data held 36.0% of 2025 value, and Agent Trajectories are the fastest-growing service at 19.96% a year to 2035.
- Meta took a 49% stake in Scale AI in June 2025, after which several frontier labs spread human data work across other vendors.
- Mercor raised $350 million at a $10 billion valuation in October 2025, showing investor appetite for expert networks serving AI labs.
Preference data leads while agent trajectories grow fastest
Why do preference data services hold the largest share?
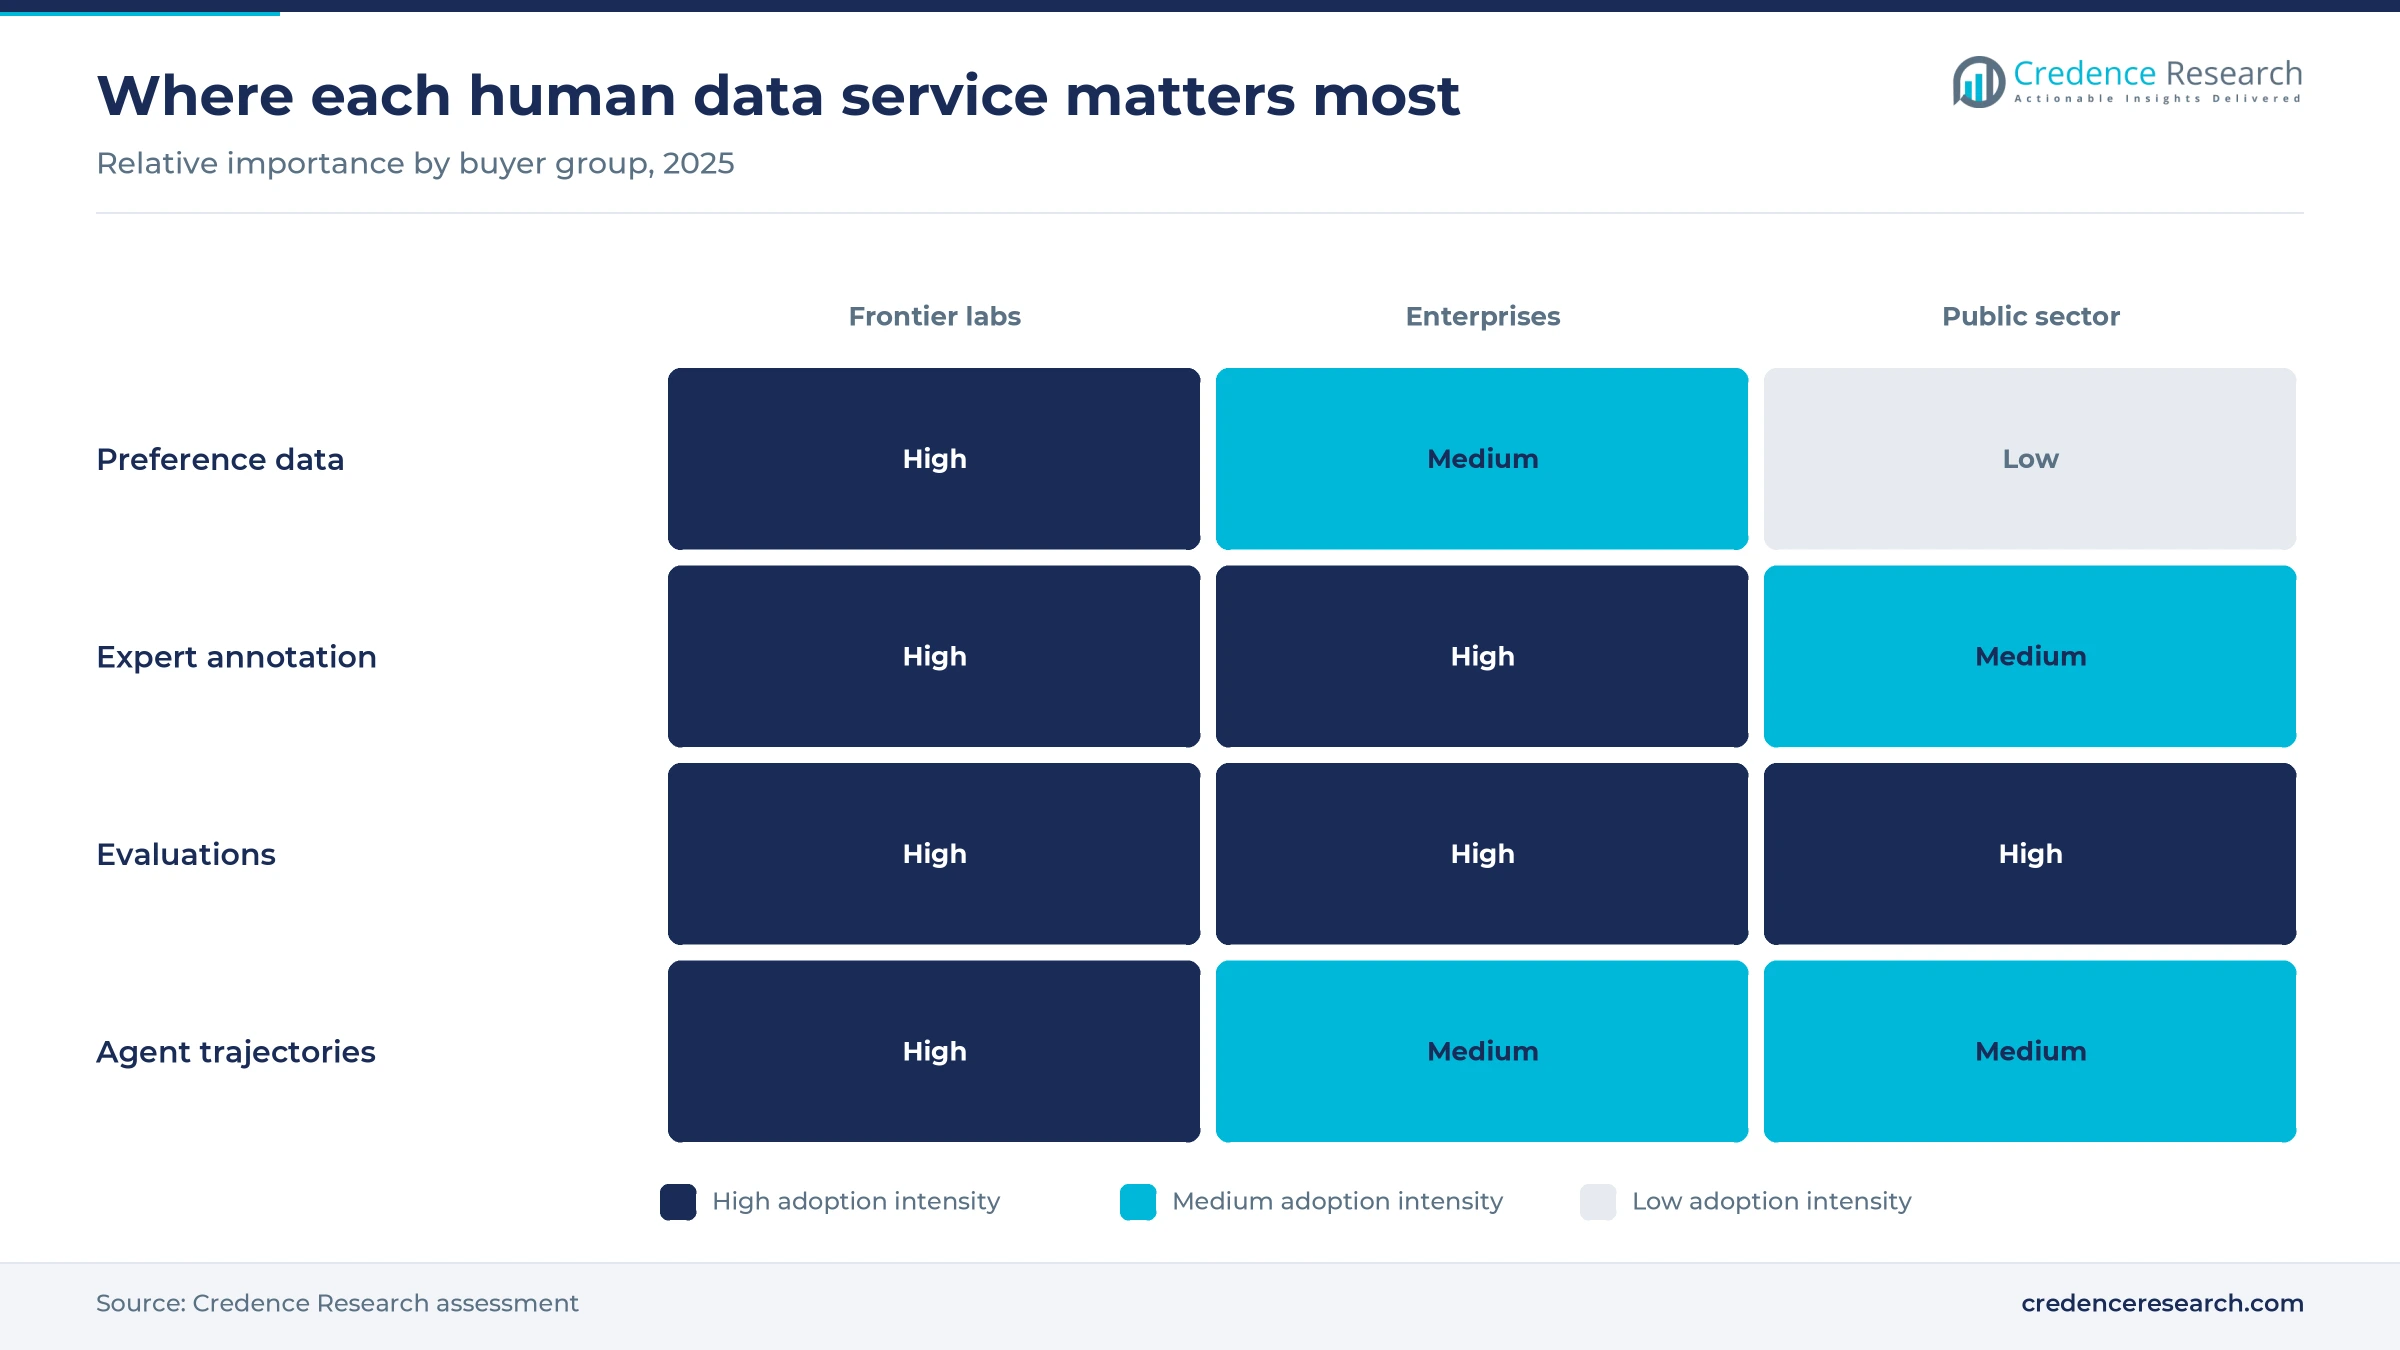
Based on service, the market is categorized into preference data, expert annotation, evaluations and agent trajectories. Preference Data led with 36.0% of 2025 value because ranking and rewriting model answers remains the core step of post-training at frontier labs. Reuters reported that Surge AI, a preference data specialist founded in 2020, counts Google, OpenAI and Anthropic among its clients. Agent Trajectories grow fastest at 19.96% a year as labs train models to act in software. Turing listed agentic behavior among the focus areas of its AGI Advancement unit when it raised $111 million in a Series E round in March 2025.
Why does coding lead and medicine grow fastest?
Based on domain, the market is categorized into coding, STEM, medicine and law. Coding led with 41.0% of 2025 value because software tasks can be checked against tests, which makes expert-written fixes easy to grade and reuse. OpenAI built SWE-bench Verified in August 2024 by having 93 professional Python developers screen 1,699 samples down to 500. Medicine grows fastest at 19.25% a year as health buyers want clinician-graded evidence before deployment. HealthBench, released in May 2025, relies on rubrics written by 262 physicians across 5,000 conversations, according to its technical paper.
Why do frontier labs dominate buying today?
Based on buyer, the market is categorized into frontier labs and enterprises. Frontier Labs led with 72.0% of 2025 value because a handful of model developers fund most large preference and evaluation programs. Meta took a 49% stake in Scale AI for a reported $14.3 billion in June 2025, according to RTÉ, which shows how far labs will go to secure supply. Enterprises grow fastest at 19.41% a year as banks, law firms and hospitals test models on their own work. Mercor's APEX index, published Oct. 1, 2025, used about 100 experts to write 200 cases in banking, law, consulting and medicine.
| Segment Group | Leading Sub-segment | Share, 2025 | Fastest-growing Sub-segment | CAGR, 2026–2035 |
|---|---|---|---|---|
| By Service | Preference Data | 36.0% | Agent Trajectories | 19.96% |
| By Domain | Coding | 41.0% | Medicine | 19.25% |
| By Buyer | Frontier Labs | 72.0% | Enterprises | 19.41% |
Request a Free Sample
Fill in your details and we'll send you a free sample report.
- Sample data tables & charts
- Research methodology
Lab post-training budgets and expert demand drive growth
Frontier labs need large volumes of human preference data
Frontier model developers depend on human preference data because ranking, rewriting and scoring answers is still the main way to shape model behavior after pretraining. Stanford HAI's 2025 AI Index counted 40 notable models from U.S. institutions in 2024, against 15 from China and three from Europe, and each release needs fresh rounds of post-training on large language models. Global private investment in generative AI reached $33.9 billion in 2024, up 18.7% from 2023, according to the same index. Reuters reported that Surge AI sought up to $1 billion at a valuation above $15 billion in its first outside capital raise. In the Credence Research model this driver adds about 7.2 percentage points to annual growth to 2035.
Enterprise domain work lifts expert annotation spending
Enterprises are paying for expert annotation because general models still miss the standards of regulated professions. OpenAI's GDPval evaluation, released Sept. 25, 2025, covered 1,320 tasks across 44 occupations in nine sectors, which shows how buyers now test models on real professional output. Stanford HAI reported that 78% of organizations used AI in 2024, up from 55% a year earlier, which widens the pool of buyers that need domain checks. Handshake reported more than 500,000 PhD holders in its network when it launched Handshake AI in June 2025, as The Letter Two reported. In the Credence Research model this driver adds about 5.0 percentage points to annual growth to 2035.
Continuous alignment and multilingual evaluation create projects
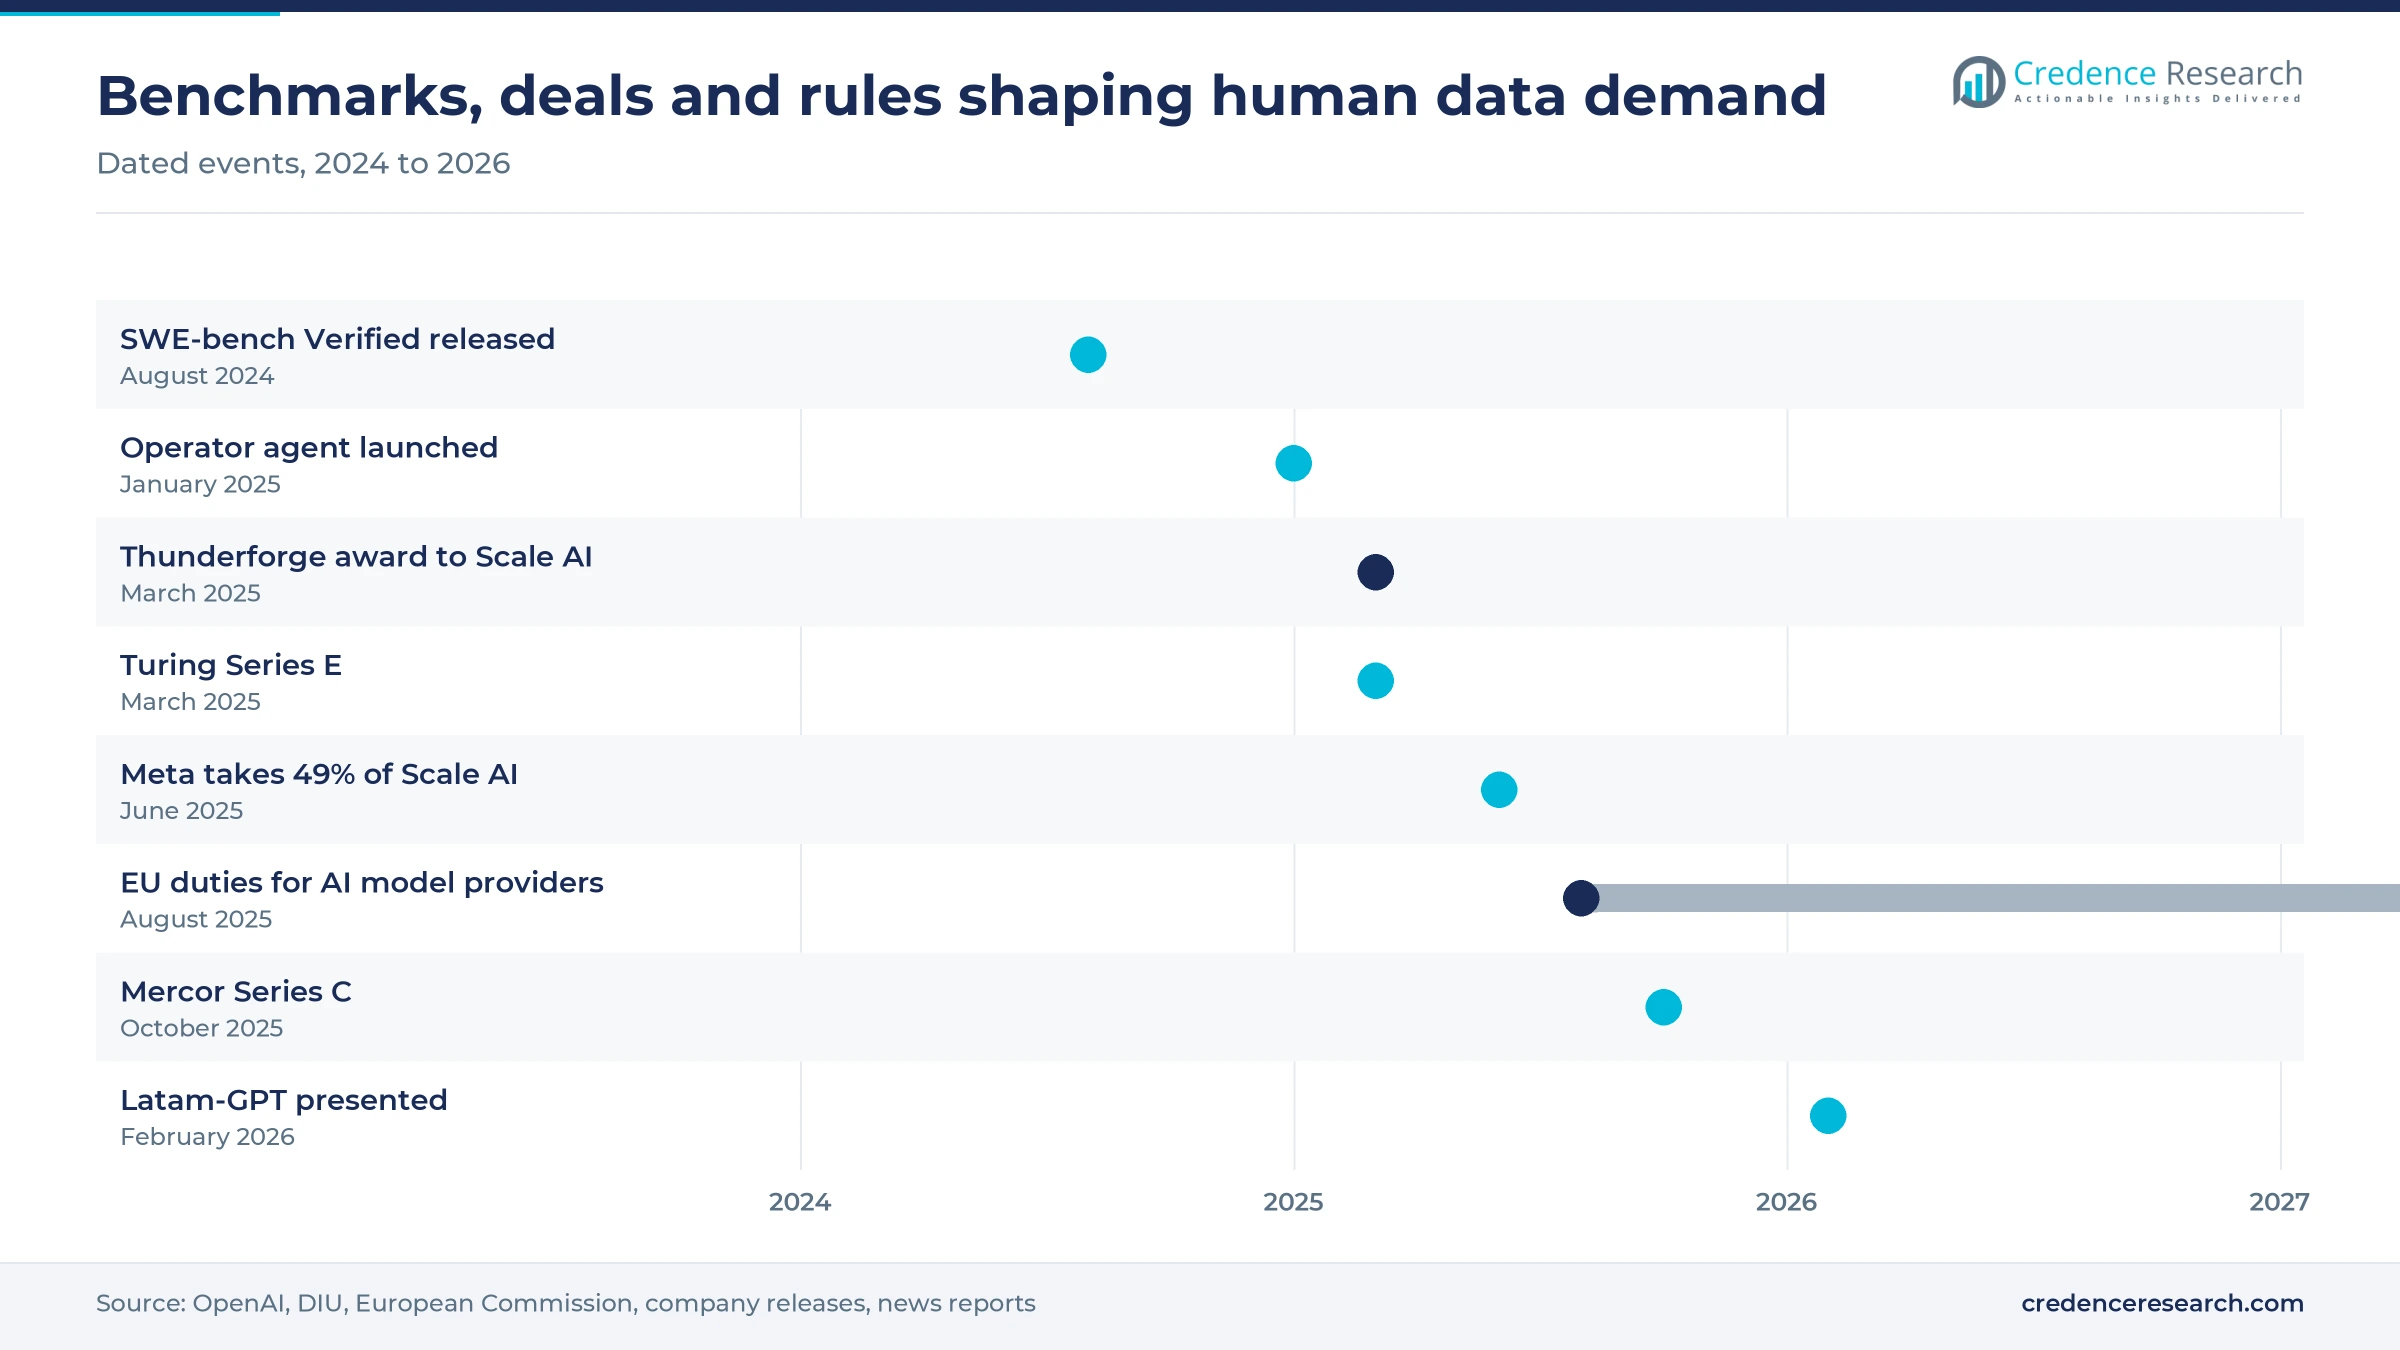
Alignment is no longer a one-time step, because every model update and every new language market needs fresh evaluation. Obligations for general-purpose AI providers entered into application on Aug. 2, 2025, according to European Commission guidance for model providers, which pushes providers toward documented testing. Cohere for AI drew about 3,000 researchers in 119 countries to annotate roughly 204,000 prompt and completion pairs for its Aya project, according to Axios in February 2024. Invisible Technologies said in September 2025 that it had trained models for more than 80% of leading AI model providers, including Cohere, Microsoft and AWS. In the Credence Research model this driver adds about 3.2 percentage points to annual growth to 2035.
Government and defense programs widen the buyer base
Public agencies are becoming buyers of model evaluation and tuning work as they move AI into planning and operations. The Defense Innovation Unit awarded Scale AI the Thunderforge prototype contract on March 5, 2025, with Anduril and Microsoft as partners and first use at Indo-Pacific Command and European Command. India's Cabinet approved the IndiaAI Mission with an outlay of Rs 10,371.92 crore in March 2024, as India TV reported, which funds national datasets and compute. Saudi Arabia launched HUMAIN under the Public Investment Fund on May 12, 2025, with Arabic large language models as a stated aim, according to Arab News. These programs need experts who can grade outputs in local languages and secure settings.
Credentialed experts and verifiable rewards reshape work
Shift from generalist crowds to credentialed experts
Buyers are shifting budgets from large generalist crowds to smaller pools of credentialed specialists with verified skills. xAI laid off about 500 members of its roughly 1,500-person annotation team on Sept. 12, 2025 and said it would expand its specialist AI tutor team tenfold, according to TechCrunch. Scale AI cut about 200 full-time staff and 500 contractors in July 2025, saying it had ramped up generative AI capacity too quickly, as TechRepublic reported. Mercor then raised $350 million at a $10 billion valuation on Oct. 27, 2025 with a network of more than 30,000 experts, per TechCrunch coverage. As a result, Preference Data still holds 36.0%, but expert work takes a larger slice of each contract.
Rise of verifiable rewards and graded task environments
A rising share of post-training now uses verifiable rewards, which changes what labs buy from human data vendors each year. DeepSeek's R1 paper, published in Nature on Sept. 17, 2025, described reasoning training that gave a reward of one for a correct math or code answer and zero otherwise, according to Science News. As a result, vendors now sell test suites, graded tasks and simulated work environments rather than only pairwise rankings, alongside synthetic training corpora. Turing said in March 2025 that its network spans more than four million software engineers, data scientists and STEM experts. This shift favors vendors that can write, verify and maintain large libraries of graded tasks for each new model release.
Computer-use agents open a large trajectory data opening
Computer-use agents give vendors a large opening, because labs need recorded human demonstrations of multi-step tasks. OpenAI's Operator, launched Jan. 23, 2025, scored 38.1% on OSWorld and 58.1% on WebArena, according to The Register, which leaves wide room for better training data. xAI said in September 2025 that it was hiring specialist tutors across STEM, finance, medicine and safety, which signals demand for skilled task recorders. Agent Trajectories grow at 19.96% a year in the Credence Research model, the fastest rate among services. Vendors that can supply secure desktops, logged tool calls and expert review stand to win the largest agent programs.
Sovereign and multilingual model programs open new demand
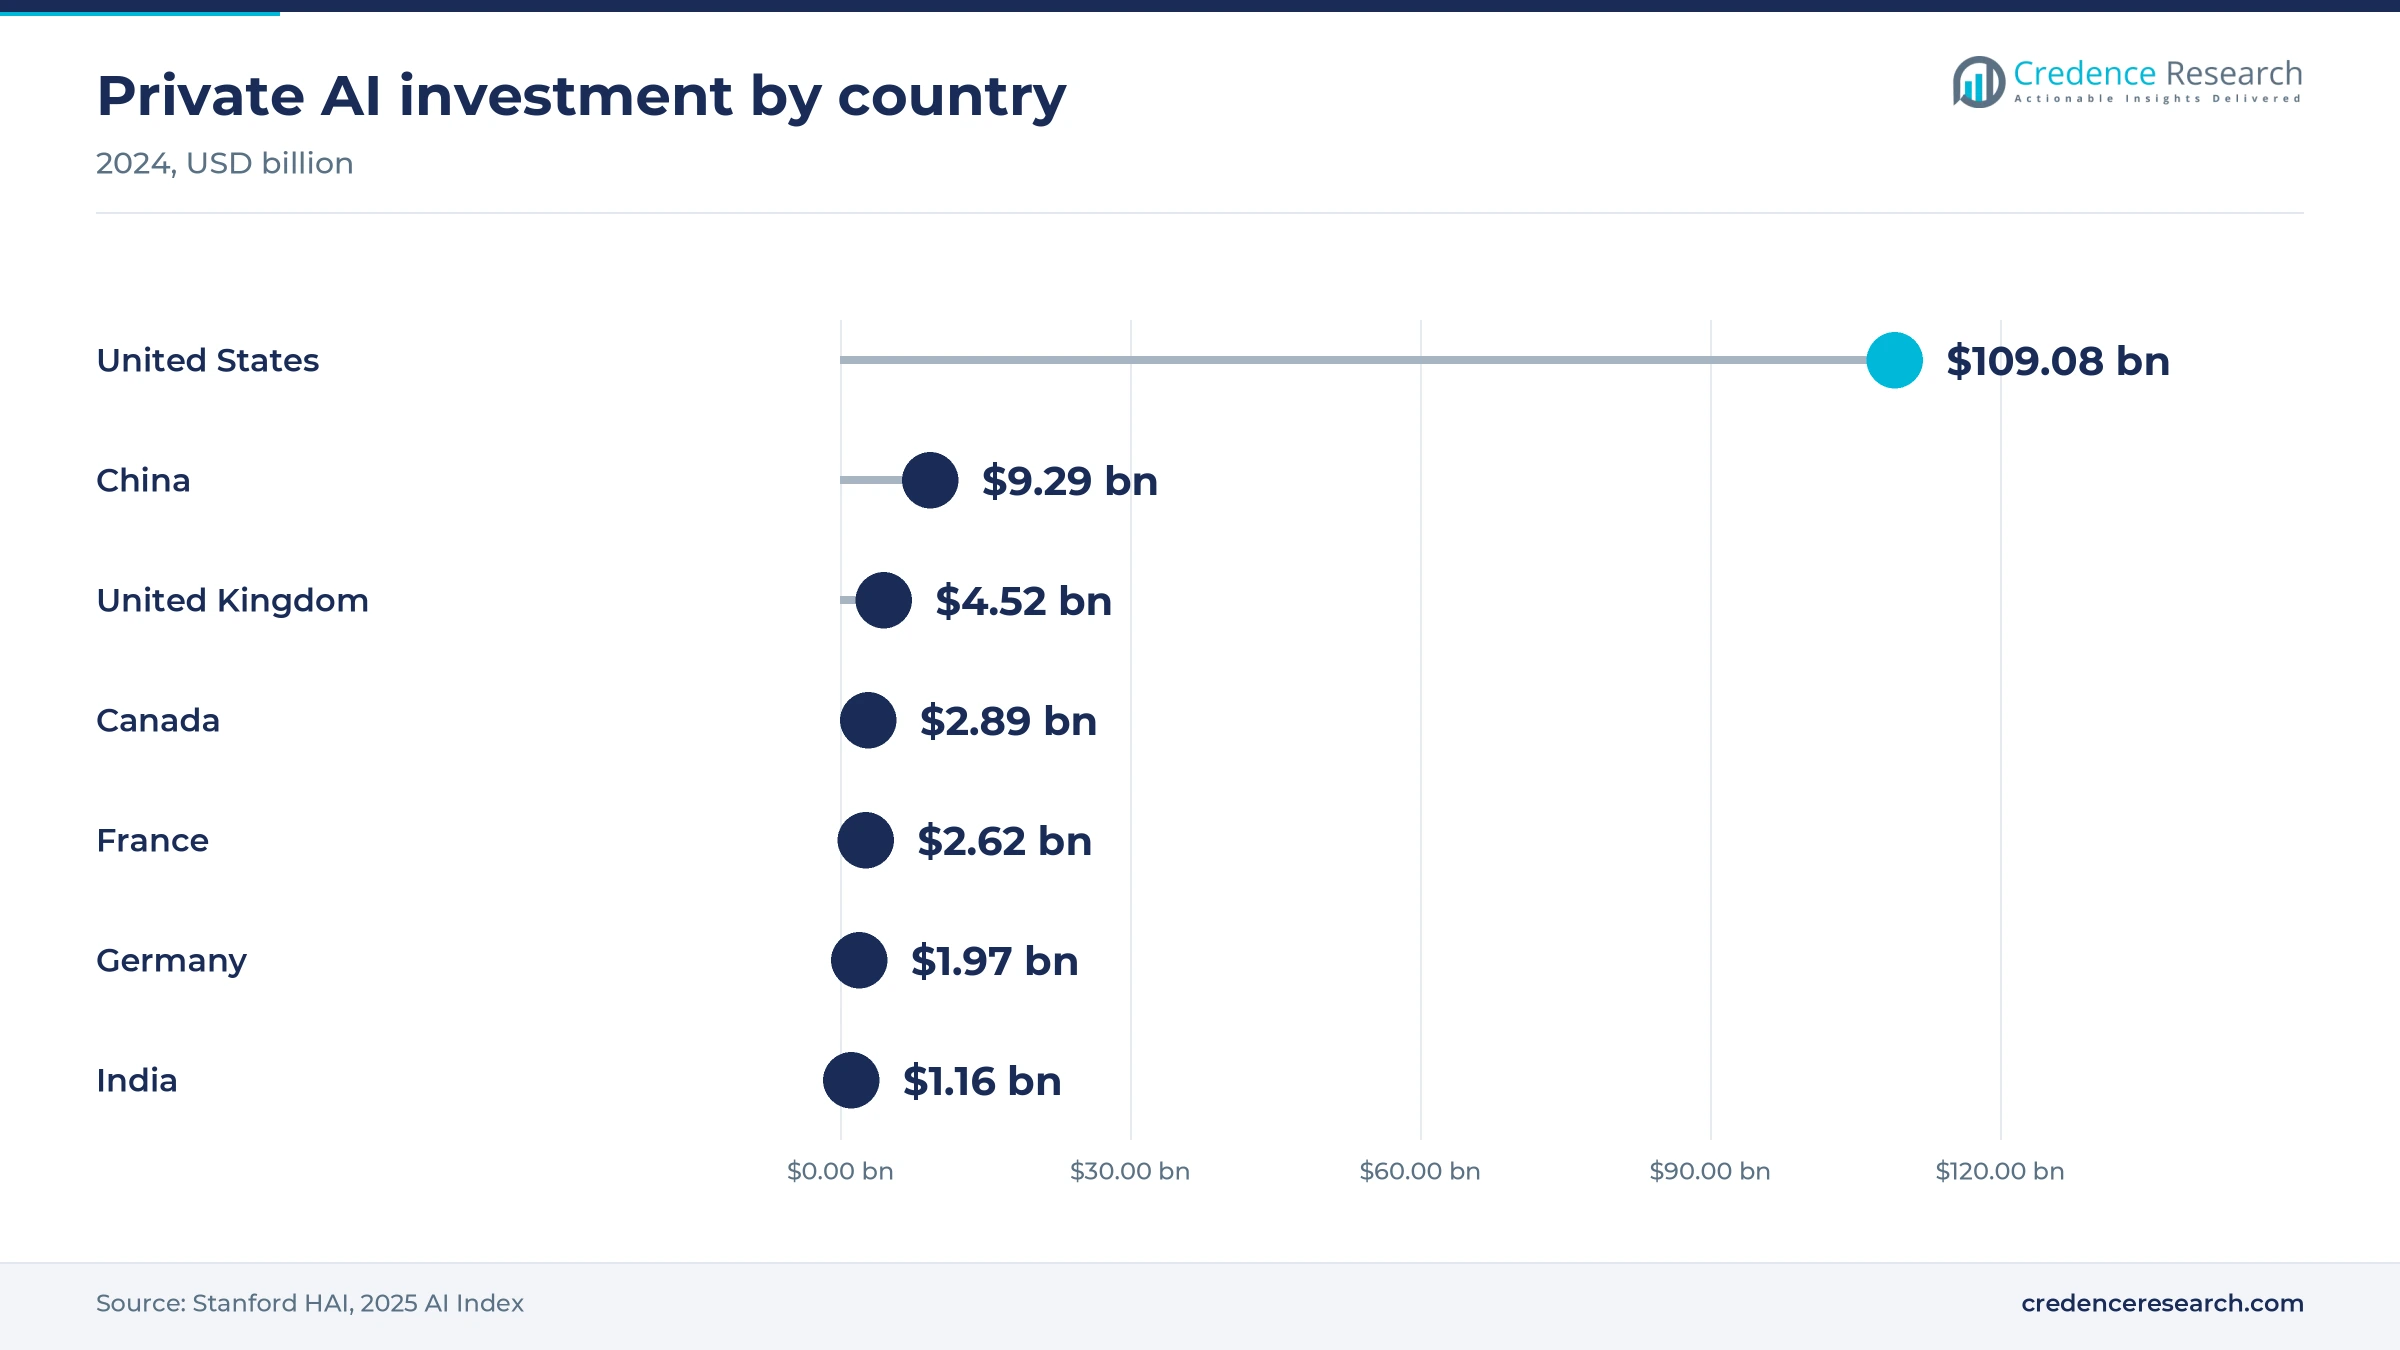
Sovereign and multilingual model programs open demand outside the United States for native-speaker raters and evaluators. Latam-GPT gathered more than eight terabytes of data with nearly 200 specialists across eight countries, coordinated by Chile's CENIA, according to bne IntelliNews. Stanford HAI data show 2024 private AI investment of $9.29 billion in China, $4.52 billion in the United Kingdom and $1.16 billion in India, which funds local model teams. Asia Pacific is the fastest-growing region in the Credence Research model. Vendors with raters in Arabic, Hindi, Spanish and Portuguese can win evaluation work that U.S.-centric crowds cannot staff.
Labor rules, client concentration and expert scarcity weigh
Contractor classification lawsuits raise labor costs
Worker classification is a cost risk for vendors that rely on large contractor pools. Scale AI faced a wage suit filed Dec. 10, 2024 and a second suit on Jan. 3, 2025, in which an Outlier worker said her pay of about $15 an hour fell below California's $16.00 minimum wage, according to TechCrunch. As a result, vendors face higher compliance, payroll and legal costs in key U.S. states. Many vendors now move toward vetted experts on clearer contracts.
Client concentration and neutrality concerns
Revenue concentration among a few frontier labs exposes vendors to sudden loss of work. After Meta took its stake in Scale AI in June 2025, OpenAI and Google were reported to be ending their work with the vendor, according to TechRepublic in July 2025. This shows that a single ownership change can move large programs within weeks. Vendors now stress neutrality, separate data rooms and multi-client governance to keep lab trust.
Scarce senior experts limit project scale
Senior professionals are scarce, which caps how fast vendors can staff high-value projects in medicine, law and finance. OpenAI's GDPval tasks were written by professionals with about 14 years of experience on average, a profile that few contract networks can supply at volume. This raises hourly rates and lengthens project start times for buyers. Vendors respond with referral programs, university partnerships and tiered review that saves senior time for final checks.
EU enforcement deadlines add documentation costs
EU rules add documentation work that buyers expect vendors to support with audit-ready records. The European Commission's enforcement powers, including fines, apply from Aug. 2, 2026, and models placed on the market before Aug. 2, 2025 must comply by Aug. 2, 2027. As a result, providers need traceable records of how human feedback was gathered and checked. Vendors face added costs for consent records, rater metadata and data provenance logs.
North America leads as Asia Pacific grows fastest
| Region | Value, 2025 (USD billion) | Share, 2025 | CAGR, 2026–2035 |
|---|---|---|---|
| North America | 1.83 | 45.0% | 17.46% |
| Europe | 1.02 | 25.0% | 17.56% |
| Asia Pacific | 0.98 | 24.0% | 19.16% |
| Latin America | 0.12 | 3.0% | 18.76% |
| Middle East & Africa | 0.12 | 3.0% | 18.96% |
North America leads on frontier lab spending
North America held 45.0% of 2025 value and grows at 17.46% a year to 2035. The region leads because U.S. institutions produced 40 notable models in 2024, according to Stanford HAI, and most frontier post-training budgets sit with these developers. Defense demand adds a second buyer group after the Thunderforge award in March 2025. As a result, the region remains the main market for preference data, coding evaluations and agent trajectory work.
Europe grows on compliance testing and model builders
Europe held 25.0% of 2025 value and grows at 17.56% a year to 2035. Private AI investment reached $4.52 billion in the United Kingdom, $2.62 billion in France and $1.97 billion in Germany in 2024, according to Stanford HAI. In turn, EU duties for general-purpose AI providers that took effect in August 2025 raise demand for documented evaluation and red-team testing. European buyers also need raters in many official languages, which favors multilingual vendors.
Asia Pacific grows fastest on national model programs
Asia Pacific held 24.0% of 2025 value and is the fastest-growing region at 19.16% a year to 2035. China drew $9.29 billion and India $1.16 billion of private AI investment in 2024, according to Stanford HAI. India's IndiaAI Mission, approved in March 2024 with Rs 10,371.92 crore, funds datasets and compute for local models. Malaysia's Khazanah Nasional led Turing's Series E in March 2025, which links regional capital to the expert supply chain.
Latin America builds a regional model base
Latin America held 3.0% of 2025 value and grows at 18.76% a year to 2035. Chile's CENIA presented Latam-GPT, a 70 billion parameter model, on Feb. 10, 2026, with more than 60 institutions taking part, according to bne IntelliNews. This creates demand for Spanish and Portuguese evaluators who understand regional usage and law. The region also supplies remote expert talent to U.S. vendors because time zones match North American working hours.
Middle East & Africa gains from Arabic model programs
Middle East & Africa held 3.0% of 2025 value and grows at 18.96% a year to 2035. HUMAIN, chaired by Saudi Arabia's Crown Prince, plans AI adoption in energy, healthcare, manufacturing and financial services, according to Arab News in May 2025. These sectors need Arabic-speaking experts who can grade model answers in regulated settings. Africa adds a smaller but growing share through remote contributor pools that serve global vendors.
Funding rounds and lab benchmarks marked 2025 activity
| Development | Status and market relevance |
|---|---|
| In March 2025, Turing raised $111 million in Series E funding at a $2.2 billion valuation, led by Khazanah Nasional. | Funds expansion of coding, reasoning and agentic data work for frontier labs |
| In June 2025, Handshake launched Handshake AI to connect PhD holders and graduate students with AI labs for training work. | Adds a large academic expert pool for STEM and research evaluation |
| In September 2025, Invisible Technologies raised $100 million in growth funding led by Vanara Capital. | Supports its expert marketplace for RLHF, training and model validation |
| In October 2025, Mercor raised a $350 million Series C at a $10 billion valuation, led by Felicis Ventures. | Expands its network of more than 30,000 domain experts serving AI labs |
| In September 2025, OpenAI released GDPval, a benchmark of 1,320 professional tasks across 44 occupations. | Raises demand for expert-written and expert-graded evaluation tasks |
Rubrics, reward checks and agent recordings define methods
- Pairwise preference ranking asks raters to compare two or more model answers and pick the better one, which feeds reward models used in RLHF.
- Rubric-based grading gives experts a written checklist for each prompt, as in HealthBench, so scores stay consistent across many reviewers.
- Verifiable reward environments pair tasks with automatic checks such as unit tests or exact answers, with experts writing and auditing the tasks.
- Computer-use trajectories record each click, keystroke and tool call that a skilled human makes while finishing a task in real software.
Need a Custom Version of This Report?
Tailor the scope, geography, or segments to your exact requirements.
- Custom geography or segment scope
- Direct access to our analyst team
Expert networks compete on depth, speed and neutrality
Competition in RLHF data services centers on the depth of expert networks, speed of delivery and trust with frontier labs. Scale AI combines large managed programs with public sector work such as the Thunderforge contract, while Surge AI focuses on high-quality preference data for a few large labs. Mercor and Handshake AI recruit credentialed professionals and graduate researchers, and Turing draws on its software engineering network for coding and reasoning tasks. Invisible Technologies pairs expert work with an enterprise software platform. Neutrality has become a selling point since the Meta investment in Scale AI, and labs now split work across several vendors. Vendors also differ in tooling, from in-house rating interfaces to general annotation tools licensed from software providers. Price competition is weaker than in classic labeling because expert quality decides model results.
Companies profiled and their roles in this market
| Company | Type | Role in the market |
|---|---|---|
| Surge AI | Specialist vendor | Preference data and evaluations for frontier labs |
| Scale AI | Managed services vendor | Large post-training programs and defense evaluation work |
| Mercor | Expert network | Credentialed professionals for domain annotation and APEX evaluations |
| Turing | Engineering network | Coding, reasoning, STEM and agentic data for AI labs |
| Invisible Technologies | Platform and expert marketplace | RLHF, training and validation for model providers |
| Handshake AI | Academic expert network | PhD and graduate experts for STEM and research tasks |
Expert quality will decide vendor share to 2035
Credence Research's view is that expert quality, not crowd size, will decide vendor share through 2035. Labs are moving work away from generalist pools, as the cuts at xAI and Scale AI in 2025 showed, and toward smaller teams of credentialed specialists. Classic image and text labeling remains a separate, more price-driven field than RLHF data services. Vendors that can prove rater skill, keep client data separate and build graded task environments for agents are best placed to grow faster than the market. Enterprise buyers will add a second demand base as they test models on their own workflows.
Model-based sizing checked against public vendor activity
The report uses 2025 as the base year and forecasts values from 2026 to 2035 in U.S. dollars. Market values come from the Credence Research model, and the regional, service, domain and buyer splits are Credence Research estimates. Inputs include public company announcements, funding releases, government and regulator publications, published benchmark papers and the Stanford HAI AI Index. The 2025 value was checked against public vendor activity and lab spending signals. No interviews or surveys were conducted for this edition of the report.
Agent and enterprise work extend demand through 2035
The RLHF data services market is expected to grow from USD 4.80 billion in 2026 to USD 21.29 billion by 2035 as human judgment stays central to model training and testing. Agent trajectory work should gain share as computer-use products mature and labs need longer, logged demonstrations. Enterprises will buy more domain evaluation as they move models into banking, law and health care. Verifiable rewards will reduce some routine ranking work, but they will raise demand for experts who write and audit graded tasks. Regional programs in Asia Pacific, Latin America and the Middle East will add multilingual demand.
Frequently Asked Questions
How big is the RLHF data services market?
Which service holds the largest share?
Which service grows fastest?
Which region leads the market?
Which region grows fastest?
Which domain grows fastest?
Who are the key companies in the market?
What are the main challenges for vendors?
Table of Content
Chapter 1 Market Segmentation
- 1.1 Segmentation Framework
- 1.1.1 Product and Service Classification
- 1.1.2 Application and End-Use Classification
- 1.1.3 Technology and Solution Classification
- 1.1.4 Customer and Distribution Channel Classification
- 1.1.5 Geographic Segmentation
- 1.1.6 Market Segment Definitions and Boundaries
- 1.2 By Service
- 1.2.1 Preference Data
- 1.2.2 Expert Annotation
- 1.2.3 Evaluations
- 1.2.4 Agent Trajectories
- 1.3 By Domain
- 1.3.1 Coding
- 1.3.2 STEM
- 1.3.3 Medicine
- 1.3.4 Law
- 1.4 By Buyer
- 1.4.1 Frontier Labs
- 1.4.2 Enterprises
Chapter 2 Introduction
- 2.1 Report Objectives and Scope
- 2.2 Product Definition and Industry Terminology
- 2.3 Market Inclusions and Exclusions
- 2.4 Research Process
- 2.4.1 Primary Research and Expert Interviews
- 2.4.2 Secondary Research and Source Review
- 2.4.3 Top-Down and Bottom-Up Estimation
- 2.4.4 Data Triangulation and Verification
- 2.5 Market Size Measurement Basis
- 2.5.1 2025: USD 4.07 billion → 2035: USD 21.29 billion
- 2.6 Historical and Forecast Reference Periods
- 2.6.1 Historical Period: 2018-2025
- 2.6.2 Base Year: 2025
- 2.6.3 Forecast Period: 2025-2035
- 2.7 Research Assumptions and Limitations
Chapter 3 Executive Summary
- 3.1 Market Snapshot and Key Findings
- 3.2 Base-Year Market Size, 2025
- 3.3 Forecast Market Size, 2035
- 3.4 Revenue and Volume Growth Outlook
- 3.5 Key Demand and Supply Indicators
- 3.6 Leading Market Segments
- 3.7 Fastest-Growing Market Opportunities
- 3.8 Regional Performance Highlights
- 3.9 Technology and Industry Transformation
- 3.10 Competitive Landscape Summary
- 3.11 Analyst View and Strategic Implications
Chapter 4 Global RLHF Data Services Market Trends and Developments
- 4.1 Historical Industry Development, 2018-2025
- 4.2 Recent Market Trends and Developments
- 4.3 Demand and Customer Behavior Trends
- 4.4 Technology and Product Innovation
- 4.5 Artificial Intelligence, Automation and Digitalization
- 4.6 Local Manufacturing and Supply Chain Realignment
- 4.7 Industry Partnerships, Mergers and Acquisitions
- 4.8 Sustainability and Circular Economy Developments
- 4.9 Government and Private Sector Investment Trends
- 4.10 Emerging Business Models and Commercialization
- 4.11 Industry Developments and Announcements
Chapter 5 Global RLHF Data Services Market Supply and Demand Analysis
- 5.1 Demand Trend and Consumption Analysis, 2018-2025
- 5.2 Demand Forecast, 2025-2035
- 5.3 Supply Chain Structure and Procurement Trends
- 5.4 Supply-Demand Gap and Bottlenecks
- 5.5 Import Dependence and Sourcing Structure
- 5.6 Regional Supply and Demand Concentration
Chapter 6 Global RLHF Data Services Market Pricing Analysis
- 6.1 Pricing Structure and Measurement
- 6.2 Historical Pricing Trends, 2018-2025
- 6.3 Pricing Outlook, 2025-2035
- 6.4 Pricing by Product and Market Segment
- 6.5 Geographic Pricing Differences
- 6.6 Key Input, Energy, Labor and Logistics Costs
- 6.7 Contract Pricing and Purchasing Models
- 6.8 Pricing Sensitivity and Competitive Positioning
- 6.9 Price, Margin and Profitability Implications
Chapter 7 Global RLHF Data Services Market Dynamics
- 7.1 Market Growth Drivers
- 7.1.1 Demand-Side Drivers
- 7.1.2 Technology and Innovation Drivers
- 7.1.3 Infrastructure and Investment Drivers
- 7.1.4 Regulatory and Policy Drivers
- 7.2 Market Restraints
- 7.2.1 Cost and Affordability Constraints
- 7.2.2 Technology and Adoption Barriers
- 7.2.3 Supply Chain and Operational Constraints
- 7.3 Market Challenges
- 7.3.1 Competitive Pressure and Margin Erosion
- 7.3.2 Skills, Infrastructure and Implementation Gaps
- 7.4 Emerging Market Opportunities
- 7.5 Market Dynamics Impact and Time-Horizon Assessment
Chapter 8 Global RLHF Data Services Value Chain Analysis
- 8.1 Industry Value Chain Overview
- 8.2 Upstream Suppliers and Critical Inputs
- 8.3 Technology and Component Providers
- 8.4 Manufacturing or Service Delivery
- 8.5 Distribution, Channel Partners and Integrators
- 8.6 Downstream Applications and End Users
- 8.7 Value Addition and Profit Pools
- 8.8 Vertical Integration and Outsourcing
- 8.9 Supplier Concentration and Risk
- 8.10 Supply Chain Localization and Resilience
Chapter 9 Global RLHF Data Services Market Regulations and Policies
- 9.1 Relevant Laws, Standards and Compliance Frameworks
- 9.2 Product, Service, Safety and Quality Requirements
- 9.3 Government Policies, Incentives and Subsidies
- 9.4 Imports, Exports and Trade Barriers
- 9.5 Public Procurement and Local Content Requirements
- 9.6 Data Protection, AI and Cybersecurity Compliance
- 9.7 Upcoming Policy Changes and Market Implications
Chapter 10 Global RLHF Data Services Market Hotspots and Opportunities
- 10.1 Market Opportunity Mapping and Growth Hotspots
- 10.2 High-Growth Applications and Customer Groups
- 10.3 Underserved Markets and White-Space Opportunities
- 10.4 Emerging Technology and Product Opportunities
- 10.5 New Capacity and Investment Hotspots
- 10.6 Market Entry and Expansion Opportunities
- 10.7 Distribution and Partnership Opportunities
- 10.8 Near-Term and Long-Term Commercial Potential
- 10.9 Opportunity Attractiveness and Execution Risks
Chapter 11 Global RLHF Data Services Market Outlook, 2025-2035
- 11.1 Market Size and Analysis
- 11.1.1 Revenue (Market Measurement: 2025: USD 4.07 billion → 2035: USD 21.29 billion)
- 11.1.2 Historical Market Size, 2018-2025
- 11.1.3 Base-Year Market Size, 2025
- 11.2 Market Forecast, 2025-2035
- 11.2.1 Revenue Forecast to 2035
- 11.2.2 CAGR and Year-on-Year Growth
- 11.2.3 Incremental Revenue Opportunity
- 11.3 Forecast Assumptions and Scenario Analysis
- 11.3.1 Base-Case Forecast
- 11.3.2 Optimistic and Conservative Scenarios
- 11.3.3 Technology, Pricing and Policy Sensitivities
- 11.4 Market Attractiveness and Growth Outlook
Chapter 12 Global RLHF Data Services Market Segmentation and Outlook
- 12.1 Segmentation Summary and Market Shares, 2025
- 12.2 Largest and Fastest-Growing Segments
- 12.3 By Service - Market Size and Forecast, 2025-2035
- 12.3.1 Segment Definition and Scope
- 12.3.2 Historical Market Size, 2018-2025
- 12.3.3 Revenue Forecast, 2025-2035
- 12.3.4 Base-Year Market Share, 2025
- 12.3.5 Segment CAGR and Growth Drivers
- 12.3.6 Subsegment Market Size and Forecast
- 12.3.6.1 Preference Data
- 12.3.6.2 Expert Annotation
- 12.3.6.3 Evaluations
- 12.3.6.4 Agent Trajectories
- 12.3.7 Subsegment Pricing and Adoption Trends
- 12.3.8 Leading Suppliers and Competition
- 12.3.9 Regional Demand and Opportunities
- 12.4 By Domain - Market Size and Forecast, 2025-2035
- 12.4.1 Segment Definition and Scope
- 12.4.2 Historical Market Size, 2018-2025
- 12.4.3 Revenue Forecast, 2025-2035
- 12.4.4 Base-Year Market Share, 2025
- 12.4.5 Segment CAGR and Growth Drivers
- 12.4.6 Subsegment Market Size and Forecast
- 12.4.6.1 Coding
- 12.4.6.2 STEM
- 12.4.6.3 Medicine
- 12.4.6.4 Law
- 12.4.7 Subsegment Pricing and Adoption Trends
- 12.4.8 Leading Suppliers and Competition
- 12.4.9 Regional Demand and Opportunities
- 12.5 By Buyer - Market Size and Forecast, 2025-2035
- 12.5.1 Segment Definition and Scope
- 12.5.2 Historical Market Size, 2018-2025
- 12.5.3 Revenue Forecast, 2025-2035
- 12.5.4 Base-Year Market Share, 2025
- 12.5.5 Segment CAGR and Growth Drivers
- 12.5.6 Subsegment Market Size and Forecast
- 12.5.6.1 Frontier Labs
- 12.5.6.2 Enterprises
- 12.5.7 Subsegment Pricing and Adoption Trends
- 12.5.8 Leading Suppliers and Competition
- 12.5.9 Regional Demand and Opportunities
- 12.6 Segment Growth Comparison
- 12.7 Segment Attractiveness and Priority Matrix
Chapter 13 Global RLHF Data Services Geographic Market Outlook, 2025-2035
- 13.1 Regional Market Size and Share, 2025
- 13.2 Regional Market Forecast, 2025-2035
- 13.3 Regional Pricing, Production and Demand Differences
- 13.4 North America
- 13.4.1 United States
- 13.4.2 Canada
- 13.4.3 Mexico
- 13.5 Europe
- 13.5.1 Germany
- 13.5.2 France
- 13.5.3 Italy
- 13.5.4 United Kingdom
- 13.5.5 Spain
- 13.5.6 Poland
- 13.5.7 Russia
- 13.5.8 Netherlands
- 13.5.9 Belgium
- 13.5.10 Sweden
- 13.5.11 Denmark
- 13.5.12 Norway
- 13.5.13 Rest of Europe
- 13.6 Asia Pacific
- 13.6.1 China
- 13.6.2 India
- 13.6.3 Japan
- 13.6.4 South Korea
- 13.6.5 Thailand
- 13.6.6 Indonesia
- 13.6.7 Vietnam
- 13.6.8 Malaysia
- 13.6.9 Australia
- 13.6.10 Rest of Asia Pacific
- 13.7 Latin America
- 13.7.1 Brazil
- 13.7.2 Argentina
- 13.7.3 Colombia
- 13.7.4 Chile
- 13.7.5 Rest of Latin America
- 13.8 Middle East
- 13.8.1 Saudi Arabia
- 13.8.2 United Arab Emirates
- 13.8.3 Turkey
- 13.8.4 Israel
- 13.8.5 Iran
- 13.8.6 Rest of the Middle East
- 13.9 Africa
- 13.9.1 South Africa
- 13.9.2 Egypt
- 13.9.3 Nigeria
- 13.9.4 Morocco
- 13.9.5 Rest of Africa
- 13.10 Regional Investment, Policy and Supply Chain Differences
- 13.11 Regional Competitive Landscape
- 13.12 Geographic Growth Hotspots
Chapter 14 Global RLHF Data Services Technology, Innovation and Sustainability Outlook
- 14.1 Technology Landscape and Maturity
- 14.2 Product, Process and Service Innovation
- 14.3 AI, Automation and Digital Tools in the Industry
- 14.4 Technology Adoption and Performance Benchmarking
- 14.5 Innovation Pipeline and R&D Investment
- 14.6 Energy Efficiency and Resource Management
- 14.7 Sustainability, Recycling and Circularity
- 14.8 Technology Roadmap, 2025-2035
- 14.9 Risks of Obsolescence and Technology Substitution
Chapter 15 Global RLHF Data Services Market Key Strategic Imperatives
- 15.1 Growth and Market Entry Priorities
- 15.2 High-Return Products and Segments
- 15.3 Pricing, Profitability and Cost Optimization
- 15.4 Technology Investment and Product Differentiation
- 15.5 Supply Chain Localization and Resilience
- 15.6 Distribution and Customer Acquisition
- 15.7 Partnership, Acquisition and Capacity Strategy
- 15.8 Regional Expansion Priorities
- 15.9 Short-, Medium- and Long-Term Actions
Chapter 16 Competition Outlook
- 16.1 Industry Competition Characteristics
- 16.2 Market Structure and Concentration
- 16.3 Market Share and Competitive Positioning, 2025
- 16.4 Company-Wise Revenue and Product Benchmarking
- 16.5 Production and Service Capacity Benchmarking
- 16.6 Technology, Pricing and Differentiation
- 16.7 Regional Footprint and Distribution Strength
- 16.8 Mergers, Acquisitions and Strategic Alliances
- 16.9 New Entrants and Competitive Threats
- 16.10 Porter's Five Forces and Industry Attractiveness
- 16.11 Competitive Outlook, 2025-2035
Chapter 17 Company Profiles
- 17.1 Company Coverage and Selection Criteria
- 17.2 Surge AI
- 17.2.1 Business Description
- 17.2.2 Company Ownership and Geographic Presence
- 17.2.3 Product and Service Portfolio
- 17.2.4 Manufacturing and Operating Footprint
- 17.2.5 Financial Performance and Investment
- 17.2.6 Market Share and Competitive Position
- 17.2.7 Technology and Innovation Capabilities
- 17.2.8 Strategic Alliances or Partnerships
- 17.2.9 Recent Developments
- 17.2.10 Growth Strategy and Outlook
- 17.3 Scale AI
- 17.4 Mercor
- 17.5 Turing
- 17.6 Invisible Technologies
- 17.7 Handshake AI
- 17.8 Other Relevant Market Participants
Note: Every listed company is profiled on the structure shown under the first company. The company list is preliminary and may change based on research findings, market developments, data availability and client requirements.
Chapter 18 Disclaimer
- 18.1 Research and Forecast Disclaimer
- 18.2 Data Source and Estimation Limitations
Note: The depth of individual sections depends on data availability for this market. Volume, capacity, trade and other unit-based metrics are included where applicable.

