
Compliance anchors Indonesia digital software solutions
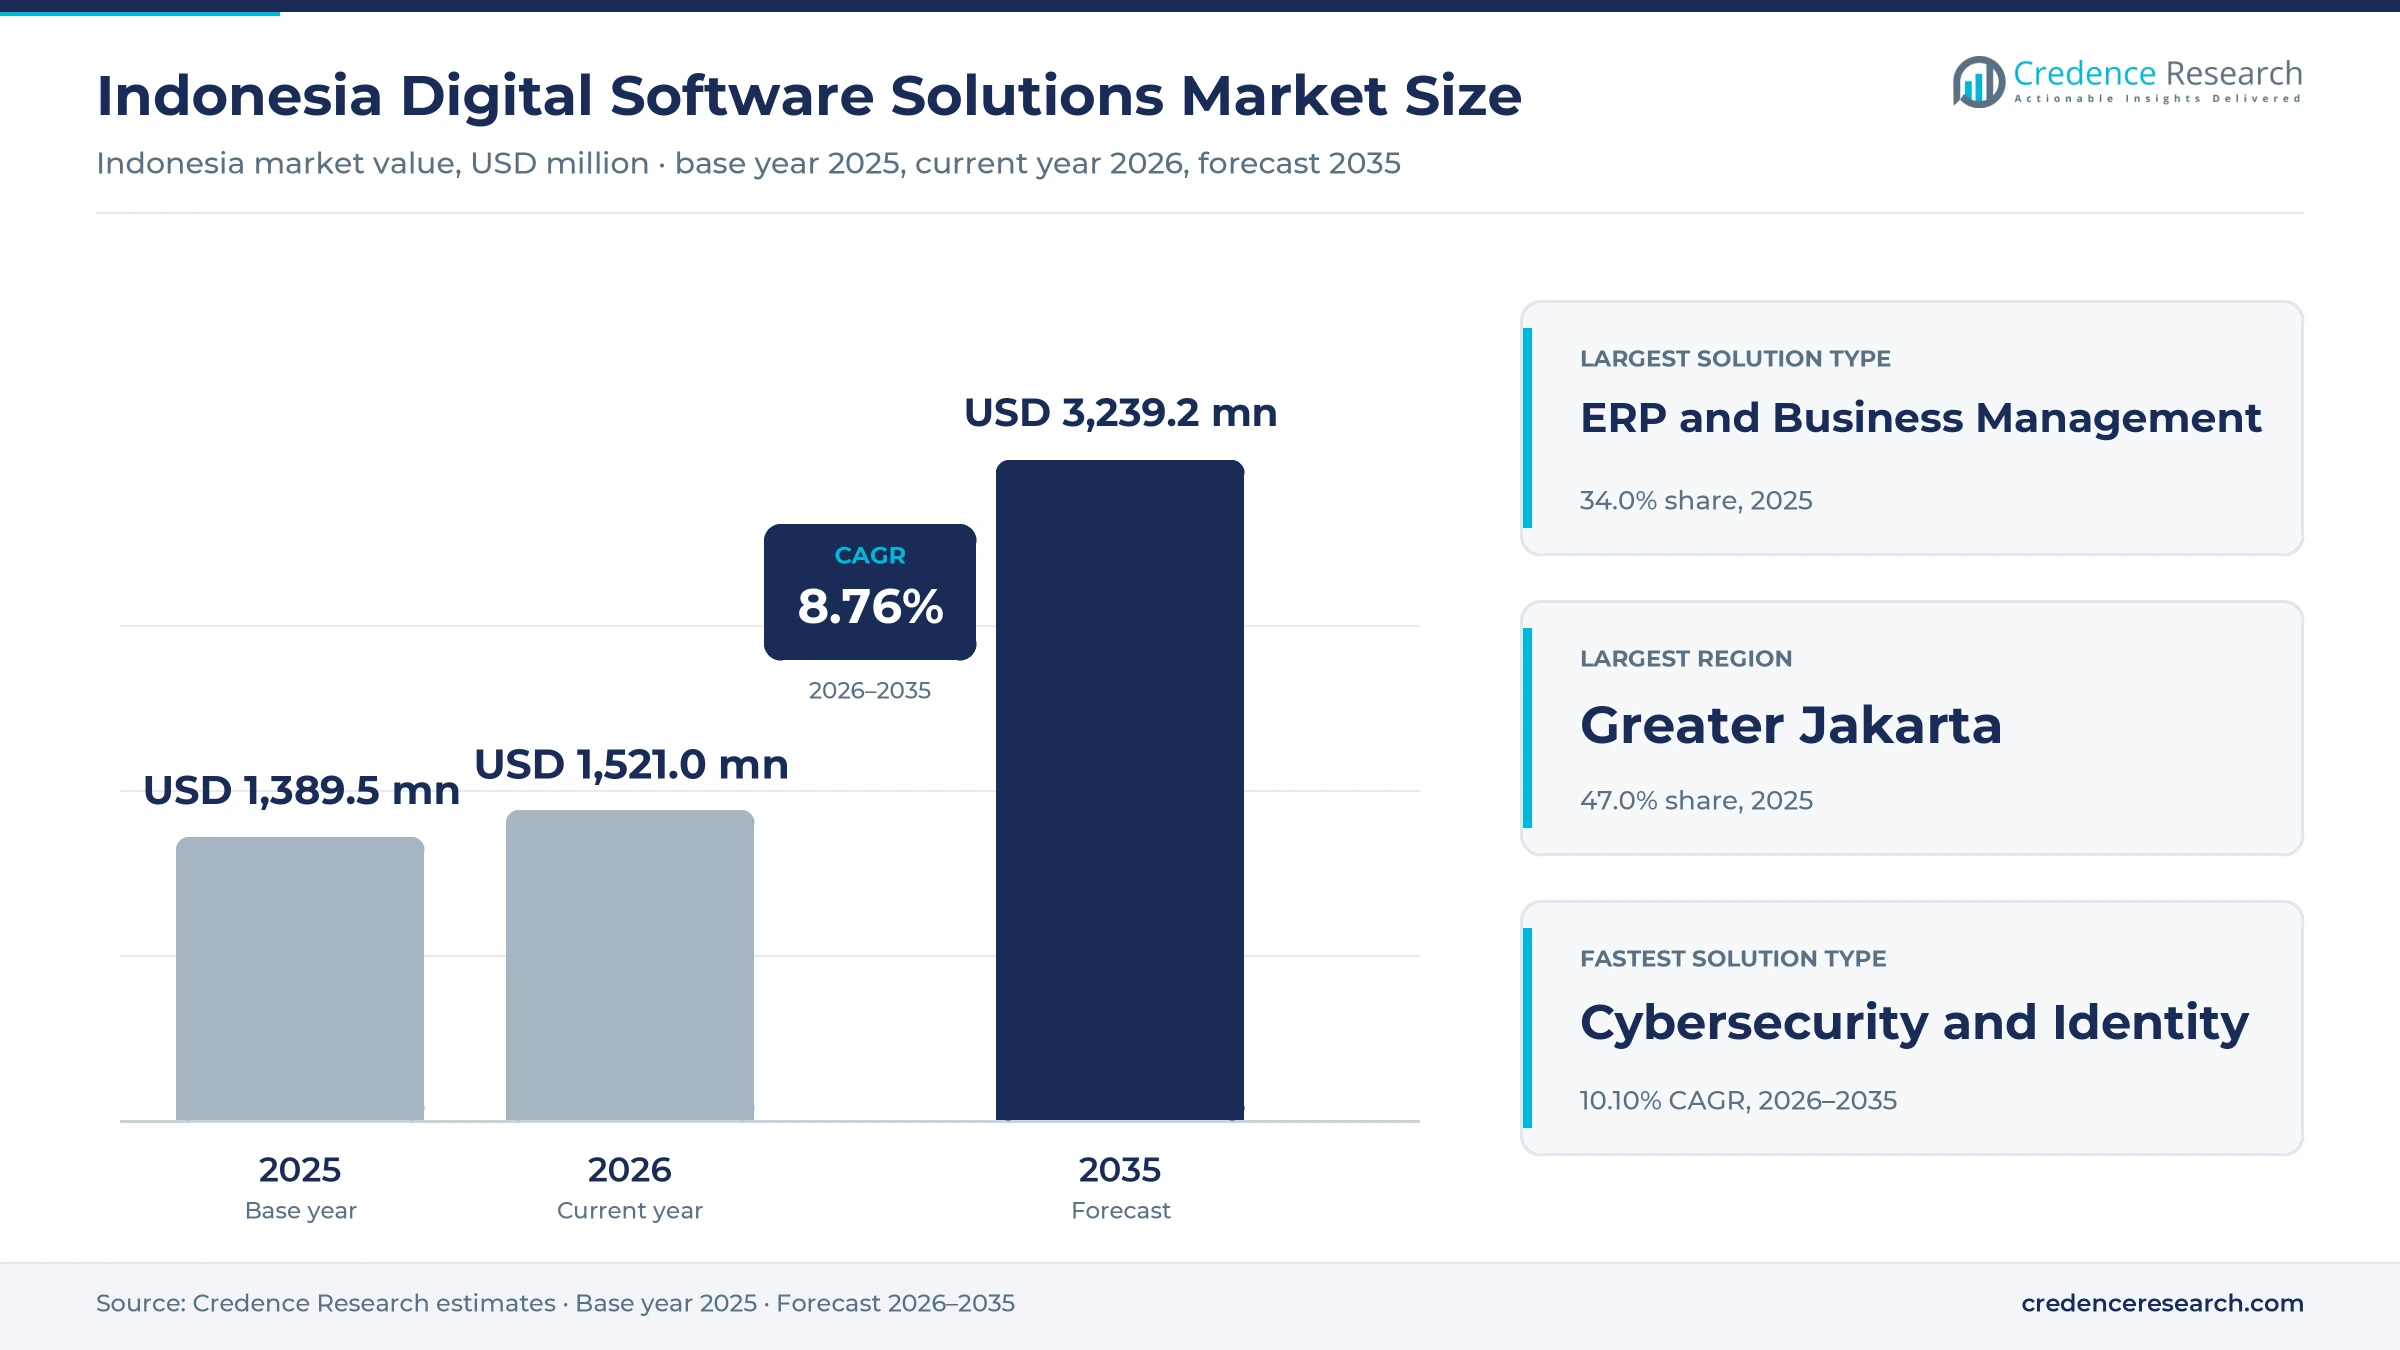
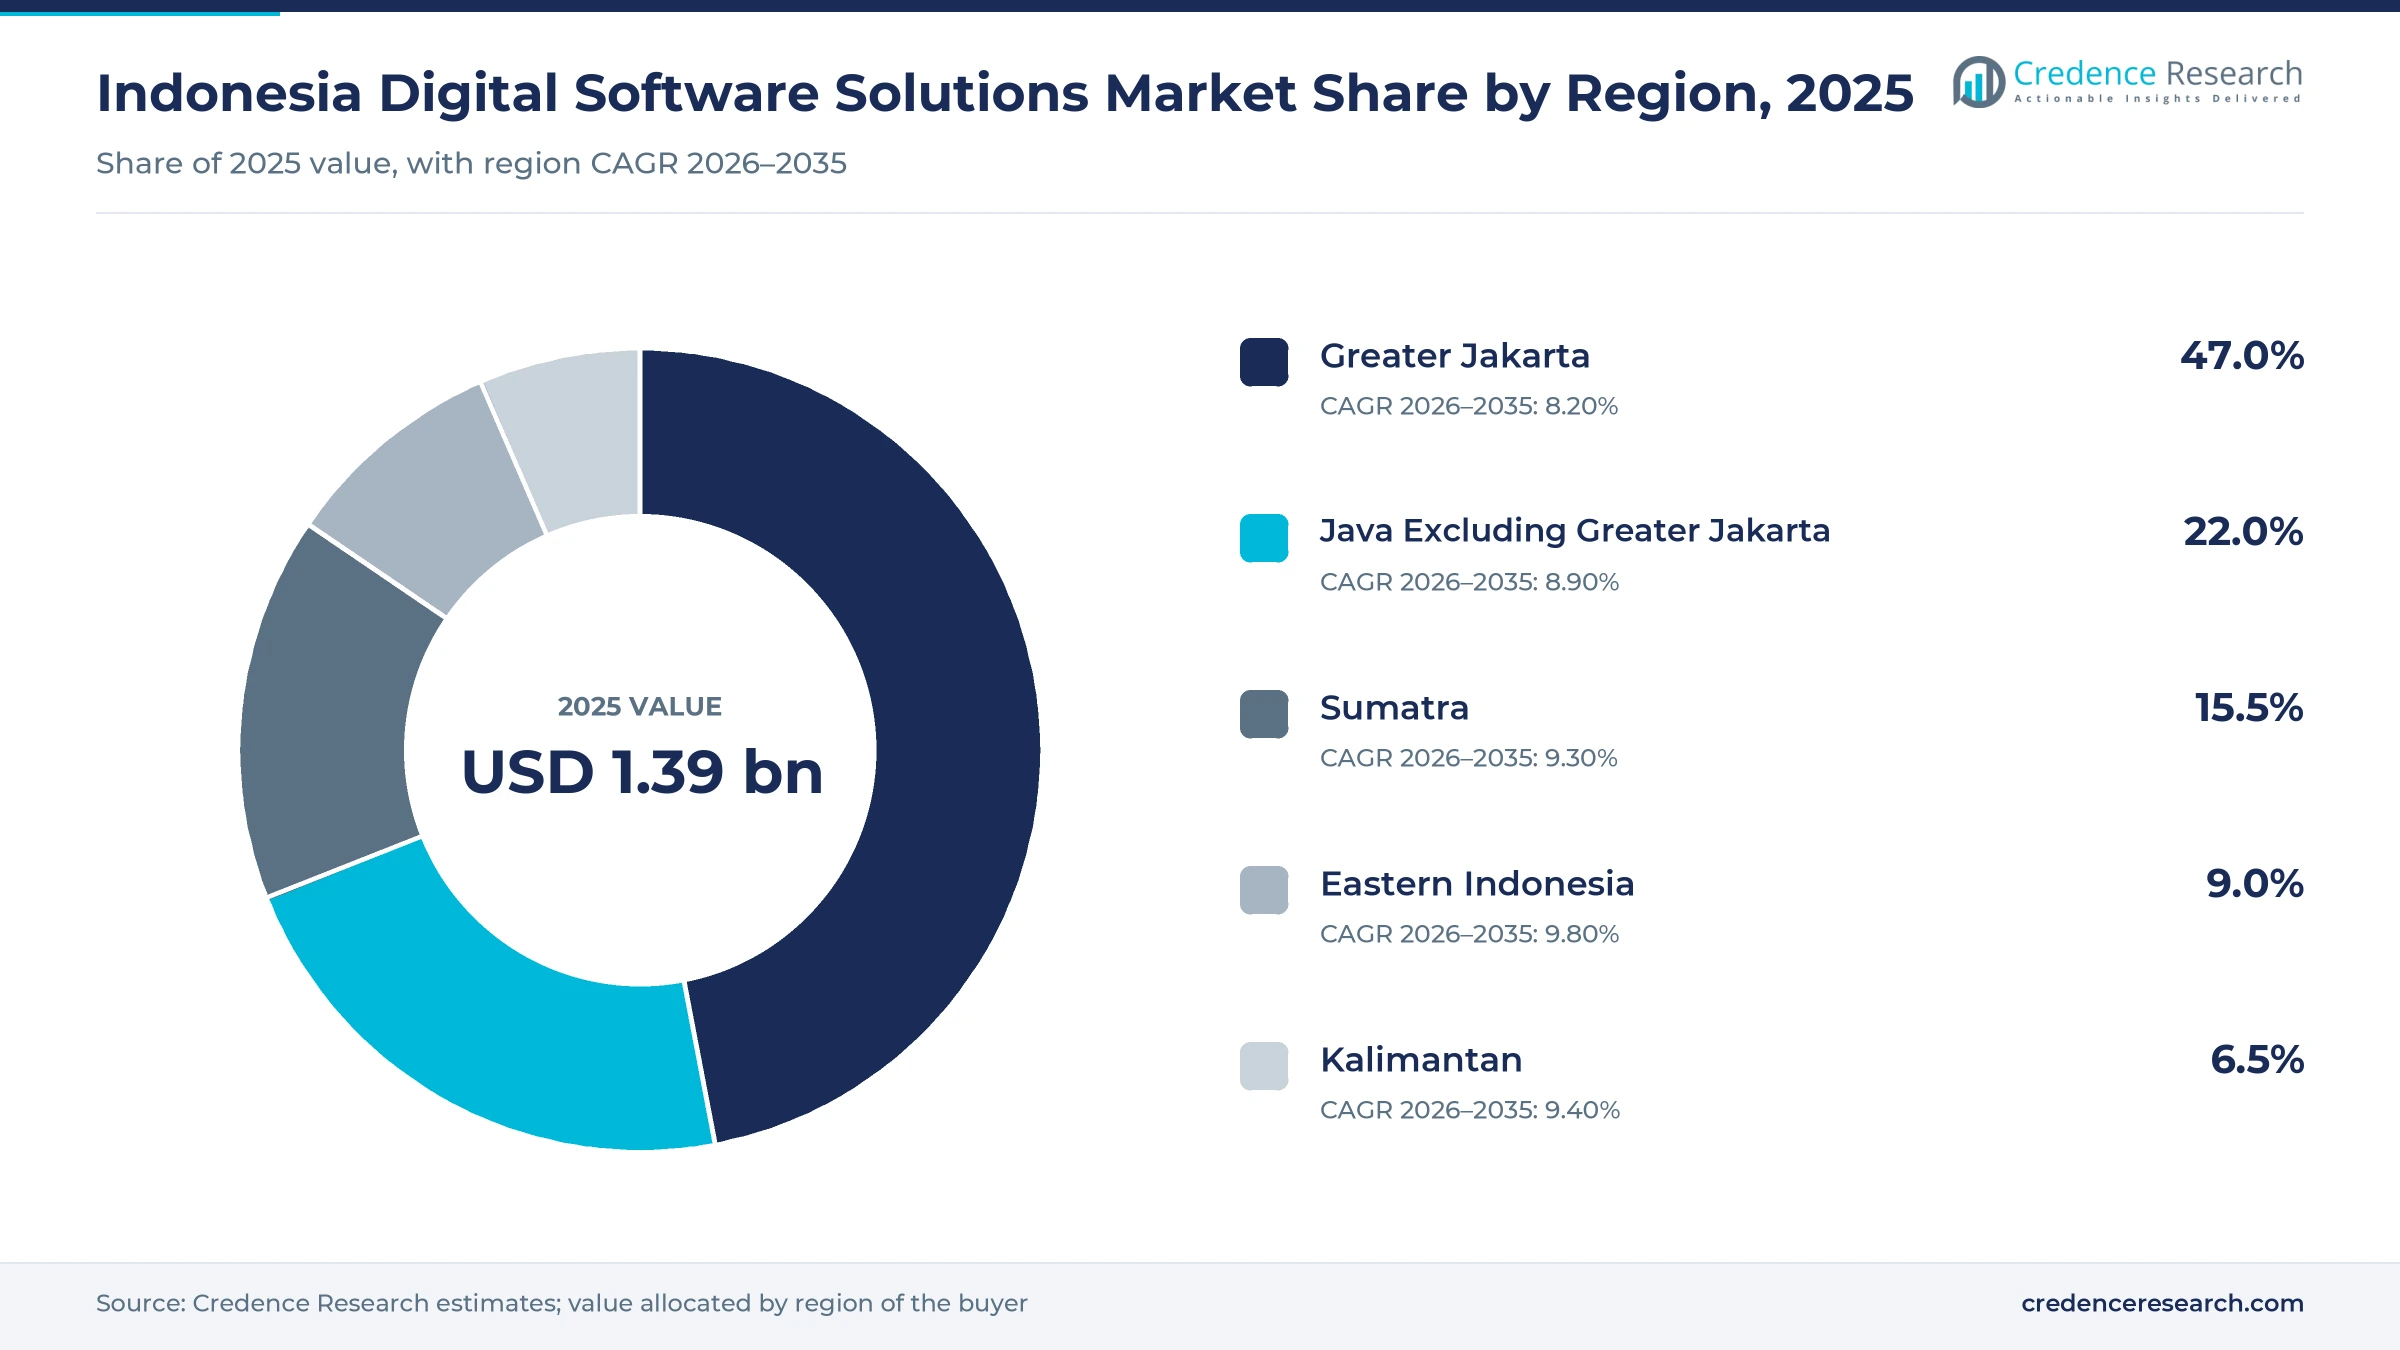
The Indonesia digital software solutions market was valued at USD 1.39 billion in 2025 and is projected to increase from USD 1.52 billion in 2026 to USD 3.24 billion by 2035, registering a CAGR of 8.76% during 2026–2035. Demand rests on tax clearance, state platform consolidation and in-country cloud capacity. Coretax made electronic invoice clearance mandatory from January 2025, which pushed VAT-registered companies to connect accounting and ERP systems to the tax authority. Greater Jakarta held the largest regional share, 47.0% in 2025, because head offices of banks, conglomerates and ministries sit there. Eastern Indonesia is the fastest-growing region at 9.80% a year as planned state data capacity and regional administrations widen the buyer base. Microsoft opened its first Indonesian cloud region in May 2025, and Salesforce added local data residency for more products two months later, so regulated buyers now have fewer reasons to keep software on premises.
What does Indonesian digital software spending include?
This market counts spending by Indonesian organizations on digital software solutions, namely ERP, CRM, HR, analytics and cybersecurity products. Buyers pay through subscriptions, per-user licenses, usage fees, perpetual licenses with maintenance and enterprise site agreements, and spending is recorded where the customer operates rather than where the vendor is based.
The scope excludes consumer applications, custom development projects, standalone system integration fees, data center leases and hardware. Payment platforms and marketplaces are also outside the count, although their merchants often become buyers of accounting and inventory products. Value passes from global and local publishers through resellers and implementers to the end customer.
Indonesia Digital Software Solutions Market Insights
- The market grows from USD 1.39 billion in 2025 to USD 3.24 billion by 2035, an 8.76% CAGR over 2026–2035 as clearance rules and local cloud capacity expand spending.
- Greater Jakarta accounted for 47.0% of 2025 value, reflecting the concentration of bank, conglomerate and ministry head offices in the capital region.
- Cloud-Native SaaS led deployment with 42.0% of 2025 value, supported by in-country cloud capacity opened or expanded by Microsoft, Google and Salesforce.
- Coretax electronic invoice clearance became mandatory in January 2025, with nearly all VAT-registered companies due to transition by Dec. 31, 2025, turning finance software into a compliance purchase.
- Global suites and local specialists compete on data residency, tax localization and Bahasa Indonesia support, while Telkom and IBM offer a sovereign AI platform announced in June 2025.
ERP, SaaS and banks hold the largest spending pools
Why does ERP lead while cybersecurity grows fastest?
Based on solution type, the market is categorized into ERP and Business Management Software, CRM and Customer Engagement Software, HR and Workforce Management Software, Data Analytics and Business Intelligence Software, and Cybersecurity and Identity Software. ERP and Business Management Software led with 34.0% of 2025 value because Coretax requires invoice clearance before issuance, so ledgers must connect to the tax system. Garuda Indonesia selected SAP Cloud ERP Private in the first quarter of 2026, according to SAP. Cybersecurity and Identity Software grows fastest at 10.10% a year, as the cyber agency BSSN counted about 5.2 billion traffic anomalies in 2025.
How far has subscription delivery displaced licensed software?
Based on deployment model, the market is categorized into Cloud-Native SaaS, Private Cloud Deployment, On-Premise Licensed Software, Hybrid Cloud Deployment and Managed Software Services. Cloud-Native SaaS led with 42.0% of 2025 value because local hosting removed a residency objection, and Salesforce widened its Hyperforce products in Indonesia in July 2025, according to TechEdt. Hybrid Cloud Deployment grows fastest at 10.17% a year as agencies separate data from applications, and a draft Komdigi plan targets 85% of government services on a state cloud by 2029, according to Bisnis.com.
Which industries set the pace for software budgets?
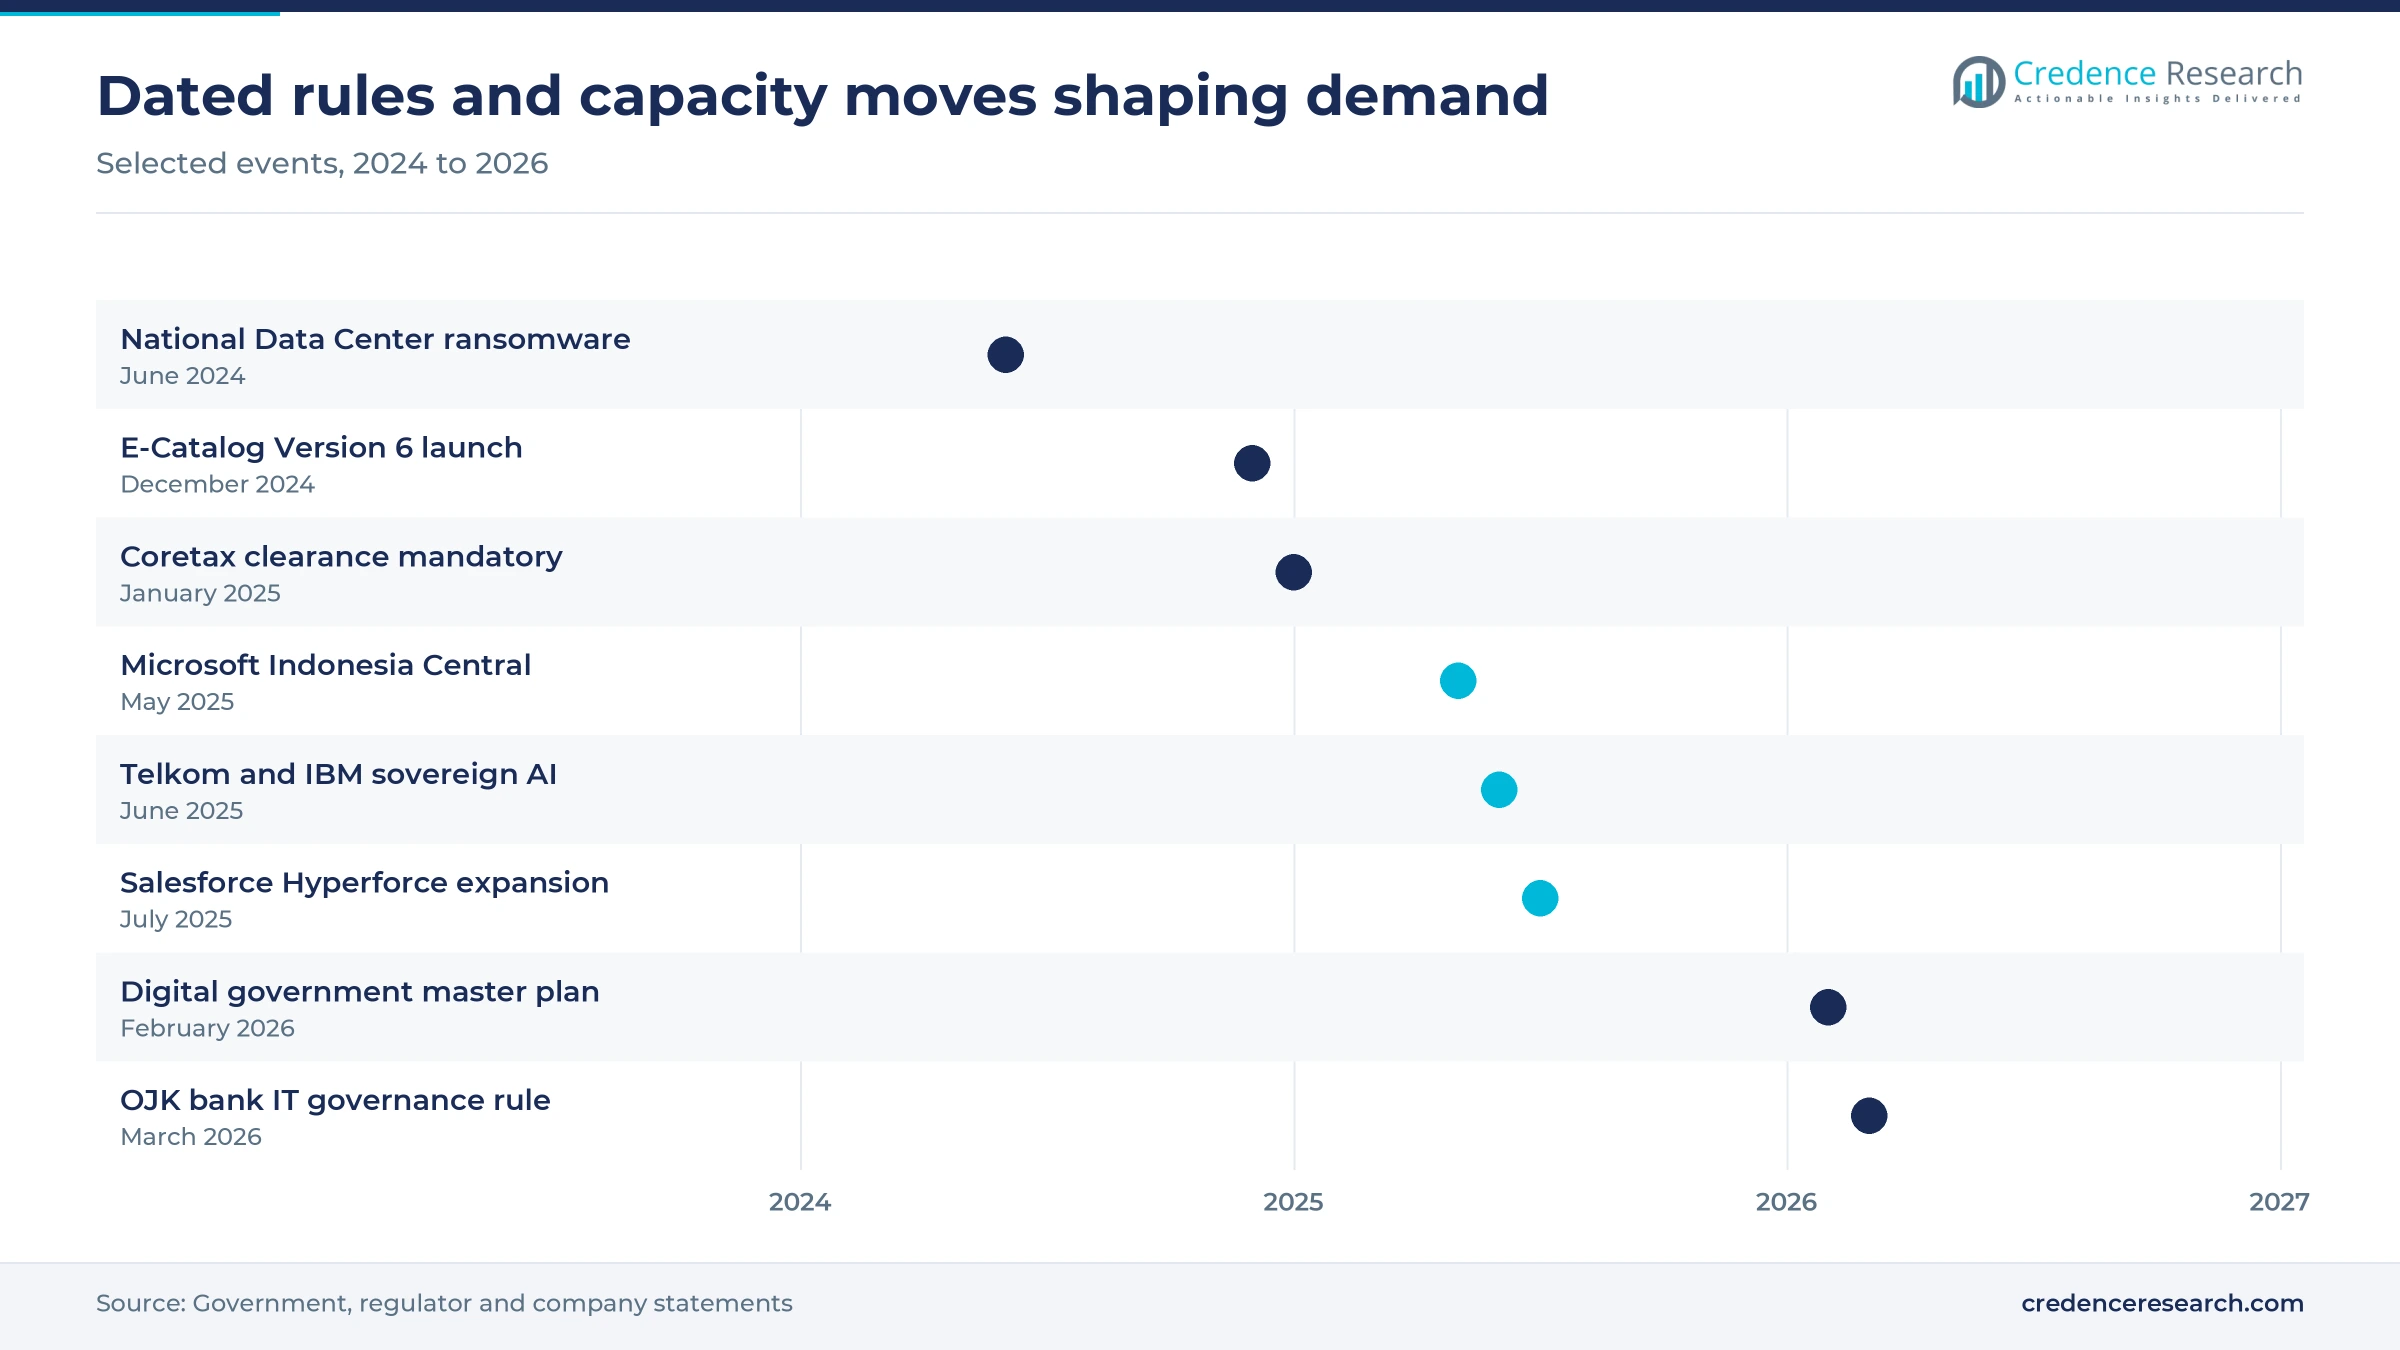
Based on end-use industry, the market is categorized into Banking and Financial Services, Retail and E-Commerce, Telecommunications and Media, Manufacturing and Distribution, and Government and Public Services. Banking and Financial Services led with 27.0% of 2025 value because OJK revised IT governance rules for commercial banks from March 1, 2026, covering providers, audit trails and cyber resilience. Retail and E-Commerce grows fastest at 9.84% a year as Google put 2025 e-commerce value at US$71 billion, with online sellers up 75% to 800,000, and those sellers need inventory and marketing tools.
Why are the smallest firms the fastest-growing buyers?
Based on enterprise size, the market is categorized into Micro and Small Businesses, Mid-Market Companies, Large Domestic Enterprises, Multinational Corporations and State-Owned Enterprises. Large Domestic Enterprises led with 33.0% of 2025 value because groups such as BCA, United Tractors and Adaro run multi-entity operations, and Microsoft named them among early Indonesia Central customers. Micro and Small Businesses grows fastest at 10.77% a year as digital payments reach small traders, with Bank Indonesia counting 44.86 million QRIS merchants by June 2026, of which 96.68% were MSMEs.
| Segment Group | Leading Sub-segment | Share, 2025 | Fastest-growing Sub-segment | CAGR, 2026–2035 |
|---|---|---|---|---|
| By Solution Type | ERP and Business Management Software | 34.0% | Cybersecurity and Identity Software | 10.10% |
| By Deployment Model | Cloud-Native SaaS | 42.0% | Hybrid Cloud Deployment | 10.17% |
| By End-Use Industry | Banking and Financial Services | 27.0% | Retail and E-Commerce | 9.84% |
| By Enterprise Size | Large Domestic Enterprises | 33.0% | Micro and Small Businesses | 10.77% |
Request a Free Sample
Fill in your details and we'll send you a free sample report.
- Sample data tables & charts
- Research methodology
Tax clearance, state platforms and local cloud lift spending
How does a broader digital base widen the customer pool?
A larger connected population turns more small firms into software buyers, because customers and suppliers already transact online. APJII counted 229.43 million internet users in 2025, equal to 80.66% penetration and up from 79.50% a year earlier. Google estimated 2025 digital economy value at close to US$100 billion, up 14% from 2024, while video commerce transactions rose 90% to 2.6 billion. Bank Indonesia reported 65.77 million QRIS users by June 2026, so even small traders now hold digital sales records. As a result, those records create a natural next purchase of bookkeeping, inventory and customer tools, which is why Micro and Small Businesses expand at 10.77% a year over 2026–2035.
What is public-sector digitization adding to demand?
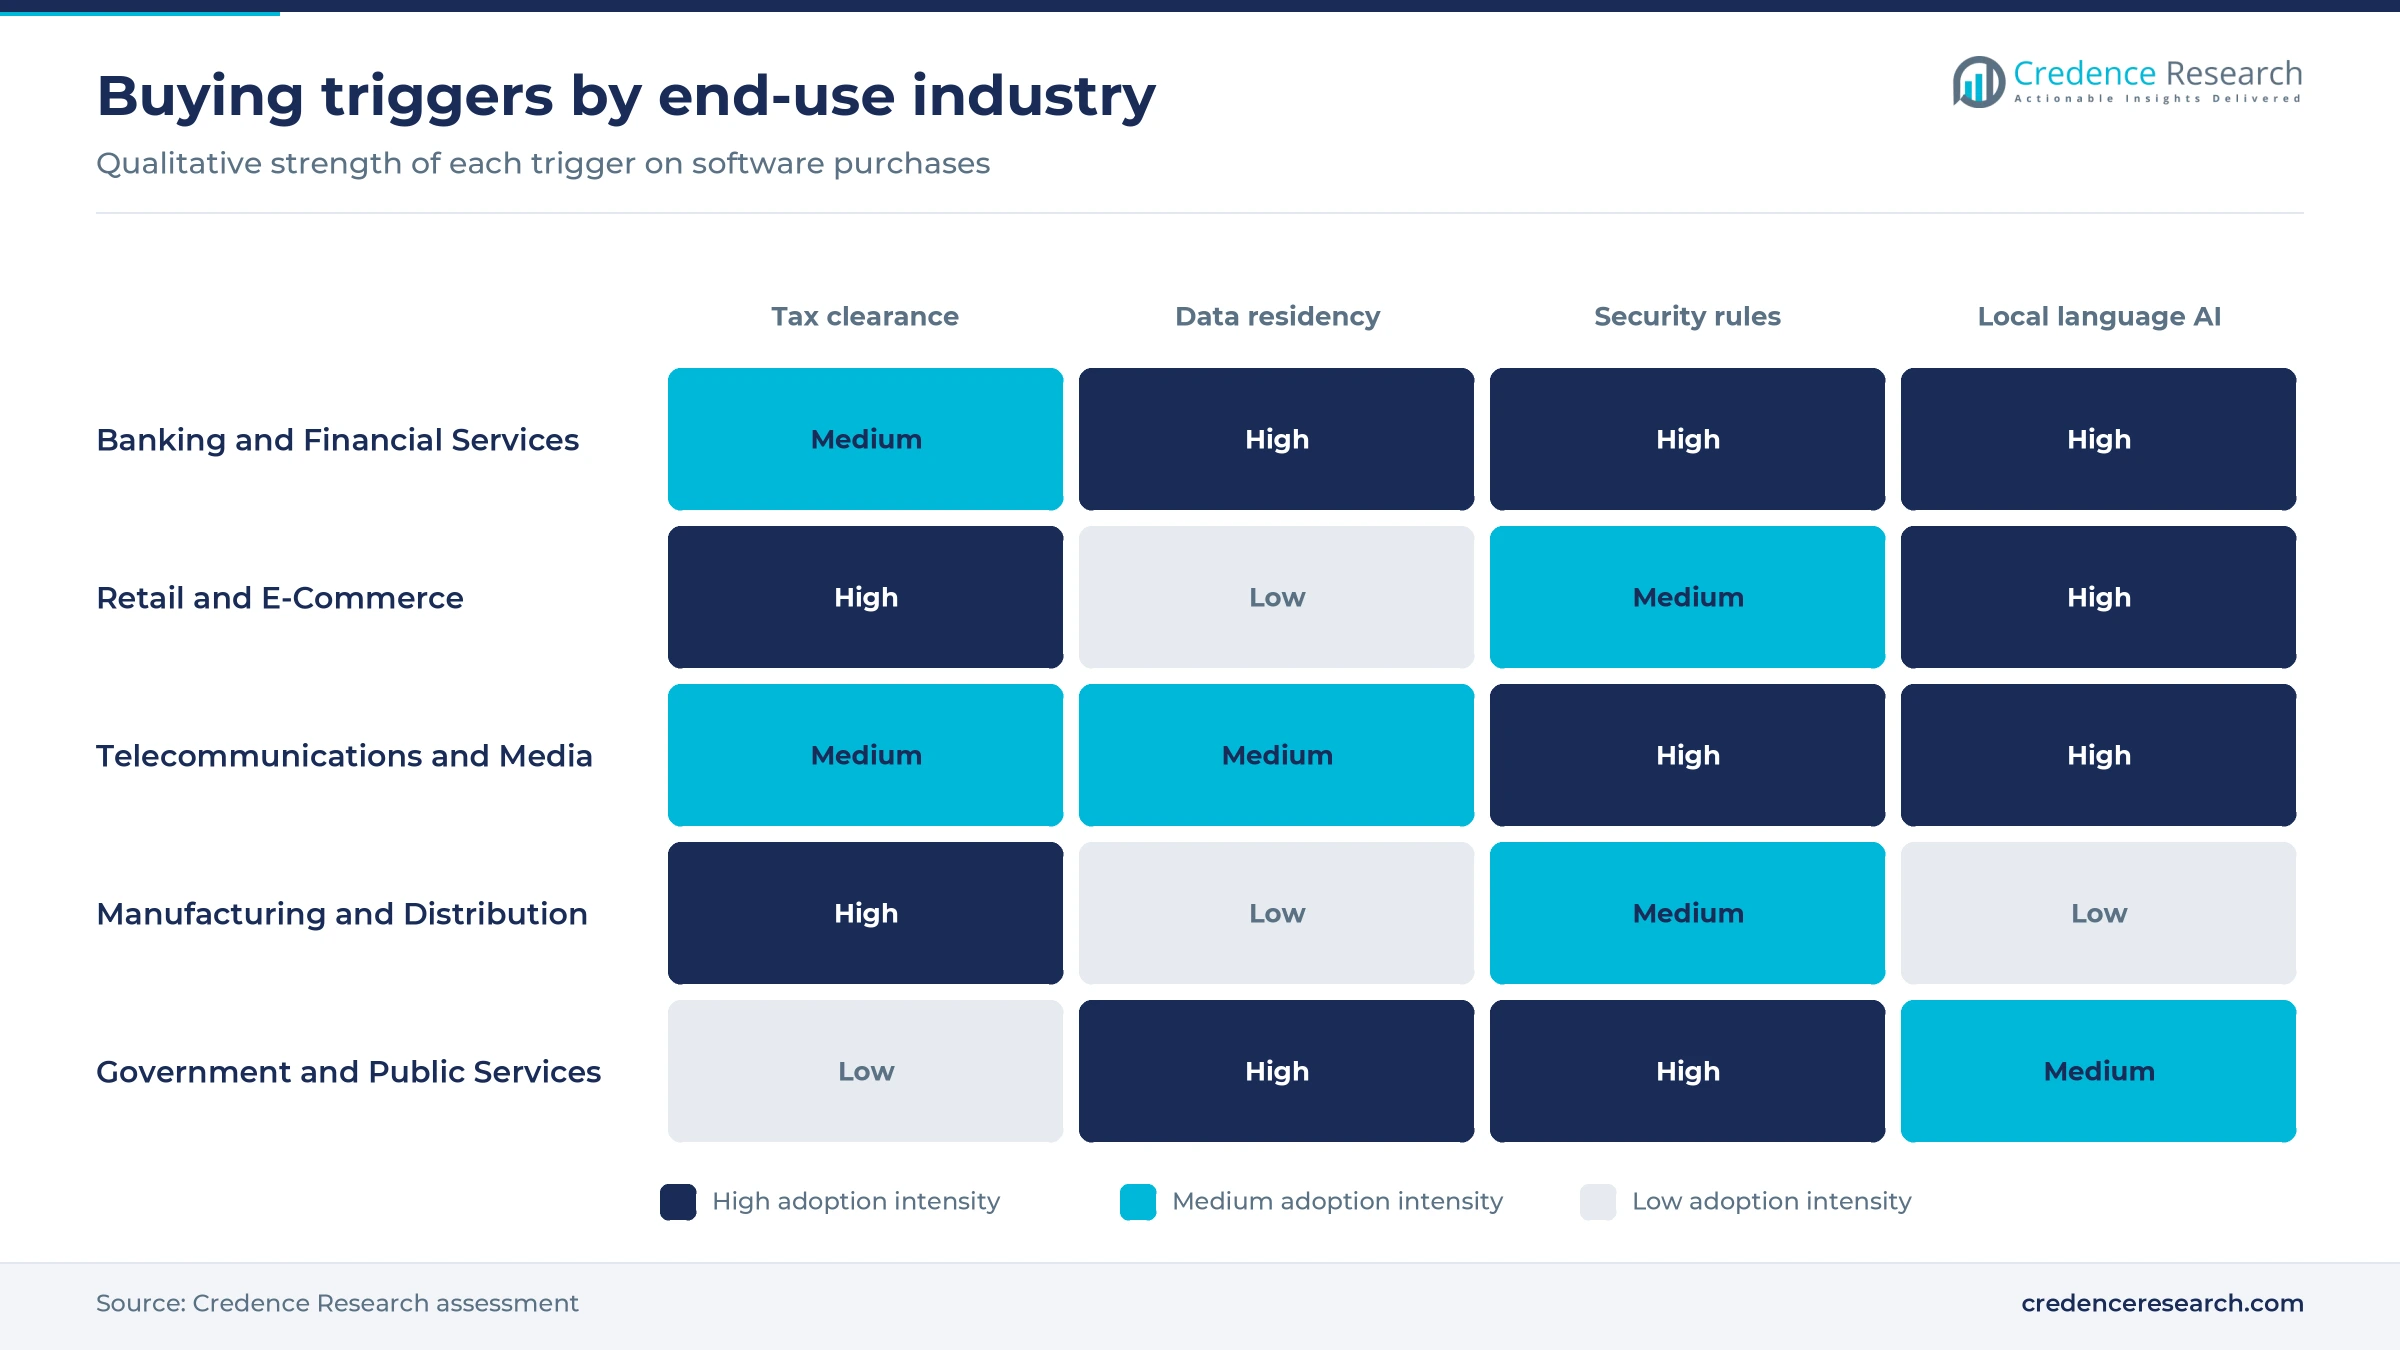
Government consolidation converts scattered application budgets into platform, security and data purchases. Deputy Minister Nezar Patria said in January 2026 that about 27,000 government applications run across ministries and agencies, according to VOI. The National Digital Government Master Plan 2025-2045, launched in February 2026, recommends SPBE clearance of agency IT spending and separates data layers from service applications. Komdigi Regulation No. 6 of 2025 then sets technical standards for SPBE applications, with interoperability as a foundation. Procurement also moved online, because LKPP required E-Catalog Version 6 from Jan. 1, 2025, according to detikFinance. These steps favor fewer, better-governed systems and they also lift demand for sovereign hosting and audit tools across public agencies.
How does in-country cloud capacity change what buyers can purchase?
Local capacity removes latency and residency objections that once kept regulated buyers on premises. Microsoft opened Indonesia Central on May 27, 2025 with three availability zones, a US$1.7 billion commitment for 2024 to 2028 and more than 100 organizations onboarded. Real Estate Asia put the Jakarta data center pipeline at 709 MW in the first half of 2025, nearly 30% larger than before, with vacancy down from 36% to 31%. Telkom’s NeutraDC said in June 2026 that all capacity at its first Batam facility was committed before launch. Related colocation capacity therefore supports hosted suites, and Cloud-Native SaaS held 42.0% of 2025 value.
Why has tax clearance become a software purchase trigger?
Coretax turned accounting software from an optional efficiency tool into a filing requirement for VAT-registered companies. The system became mandatory in January 2025, and Fiscal Requirements reported in December 2025 that nearly all such taxpayers were due to complete the move by Dec. 31, 2025. Invoices uploaded after the 20th of the following month lose VAT credit eligibility, so late data has a direct cash cost. Non-resident digital service providers that qualify also fall inside the regime. Vendors have responded with tax-ready modules in cloud ERP suites and mid-market accounting packages. In turn, finance automation became the first budget line for many firms, helping ERP and Business Management Software reach 34.0% of 2025 value.
Sovereign AI and local-language AI Agents reshape buying
Sovereign AI platforms are emerging as a distinct purchase
Buyers increasingly want AI features with data processed inside the country, which is shifting deals toward locally hosted platforms. Telkom and IBM announced a sovereign platform built on watsonx on June 4, 2025, after signing on May 21, 2025, with HR, legal and marketing services among the target uses. Minister Meutya Hafid named data sovereignty and avoidance of vendor lock-in as priorities at the February 2026 master plan launch, according to Bisnis.com. The World Bank’s December 2025 report had urged Indonesia to issue its personal data protection regulation. The regulation was signed in July 2026, and transfer tools still depend on an authority not yet established, according to DFDL, so residency questions stay open. This shift favors vendors with local hosting, and it raises the importance of Cloud-Native SaaS over 2026 to 2035.
The shift to Bahasa Indonesia agents is reaching service desks
Customer software is moving from recording cases to resolving them in the local language. Salesforce made Agentforce Service and Employee Agent available in Bahasa Indonesia on Dec. 3, 2025, and it cited its own research showing that 91% of Indonesian service professionals say customers expect more personal interaction. Lion Parcel reported a 73% reduction in case resolution times on Service Cloud in July 2024, with about 90% of its customer interactions running through WhatsApp, according to TechEdt. Google also found that revenue from AI applications in Indonesia rose 127% between the first half of 2024 and the first half of 2025. Consequently, customer relationship management systems are now judged on messaging integration more than on contact records.
Where is the opening in simplified finance tools for small firms?
Small firms that accept digital payments but keep informal books represent the largest unserved pool for vendors. Bank Indonesia reported that 96.68% of QRIS merchants were MSMEs in June 2026, yet Statistics Indonesia found that only 42.20% of employed people held formal jobs in August 2025. BRI said its LinkUMKM platform had been used by more than 12.9 million MSMEs, which shows that small firms will use free digital assessment tools. Zahir already sells API-based accounting products such as Zahir Simply, reaching 30 cities through partners by its own 2018 account. Vendors that combine QRIS data, tax-ready invoices and lender access could convert these users at low entry prices, particularly outside the main Java cities.
How large is the opening in logistics and supply chain software?
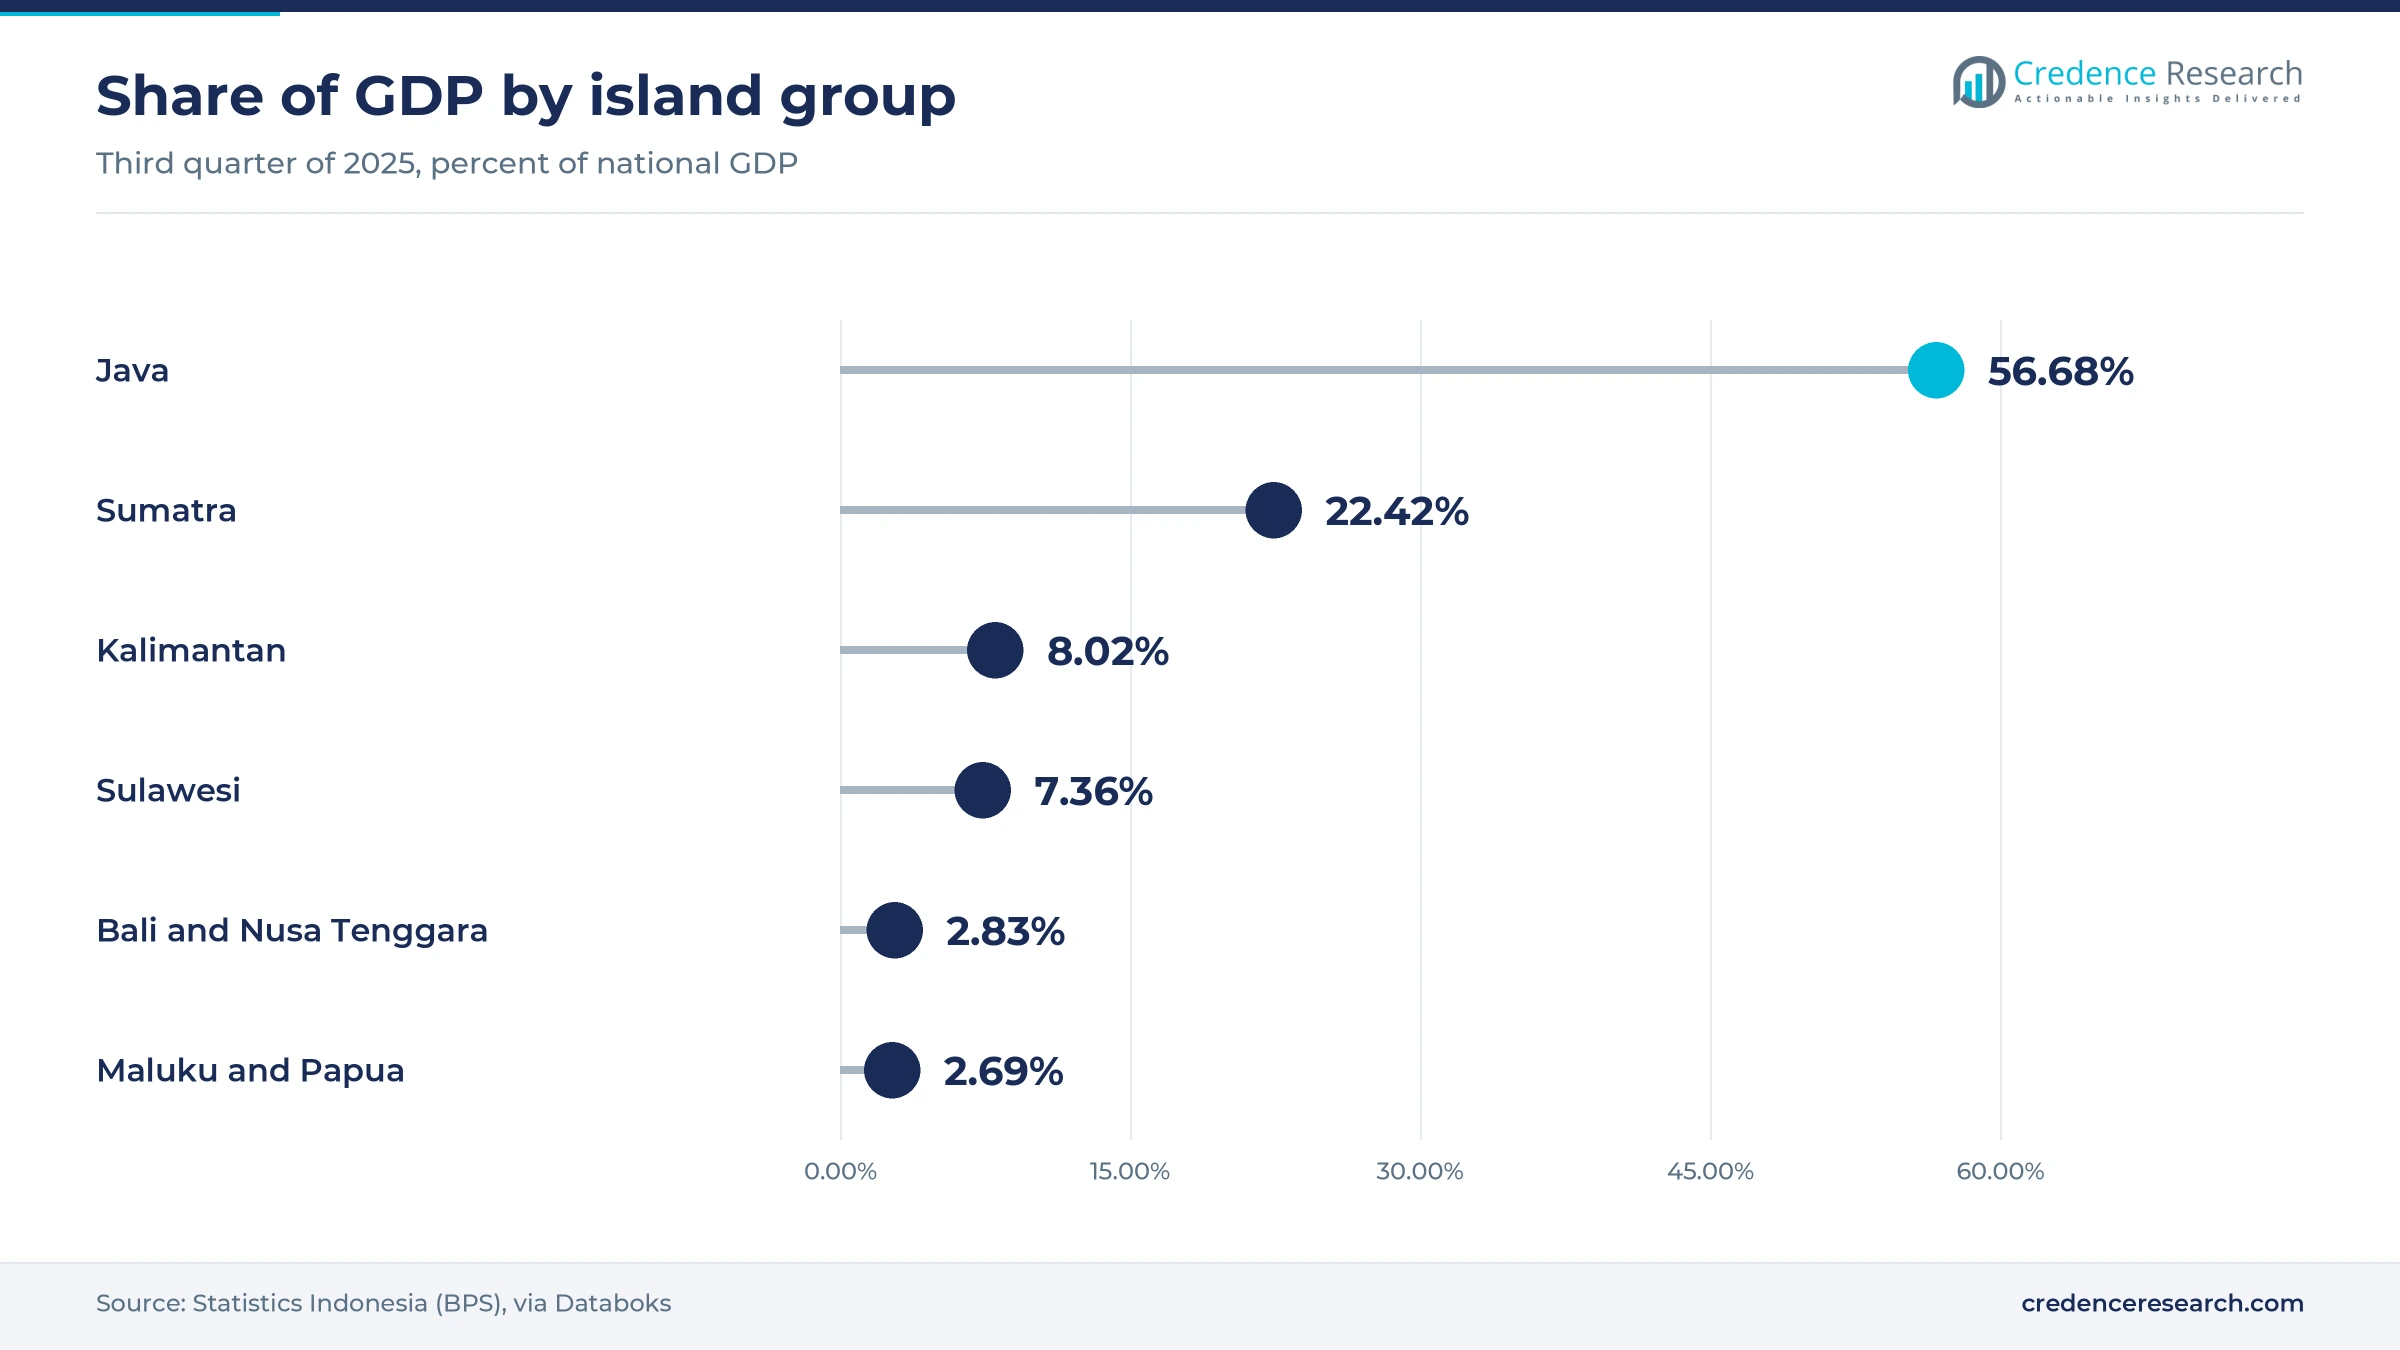
High logistics costs give distributors and manufacturers a measurable reason to buy planning and inventory tools. The Ministry of Transportation put logistics costs at 14.29% of GDP in April 2026, according to Radio Republik Indonesia, and it said multimodal transport could cut costs by up to 25%. The same briefing projected that the National Logistics Ecosystem could raise logistics efficiency by 24.6% to 49.5%. This matters across an archipelago where Statistics Indonesia recorded Maluku and Papua at 2.69% of third-quarter 2025 GDP, so routes remain thin and costly. Vendors that connect warehouse data with business intelligence tools and port systems can therefore sell against a visible cost line rather than a general productivity promise.
Currency, talent and security limit the pace of rollouts
How does a weak rupiah affect dollar-priced subscriptions?
Currency weakness raises renewal costs for software priced or sourced in dollars. The rupiah fell to a record low of Rp18,000 per dollar on June 4, 2026, and had lost more than 7% that year, according to The Jakarta Post. Mid-market buyers feel this most, because their budgets are set in rupiah and renewals arrive annually. As a result, some of these buyers delay upgrades or trim seats. Vendors can respond with rupiah price lists, longer fixed-rate terms and local hosting that reduces imported cost.
What does the talent shortfall do to rollouts?
A shortage of skilled staff slows implementation more than product availability does. Bisnis.com, citing the draft Komdigi strategic plan, reported 6 million digital workers in 2024 against a need for 12 million by 2030, with ICT professionals at 0.5% of the workforce. Deputy Minister Nezar Patria repeated the 12 million figure in August 2026, according to Infobank. Smaller regional buyers suffer first, because implementers cluster in Java. Training programs and packaged configurations can narrow the gap, although progress will take several years.
Why do security failures still weigh on cloud decisions?
Past incidents make public buyers cautious about concentrating systems in one place. Ransomware disrupted the temporary National Data Center from June 20, 2024, hitting immigration and school enrollment services, and attackers demanded US$8 million, according to Tempo. BSSN later said that 93.78% of the anomalies it found in 2025 were linked to malware that could develop into ransomware, according to Infobank. Agencies now face longer audits and backup requirements, which lengthen sales cycles. However, these same requirements also create budget for backup and identity products.
How does unfinished data law slow cross-border SaaS?
Legal uncertainty makes compliance teams slower to approve offshore processing. The Personal Data Protection Law’s transition ended on Oct. 17, 2024, with fines of up to 2% of annual revenue. Government Regulation No. 33 of 2026 takes effect on Jan. 16, 2027, but its adequacy and contractual transfer routes remain unusable until a supervisory authority is established, according to law firm DFDL. OJK also requires that offshore IT providers must not impede its supervision under its rule effective March 1, 2026. Foreign SaaS sellers therefore need local counsel and contract changes.
Greater Jakarta leads as spending moves beyond Java
| Region | Value, 2025 (USD billion) | Share, 2025 | CAGR, 2026–2035 |
|---|---|---|---|
| Greater Jakarta | 0.65 | 47.0% | 8.20% |
| Java Excluding Greater Jakarta | 0.31 | 22.0% | 8.90% |
| Sumatra | 0.22 | 15.5% | 9.30% |
| Eastern Indonesia | 0.13 | 9.0% | 9.80% |
| Kalimantan | 0.09 | 6.5% | 9.40% |
Greater Jakarta keeps the head-office budgets
Greater Jakarta held 47.0% of 2025 value and grows at 8.20% a year, the slowest pace of the five regions. Banks, conglomerates and ministries buy centrally here, and Cikarang alone accounts for about 47% of Jakarta’s operational data center capacity and 61% of its pipeline, according to Real Estate Asia. Because contracts signed in the capital often cover branches elsewhere, this share overstates local use. Multi-entity ERP, security and analytics contracts dominate purchases, and implementers keep their largest teams in the region.
Java Excluding Greater Jakarta adds factories and universities
Java Excluding Greater Jakarta held 22.0% of 2025 value and grows at 8.90% a year. Java as a whole produced 56.93% of 2025 GDP and hosted 58% of internet users, according to Statistics Indonesia and APJII, so this zone has a deep base of manufacturers and distributors. Gamatechno, based in Yogyakarta, cites more than 500 B2B clients and lists Magelang among its smart city work. Mid-market ERP and public-sector administration systems therefore lead local demand across the zone.
Sumatra gains from Batam capacity and resource groups
Sumatra held 15.5% of 2025 value and grows at 9.30% a year, helped by commodity processors and Batam’s data center cluster. The island generated 22.22% of 2025 GDP and 20.5% of internet users, according to Statistics Indonesia and APJII, yet its software share trails both because many large groups buy through Jakarta offices. Telkom’s NeutraDC is building a 100 MW Batam campus, and Oracle has planned an Indonesia North cloud region at Nongsa Digital Park, which brings local hosting closer to these buyers.
Kalimantan buying follows mining and contractor fleets
Kalimantan held 6.5% of 2025 value and grows at 9.40% a year. The island produced 8.02% of third-quarter 2025 GDP, according to Statistics Indonesia, and its mining and contractor groups need fleet, maintenance and safety software. Microsoft lists Adaro, Pamapersada Nusantara and KPP Mining among its Indonesia Central customers, although these groups usually contract centrally. Local spending therefore shows up mainly as field applications and managed services rather than as separately licensed enterprise suites.
Eastern Indonesia starts small and grows fastest
Eastern Indonesia, which here covers Sulawesi, Bali and Nusa Tenggara, and Maluku and Papua, held 9.0% of 2025 value and grows at 9.80% a year. Sulawesi recorded the highest island growth in 2025 at 6.23%, while Maluku and Papua recorded the lowest at 1.44%, according to Statistics Indonesia. A draft Komdigi plan adds a third state data center in the east during 2026 to 2027, which could support regional administrations. However, the World Bank notes that rural connectivity quality remains uneven.
Dated moves by vendors, regulators and large buyers
| Development | Status and market relevance |
|---|---|
| In May 2025, Microsoft opened Indonesia Central, its first cloud region in the country, with three availability zones. | Live; more than 100 organizations onboarded at launch |
| In June 2025, Telkom Indonesia and IBM announced a sovereign AI platform built on watsonx, with data processed and stored in Indonesia. | Agreement signed; commercial rollout through Telkom |
| In July 2025, Salesforce expanded Hyperforce services in Indonesia to include Data Cloud, Agentforce, Tableau Next and Marketing Cloud Next. | Available; aimed at regulated sectors |
| In February 2026, the National Digital Government Master Plan 2025-2045 was launched by the government, with SPBE clearance of agency IT spending among its steps. | In effect as a long-term guide for agencies |
| In April 2026, SAP announced that Garuda Indonesia selected SAP Cloud ERP Private and SAP Business Data Cloud in the first quarter. | Customer selection disclosed; deployment details not stated |
Clearance, data layers and AI Agents set product direction
- Coretax connectors generate invoice data for clearance, then store the returned QR code and serial number inside the finance system.
- Separated data layers keep agency records apart from service applications, which follows the master plan step meant to prevent lock-in.
- Local-language agents handle service and employee requests in Bahasa Indonesia, and they increasingly work through WhatsApp rather than web portals.
- In-country AI platforms process prompts and documents on Indonesian infrastructure, which suits banks, hospitals and state-owned groups with residency concerns.
Need a Custom Version of This Report?
Tailor the scope, geography, or segments to your exact requirements.
- Custom geography or segment scope
- Direct access to our analyst team
Global suites meet local accounting specialists
Competition in digital software solutions splits between global suites and local specialists, and the dividing line is increasingly hosting and localization rather than features. Microsoft, Google and Oracle pair applications with in-country or planned infrastructure, while SAP and Salesforce compete for finance and customer systems at large groups, as the Garuda Indonesia selection and the Hyperforce expansion show. Telkom holds a distinctive position because it operates data centers, helped build E-Catalog Version 6 with LKPP and resells sovereign AI services with IBM. Gamatechno and Zahir compete lower in the market, where tax handling, Indonesian-language support and partner reach decide most purchases. Zahir’s partner network and Gamatechno’s public-sector modules are difficult for global vendors to replicate at small contract sizes. Price pressure is strongest in mid-market accounting, where local packages sell against imported suites.
Companies profiled and their roles in this market
| Company | Type | Role in the market |
|---|---|---|
| Microsoft Corporation | Global platform and applications | Runs Indonesia Central, opened in May 2025 with a US$1.7 billion commitment |
| SAP SE | Global ERP publisher | Selected by Garuda Indonesia for SAP Cloud ERP Private in the first quarter of 2026 |
| Salesforce Inc. | Global CRM publisher | Offers Hyperforce locally and launched Agentforce in Bahasa Indonesia in December 2025 |
| Oracle Corporation | Global database and applications | Plans an Indonesia North cloud region at Nongsa Digital Park in Batam |
| IBM Corporation | Global AI and software | Supplies watsonx for the sovereign platform announced with Telkom in June 2025 |
| Google LLC | Global cloud and productivity | Has run a Jakarta cloud region since 2020 and expanded its computing capacity there |
| PT Telkom Indonesia | State-controlled operator | Operates NeutraDC, partners on E-Catalog Version 6 and markets sovereign AI services |
| PT Gamatechno Indonesia | Local software house | Yogyakarta-based ERP modules, more than 500 B2B clients and smart city work |
| PT Zahir Internasional | Local accounting publisher | API-based accounting products for small and mid-sized firms, sold through partners |
Compliance spending comes first, then AI workloads
Credence Research’s view is that compliance will fund the first wave of digital software solutions spending and AI the second. Coretax, SPBE clearance and bank IT rules give buyers a reason to spend regardless of the economic cycle, which matters while the rupiah is weak and the World Bank expects growth of about 5% rather than a sharp acceleration. The largest risk is that foreign suppliers capture most of the value, since a draft Komdigi plan projects a 74% foreign share of the digital market by 2030. Local vendors should therefore compete on tax handling, partner reach and low entry prices.
How the estimates and regional splits were built
The report uses 2025 as the base year and 2035 as the end of the forecast, with 2026 to 2035 as the growth period. Market values for all years come from the Credence Research model. Segment and regional splits are Credence Research estimates, informed by Statistics Indonesia GDP by island, APJII internet user shares, vendor announcements and regulatory filings opened during the research. Dated facts come from government statements, company releases, law firm notes and named news publishers. No interviews or surveys were conducted for this edition, so the splits should be read as analytical estimates rather than measured vendor revenue.
Spending more than doubles as mandates reach smaller firms
Spending on digital software solutions reaches USD 3.24 billion by 2035 from USD 1.52 billion in 2026, and the mix should move toward subscriptions and security during that period. On-premise licenses are likely to lose share as agencies adopt the state cloud and local regions mature. Komdigi’s draft plan for three active national data centers by 2029 would help regional agencies buy shared platforms rather than build their own. Smaller firms should provide the largest number of new accounts, although their average contract values will stay low. Vendors with rupiah pricing, tax connectors and strong partner networks appear best placed through the forecast period.
Frequently Asked Questions
How big is the Indonesia digital software solutions market?
Which solution type leads the market?
Which region holds the largest share?
Which deployment model is most common?
What is driving spending most directly?
What are the main challenges for vendors and buyers?
Which companies compete in this market?
Where are the best opportunities for vendors?
Table of Content
Chapter 1 Market Segmentation
- 1.1 Segmentation Framework
- 1.1.1 Product and Service Classification
- 1.1.2 Application and End-Use Classification
- 1.1.3 Technology and Solution Classification
- 1.1.4 Customer and Distribution Channel Classification
- 1.1.5 Geographic Segmentation
- 1.1.6 Market Segment Definitions and Boundaries
- 1.2 By Solution Type
- 1.2.1 ERP and Business Management Software
- 1.2.2 CRM and Customer Engagement Software
- 1.2.3 HR and Workforce Management Software
- 1.2.4 Data Analytics and Business Intelligence Software
- 1.2.5 Cybersecurity and Identity Software
- 1.3 By Deployment Model
- 1.3.1 Cloud-Native SaaS
- 1.3.2 Private Cloud Deployment
- 1.3.3 On-Premise Licensed Software
- 1.3.4 Hybrid Cloud Deployment
- 1.3.5 Managed Software Services
- 1.4 By End-Use Industry
- 1.4.1 Banking and Financial Services
- 1.4.2 Retail and E-Commerce
- 1.4.3 Telecommunications and Media
- 1.4.4 Manufacturing and Distribution
- 1.4.5 Government and Public Services
- 1.5 By Enterprise Size
- 1.5.1 Micro and Small Businesses
- 1.5.2 Mid-Market Companies
- 1.5.3 Large Domestic Enterprises
- 1.5.4 Multinational Corporations
- 1.5.5 State-Owned Enterprises
Chapter 2 Introduction
- 2.1 Report Objectives and Scope
- 2.2 Product Definition and Industry Terminology
- 2.3 Market Inclusions and Exclusions
- 2.4 Research Process
- 2.4.1 Primary Research and Expert Interviews
- 2.4.2 Secondary Research and Source Review
- 2.4.3 Top-Down and Bottom-Up Estimation
- 2.4.4 Data Triangulation and Verification
- 2.5 Market Size Measurement Basis
- 2.5.1 2025: USD 1.39 billion → 2035: USD 3.24 billion
- 2.6 Historical and Forecast Reference Periods
- 2.6.1 Historical Period: 2018-2025
- 2.6.2 Base Year: 2025
- 2.6.3 Forecast Period: 2025-2035
- 2.7 Research Assumptions and Limitations
Chapter 3 Executive Summary
- 3.1 Market Snapshot and Key Findings
- 3.2 Base-Year Market Size, 2025
- 3.3 Forecast Market Size, 2035
- 3.4 Revenue and Volume Growth Outlook
- 3.5 Key Demand and Supply Indicators
- 3.6 Leading Market Segments
- 3.7 Fastest-Growing Market Opportunities
- 3.8 Regional Performance Highlights
- 3.9 Technology and Industry Transformation
- 3.10 Competitive Landscape Summary
- 3.11 Analyst View and Strategic Implications
Chapter 4 Indonesia Digital Software Solutions Market Trends and Developments
- 4.1 Historical Industry Development, 2018-2025
- 4.2 Recent Market Trends and Developments
- 4.3 Demand and Customer Behavior Trends
- 4.4 Technology and Product Innovation
- 4.5 Artificial Intelligence, Automation and Digitalization
- 4.6 Local Manufacturing and Supply Chain Realignment
- 4.7 Industry Partnerships, Mergers and Acquisitions
- 4.8 Sustainability and Circular Economy Developments
- 4.9 Government and Private Sector Investment Trends
- 4.10 Emerging Business Models and Commercialization
- 4.11 Industry Developments and Announcements
Chapter 5 Indonesia Digital Software Solutions Market Supply and Demand Analysis
- 5.1 Demand Trend and Consumption Analysis, 2018-2025
- 5.2 Demand Forecast, 2025-2035
- 5.3 Supply Chain Structure and Procurement Trends
- 5.4 Supply-Demand Gap and Bottlenecks
- 5.5 Import Dependence and Sourcing Structure
- 5.6 Regional Supply and Demand Concentration
Chapter 6 Indonesia Digital Software Solutions Market Pricing Analysis
- 6.1 Pricing Structure and Measurement
- 6.2 Historical Pricing Trends, 2018-2025
- 6.3 Pricing Outlook, 2025-2035
- 6.4 Pricing by Product and Market Segment
- 6.5 Geographic Pricing Differences
- 6.6 Key Input, Energy, Labor and Logistics Costs
- 6.7 Contract Pricing and Purchasing Models
- 6.8 Pricing Sensitivity and Competitive Positioning
- 6.9 Price, Margin and Profitability Implications
Chapter 7 Indonesia Digital Software Solutions Market Dynamics
- 7.1 Market Growth Drivers
- 7.1.1 Demand-Side Drivers
- 7.1.2 Technology and Innovation Drivers
- 7.1.3 Infrastructure and Investment Drivers
- 7.1.4 Regulatory and Policy Drivers
- 7.2 Market Restraints
- 7.2.1 Cost and Affordability Constraints
- 7.2.2 Technology and Adoption Barriers
- 7.2.3 Supply Chain and Operational Constraints
- 7.3 Market Challenges
- 7.3.1 Competitive Pressure and Margin Erosion
- 7.3.2 Skills, Infrastructure and Implementation Gaps
- 7.4 Emerging Market Opportunities
- 7.5 Market Dynamics Impact and Time-Horizon Assessment
Chapter 8 Indonesia Digital Software Solutions Value Chain Analysis
- 8.1 Industry Value Chain Overview
- 8.2 Upstream Suppliers and Critical Inputs
- 8.3 Technology and Component Providers
- 8.4 Manufacturing or Service Delivery
- 8.5 Distribution, Channel Partners and Integrators
- 8.6 Downstream Applications and End Users
- 8.7 Value Addition and Profit Pools
- 8.8 Vertical Integration and Outsourcing
- 8.9 Supplier Concentration and Risk
- 8.10 Supply Chain Localization and Resilience
Chapter 9 Indonesia Digital Software Solutions Market Regulations and Policies
- 9.1 Relevant Laws, Standards and Compliance Frameworks
- 9.2 Product, Service, Safety and Quality Requirements
- 9.3 Government Policies, Incentives and Subsidies
- 9.4 Imports, Exports and Trade Barriers
- 9.5 Public Procurement and Local Content Requirements
- 9.6 Data Protection, AI and Cybersecurity Compliance
- 9.7 Upcoming Policy Changes and Market Implications
Chapter 10 Indonesia Digital Software Solutions Market Hotspots and Opportunities
- 10.1 Market Opportunity Mapping and Growth Hotspots
- 10.2 High-Growth Applications and Customer Groups
- 10.3 Underserved Markets and White-Space Opportunities
- 10.4 Emerging Technology and Product Opportunities
- 10.5 New Capacity and Investment Hotspots
- 10.6 Market Entry and Expansion Opportunities
- 10.7 Distribution and Partnership Opportunities
- 10.8 Near-Term and Long-Term Commercial Potential
- 10.9 Opportunity Attractiveness and Execution Risks
Chapter 11 Indonesia Digital Software Solutions Market Outlook, 2025-2035
- 11.1 Market Size and Analysis
- 11.1.1 Revenue (Market Measurement: 2025: USD 1.39 billion → 2035: USD 3.24 billion)
- 11.1.2 Historical Market Size, 2018-2025
- 11.1.3 Base-Year Market Size, 2025
- 11.2 Market Forecast, 2025-2035
- 11.2.1 Revenue Forecast to 2035
- 11.2.2 CAGR and Year-on-Year Growth
- 11.2.3 Incremental Revenue Opportunity
- 11.3 Forecast Assumptions and Scenario Analysis
- 11.3.1 Base-Case Forecast
- 11.3.2 Optimistic and Conservative Scenarios
- 11.3.3 Technology, Pricing and Policy Sensitivities
- 11.4 Market Attractiveness and Growth Outlook
Chapter 12 Indonesia Digital Software Solutions Market Segmentation and Outlook
- 12.1 Segmentation Summary and Market Shares, 2025
- 12.2 Largest and Fastest-Growing Segments
- 12.3 By Solution Type - Market Size and Forecast, 2025-2035
- 12.3.1 Segment Definition and Scope
- 12.3.2 Historical Market Size, 2018-2025
- 12.3.3 Revenue Forecast, 2025-2035
- 12.3.4 Base-Year Market Share, 2025
- 12.3.5 Segment CAGR and Growth Drivers
- 12.3.6 Subsegment Market Size and Forecast
- 12.3.6.1 ERP and Business Management Software
- 12.3.6.2 CRM and Customer Engagement Software
- 12.3.6.3 HR and Workforce Management Software
- 12.3.6.4 Data Analytics and Business Intelligence Software
- 12.3.6.5 Cybersecurity and Identity Software
- 12.3.7 Subsegment Pricing and Adoption Trends
- 12.3.8 Leading Suppliers and Competition
- 12.3.9 Regional Demand and Opportunities
- 12.4 By Deployment Model - Market Size and Forecast, 2025-2035
- 12.4.1 Segment Definition and Scope
- 12.4.2 Historical Market Size, 2018-2025
- 12.4.3 Revenue Forecast, 2025-2035
- 12.4.4 Base-Year Market Share, 2025
- 12.4.5 Segment CAGR and Growth Drivers
- 12.4.6 Subsegment Market Size and Forecast
- 12.4.6.1 Cloud-Native SaaS
- 12.4.6.2 Private Cloud Deployment
- 12.4.6.3 On-Premise Licensed Software
- 12.4.6.4 Hybrid Cloud Deployment
- 12.4.6.5 Managed Software Services
- 12.4.7 Subsegment Pricing and Adoption Trends
- 12.4.8 Leading Suppliers and Competition
- 12.4.9 Regional Demand and Opportunities
- 12.5 By End-Use Industry - Market Size and Forecast, 2025-2035
- 12.5.1 Segment Definition and Scope
- 12.5.2 Historical Market Size, 2018-2025
- 12.5.3 Revenue Forecast, 2025-2035
- 12.5.4 Base-Year Market Share, 2025
- 12.5.5 Segment CAGR and Growth Drivers
- 12.5.6 Subsegment Market Size and Forecast
- 12.5.6.1 Banking and Financial Services
- 12.5.6.2 Retail and E-Commerce
- 12.5.6.3 Telecommunications and Media
- 12.5.6.4 Manufacturing and Distribution
- 12.5.6.5 Government and Public Services
- 12.5.7 Subsegment Pricing and Adoption Trends
- 12.5.8 Leading Suppliers and Competition
- 12.5.9 Regional Demand and Opportunities
- 12.6 By Enterprise Size - Market Size and Forecast, 2025-2035
- 12.6.1 Segment Definition and Scope
- 12.6.2 Historical Market Size, 2018-2025
- 12.6.3 Revenue Forecast, 2025-2035
- 12.6.4 Base-Year Market Share, 2025
- 12.6.5 Segment CAGR and Growth Drivers
- 12.6.6 Subsegment Market Size and Forecast
- 12.6.6.1 Micro and Small Businesses
- 12.6.6.2 Mid-Market Companies
- 12.6.6.3 Large Domestic Enterprises
- 12.6.6.4 Multinational Corporations
- 12.6.6.5 State-Owned Enterprises
- 12.6.7 Subsegment Pricing and Adoption Trends
- 12.6.8 Leading Suppliers and Competition
- 12.6.9 Regional Demand and Opportunities
- 12.7 Segment Growth Comparison
- 12.8 Segment Attractiveness and Priority Matrix
Chapter 13 Indonesia Digital Software Solutions End-Use and Application Market Outlook
- 13.1 End-Use Industry and Customer Demand Structure
- 13.2 Leading Applications and Customer Groups
- 13.3 End-Use Market Size, Share and Forecast
- 13.4 Major End-Use Industry Deep Dives
- 13.4.1 Customer Requirements and Use Cases
- 13.4.2 Demand and Replacement Cycles
- 13.4.3 Technical and Regulatory Considerations
- 13.4.4 Purchasing and Procurement Models
- 13.4.5 Leading Vendors and Distribution Channels
- 13.4.6 Forecast and Commercial Opportunities
- 13.5 Emerging Applications and Cross-Segment Demand
- 13.6 End-Use Industry Investment Priorities
Chapter 14 Indonesia Digital Software Solutions Geographic Market Outlook, 2025-2035
- 14.1 Domestic Market Distribution and Demand Clusters
- 14.2 State- or Province-Wise Market Size and Forecast, 2025-2035
- 14.3 City and Metropolitan Market Outlook
- 14.4 Industrial, Manufacturing and Commercial Clusters
- 14.5 Geographic Concentration of Key End Users
- 14.6 Local Pricing and Purchasing Differences
- 14.7 Domestic Production Facilities and Capacity Map
- 14.8 Local Infrastructure and Project Pipeline
- 14.9 State-Level Policy and Incentive Differences
- 14.10 Subnational Investment Hotspots and Opportunities
- 14.11 Distribution and Logistics Networks
- 14.12 Domestic Competitive Footprint
Chapter 15 Indonesia Digital Software Solutions Technology, Innovation and Sustainability Outlook
- 15.1 Technology Landscape and Maturity
- 15.2 Product, Process and Service Innovation
- 15.3 AI, Automation and Digital Tools in the Industry
- 15.4 Technology Adoption and Performance Benchmarking
- 15.5 Innovation Pipeline and R&D Investment
- 15.6 Patent and Intellectual Property Trends
- 15.7 Energy Efficiency and Resource Management
- 15.8 Sustainability, Recycling and Circularity
- 15.9 Technology Roadmap, 2025-2035
- 15.10 Risks of Obsolescence and Technology Substitution
Chapter 16 Indonesia Digital Software Solutions Market Key Strategic Imperatives
- 16.1 Growth and Market Entry Priorities
- 16.2 High-Return Products and Segments
- 16.3 Pricing, Profitability and Cost Optimization
- 16.4 Technology Investment and Product Differentiation
- 16.5 Supply Chain Localization and Resilience
- 16.6 Distribution and Customer Acquisition
- 16.7 Partnership, Acquisition and Capacity Strategy
- 16.8 Regional Expansion Priorities
- 16.9 Short-, Medium- and Long-Term Actions
Chapter 17 Competition Outlook
- 17.1 Industry Competition Characteristics
- 17.2 Market Structure and Concentration
- 17.3 Market Share and Competitive Positioning, 2025
- 17.4 Company-Wise Revenue and Product Benchmarking
- 17.5 Production and Service Capacity Benchmarking
- 17.6 Technology, Pricing and Differentiation
- 17.7 Regional Footprint and Distribution Strength
- 17.8 Mergers, Acquisitions and Strategic Alliances
- 17.9 New Entrants and Competitive Threats
- 17.10 Porter's Five Forces and Industry Attractiveness
- 17.11 Competitive Outlook, 2025-2035
Chapter 18 Company Profiles
- 18.1 Company Coverage and Selection Criteria
- 18.2 Microsoft Corporation
- 18.2.1 Business Description
- 18.2.2 Company Ownership and Geographic Presence
- 18.2.3 Product and Service Portfolio
- 18.2.4 Manufacturing and Operating Footprint
- 18.2.5 Financial Performance and Investment
- 18.2.6 Market Share and Competitive Position
- 18.2.7 Technology and Innovation Capabilities
- 18.2.8 Strategic Alliances or Partnerships
- 18.2.9 Recent Developments
- 18.2.10 Growth Strategy and Outlook
- 18.3 PT Gamatechno Indonesia
- 18.4 SAP SE
- 18.5 Salesforce Inc.
- 18.6 PT Zahir Internasional
- 18.7 Oracle Corporation
- 18.8 IBM Corporation
- 18.9 Adobe Inc.
- 18.10 Google LLC
- 18.11 PT Telkom Indonesia
- 18.12 Other Relevant Market Participants
Note: Every listed company is profiled on the structure shown under the first company. The company list is preliminary and may change based on research findings, market developments, data availability and client requirements.
Chapter 19 Disclaimer
- 19.1 Research and Forecast Disclaimer
- 19.2 Data Source and Estimation Limitations
Note: The depth of individual sections depends on data availability for this market. Volume, capacity, trade and other unit-based metrics are included where applicable.

