
AI agents and buyer signals reset seller data budgets
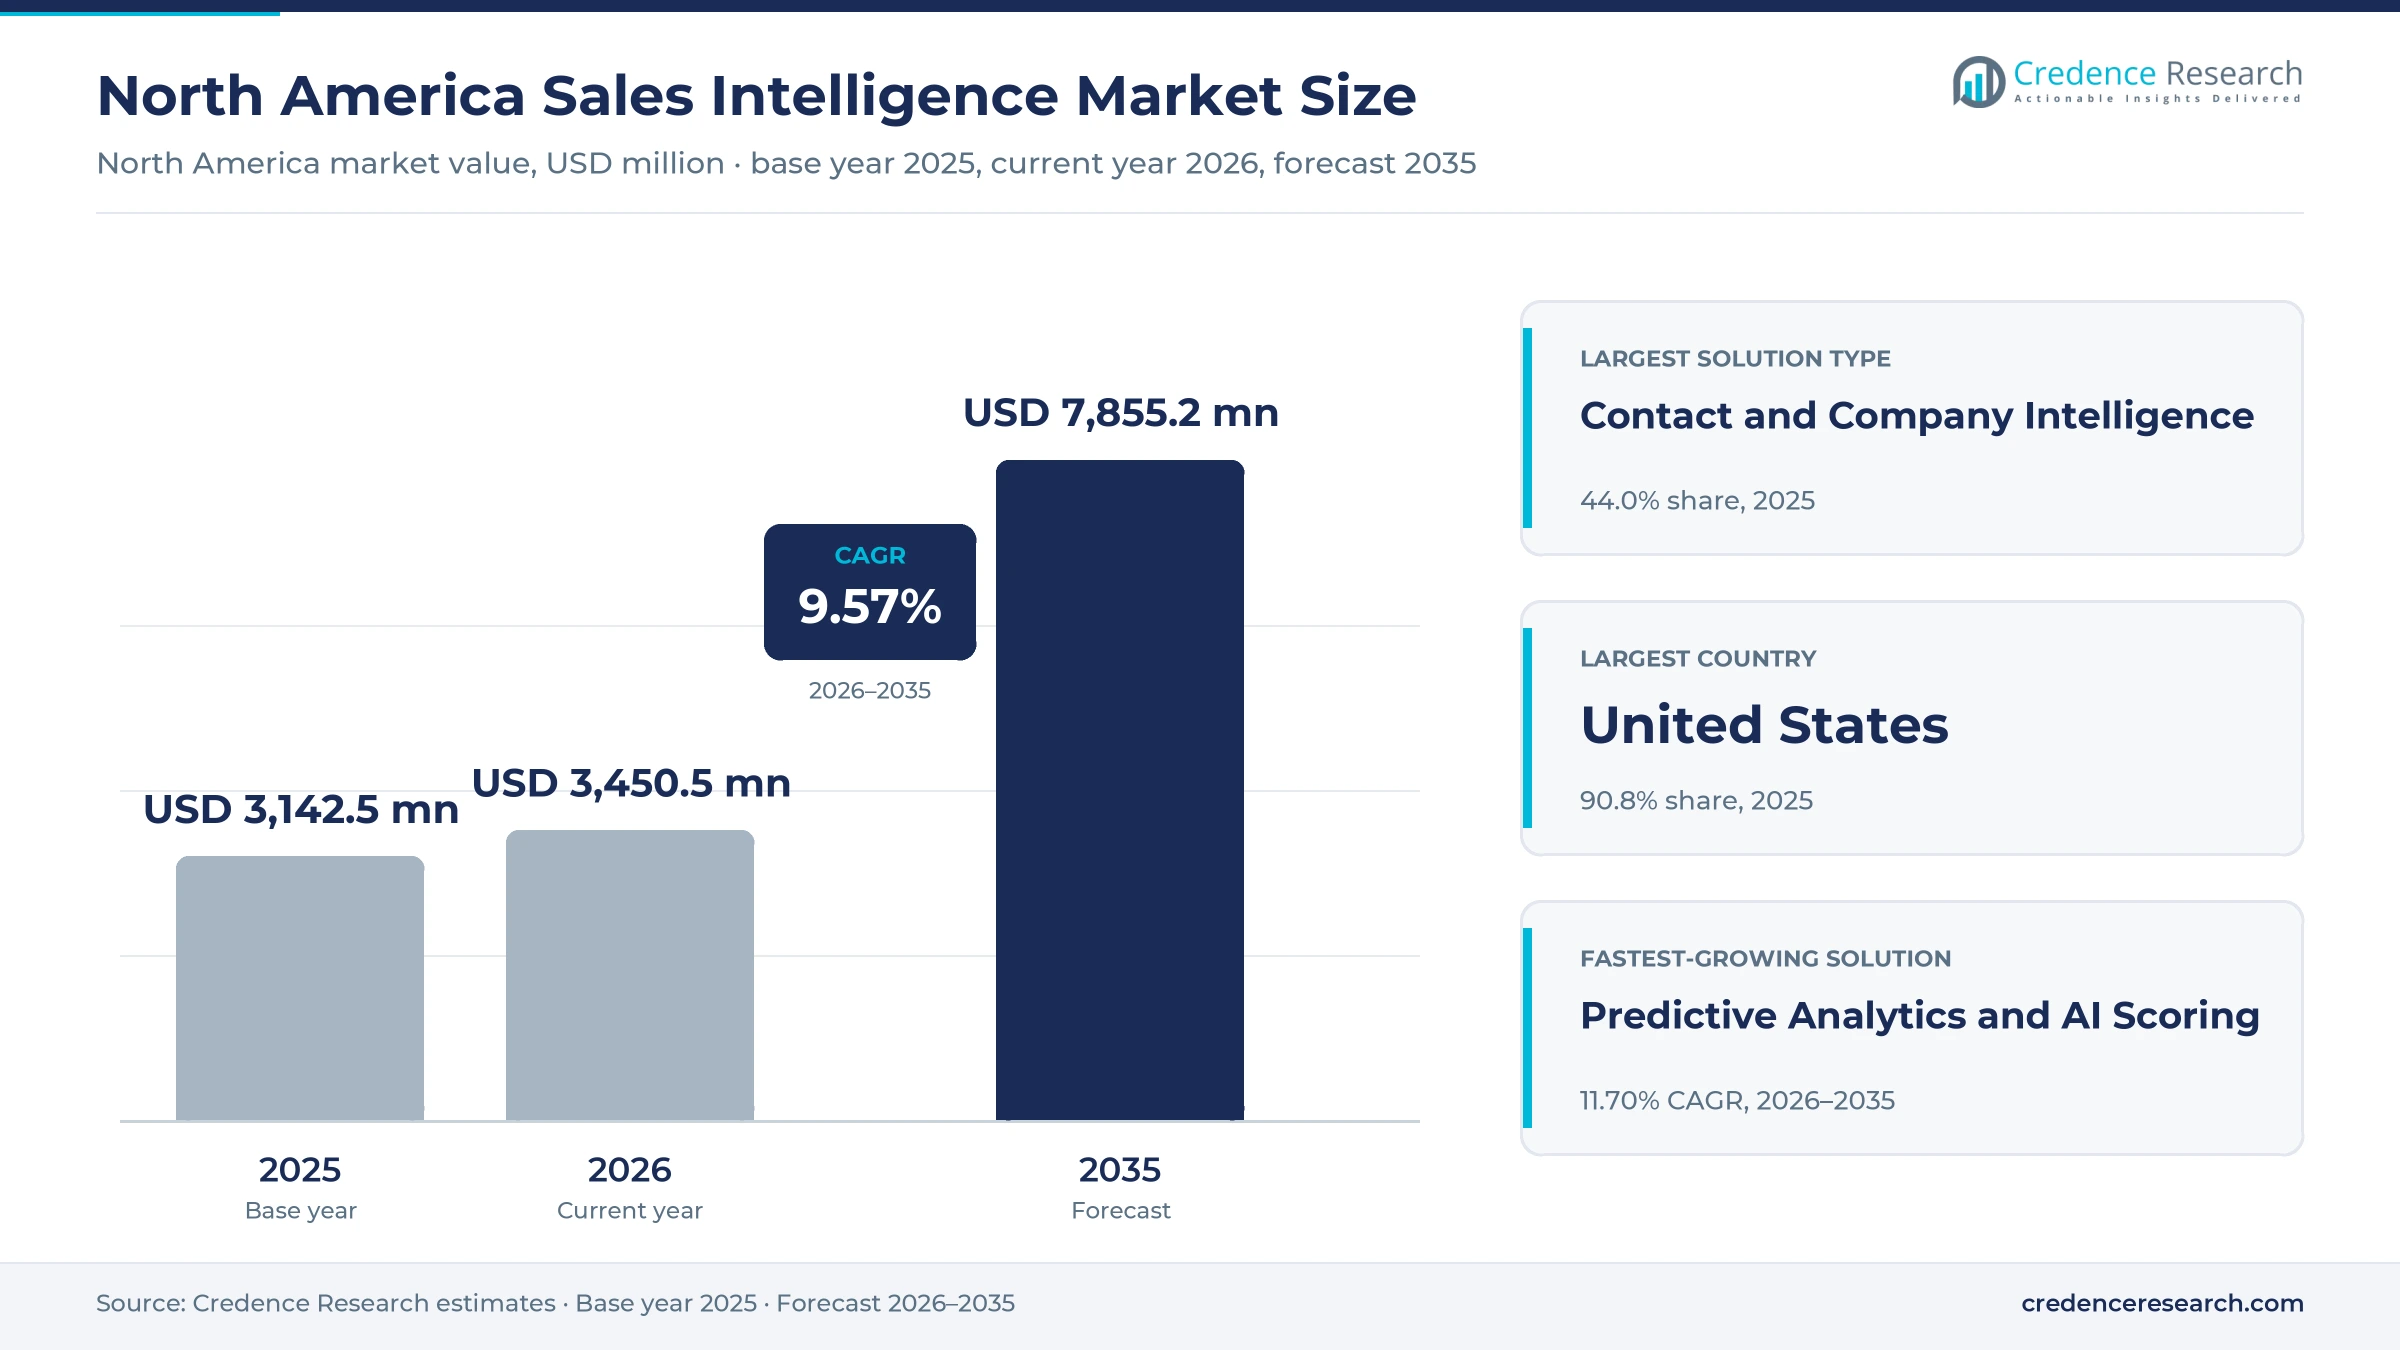
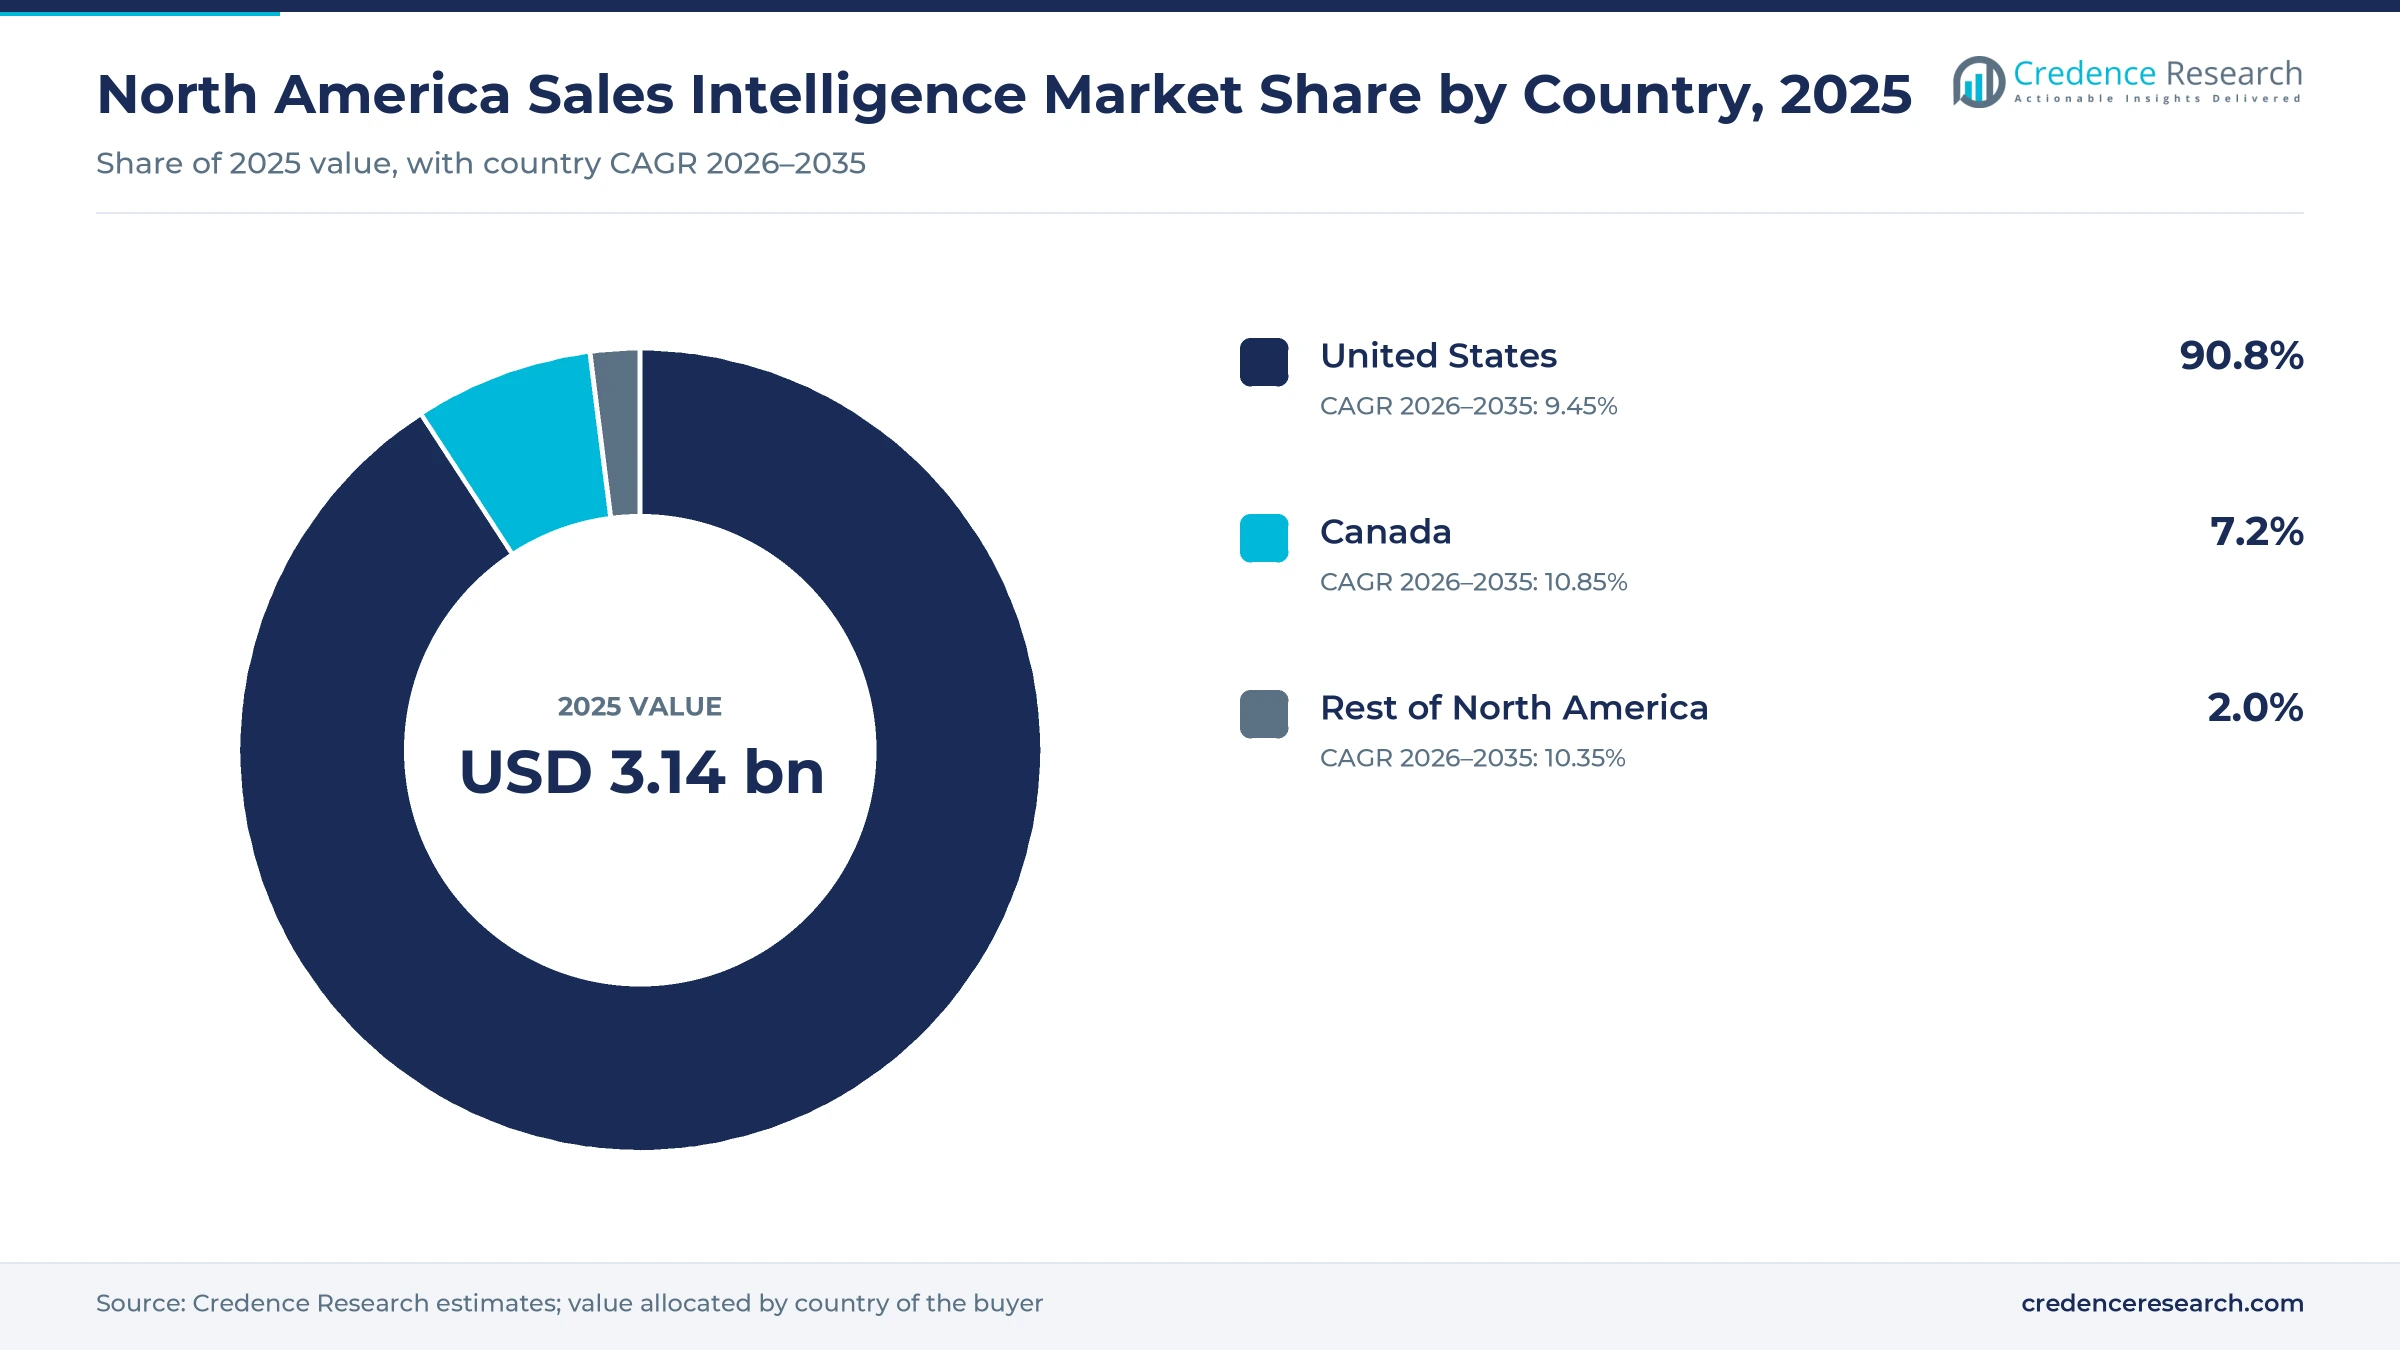
The North America sales intelligence market was valued at USD 3.14 billion in 2025 and is projected to increase from USD 3.45 billion in 2026 to USD 7.86 billion by 2035, registering a CAGR of 9.57% during 2026–2035. Demand comes from revenue teams trying to win back selling hours, from buyers who choose a favored vendor before first contact, and from AI agents that need verified account records. The United States held the largest share, 90.8% in 2025, because American software, services and financial firms run the deepest seller organizations and the largest technology budgets on the continent. Canada is the fastest-growing country at 10.85% a year, supported by business AI use that tripled between the second quarters of 2024 and 2026. On the commercial side, Dun & Bradstreet connected its Commercial Graph to Microsoft Dynamics 365 agents in September 2026, which shows how supplier data is moving out of stand-alone portals and into the assistants sellers already use.
What counts as sales intelligence spending in this North American estimate?
The estimate counts software and data that help business sellers find, rank and win accounts, including contact and company records, buyer intent signals, predictive scoring and conversation and engagement analytics. Buyers usually purchase through annual seat or platform subscriptions, while larger accounts add API licenses and usage fees that feed records into their own systems.
General advertising, consumer lead lists and outsourced calling services fall outside the estimate, even when they share a budget with counted tools. The value chain runs from data collectors and signal providers, through platform vendors and their integration partners, to revenue operations teams that decide which records and models sellers actually see.
North America Sales Intelligence Market Insights
- The market grows from USD 3.14 billion in 2025 to USD 7.86 billion by 2035, a 9.57% CAGR over 2026–2035, as revenue teams fund data for AI agents and sellers.
- The United States held 90.8% of value in 2025, while Canada is the fastest-growing country at 10.85% a year as business AI use spreads.
- Contact and company intelligence led solution types with 44.0% of 2025 value, because prospecting, enrichment and agent workflows all begin with an accurate account record.
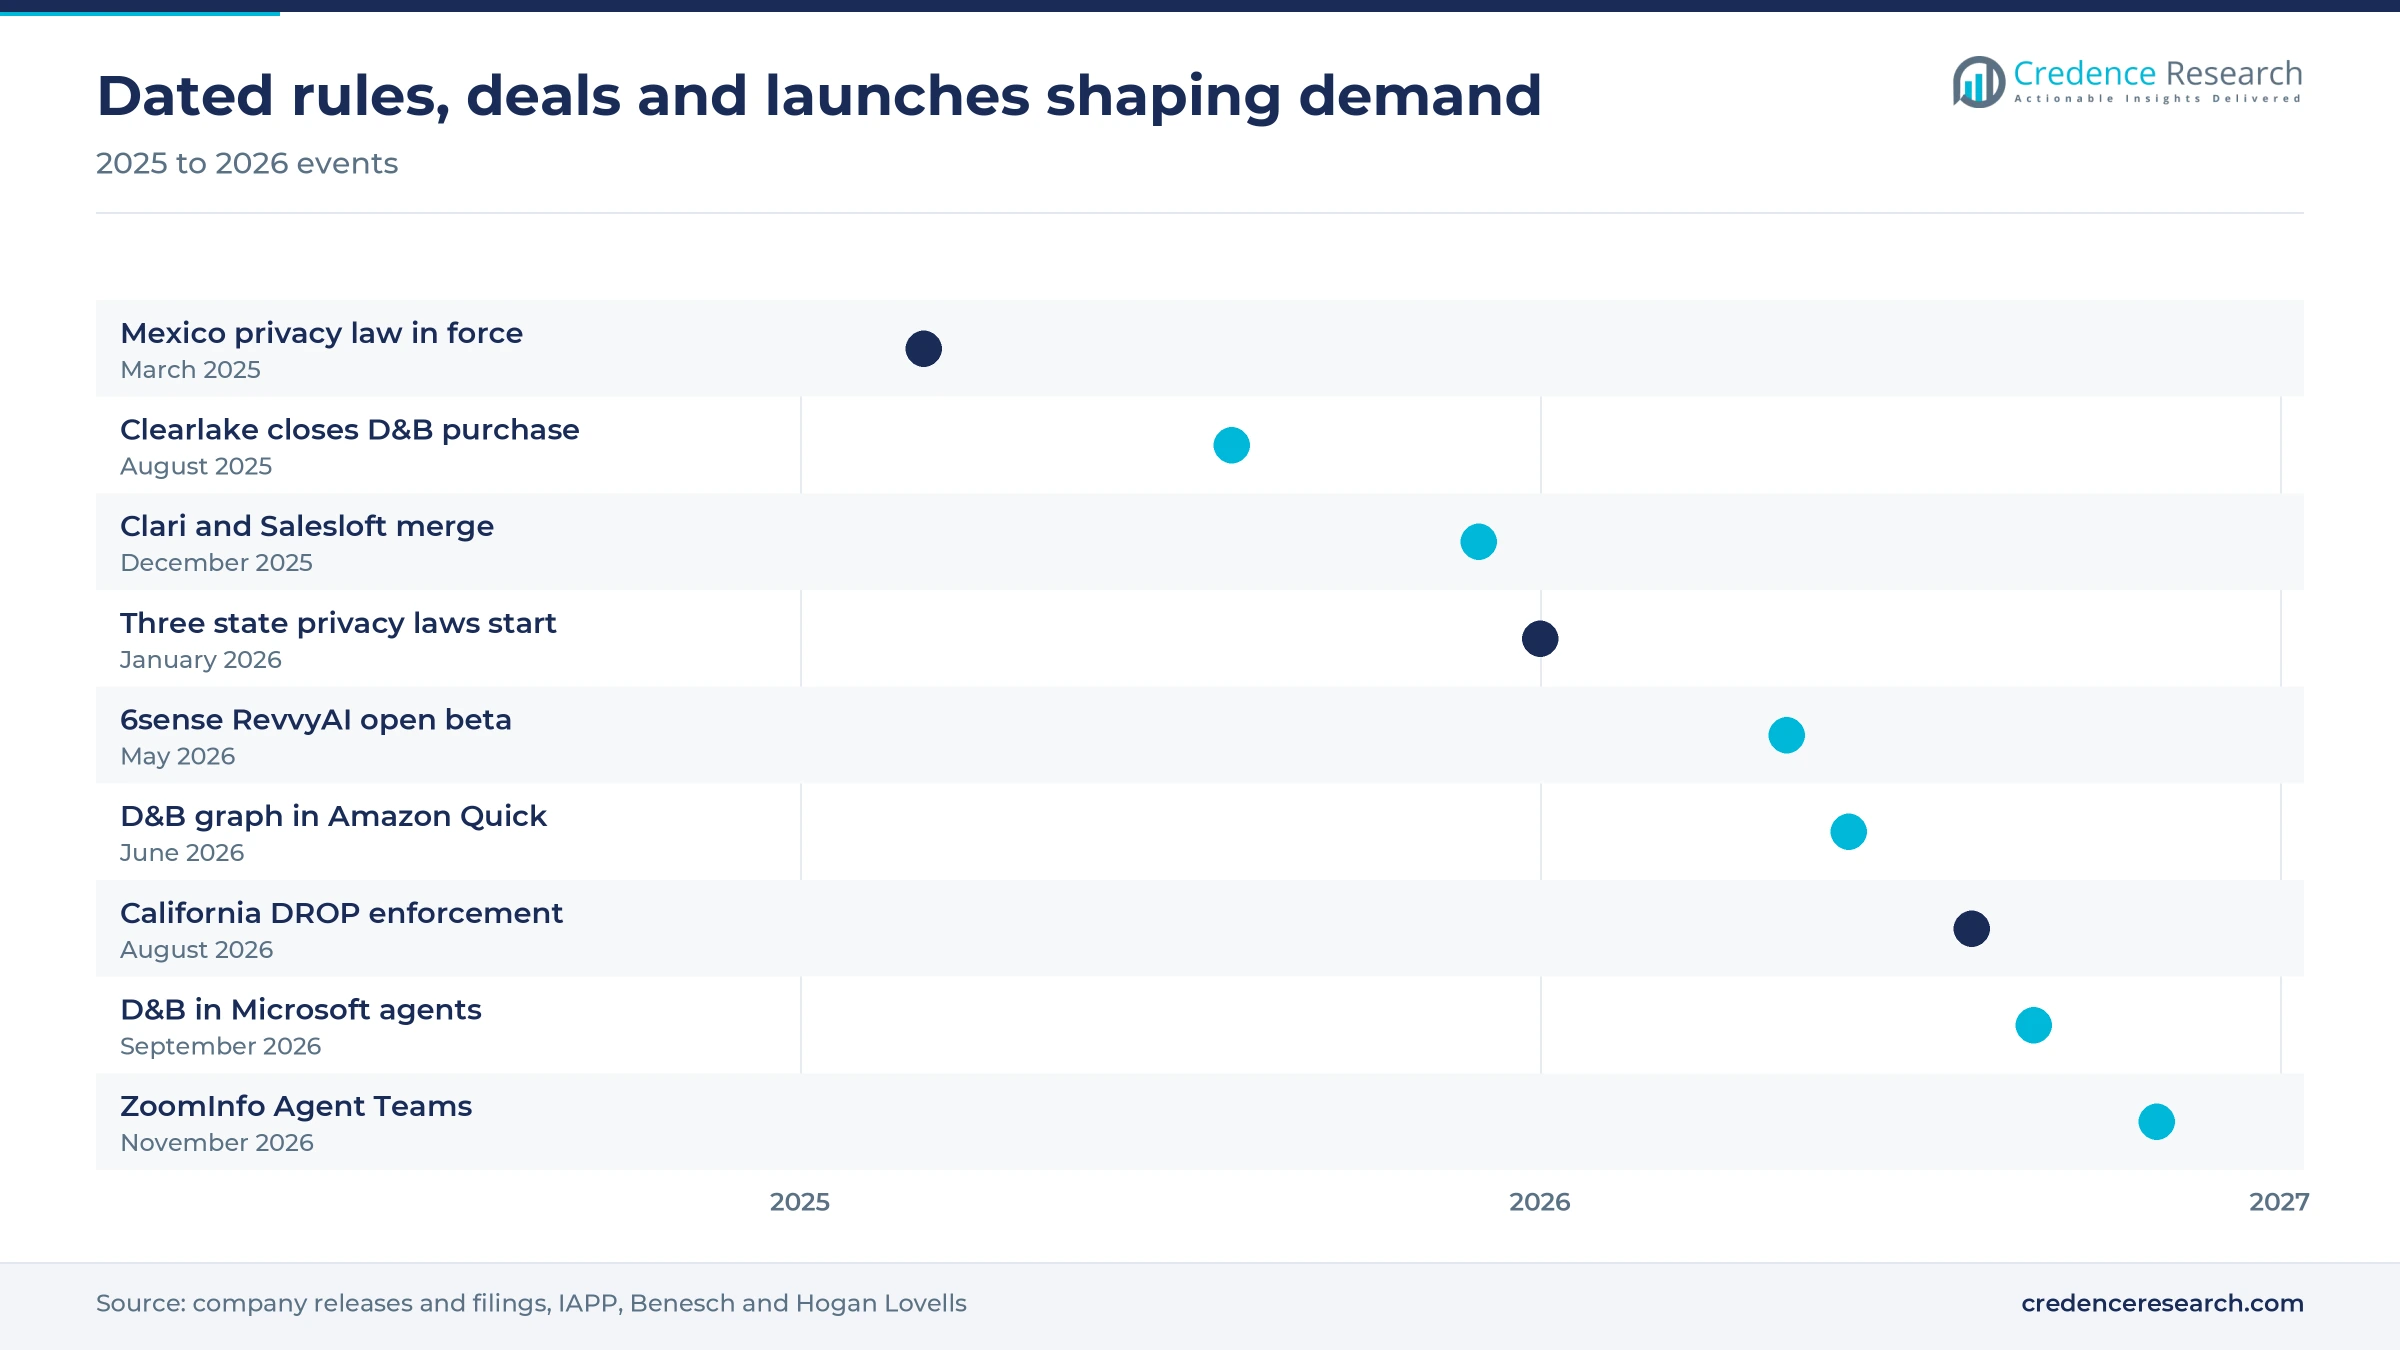
- Clari and Salesloft completed their merger in December 2025, which concentrated part of the supplier field around a broader revenue platform, while Clearlake completed its purchase of Dun & Bradstreet in August 2025.
- California began enforcing its data broker deletion platform on Aug. 1, 2026, so suppliers of contact and intent data now face recurring deletion duties and daily penalties.
Contact data and enterprise buyers anchor 2025 value
Why contact records lead and AI scoring grows fastest
Based on solution type, the market is categorized into contact and company intelligence, buyer intent data, predictive analytics and AI scoring, and revenue and engagement intelligence. Contact and Company Intelligence led with 44.0% of 2025 value because outreach starts with an accurate record, and ZoomInfo reported on Nov. 4, 2026 a base of 1,851 customers paying $100,000 or more in annual contract value. Predictive Analytics and AI Scoring grows fastest at 11.70% a year, as predictive analytics moves into agents, and 92% of sellers with agents told Salesforce those tools help their prospecting.
How prospecting keeps the lead as deal coaching gains
Based on application, the market is categorized into prospecting and data enrichment, account prioritization and deal execution and coaching. Prospecting and Data Enrichment led with 49.0% of 2025 value because 55% of sales professionals already use AI for prospecting and 74% are focusing on data cleansing, according to Salesforce. Deal Execution and Coaching grows fastest at 10.71% a year, as Gong said in May 2026 that use of its Gong Assistant rose over 200% in a year. Demand for combined tools also shaped the December 2025 merger of Clari and Salesloft, which joined forecasting with engagement and conversation analysis.
Why technology firms lead and financial sellers accelerate
Based on end-use industry, the market is categorized into information technology and telecommunications, professional and business services, banking, financial services and insurance, and manufacturing and distribution. Information Technology and Telecommunications led with 39.0% of 2025 value because the U.S. Census Bureau reported in May 2026 AI use of 39.7% in the information sector, about double the national rate. Banking, Financial Services and Insurance grows fastest at 10.44% a year, as American finance and insurance firms reached 33.9%, according to the Census Bureau, and Canadian peers jumped from 31.7% to 40.4% within a year, according to Statistics Canada.
How enterprise contracts lead while mid-market seats scale
Based on enterprise size, the market is categorized into enterprise, mid-market and SMB buyers. Enterprise led with 54.0% of 2025 value because large accounts run the biggest data programs, and ZoomInfo said upmarket customers made up 77% of its annual contract value in the third quarter of 2026. Mid-Market grows fastest at 10.48% a year, as Census Bureau data showed 32% of firms with 100 to 249 employees using AI by May 2026. Smaller teams buy more cheaply, since Prospeo, a rival vendor, lists Apollo.io seats from $49 a month on annual billing.
| Segment Group | Leading Sub-segment | Share, 2025 | Fastest-growing Sub-segment | CAGR, 2026–2035 |
|---|---|---|---|---|
| By Solution Type | Contact and Company Intelligence | 44.0% | Predictive Analytics and AI Scoring | 11.70% |
| By Application | Prospecting and Data Enrichment | 49.0% | Deal Execution and Coaching | 10.71% |
| By End-Use Industry | Information Technology and Telecommunications | 39.0% | Banking, Financial Services and Insurance | 10.44% |
| By Enterprise Size | Enterprise | 54.0% | Mid-Market | 10.48% |
Request a Free Sample
Fill in your details and we'll send you a free sample report.
- Sample data tables & charts
- Research methodology
Seller time and early vendor choice lift spending
AI-assisted selling productivity recovers lost hours
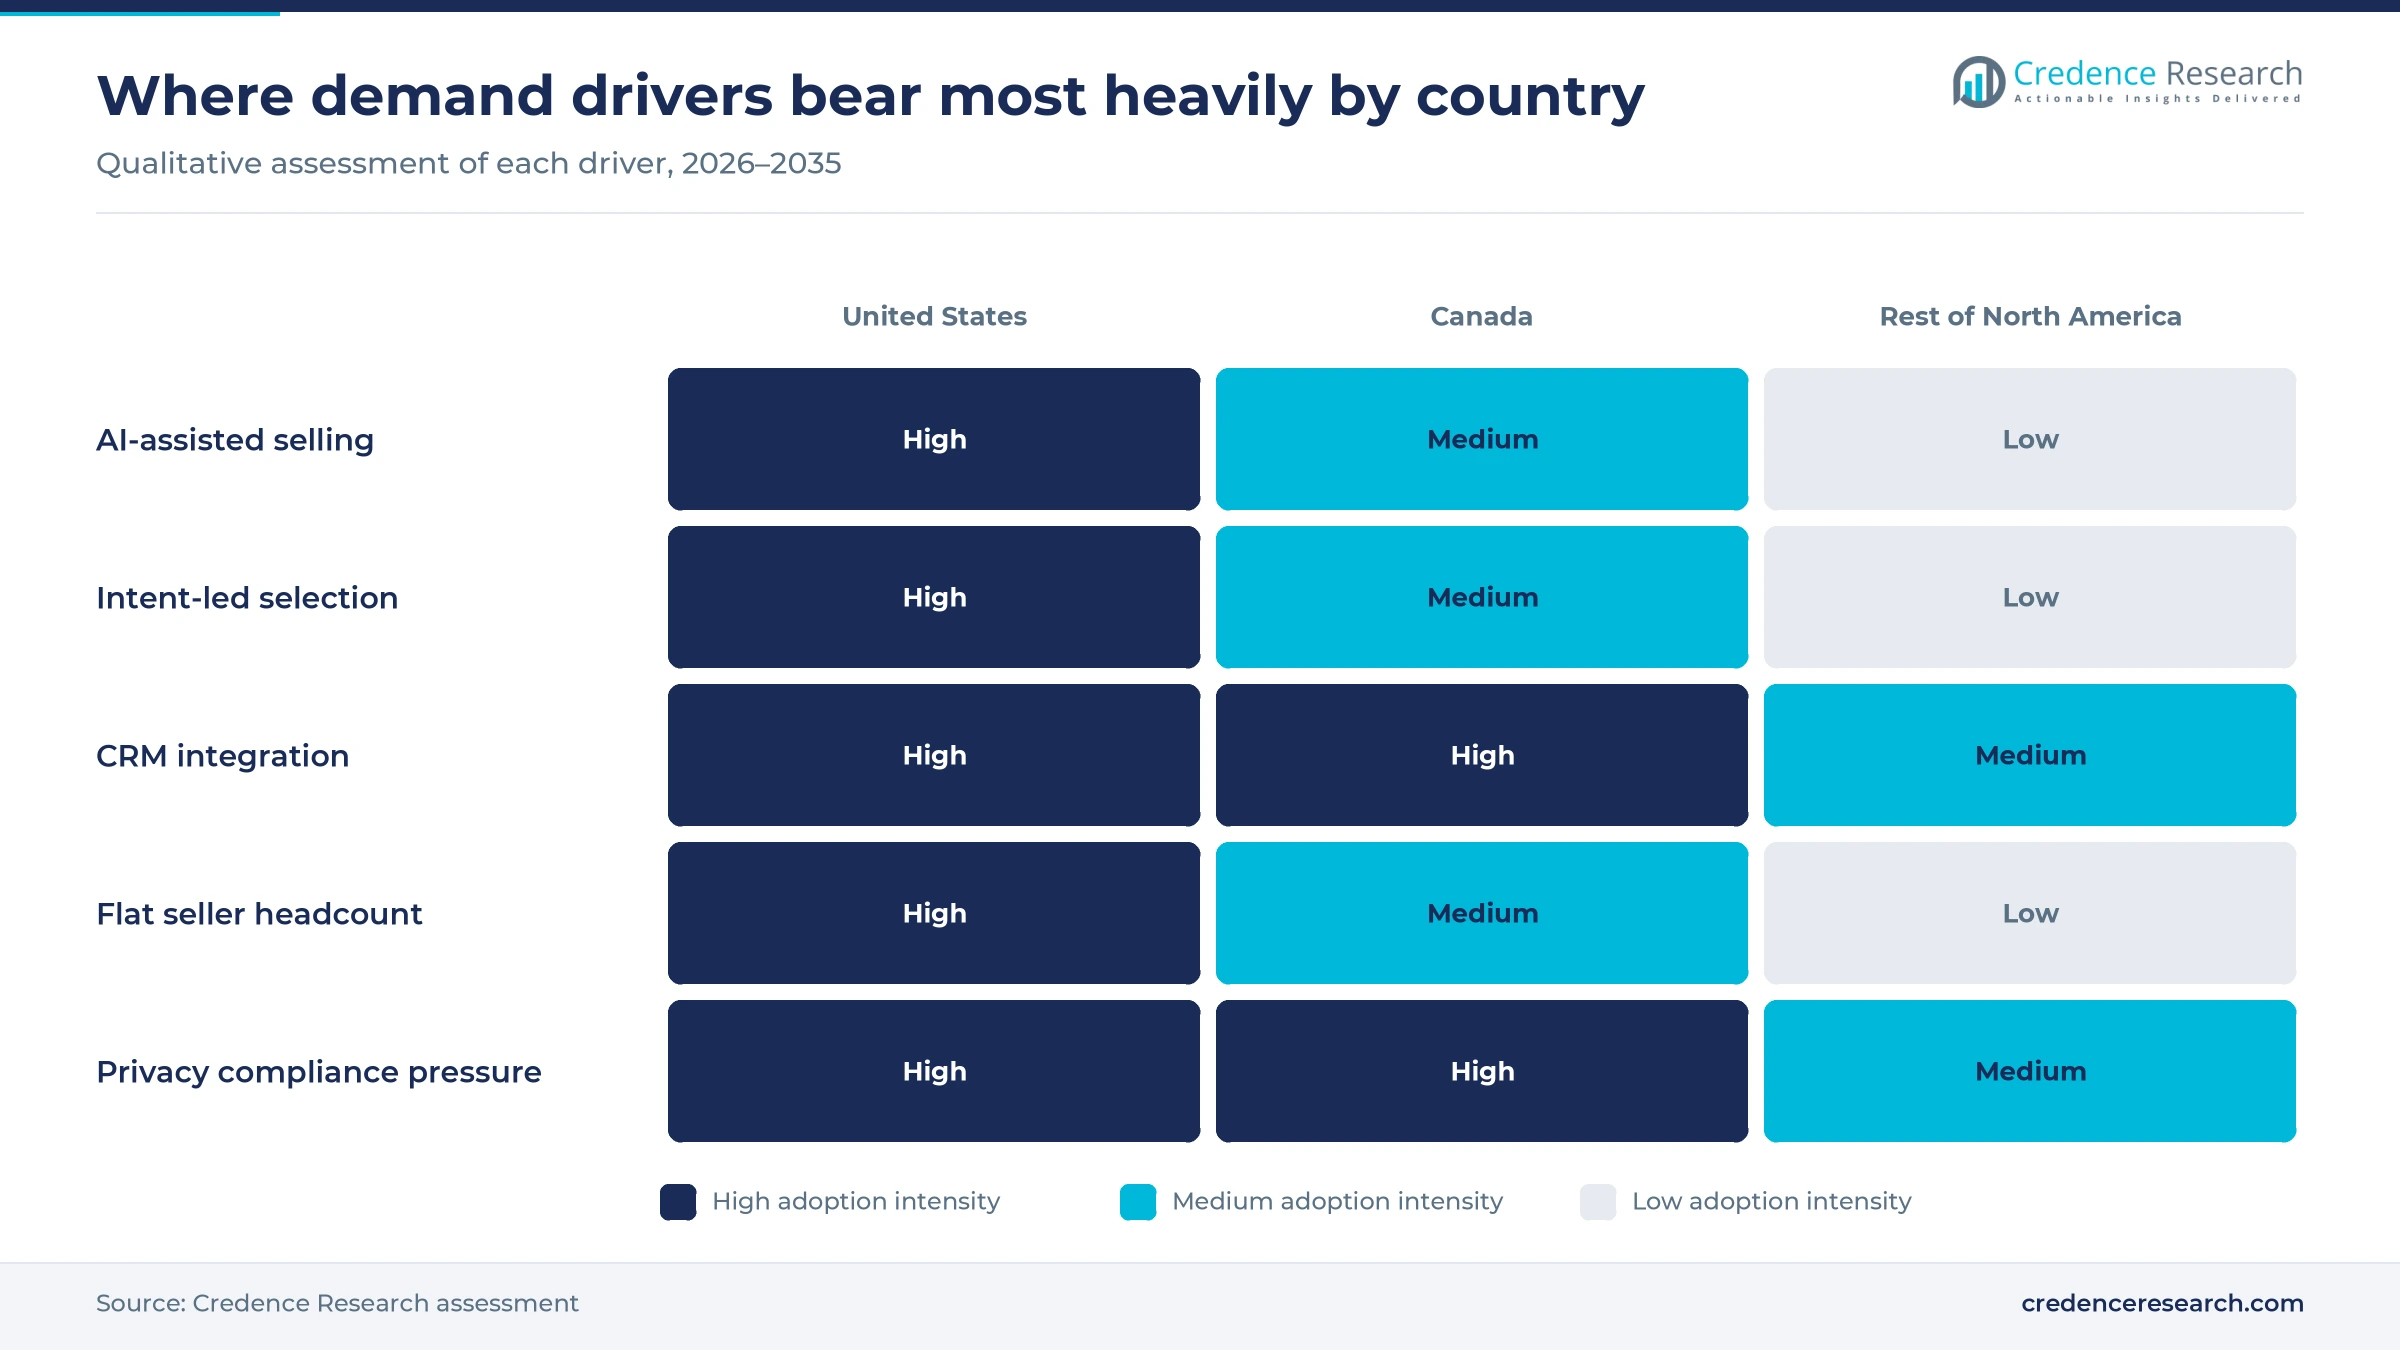
AI-assisted selling lifts demand because sellers still spend most of the week away from customers, and budget owners treat each recovered hour as new capacity. The average seller spends only 40% of working time selling, according to the Salesforce State of Sales survey published in February 2026, which covered 4,050 professionals in 22 countries including the United States, Canada and Mexico. In the same survey, 54% of sellers said they had used AI agents, and nearly 9 in 10 planned to by 2027, which signals durable demand. Results are also becoming visible to buyers, since Uber for Business lifted response rates 32% with Gong agents, the vendor said. As a result, agent budgets pull extra spending toward the data those tools read.
Intent-led account selection follows earlier vendor choice
Intent-led account selection gains budget because buyers now settle on favorites before any seller calls. The 6sense 2025 Buyer Experience Report, published in November 2025 from more than 4,000 buyers including North American respondents, found that 94% of buying groups ranked preferred vendors before first contact. Those groups bought from that early favorite 77% of the time, and buying cycles shortened to about 10 months from roughly 11 months, which concentrates demand earlier. Independent research also still made up 60% of the journey in that study. Consequently, revenue teams pay for signals that reveal research activity early, and Prospecting and Data Enrichment tools now route those signals directly into seller queues and Predictive Analytics and AI Scoring models.
Self-service adoption and CRM integration widen access
Self-service access and tighter integration widen the buyer base because sellers want intelligence inside tools they already open each day. Over half of sales leaders with AI, 51%, told Salesforce that disconnected systems slow their initiatives, which makes connectors a direct purchasing criterion for customer relationship management systems owners. In May 2026, 6sense released RevvyAI at no charge to Sales Intelligence users, with a Chrome extension working on LinkedIn, Salesforce, Salesloft and Outreach. Dun & Bradstreet then announced in September 2026 that Microsoft Sales Qualification and Sales Opportunity agents can draw on its data. Prospeo, a rival data vendor, lists a free Apollo.io tier with 10 monthly export credits, though it warns that free limits have been reduced, and small teams can still trial records before paying for seats.
Flat seller headcount pushes output per representative
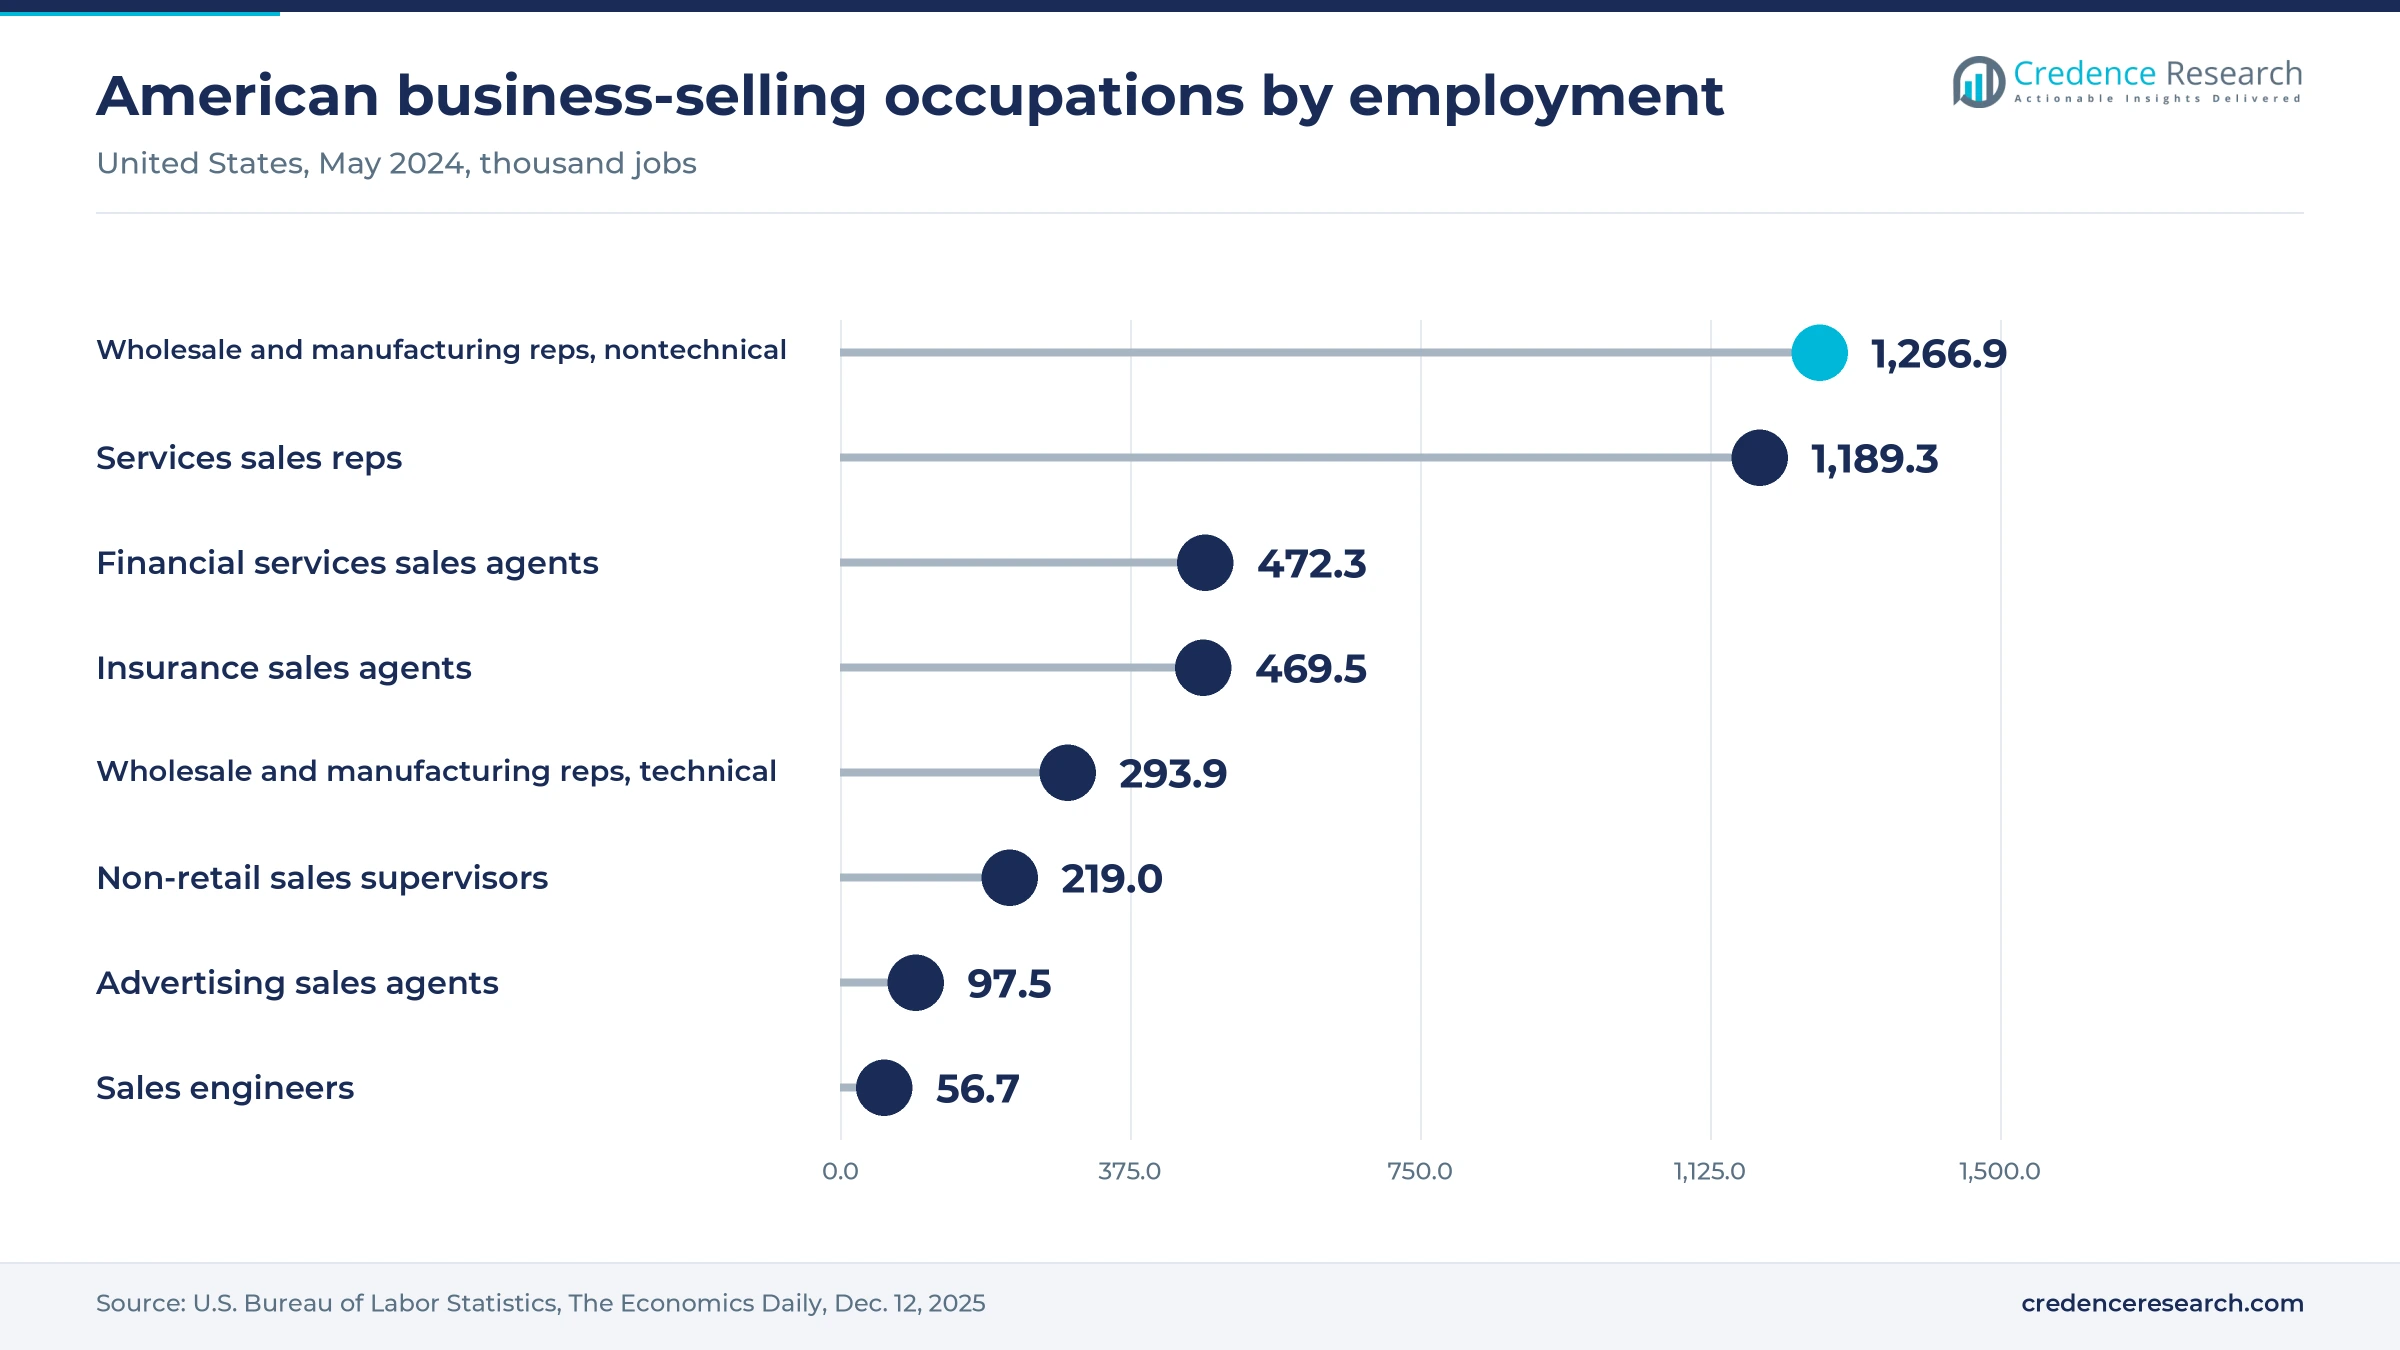
Flat seller headcount lifts software demand because employers must grow pipeline without adding many representatives. The U.S. Bureau of Labor Statistics counted 1,571,400 wholesale and manufacturing sales representative jobs in 2025 and projects little or no change through 2035, a decline of 7,700 positions. Median pay for those roles reached $76,460 in May 2025, about 1.5 times the $50,980 median for all occupations, so an unproductive seller is costly. Broader sales and related employment stood near 13.4 million in May 2024, or about 8.7% of American jobs, which sets a large base of demand. Therefore employers look to intelligence seats, which cost far less than a hire, to raise output from the people they already employ.
Agent-ready data and suite buying reshape vendor plans
Rise of the agent-ready data layer
Supplier data is shifting from portals used by people to services queried by software agents. ZoomInfo introduced Agent Teams, a multi-agent orchestration layer inside GTM Studio, with its results of Nov. 4, 2026, and its chief executive said its context layer now grounds agents across dozens of platforms. MarketScale reported that 6sense announced integrations with Claude, ChatGPT, Writer and Salesforce Agentforce on Aug. 10, 2026. Dun & Bradstreet brought its Commercial Graph to Amazon Quick through the Model Context Protocol on June 16, 2026. As a result, suppliers increasingly price access for machines as well as seats, and buyers compare how well each feed performs inside their chosen assistant.
Shift toward multiproduct revenue platforms
Buyers are shifting from separate point tools toward fewer suppliers that cover data, engagement and forecasting together. Revenue.io, a rival vendor, reported that Clari and Salesloft completed their merger on Dec. 3, 2025, created a company with over 5,000 customers, and connected Clari Forecast to Salesloft execution tools in April 2026. Gong said half of its customers now run multiple products on its platform, and demand spans more than 5,000 companies worldwide. Ownership has moved as well, because Clearlake completed its purchase of Dun & Bradstreet on Aug. 26, 2025, according to a company filing. Consequently, smaller specialists must either integrate deeply or become acquisition targets.
Opening in Canada as business AI use catches up
Canada offers suppliers an opening because AI use among businesses is rising quickly from a modest base. Statistics Canada reported in June 2026 that 19.2% of businesses used AI in the second quarter of 2026, up from 6.1% two years earlier. Use reached 42.3% in information and cultural industries and 32.4% in professional, scientific and technical services, both natural sales intelligence buyers. However, only 19.8% of AI-using businesses used it for marketing automation, down from 23.1% a year earlier, so use on marketing automation platforms and seller tools remains uneven. ZoomInfo already lists a Canadian office in its September 2026 quarterly filing. Vendors offering consent-aware records and bilingual support can therefore win accounts as adoption widens.
Opening for verified and audited business data
Verified data offers suppliers a pricing opening because agents repeat any errors in the records they read. In its State of Sales research, Salesforce found that 79% of high performers prioritize data hygiene, compared with 54% of underperformers, which ties quality directly to results. A Salesforce executive also warned in that report that stand-alone agents without comprehensive customer context tend to fail. ZoomInfo achieved ISO/IEC 42001 certification for its AI management system, as disclosed in November 2026, giving procurement teams an audit reference. Dun & Bradstreet similarly promotes verified entity data built around a D-U-N-S Number dating to 1963. Accordingly, vendors able to document lineage and accuracy can defend price against cheaper scraped lists.
Privacy rules and weak renewals limit budget growth
A widening patchwork of state privacy laws
State privacy law raises compliance costs because no single federal standard governs contact and behavioral data. IAPP counted 19 enacted comprehensive state laws as 2026 began, with Indiana, Kentucky and Rhode Island taking effect on Jan. 1, 2026. California also added rules on automated decision-making that year, requiring opt-outs where software replaces or substantially replaces human decisions, so model governance now draws legal review. Suppliers must therefore map each record and model against separate state duties, while buyers demand contract assurances before renewing or expanding seats.
California deletion duties for data brokers
California has turned deletion into a recurring operating cost for data brokers. Enforcement of its Delete Request and Opt-Out Platform began Aug. 1, 2026, requiring brokers to retrieve requests at least every 45 days, according to the Benesch law firm, with penalties of $200 per request, per day. The law firm Manatt reported over 450,000 consumer deletion requests by about August 2026, while TrueVault, a privacy compliance vendor, counted around 600 registered brokers. Smaller suppliers feel this most, because they must weigh ongoing deletion costs against the value of those records.
Weaker renewals and seat consolidation at incumbents
Renewal pressure limits growth even as interest in AI rises, because buyers are trimming seats and consolidating tools. Softer demand showed when ZoomInfo reported net retention of 88% for the third quarter of 2026, and customers paying $100,000 or more fell 2% from a year earlier. Upmarket contract value was flat over the same period, according to that release. Suppliers therefore spend more effort defending existing accounts, and they increasingly bundle agents and data rather than selling extra seats to teams with flat headcount.
Consent and processor rules across borders
Cross-border selling complicates data programs because Canada and Mexico apply different duties from American state laws. Liability under Canada's Anti-Spam Legislation can reach C$10 million for businesses, according to the law firm Hogan Lovells, which raises the risk of outreach built on poorly documented consent. Mexico replaced its 2010 private-sector privacy law on March 21, 2025, and Hogan Lovells said the new text extends duties to data processors. Suppliers must therefore revise contracts and keep separate records for each country, which adds cost for smaller accounts.
The United States dominates while Canada adds pace
| Country | Value, 2025 (USD billion) | Share, 2025 | CAGR, 2026–2035 |
|---|---|---|---|
| United States | 2.85 | 90.8% | 9.45% |
| Canada | 0.23 | 7.2% | 10.85% |
| Rest of North America | 0.06 | 2.0% | 10.35% |
United States holds most seller seats and data contracts
The United States held 90.8% of 2025 value and grows at 9.45% a year, because most large supplier headquarters and seller organizations sit there. The Bureau of Labor Statistics counted 1,189,330 sales representatives of services in May 2024, alongside 472,300 securities and financial services sales agents. Census Bureau data placed overall business AI use between 17% and 20% from December 2025 to May 2026, and 37% among firms with at least 250 employees, a useful demand signal. Consequently, large accounts continue to set product and contract standards across the region.
Canada adds pace from a smaller base of adopters
Canada held 7.2% of 2025 value and is the fastest-growing country at 10.85% a year, because adoption is rising across its service economy. Statistics Canada found that finance and insurance reached 40.4% AI use in the second quarter of 2026, while 27.8% of businesses with 100 or more employees used it. Its smallest firms, with one to four employees, reported 19.9%, which points to demand beyond large accounts. However, Canadian Anti-Spam Legislation makes documented consent a buying criterion, so suppliers with clean records and local support hold an advantage over low-cost list providers.
Rest of North America remains an early-stage market
Rest of North America held 2.0% of 2025 value and grows at 10.35% a year, led by Mexico. World Bank data put Mexican output near $1.83 trillion in 2025, about 5.2% of the combined total for the three countries, yet Credence Research estimates a smaller share of supplier spending because seller software use there starts from a low base. New federal privacy duties since March 2025 add a compliance step for suppliers entering the country.
Agent launches and mergers reset the 2025-2026 field
| Development | Status and market relevance |
|---|---|
| In November 2026, ZoomInfo announced Agent Teams, a native multi-agent orchestration layer in GTM Studio, alongside its third-quarter results. | Announced; it moves the company from records and seats toward agent-driven workflows. |
| In September 2026, Dun & Bradstreet announced Model Context Protocol integrations with Microsoft Copilot Studio and Dynamics 365 Sales agents. | Announced; it places verified business data inside prebuilt qualification and opportunity agents. |
| In August 2026, 6sense announced native integrations with Claude, ChatGPT, Writer and Salesforce Agentforce. | Released; it brings account signals into assistants instead of static customer records. |
| In May 2026, 6sense released RevvyAI in open beta, including free access for Sales Intelligence users. | Open beta; it lowers the entry barrier for individual sellers. |
| In December 2025, Clari and Salesloft completed their merger, joining forecasting with engagement and conversation analysis. | Completed; platform unification is expected to take several years. |
Connectors and orchestration define the next toolset
- Model Context Protocol connectors let assistants query supplier records in near real time, so buyers can reach verified data without leaving their chosen workspace.
- Multi-agent orchestration coordinates research, enrichment and outreach steps across specialized agents, which raises the volume of data calls per account.
- Conversation analysis turns recorded calls into coaching and forecast signals, and it often shares infrastructure with contact center software used by service teams.
- AI management certification under ISO/IEC 42001 gives procurement and legal reviewers an external reference when they assess vendor models.
Need a Custom Version of This Report?
Tailor the scope, geography, or segments to your exact requirements.
- Custom geography or segment scope
- Direct access to our analyst team
Four suppliers compete on data depth and workflow reach
Competition centers on data depth, workflow reach and the ability to supply AI agents rather than only human users. ZoomInfo, based in Vancouver, Washington, competes on contact and company records and has added GTM Studio and Agent Teams. Gong competes from recorded customer conversations, and half of its customers run more than one of its products, including Engage, Forecast and Enable. Dun & Bradstreet, based in Jacksonville, Florida, relies on its D-U-N-S identifier and Commercial Graph, and it now distributes that graph through AWS and Microsoft assistants. 6sense competes on buyer signals and predictive scoring, and it has moved those signals into third-party assistants. These suppliers increasingly overlap, because each is extending toward agents and workflow automation. Buyers therefore compare accuracy, integration effort and compliance evidence more closely than headline record counts when they renew.
Companies profiled and their roles in this market
| Company | Type | Role in the market |
|---|---|---|
| ZoomInfo | Data and platform vendor | GTM Studio and Agent Teams, with 1,851 customers above $100,000 in contract value |
| Gong | Revenue AI platform | Engage, Forecast and Enable products serving more than 5,000 companies worldwide |
| Dun & Bradstreet | Business data provider | Commercial Graph connected to Amazon Quick and Microsoft agents in 2026 |
| 6sense | Intent and revenue platform | Buyer signals, RevvyAI and native integrations with four agent platforms |
Data trust decides which suppliers keep their seats
Credence Research's view is that data trust, rather than the number of AI features, will decide which suppliers keep their seats through 2035. Agents can only act on what they read, and the 2026 enforcement of California deletion duties shows that record supply itself is becoming regulated. Buyers will likely reward vendors that can document sourcing, offer connectors for several assistants and show a measurable effect on seller time. However, suppliers that rely mainly on per-seat growth face pressure from flat sales employment, so usage and platform pricing should gain importance over the period.
How the estimate was built
The report uses 2025 as the base year, 2026 as the estimate year and 2035 as the forecast year. Market values come from the Credence Research model, and country, segment and growth splits are Credence Research estimates. Inputs include official labor and business statistics, company filings and releases, vendor surveys and law firm summaries named in the text. No interviews or surveys were conducted for this edition of the report. The Rest of North America share and the segment splits are the most assumption-heavy estimates.
Agents become heavier data buyers by 2035
The market is forecast to reach USD 7.86 billion by 2035, and buying patterns should look noticeably different by then. Contact and company records will stay the largest category, although more of that data will be consumed by agents rather than by people searching a portal. Predictive scoring and deal coaching should take share as connectors mature and as revenue teams measure seller time more closely. Canada should keep gaining from later adoption, while the United States will remain the main testing ground for pricing and compliance. Privacy enforcement, more than demand, is the most likely limit on growth during the period.
Frequently Asked Questions
How big is the North America sales intelligence market?
Which country leads the market?
Which country grows fastest?
Which solution type holds the largest share?
Why are buyers paying for intent data?
How do AI agents affect spending?
What are the main challenges for suppliers?
Who are the key companies in the market?
Table of Content
Chapter 1 Market Segmentation
- 1.1 Segmentation Framework
- 1.1.1 Product and Service Classification
- 1.1.2 Application and End-Use Classification
- 1.1.3 Technology and Solution Classification
- 1.1.4 Customer and Distribution Channel Classification
- 1.1.5 Geographic Segmentation
- 1.1.6 Market Segment Definitions and Boundaries
- 1.2 By Solution Type
- 1.2.1 Contact and Company Intelligence
- 1.2.2 Revenue and Engagement Intelligence
- 1.2.3 Buyer Intent Data
- 1.2.4 Predictive Analytics and AI Scoring
- 1.3 By Application
- 1.3.1 Prospecting and Data Enrichment
- 1.3.2 Deal Execution and Coaching
- 1.3.3 Account Prioritization
- 1.4 By End-Use Industry
- 1.4.1 Information Technology and Telecommunications
- 1.4.2 Professional and Business Services
- 1.4.3 Banking, Financial Services and Insurance
- 1.4.4 Manufacturing and Distribution
- 1.5 By Enterprise Size
- 1.5.1 Enterprise
- 1.5.2 Mid-Market
- 1.5.3 SMB
- 1.6 By Country
- 1.6.1 United States
- 1.6.2 Canada
- 1.6.3 Rest of North America
Chapter 2 Introduction
- 2.1 Report Objectives and Scope
- 2.2 Product Definition and Industry Terminology
- 2.3 Market Inclusions and Exclusions
- 2.4 Research Process
- 2.4.1 Primary Research and Expert Interviews
- 2.4.2 Secondary Research and Source Review
- 2.4.3 Top-Down and Bottom-Up Estimation
- 2.4.4 Data Triangulation and Verification
- 2.5 Market Size Measurement Basis
- 2.5.1 2025: USD 3.14 billion → 2035: USD 7.86 billion
- 2.6 Historical and Forecast Reference Periods
- 2.6.1 Historical Period: 2018-2025
- 2.6.2 Base Year: 2025
- 2.6.3 Forecast Period: 2025-2035
- 2.7 Research Assumptions and Limitations
Chapter 3 Executive Summary
- 3.1 Market Snapshot and Key Findings
- 3.2 Base-Year Market Size, 2025
- 3.3 Forecast Market Size, 2035
- 3.4 Revenue and Volume Growth Outlook
- 3.5 Key Demand and Supply Indicators
- 3.6 Leading Market Segments
- 3.7 Fastest-Growing Market Opportunities
- 3.8 Regional Performance Highlights
- 3.9 Technology and Industry Transformation
- 3.10 Competitive Landscape Summary
- 3.11 Analyst View and Strategic Implications
Chapter 4 North America Sales Intelligence Market Trends and Developments
- 4.1 Historical Industry Development, 2018-2025
- 4.2 Recent Market Trends and Developments
- 4.3 Demand and Customer Behavior Trends
- 4.4 Technology and Product Innovation
- 4.5 Artificial Intelligence, Automation and Digitalization
- 4.6 Local Manufacturing and Supply Chain Realignment
- 4.7 Industry Partnerships, Mergers and Acquisitions
- 4.8 Sustainability and Circular Economy Developments
- 4.9 Government and Private Sector Investment Trends
- 4.10 Emerging Business Models and Commercialization
- 4.11 Industry Developments and Announcements
Chapter 5 North America Sales Intelligence Market Supply and Demand Analysis
- 5.1 Demand Trend and Consumption Analysis, 2018-2025
- 5.2 Demand Forecast, 2025-2035
- 5.3 Supply Chain Structure and Procurement Trends
- 5.4 Supply-Demand Gap and Bottlenecks
- 5.5 Import Dependence and Sourcing Structure
- 5.6 Regional Supply and Demand Concentration
Chapter 6 North America Sales Intelligence Market Pricing Analysis
- 6.1 Pricing Structure and Measurement
- 6.2 Historical Pricing Trends, 2018-2025
- 6.3 Pricing Outlook, 2025-2035
- 6.4 Pricing by Product and Market Segment
- 6.5 Geographic Pricing Differences
- 6.6 Key Input, Energy, Labor and Logistics Costs
- 6.7 Contract Pricing and Purchasing Models
- 6.8 Pricing Sensitivity and Competitive Positioning
- 6.9 Price, Margin and Profitability Implications
Chapter 7 North America Sales Intelligence Market Dynamics
- 7.1 Market Growth Drivers
- 7.1.1 Demand-Side Drivers
- 7.1.2 Technology and Innovation Drivers
- 7.1.3 Infrastructure and Investment Drivers
- 7.1.4 Regulatory and Policy Drivers
- 7.2 Market Restraints
- 7.2.1 Cost and Affordability Constraints
- 7.2.2 Technology and Adoption Barriers
- 7.2.3 Supply Chain and Operational Constraints
- 7.3 Market Challenges
- 7.3.1 Competitive Pressure and Margin Erosion
- 7.3.2 Skills, Infrastructure and Implementation Gaps
- 7.4 Emerging Market Opportunities
- 7.5 Market Dynamics Impact and Time-Horizon Assessment
Chapter 8 North America Sales Intelligence Value Chain Analysis
- 8.1 Industry Value Chain Overview
- 8.2 Upstream Suppliers and Critical Inputs
- 8.3 Technology and Component Providers
- 8.4 Manufacturing or Service Delivery
- 8.5 Distribution, Channel Partners and Integrators
- 8.6 Downstream Applications and End Users
- 8.7 Value Addition and Profit Pools
- 8.8 Vertical Integration and Outsourcing
- 8.9 Supplier Concentration and Risk
- 8.10 Supply Chain Localization and Resilience
Chapter 9 North America Sales Intelligence Market Regulations and Policies
- 9.1 Relevant Laws, Standards and Compliance Frameworks
- 9.2 Product, Service, Safety and Quality Requirements
- 9.3 Government Policies, Incentives and Subsidies
- 9.4 Imports, Exports and Trade Barriers
- 9.5 Public Procurement and Local Content Requirements
- 9.6 Data Protection, AI and Cybersecurity Compliance
- 9.7 Upcoming Policy Changes and Market Implications
Chapter 10 North America Sales Intelligence Market Hotspots and Opportunities
- 10.1 Market Opportunity Mapping and Growth Hotspots
- 10.2 High-Growth Applications and Customer Groups
- 10.3 Underserved Markets and White-Space Opportunities
- 10.4 Emerging Technology and Product Opportunities
- 10.5 New Capacity and Investment Hotspots
- 10.6 Market Entry and Expansion Opportunities
- 10.7 Distribution and Partnership Opportunities
- 10.8 Near-Term and Long-Term Commercial Potential
- 10.9 Opportunity Attractiveness and Execution Risks
Chapter 11 North America Sales Intelligence Market Outlook, 2025-2035
- 11.1 Market Size and Analysis
- 11.1.1 Revenue (Market Measurement: 2025: USD 3.14 billion → 2035: USD 7.86 billion)
- 11.1.2 Historical Market Size, 2018-2025
- 11.1.3 Base-Year Market Size, 2025
- 11.2 Market Forecast, 2025-2035
- 11.2.1 Revenue Forecast to 2035
- 11.2.2 CAGR and Year-on-Year Growth
- 11.2.3 Incremental Revenue Opportunity
- 11.3 Forecast Assumptions and Scenario Analysis
- 11.3.1 Base-Case Forecast
- 11.3.2 Optimistic and Conservative Scenarios
- 11.3.3 Technology, Pricing and Policy Sensitivities
- 11.4 Market Attractiveness and Growth Outlook
Chapter 12 North America Sales Intelligence Market Segmentation and Outlook
- 12.1 Segmentation Summary and Market Shares, 2025
- 12.2 Largest and Fastest-Growing Segments
- 12.3 By Solution Type - Market Size and Forecast, 2025-2035
- 12.3.1 Segment Definition and Scope
- 12.3.2 Historical Market Size, 2018-2025
- 12.3.3 Revenue Forecast, 2025-2035
- 12.3.4 Base-Year Market Share, 2025
- 12.3.5 Segment CAGR and Growth Drivers
- 12.3.6 Subsegment Market Size and Forecast
- 12.3.6.1 Contact and Company Intelligence
- 12.3.6.2 Revenue and Engagement Intelligence
- 12.3.6.3 Buyer Intent Data
- 12.3.6.4 Predictive Analytics and AI Scoring
- 12.3.7 Subsegment Pricing and Adoption Trends
- 12.3.8 Leading Suppliers and Competition
- 12.3.9 Regional Demand and Opportunities
- 12.4 By Application - Market Size and Forecast, 2025-2035
- 12.4.1 Segment Definition and Scope
- 12.4.2 Historical Market Size, 2018-2025
- 12.4.3 Revenue Forecast, 2025-2035
- 12.4.4 Base-Year Market Share, 2025
- 12.4.5 Segment CAGR and Growth Drivers
- 12.4.6 Subsegment Market Size and Forecast
- 12.4.6.1 Prospecting and Data Enrichment
- 12.4.6.2 Deal Execution and Coaching
- 12.4.6.3 Account Prioritization
- 12.4.7 Subsegment Pricing and Adoption Trends
- 12.4.8 Leading Suppliers and Competition
- 12.4.9 Regional Demand and Opportunities
- 12.5 By End-Use Industry - Market Size and Forecast, 2025-2035
- 12.5.1 Segment Definition and Scope
- 12.5.2 Historical Market Size, 2018-2025
- 12.5.3 Revenue Forecast, 2025-2035
- 12.5.4 Base-Year Market Share, 2025
- 12.5.5 Segment CAGR and Growth Drivers
- 12.5.6 Subsegment Market Size and Forecast
- 12.5.6.1 Information Technology and Telecommunications
- 12.5.6.2 Professional and Business Services
- 12.5.6.3 Banking, Financial Services and Insurance
- 12.5.6.4 Manufacturing and Distribution
- 12.5.7 Subsegment Pricing and Adoption Trends
- 12.5.8 Leading Suppliers and Competition
- 12.5.9 Regional Demand and Opportunities
- 12.6 By Enterprise Size - Market Size and Forecast, 2025-2035
- 12.6.1 Segment Definition and Scope
- 12.6.2 Historical Market Size, 2018-2025
- 12.6.3 Revenue Forecast, 2025-2035
- 12.6.4 Base-Year Market Share, 2025
- 12.6.5 Segment CAGR and Growth Drivers
- 12.6.6 Subsegment Market Size and Forecast
- 12.6.6.1 Enterprise
- 12.6.6.2 Mid-Market
- 12.6.6.3 SMB
- 12.6.7 Subsegment Pricing and Adoption Trends
- 12.6.8 Leading Suppliers and Competition
- 12.6.9 Regional Demand and Opportunities
- 12.7 By Country - Market Size and Forecast, 2025-2035
- 12.7.1 Segment Definition and Scope
- 12.7.2 Historical Market Size, 2018-2025
- 12.7.3 Revenue Forecast, 2025-2035
- 12.7.4 Base-Year Market Share, 2025
- 12.7.5 Segment CAGR and Growth Drivers
- 12.7.6 Subsegment Market Size and Forecast
- 12.7.6.1 United States
- 12.7.6.2 Canada
- 12.7.6.3 Rest of North America
- 12.7.7 Subsegment Pricing and Adoption Trends
- 12.7.8 Leading Suppliers and Competition
- 12.7.9 Regional Demand and Opportunities
- 12.8 Segment Growth Comparison
- 12.9 Segment Attractiveness and Priority Matrix
Chapter 13 North America Sales Intelligence End-Use and Application Market Outlook
- 13.1 End-Use Industry and Customer Demand Structure
- 13.2 Leading Applications and Customer Groups
- 13.3 End-Use Market Size, Share and Forecast
- 13.4 Major End-Use Industry Deep Dives
- 13.4.1 Customer Requirements and Use Cases
- 13.4.2 Demand and Replacement Cycles
- 13.4.3 Technical and Regulatory Considerations
- 13.4.4 Purchasing and Procurement Models
- 13.4.5 Leading Vendors and Distribution Channels
- 13.4.6 Forecast and Commercial Opportunities
- 13.5 Emerging Applications and Cross-Segment Demand
- 13.6 End-Use Industry Investment Priorities
Chapter 14 North America Sales Intelligence Geographic Market Outlook, 2025-2035
- 14.1 Regional Market Size and Country-Level Shares, 2025
- 14.2 Country Market Size Comparison, 2025
- 14.3 Country Market Forecasts, 2025-2035
- 14.4 Subregional Industrial and Demand Clusters
- 14.5 Intra-Regional Pricing and Cost Differences
- 14.6 Cross-Border Trade and Supply Networks
- 14.7 Regional Supply and Demand Balances
- 14.8 Country Opportunity Comparison and Prioritization
Note: Every listed country is covered on the structure shown under the first country.
Chapter 15 North America Sales Intelligence Technology, Innovation and Sustainability Outlook
- 15.1 Technology Landscape and Maturity
- 15.2 Product, Process and Service Innovation
- 15.3 AI, Automation and Digital Tools in the Industry
- 15.4 Technology Adoption and Performance Benchmarking
- 15.5 Innovation Pipeline and R&D Investment
- 15.6 Patent and Intellectual Property Trends
- 15.7 Energy Efficiency and Resource Management
- 15.8 Sustainability, Recycling and Circularity
- 15.9 Technology Roadmap, 2025-2035
- 15.10 Risks of Obsolescence and Technology Substitution
Chapter 16 North America Sales Intelligence Market Key Strategic Imperatives
- 16.1 Growth and Market Entry Priorities
- 16.2 High-Return Products and Segments
- 16.3 Pricing, Profitability and Cost Optimization
- 16.4 Technology Investment and Product Differentiation
- 16.5 Supply Chain Localization and Resilience
- 16.6 Distribution and Customer Acquisition
- 16.7 Partnership, Acquisition and Capacity Strategy
- 16.8 Regional Expansion Priorities
- 16.9 Short-, Medium- and Long-Term Actions
Chapter 17 Competition Outlook
- 17.1 Industry Competition Characteristics
- 17.2 Market Structure and Concentration
- 17.3 Market Share and Competitive Positioning, 2025
- 17.4 Company-Wise Revenue and Product Benchmarking
- 17.5 Production and Service Capacity Benchmarking
- 17.6 Technology, Pricing and Differentiation
- 17.7 Regional Footprint and Distribution Strength
- 17.8 Mergers, Acquisitions and Strategic Alliances
- 17.9 New Entrants and Competitive Threats
- 17.10 Porter's Five Forces and Industry Attractiveness
- 17.11 Competitive Outlook, 2025-2035
Chapter 18 Company Profiles
- 18.1 Company Coverage and Selection Criteria
- 18.2 ZoomInfo
- 18.2.1 Business Description
- 18.2.2 Company Ownership and Geographic Presence
- 18.2.3 Product and Service Portfolio
- 18.2.4 Manufacturing and Operating Footprint
- 18.2.5 Financial Performance and Investment
- 18.2.6 Market Share and Competitive Position
- 18.2.7 Technology and Innovation Capabilities
- 18.2.8 Strategic Alliances or Partnerships
- 18.2.9 Recent Developments
- 18.2.10 Growth Strategy and Outlook
- 18.3 Gong
- 18.4 Dun & Bradstreet
- 18.5 6sense
- 18.6 Other Relevant Market Participants
Note: Every listed company is profiled on the structure shown under the first company. The company list is preliminary and may change based on research findings, market developments, data availability and client requirements.
Chapter 19 Disclaimer
- 19.1 Research and Forecast Disclaimer
- 19.2 Data Source and Estimation Limitations
Note: The depth of individual sections depends on data availability for this market. Volume, capacity, trade and other unit-based metrics are included where applicable.

