
| REPORT ATTRIBUTE | DETAILS |
|---|---|
| Historical Period | 2019-2022 |
| Base Year | 2023 |
| Forecast Period | 2024-2032 |
| Multimodal Imaging Market Size 2023 | USD 2,697.89 million |
| Multimodal Imaging Market, CAGR | 3.88% |
| Multimodal Imaging Market Size 2032 | USD 3,988.37 million |
Market Overview:
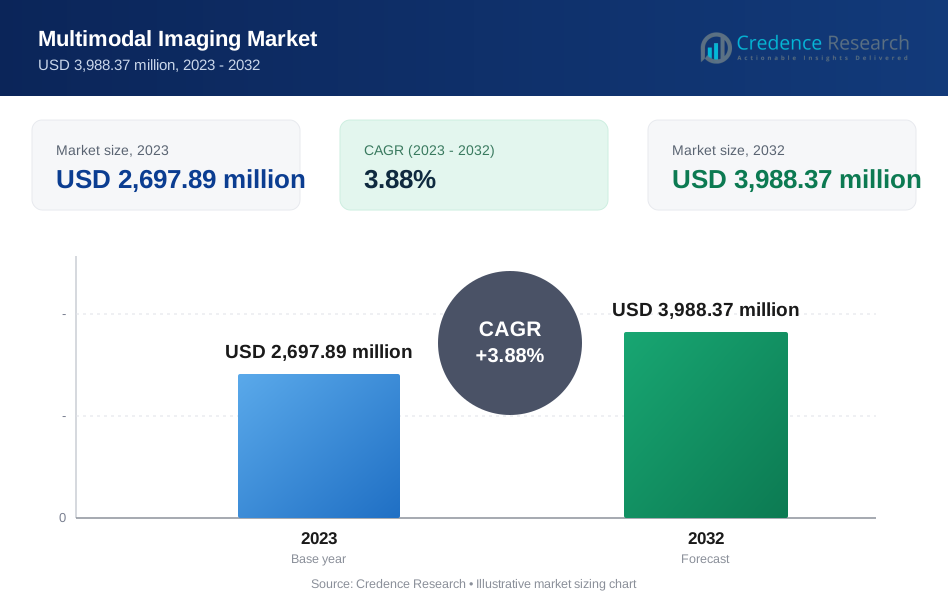
The multimodal imaging market is poised for significant growth, with projections indicating an increase from USD 2,697.89 million in 2023 to USD 3,988.37 million by 2032, reflecting a compound annual growth rate (CAGR) of 3.88%.
This growth trajectory is driven by several key factors, including the rising prevalence of chronic diseases such as cancer and cardiovascular disorders. These complex medical conditions often require a multi-dimensional diagnostic approach, making multimodal imaging indispensable for physicians seeking a comprehensive understanding of disease progression and effective treatment strategies.
Continuous technological advancements in imaging modalities like PET/CT, SPECT/CT, and PET/MR are driving market expansion by enhancing image quality, resolution, and accuracy. The integration of artificial intelligence (AI) and machine learning (ML) further refines analysis and interpretation, facilitating faster and more precise diagnoses. Moreover, there is a growing emphasis on early disease detection, supported by the benefits of multimodal imaging in detecting abnormalities at earlier stages, ultimately improving patient outcomes and reducing healthcare costs.
Emerging trends such as the development of novel multimodal imaging systems, integration with advanced software, and the rise of cloud-based solutions are shaping the market landscape. Manufacturers have opportunities to capitalize on these trends by investing in advanced multimodal imaging systems, targeting emerging markets, integrating AI and machine learning, and promoting awareness and education about the benefits of multimodal imaging. These initiatives align with the market’s steady expansion, driven by technological innovation and a growing focus on early disease detection and treatment.
The market’s growth is also supported by increased funding for research and development, as well as collaborations between academic institutions and industry players. These partnerships are fostering innovation and the development of new imaging technologies. Additionally, regulatory approvals and favourable reimbursement policies are facilitating the adoption of multimodal imaging systems in clinical settings.
As the market continues to evolve, stakeholders must focus on expanding their product portfolios, enhancing the capabilities of existing imaging systems, and ensuring cost-effectiveness. By addressing these areas, manufacturers can better meet the growing demand for multimodal imaging and contribute to improved patient care and outcomes. The future of the multimodal imaging market looks promising, with sustained growth driven by technological advancements and a commitment to early disease detection and treatment.
Market Drivers:
Rising Burden of Chronic Diseases:
The escalating prevalence of chronic diseases like cancer, cardiovascular disorders, and neurological conditions underscores the critical need for advanced diagnostic tools such as multimodal imaging. For instance, these conditions often necessitate comprehensive evaluations, making multimodal imaging invaluable. By integrating data from various modalities like X-ray, CT scan, MRI, and PET scan, multimodal imaging offers a comprehensive view of disease states, facilitating earlier diagnoses, precise treatment planning, and improved patient outcomes.
Technological Advancements and Innovation:
Continuous advancements in medical imaging technology are driving the growth of the multimodal imaging market. Manufacturers are continually innovating to introduce new imaging modalities, enhance existing ones, and improve data integration capabilities. Hybrid scanners, for instance, combine multiple modalities in a single unit, offering improved efficiency and patient comfort. Additionally, AI is revolutionizing the field by enabling faster image analysis, better image quality, and the development of CAD systems aiding healthcare professionals in making accurate diagnoses. The use of AI in multimodal imaging has been increasing over the past 5 years, with applications in diverse fields such as neuroscience, oncology, cardiology, and more. This integration of AI with multimodal imaging is expected to further drive the market growth.
Growing Geriatric Population and Increasing Healthcare Expenditure:
The rapid aging of the global population contributes to a higher demand for advanced diagnostic imaging techniques. As individuals age, they become more susceptible to chronic diseases, driving the need for multimodal imaging. This demographic trend, coupled with increasing healthcare expenditure worldwide, encourages healthcare institutions to invest in advanced imaging equipment. Governments and private organizations are allocating more resources to healthcare, facilitating the market's growth.
Favorable Reimbursement Policies and Focus on Early Diagnosis:
The recognition of multimodal imaging's value in improving patient outcomes and reducing healthcare costs has led to the implementation of favorable reimbursement policies. Governments and insurance companies are increasingly supporting multimodal imaging procedures, making them more accessible to patients. Moreover, the growing emphasis on early diagnosis propels market growth, as early detection significantly enhances treatment success rates and patient prognosis. Multimodal imaging plays a crucial role in achieving this goal, further driving its demand and adoption.
Market Trends:
Increasing Adoption in Cancer Diagnosis and Treatment:
Multimodal imaging plays a vital role in various stages of cancer management. For instance, the adoption of deep learning across healthcare domains, coupled with the availability of highly characterized cancer datasets, has accelerated research into the utility of deep learning in the analysis of the complex biology of cancer. This has led to the development of decision support tools that integrate different data types, including genomic, methylation, and transcriptomic data, as well as histopathology-based genomic inference. This widespread adoption is significantly propelling market growth.
Technological Advancements:
Continuous advancements in imaging techniques like PET/CT, SPECT/CT, and PET/MRI are revolutionizing the field. For example, recent developments in X-ray imaging-related technologies have led to the rapid development of high-performance X-ray detectors and associated imaging applications. These innovations offer improved diagnostic accuracy, better image resolution, and more precise functional information. This fosters a shift towards multimodal imaging, fueling market expansion.
Growing Focus on Minimally Invasive Procedures:
The rising demand for minimally invasive procedures is a significant growth factor. Multimodal imaging provides real-time guidance for surgeons during these procedures, leading to faster recovery times, reduced complications, and improved patient experiences. For instance, the expansion of Minimally Invasive Surgery (MIS) has been exponential since the introduction of laparoscopic surgery in the late 1980s. From 2003 to 2018, MIS representation increased in all studied procedures: cholecystectomy (88% to 94%), inguinal hernia repair (20% to 47%), appendectomy (38% to 93%), colectomy (8% to 43%), gastrectomy (43% to 84%), and Nissen (71% to 91%). This trend is expected to continue driving market demand.
Integration of Artificial Intelligence (AI):
The incorporation of AI in multimodal imaging analysis is a groundbreaking development. AI algorithms can analyze vast amounts of complex data from multiple modalities, enabling faster, more accurate diagnoses and personalized treatment plans. This integration creates significant growth opportunities within the multimodal imaging market.
Market Restraints and Challenges:
High Cost of Multimodal Imaging Systems:
A major barrier to entry is the substantial upfront investment required for multimodal imaging equipment. These systems combine various imaging modalities like PET/CT, SPECT/CT, and PET/MRI, each with its own associated cost. Additionally, the complexity of integrating multiple technologies translates to expensive specialized hardware, software, and ongoing maintenance to ensure optimal performance. This high cost can be prohibitive for some healthcare institutions, particularly in resource-limited settings, restricting access to this advanced technology.
Limited Availability of Skilled Professionals:
Operating and interpreting data from multimodal imaging systems requires specialized training and expertise. A lack of adequately trained technicians and radiologists can significantly limit the utilization of these sophisticated systems. This creates a bottleneck, especially in regions where investment in advanced training programs hasn't kept pace with technological advancements.
Regulatory Hurdles and Reimbursement Issues:
Regulatory processes for approving new multimodal imaging technologies can be lengthy and complex, delaying their availability to patients. Additionally, reimbursement policies from insurance companies may not adequately cover the cost of multimodal imaging procedures, creating a financial disincentive for both healthcare providers and patients. This complex regulatory landscape and potential burden on healthcare budgets can impede the market's growth.
Data Integration and Management Challenges:
Multimodal imaging generates vast amounts of complex data from different modalities. Effectively integrating and managing this data to create a comprehensive picture requires robust IT infrastructure and specialized software. Furthermore, ensuring data security and privacy for these sensitive patient records presents another challenge. Addressing these data management issues is crucial for maximizing the clinical value of multimodal imaging.
Limited Awareness and Potential for Misuse:
Despite the advantages of multimodal imaging, there's a need for increased awareness among both healthcare professionals and patients regarding its appropriate use. Overutilization or improper use for non-indicated conditions can inflate healthcare costs and potentially expose patients to unnecessary radiation. Raising awareness and establishing clear guidelines for appropriate use are crucial for optimizing the benefits of multimodal imaging.
Recent Developments:
- In May 2023, St. Luke's University Health Network chooses GE HealthCare for a USD 30 million purchase of state-of-the-art CT technology, incorporating the power of Artificial Intelligence.
- In March 2023, Philips and the Champalimaud Foundation collaborate to achieve a 50% reduction in the carbon footprint of their diagnostic imaging operations within the next five years.
- In November 2022, Canon Inc. revealed its plans to form a new subsidiary called Canon Healthcare USA, Inc. With this strategic move, Canon intends to enhance its position within the influential American medical market and expedite the expansion of its medical business.
- In April 2022, the enhanced partnership between GE HealthCare and Sinopharm focuses on the development and commercialization of medical equipment designed to meet the specific healthcare requirements of China.
Segmentation Analysis:
Technology:
- PET/CT: This widely used technology combines anatomical imaging (CT) with functional imaging (PET) to provide detailed information on both structure and metabolic activity.
- SPECT/CT: Similar to PET/CT, SPECT/CT combines Single-Photon Emission Computed Tomography (SPECT) with CT, offering valuable insights into specific molecular processes.
- PET/MR: This emerging technology combines PET with Magnetic Resonance Imaging (MRI), providing superior soft tissue contrast and functional information compared to PET/CT.
- Others: This segment includes a range of evolving technologies like OCT/FMT (Optical Coherence Tomography/Fluorescence Molecular Tomography) with growing applications in specific areas.
By Application
Key applications of multimodal imaging include:
- Clinical Applications: Multimodal imaging is extensively used in the diagnosis and management of various diseases, including oncology, cardiology, neurology, and orthopaedics.
- Preclinical Research: Multimodal imaging plays a crucial role in drug development, allowing researchers to study disease mechanisms and evaluate therapeutic efficacy in animal models.
By End User
The primary end users of multimodal imaging systems are:
- Hospitals: Hospitals are the largest end users, as they utilize multimodal imaging for patient diagnosis, treatment planning, and monitoring.
- Diagnostic Imaging Centres: Standalone diagnostic imaging centres are increasingly adopting multimodal imaging technologies to provide comprehensive diagnostic services.
- Academic and Research Institutes: Universities and research institutes use multimodal imaging for advanced research in various fields, such as molecular biology and drug discovery.
Segments:
By Technology
- PET/CT
- PET/MR
- SPECT/CT
- OCT/FMT
- Other multimodal imaging
By Application
- Brain & Neurology
- Cardiology
- Oncology
- Ophthalmology
- Research Applications
- Other Applications
By End User
- Hospitals
- Diagnostic Imaging Centers
- Research and Academic Institutes
- Other End Users
By Region
- North America
- US
- Canada
- Europe
- Germany
- France
- UK
- Italy
- Spain
- Rest of Europe
- Asia Pacific
- Japan
- China
- India
- Australia
- South Korea
- Rest of Asia Pacific
- Latin America
- Brazil
- Mexico
- Rest of Latin America
- Middle East and Africa
Key player:
- Bruker Corp.
- Spectrum Dynamics Medical Inc.
- Nipro Corp.
- PerkinElmer Inc.
- Shanghai United Imaging Healthcare Co. Ltd.
- Engineering GmbH
- Koninklijke Philips NV
- Mediso Ltd.
- Canon Inc.
- Carl Zeiss AG
- MILabs BV
- MR Solutions Ltd.
- General Electric Co.
- Heidelberg
- Neusoft Medical Systems Co. Ltd.
- Siemens AG
- Topcon Corp.
- TriFoil Imaging
Regional Analysis:
North America:
Currently holding the dominant position in the multimodal imaging market, North America is anticipated to maintain its lead throughout the forecast period. This dominance can be attributed to factors like well-established healthcare infrastructure, significant investments in research and development, and a high prevalence of chronic diseases. The region boasts a large patient population willing to adopt advanced medical technologies, further propelling market growth.
Asia Pacific:
This region is expected to witness the fastest growth rate in the multimodal imaging market due to several factors. Rising disposable income levels, increasing government investments in healthcare infrastructure, and a growing geriatric population with chronic illnesses are driving demand for advanced diagnostic imaging techniques. Additionally, the presence of a large patient pool and a burgeoning medical device manufacturing industry contribute to the regional market's potential.
Europe:
Europe represents a mature market for multimodal imaging due to its well-developed healthcare systems and high adoption rates of advanced technologies. However, stringent regulatory frameworks and cost-containment measures might hinder the market's growth to some extent.
Rest of the World:
This region, encompassing Latin America, the Middle East, and Africa, is expected to experience moderate growth. Developing economies within this region are witnessing advancements in healthcare infrastructure and rising investments in medical technologies. However, factors like limited access to advanced healthcare facilities and budgetary constraints may pose challenges.
Future Outlook:
- Multimodal imaging's ability to provide comprehensive data will be increasingly sought after for earlier and more accurate diagnoses across various medical conditions.
- AI integration will significantly enhance image analysis, interpretation, and workflow efficiency, leading to faster and more precise diagnoses.
- Advancements in existing modalities like PET/CT and the development of novel techniques will broaden the scope of applications and improve image quality.
- Multimodal imaging's ability to personalize treatment plans will be instrumental in the rise of precision medicine approaches.
- The growing elderly population with a higher prevalence of chronic diseases will drive demand for multimodal imaging for accurate diagnosis and treatment monitoring.
- Multimodal imaging will play a crucial role in early cancer detection, staging, treatment planning, and monitoring therapy response in oncology.
- The growing preference for minimally invasive procedures will propel the use of multimodal imaging for image-guided surgeries and interventions.
- Increasing healthcare spending in developing countries will fuel market growth for multimodal imaging equipment.
- Favorable reimbursement policies and streamlined regulatory pathways for novel multimodal imaging technologies will be critical for market expansion.
- Increased awareness among both healthcare professionals and patients regarding the benefits of multimodal imaging will drive wider adoption.
Request a Free Sample
Fill in your details and we'll send you a free sample report.
- Sample data tables & charts
- Research methodology
Need a Custom Version of This Report?
Tailor the scope, geography, or segments to your exact requirements.
- Custom geography or segment scope
- Direct access to our analyst team
Frequently Asked Questions
What is the projected growth of the multimodal imaging market?
What factors are driving the growth of the multimodal imaging market?
How do technological advancements impact the multimodal imaging market?
What emerging trends are shaping the multimodal imaging market?
Table of Content
Chapter 1. Report Introduction
- 1.1 Report Description & Purpose
- 1.1.1 Report Title & Market Definition
- 1.1.2 Unique Selling Propositions (USP) & Key Differentiators
- 1.1.3 Value Proposition for Stakeholders
- 1.2 Research Objectives
- 1.2.1 Market Sizing Objectives (Volume & Revenue) (Volume Where Applicable)
- 1.2.2 Segmentation Objectives
- 1.2.3 Competitive Intelligence Objectives
- 1.2.4 Forecast & Scenario Objectives
- 1.3 Report Scope
- 1.3.1 Multimodal Imaging Scope – Segments & Subsegments Covered
- 1.3.2 Geographic Scope – Regions & Countries Covered
- 1.3.3 Historical Period, Base Year & Forecast Period (2023; forecast to 2032)
- 1.3.4 Inclusions & Exclusions
- 1.4 Industry Classification & Applicable Codes
- 1.5 Currency, Measurement Units & Valuation Basis
- 1.6 Target Stakeholders
- 1.7 Limitations & Assumptions
Chapter 2. Executive Summary
- 2.1 Global Multimodal Imaging Market Snapshot
- 2.1.1 Market Size – Historical (2023) & Forecast (2023-2032) (2023: USD 2,697.89 million → 2032: USD 3,988.37 million)
- 2.1.2 Volume & Revenue – Global Totals (Volume Where Applicable)
- 2.1.3 Key Market Highlights – Top Five Facts
- 2.2 Multimodal Imaging Market Segmentation Snapshot
- 2.2.1 Market Split by Region – 2023 vs. 2032
- 2.3 Competitive Snapshot
- 2.3.1 Top 10 Players by Revenue Share – 2023
- 2.3.2 Top 10 Players by Volume Share – 2023 (Volume Where Applicable)
- 2.3.3 Recent Strategic Developments (18-Month Summary)
- 2.4 Key Investment Highlights & Strategic Conclusions
Chapter 3. Multimodal Imaging Market Dynamics & Industry Analysis
- 3.1 Market Overview & Context
- 3.1.1 Multimodal Imaging Market Position in the Broader Industry Value Chain
- 3.1.2 Demand Structure & Purchasing Dynamics
- 3.1.3 Market Maturity & Development Stage by Region
- 3.2 Multimodal Imaging Market Drivers
- 3.3 Multimodal Imaging Market Restraints & Challenges
- 3.4 Multimodal Imaging Market Opportunities
- 3.5 Porter's Five Forces Analysis
- 3.5.1 Threat of New Entrants
- 3.5.2 Bargaining Power of Suppliers
- 3.5.3 Bargaining Power of Buyers
- 3.5.4 Threat of Substitutes
- 3.5.5 Competitive Rivalry – Intensity Assessment
- 3.6 Multimodal Imaging Value Chain Analysis
- 3.6.1 Upstream – Key Inputs, Resources & Suppliers
- 3.6.1.1 Key Input/Resource 1
- 3.6.1.2 Key Input/Resource 2
- 3.6.1.3 Key Input/Resource 3
- 3.6.2 Midstream – Core Operations & Value Creation
- 3.6.2.1 Operating Model & Process Overview
- 3.6.2.2 Key Operating Locations & Capabilities by Company
- 3.6.3 Downstream – Market Channels & End Users
- 3.6.3.1 Direct Sales & Customer Engagement Channels
- 3.6.3.2 Indirect Sales, Intermediaries & Partner Channels
- 3.6.4 Value Chain Profitability Analysis
- 3.6.1 Upstream – Key Inputs, Resources & Suppliers
- 3.7 PESTEL Analysis
- 3.7.1 Political Factors
- 3.7.2 Economic Factors
- 3.7.3 Social Factors
- 3.7.4 Technological Factors
- 3.7.5 Environmental Factors
- 3.7.6 Legal Factors
- 3.8 Multimodal Imaging Supply Chain Analysis
- 3.8.1 Critical Input & Resource Availability Risk Assessment
- 3.8.2 Supplier & Operational Concentration Risk (Geographic Exposure)
- 3.8.3 Supply & Service Disruption Impact Analysis
- 3.9 Regulatory & Policy Landscape
Note: The regulatory and policy landscape section covers regulations based on their applicability to the market, Multimodal Imaging category, geography, and scope of the study. Only regulatory frameworks with a material impact on operations, compliance, trade, sustainability, or market access are analyzed in detail.
Chapter 4. Key Investment Pockets & Opportunity Analysis
- 4.1 Multimodal Imaging Market Attractiveness Analysis
- 4.1.1 By Region – Investment Attractiveness Matrix (Market Size × CAGR)
- 4.2 Absolute Revenue Growth Opportunity
- 4.2.1 By Region – Absolute Revenue Growth Through 2032
- 4.3 Incremental Demand Opportunity
- 4.3.1 By Region – Incremental Demand Through 2032
- 4.3.2 Segment – Incremental Demand
- 4.4 Emerging Submarket Opportunity Deep Dive (Subject to Applicability)
- 4.5 Priority Market Opportunity Scorecards
- 4.5.1 United States
- 4.5.2 Europe
- 4.5.3 Asia
- 4.5.4 Middle East & Africa
Note: Priority market opportunity scorecards reflect the geographic scope and strategic relevance of the study. Listed markets are indicative and may be adapted to the industry.
Chapter 5. Multimodal Imaging Cross-Border Trade & Market Access Analysis
- 5.1 International Trade & Cross-Border Activity Overview
- 5.1.1 Global Export Value by Country (2023)
- 5.1.2 Global Export Volume by Country (2023) (Volume Where Applicable)
- 5.1.3 Global Import Value by Country (2023)
- 5.1.4 Global Import Volume by Country (2023) (Volume Where Applicable)
- 5.1.5 Net Trade Balance by Country (2023)
- 5.2 Export Analysis – Segment
- 5.2.1 Category 1 (Applicable Classification Code)
- 5.2.2 Category 2 (Applicable Classification Code)
- 5.2.3 Category 3 (Applicable Classification Code)
- 5.2.4 Category 4 (Applicable Classification Code)
- 5.2.5 Category 5 (Applicable Classification Code)
- 5.3 Import Analysis – Segment
- 5.3.1 Category 1 (Applicable Classification Code)
- 5.3.2 Category 2 (Applicable Classification Code)
- 5.3.3 Category 3 (Applicable Classification Code)
- 5.3.4 Category 4 (Applicable Classification Code)
- 5.3.5 Category 5 (Applicable Classification Code)
- 5.4 Cross-Border Pricing & Transaction Benchmarks
- 5.4.1 Export Pricing – Segment & Country
- 5.4.2 Import Pricing – Segment & Source Country
- 5.4.3 Price Trends (2023)
- 5.5 Key Cross-Border Trade & Delivery Routes
- 5.5.1 Cross-Border Trade/Delivery Route 1
- 5.5.2 Cross-Border Trade/Delivery Route 2
- 5.5.3 Cross-Border Trade/Delivery Route 3
- 5.5.4 Cross-Border Trade/Delivery Route 4
- 5.5.5 Cross-Border Trade/Delivery Route 5
- 5.6 Trade Policy & Market Access Impact Assessment
- 5.6.1 Tariff & Non-Tariff Barriers
- 5.6.2 Regional Trade & Economic Integration Frameworks
- 5.6.3 Bilateral & Multilateral Trade Agreements
- 5.6.4 Cross-Border Operating, Licensing & Localization Requirements
Note: This chapter applies where cross-border trade or delivery is relevant to Multimodal Imaging. Goods, services, and digital offerings are assessed using applicable classifications and transaction measures. Import-export volumes, trade balances, and route analyses are included only where meaningful to the market.
Chapter 6. Competitive Landscape & Company Benchmarking
- 6.1 Multimodal Imaging Market Concentration & Structure
- 6.1.1 Herfindahl-Hirschman Index (HHI) – vs. 2023
- 6.1.2 Leading, Mid-Sized & Emerging Player Structure
- 6.1.3 Global, Regional & Local Player Dynamics
- 6.2 Multimodal Imaging Market Share Analysis – 2023
- 6.2.1 Global Revenue Share by Company
- 6.2.2 Global Volume Share by Company (Volume Where Applicable)
- 6.2.3 Regional Revenue Share
- 6.2.4 Market Share Evolution ( vs. 2023)
- 6.2.5 Company Market Share by Key Segment
- 6.2.6 Company Market Share by Customer Group
- 6.3 Operating Scale, Capacity & Infrastructure Analysis
- 6.3.1 Global Operating Scale & Supply Capacity
- 6.3.2 Resource Utilization & Operating Efficiency
- 6.3.3 Output, Service Delivery & Activity Metrics
- 6.3.4 Operating Footprint & Infrastructure Map
- 6.3.5 Planned Operational & Capacity Expansion
- 6.4 Multimodal Imaging Competitive Benchmarking Matrix
- 6.4.1 Revenue, Growth, Profitability & Operating Metric Comparison
- 6.4.2 Channel Revenue Mix
- 6.4.3 Geographic Revenue Exposure
- 6.4.4 R&D Intensity
- 6.4.5 Sustainability Maturity
- 6.5 Strategic Developments in Multimodal Imaging (Last 24 Months)
- 6.5.1 Mergers, Acquisitions & Divestments
- 6.5.2 New Products, Services & Solutions in Multimodal Imaging
- 6.5.3 Operational & Infrastructure Expansions
- 6.5.4 Strategic Alliances, Joint Ventures & Partnerships
- 6.5.5 Distribution Expansion & Market Entry
- 6.5.6 Sustainability & ESG Initiatives
- 6.6 Competitive Strategy Mapping
- 6.6.1 Leader, Challenger, Follower & Niche Classification
- 6.6.2 Pricing Strategy Comparison
- 6.6.3 Channel Strategy Matrix
Note: Strategic developments are included based on their materiality and the availability of reliable information.
Chapter 7. Global Multimodal Imaging Market – By Sales & Delivery Channel
- 7.1 Segment Overview
- 7.1.1 Volume & Revenue Split by Channel (2023 & 2032) (Volume Where Applicable)
- 7.1.2 Channel Mix Evolution (2023-2032)
Chapter 8. Regional Market Analysis – Global Overview
- 8.1 Global Regional Overview
- 8.1.1 Regional Volume Share (Volume Where Applicable)
- 8.1.2 Regional Revenue Share
- 8.1.3 Regional Volume by Region (Volume Where Applicable)
- 8.1.4 Regional Revenue by Region
- 8.1.5 Regional Forecast Through 2032
- 8.2 Cross-Regional Segment Analysis
- 8.2.1 By Sales & Delivery Channel
- 8.2.2 By Competitive Positioning & Price Tier
Chapter 9. North America Multimodal Imaging Market
- 9.1 United States
- 9.2 Canada
- 9.3 Mexico
Chapter 10. Europe Multimodal Imaging Market
- 10.1 Germany
- 10.2 France
- 10.3 Italy
- 10.4 United Kingdom
- 10.5 Spain
- 10.6 Poland
- 10.7 Russia
- 10.8 Netherlands
- 10.9 Belgium
- 10.10 Sweden
- 10.11 Denmark
- 10.12 Norway
- 10.13 Rest of Europe
Chapter 11. Asia Pacific Multimodal Imaging Market
- 11.1 China
- 11.2 India
- 11.3 Japan
- 11.4 South Korea
- 11.5 Thailand
- 11.6 Indonesia
- 11.7 Vietnam
- 11.8 Malaysia
- 11.9 Australia
- 11.10 Rest of Asia Pacific
Chapter 12. Latin America Multimodal Imaging Market
- 12.1 Brazil
- 12.2 Argentina
- 12.3 Colombia
- 12.4 Chile
- 12.5 Rest of Latin America
Chapter 13. Middle East Multimodal Imaging Market
- 13.1 Saudi Arabia
- 13.2 United Arab Emirates
- 13.3 Turkey
- 13.4 Israel
- 13.5 Iran
- 13.6 Rest of the Middle East
Chapter 14. Africa Multimodal Imaging Market
- 14.1 South Africa
- 14.2 Egypt
- 14.3 Nigeria
- 14.4 Morocco
- 14.5 Rest of Africa
Chapter 15. Multimodal Imaging Company Profiles
- 15.1 [Company 01]
- 15.1.1 Company Overview
- 15.1.2 Key Management Personnel
- 15.1.3 Products & Services Portfolio
- 15.1.4 Financial Performance
- 15.1.5 Key Market Focus & Geographic Presence
- 15.1.6 Recent Developments & Strategic Initiatives
Note: The company profile list is preliminary and may change based on research findings, market developments, data availability, and client requirements.
Chapter 16. Appendices
- Appendix A – List of Abbreviations & Acronyms
- Appendix B – Industry Classification Code Reference – Full Series
- Appendix C – Supply, Output & Operating Capacity Data Tables
- Appendix D – End-Use & Demand Base Tables
- Appendix E – Demand, Adoption & Usage Assumptions
- Appendix F – Pricing & Revenue Metric Reference Tables
- Appendix G – Company Operations & Infrastructure Database
- Appendix H – Cross-Border Trade & Activity Data Tables (Where Applicable)
- Appendix I – Regulatory Summary Tables
- Appendix J – Primary Research Participant List (Anonymized)
- Appendix K – Primary Research Questionnaire Framework
- Appendix L – Data Sources & Bibliography
- Appendix M – Market Size Divergence & Source Comparison
Chapter 17. Research Methodology
- 17.1 Research Framework & Philosophy
- 17.2 Secondary Research – Sources, Hierarchy & Data Extraction
- 17.3 Data Modeling – Bottom-Up & Top-Down Market Sizing
- 17.4 Primary Research – Stakeholder Framework, LOI & Sample Sizes
- 17.5 Forecast Methodology – Regression, Scenario & Sensitivity Analysis
- 17.6 Quality Control – Four-Layer Validation Framework
- 17.7 Limitations & Standard Assumptions
- 17.8 Disclaimer
