Diagnostic Imaging Centers Market Overview:
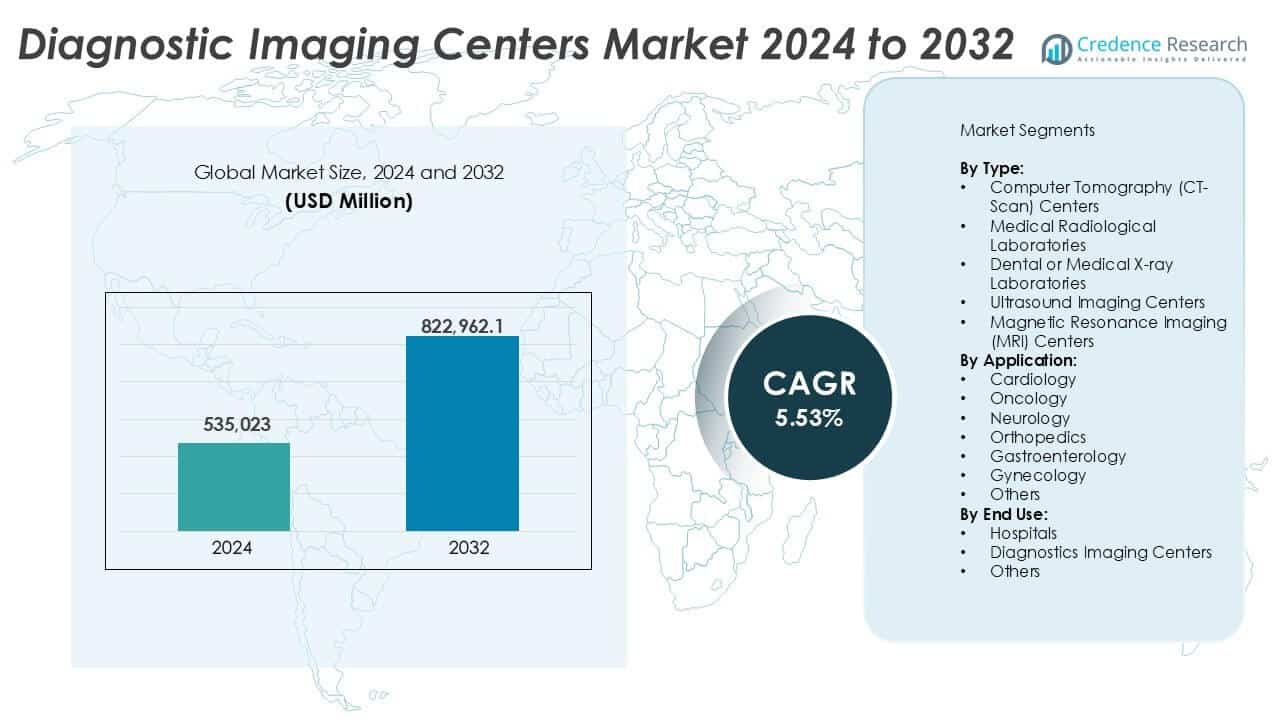
The Diagnostic Imaging Centers Market was valued at USD 535,023 million in 2024 and is anticipated to reach USD 822,962.1 million by 2032, at a CAGR of 5.53% during the forecast period.
| REPORT ATTRIBUTE | DETAILS |
|---|---|
| Historical Period | 2020-2023 |
| Base Year | 2024 |
| Forecast Period | 2025-2032 |
| Diagnostic Imaging Centers Market Size 2024 | USD 535,023 million |
| Diagnostic Imaging Centers Market, CAGR | 5.53% |
| Diagnostic Imaging Centers Market Size 2032 | USD 822,962.1 million |
The is led by key players such as Siemens Healthineers, General Electric Company, Fujifilm Holdings Corporation, Samsung Medison Co. Ltd., and Hologic Inc. These companies dominate through advanced imaging technologies, broad product portfolios, and strong service networks. SimonMed/Dignity Health and Medical Imaging Corp. strengthen competition with expanding outpatient imaging centers across urban regions. Carestream Health Inc., Hitachi Medical Corporation, and Shimadzu Corporation contribute to innovation in digital radiology and ultrasound. North America holds the leading regional position, accounting for 38% of the global market share in 2024. The region’s dominance stems from widespread chronic disease prevalence, high diagnostic imaging adoption, and strong reimbursement frameworks.
Diagnostic Imaging Centers Market Insights
- The Diagnostic Imaging Centers market was valued at USD 535,023 million in 2024 and is projected to reach USD 822,962.1 million by 2032, growing at a CAGR of 5.53%.
- Rising chronic diseases, an aging population, and demand for early diagnosis are major drivers fueling imaging service utilization.
- AI integration in MRI and CT systems, along with the growth of teleradiology, is reshaping diagnostic imaging workflows and expanding access.
- Key players include Siemens Healthineers, GE Healthcare, Fujifilm, Samsung Medison, and Hologic, who compete on innovation, accuracy, and patient-centered services.
- North America led the market with 38% share, followed by Europe at 26% and Asia Pacific at 21%. By type, MRI centers held the dominant share due to broad applications in neurology and oncology. Hospitals led the end-use segment due to advanced infrastructure and high patient volumes.
Diagnostic Imaging Centers Market Segmentation Analysis:
By Type
Magnetic Resonance Imaging (MRI) Centers held the largest market share in 2024 among all type segments. MRI centers are preferred due to their ability to provide high-resolution imaging for soft tissues, brain, and spinal cord diagnostics without radiation exposure. Growing use in neurology, orthopedics, and oncology strengthens their dominance. Rising chronic disease cases and aging populations further push demand for precise diagnosis. Advanced MRI units with faster scan times and 3D capabilities enhance throughput and patient comfort, encouraging adoption in both urban hospitals and standalone facilities.
- For instance, Siemens Healthineers maintains an installed base of over 25,000 MAGNETOM MRI systems worldwide as of 2024–2025. The company’s MAGNETOM Free.Max system utilizes Deep Resolve AI-based image reconstruction to reduce scan times by up to 50% per sequence, while its myExam Companion automation supports higher patient volumes and simplified workflows in standalone MRI centers.
By Application
Oncology emerged as the leading application segment, accounting for the highest share in 2024. Cancer diagnostics require repeated and high-precision imaging, driving reliance on MRI, CT scans, and PET modalities. The rising global cancer burden, especially breast, lung, and colorectal cancers, fuels imaging demand. Early detection protocols and follow-up assessments further expand utilization. Government-led screening programs and increasing access to private cancer care centers contribute to segment growth. Integration of AI in oncology imaging also aids faster diagnosis and personalized treatment planning.
- For instance, GE HealthCare uses AI-enabled oncology imaging software that is deployed globally across thousands of hospitals. Its Edison platform is designed to integrate large-scale data and apply advanced analytics to generate insights, which helps to improve lesion detection (with tools like Precision DL) and increase workflow speed for cancer care providers.
By End Use
Hospitals dominated the end-use segment with the highest market share in 2024. Their access to comprehensive diagnostic infrastructure, skilled radiologists, and advanced imaging equipment makes them the preferred choice for complex cases. Hospitals also handle high patient volumes, including emergency and critical care imaging. Strategic investments in imaging suites within multi-specialty and tertiary hospitals drive adoption. Integration with electronic health records (EHRs) and centralized reporting systems enhances workflow efficiency. Expansion of public hospital infrastructure in emerging economies supports further market penetration.
Diagnostic Imaging Centers Market Key Growth Drivers
Rising Chronic Disease Prevalence and Aging Population
The rising burden of chronic diseases significantly drives demand for diagnostic imaging services. Conditions such as cardiovascular disorders, cancer, diabetes, and neurological issues require regular imaging for diagnosis, treatment planning, and monitoring. An aging global population adds to the need for frequent diagnostic evaluations, particularly for osteoporosis, stroke, and age-related degenerative conditions. According to WHO, non-communicable diseases account for over 70% of global deaths, emphasizing the need for scalable diagnostic capacity. Imaging centers offer rapid, non-invasive evaluation tools that help physicians detect diseases early and manage them more effectively. As life expectancy increases, the dependency on advanced imaging techniques continues to grow. This demographic shift not only boosts imaging procedure volumes but also encourages investment in modern imaging infrastructure by hospitals and private providers.
- For instance, Philips Healthcare reported that its products and solutions improved the lives of approximately 1.96 billion people in 2024, with a goal of reaching 2.5 billion lives annually by 2030.
Technological Advancements in Imaging Modalities
Innovations in imaging technologies significantly enhance diagnostic accuracy, speed, and patient safety. High-resolution imaging systems, 3D/4D ultrasound, digital X-ray, and AI-enabled MRI and CT scanners enable faster detection of abnormalities while reducing scan times. The integration of artificial intelligence and machine learning supports automated image analysis, tumor detection, and workflow optimization. These advancements reduce reporting time and improve diagnostic confidence. Portable and point-of-care imaging units expand access in remote and emergency settings. For instance, low-dose CT and silent MRI improve patient comfort and safety. Such innovations attract hospitals and diagnostic centers aiming to differentiate their service offerings. As demand rises for minimally invasive and early diagnostic tools, adoption of next-gen imaging systems accelerates, driving market growth. Equipment leasing options and vendor-financed solutions also make high-end imaging technology accessible to mid-size centers.
- For instance, by 2025, Canon Medical Systems has surpassed a global footprint of over 18,000 Aquilion series CT systems. Its flagship Aquilion ONE platform supports whole-organ imaging in a single rotation by utilizing a 320-row detector that captures 16 centimeters of anatomical coverage.
Growing Demand for Preventive and Personalized Healthcare
A global shift toward preventive healthcare is pushing demand for early-stage diagnostics and routine health screening. Imaging centers benefit from this trend as advanced modalities detect subtle anatomical and physiological changes before symptoms arise. Preventive screening programs for breast cancer (mammography), cardiovascular disease (cardiac CT), and lung cancer (low-dose CT) are becoming standard practice across developed and emerging nations. Personalized medicine also demands precise imaging insights to tailor therapies based on individual anatomy or tumor characteristics. Diagnostic imaging plays a central role in tracking treatment efficacy and adjusting regimens in real time. This trend aligns with value-based care models, where improved patient outcomes are prioritized over procedure volumes. As governments, employers, and insurers invest more in wellness and screening, imaging centers are well-positioned to capture growing preventive care demand.
Diagnostic Imaging Centers Market Key Trends & Opportunities
Integration of Artificial Intelligence in Diagnostic Imaging
Artificial intelligence (AI) is reshaping the diagnostic imaging landscape by streamlining interpretation and enhancing clinical accuracy. AI-powered algorithms assist in rapid image segmentation, anomaly detection, and prioritization of critical cases, reducing radiologist workload. Solutions like computer-aided detection (CAD) are now integrated across MRI, CT, and mammography systems. AI also aids in reconstructing sharper images from fewer scans, lowering radiation exposure. Cloud-based PACS (Picture Archiving and Communication Systems) combined with AI analytics support remote diagnostics and second opinions. The increasing availability of FDA-cleared AI tools encourages adoption across small and mid-sized imaging centers. As reimbursement models begin to recognize AI-supported workflows, this trend opens up new revenue channels for vendors. It also creates a competitive edge for early adopters offering faster, more accurate imaging services.
- For instance, Aidoc had its FDA-cleared AI solutions deployed in over 1,200 hospitals by 2024. The platform analyzed more than 30 million medical imaging scans annually, flagging critical findings such as intracranial hemorrhage and pulmonary embolism within minutes.
Expansion of Teleradiology and Remote Diagnostics
Teleradiology is emerging as a crucial enabler in extending imaging services beyond urban areas. It allows diagnostic imaging centers to transmit medical images to offsite radiologists for interpretation, overcoming the shortage of specialized professionals in rural or underserved regions. The growing availability of high-speed internet and secure cloud platforms facilitates real-time collaboration between imaging technicians and remote experts. This model is especially beneficial during emergencies, night shifts, or in facilities with low patient volumes. Global outsourcing of radiology services is also increasing due to cost-effectiveness and time-zone advantages. Diagnostic imaging centers adopting teleradiology gain scalability, wider coverage, and better turnaround times. It creates opportunities to tap new markets and optimize radiologist resources. Regulatory support and advances in cybersecurity further strengthen the potential of this trend.
Diagnostic Imaging Centers Market Key Challenges
High Capital and Operational Costs
Establishing and operating diagnostic imaging centers requires significant financial investment. High-end imaging equipment such as MRI, PET-CT, and digital radiography units involve large upfront capital costs. Ongoing expenses include equipment maintenance, calibration, licensing fees, and compliance with safety and radiation standards. Trained staff, including radiologists, technicians, and IT professionals, further increase the cost burden. Smaller clinics and centers often struggle to match the technological capabilities of larger hospitals due to budget constraints. In price-sensitive markets, cost recovery from each scan is low, extending the break-even period. Additionally, reimbursement delays or low insurance coverage for advanced imaging reduce profitability. These challenges limit market entry and expansion, especially for standalone and independent imaging providers.
Regulatory Compliance and Data Security Concerns
Diagnostic imaging centers must navigate complex regulatory environments related to radiation safety, data privacy, and equipment certification. Compliance with guidelines from authorities such as the FDA, AERB, HIPAA, and other local health departments is mandatory but resource-intensive. Any deviation can lead to penalties, suspension, or loss of accreditation. With increasing digitization, medical image storage and sharing raise cybersecurity concerns. Breaches of patient health data can damage a center's reputation and result in legal consequences. Maintaining secure PACS and protecting systems from ransomware or unauthorized access require continuous IT upgrades. For smaller providers, implementing robust cybersecurity and compliance frameworks remains a persistent challenge, limiting their ability to scale operations digitally.
Diagnostic Imaging Centers Market Regional Analysis
North America
North America accounted for the largest share of the Diagnostic Imaging Centers market in 2024, holding approximately 38% of global revenue. The region benefits from advanced healthcare infrastructure, strong reimbursement frameworks, and high diagnostic imaging adoption. The U.S. leads the region due to its high chronic disease burden, rapid technology uptake, and growing preference for preventive care. Presence of leading imaging equipment manufacturers and AI integration further accelerates market growth. Canada also contributes with expanding public-private diagnostic partnerships. Continued investments in outpatient imaging centers and demand for low-radiation modalities support sustained regional dominance through 2032.
Europe
Europe held around 26% share of the global market in 2024, driven by robust healthcare systems, favorable screening programs, and an aging population. Germany, the UK, and France lead due to widespread use of CT, MRI, and ultrasound imaging in chronic care management. EU regulations mandate high imaging standards, supporting quality investments in digital radiology. The region’s focus on early cancer detection and cross-border health services also drives imaging volumes. Public-private collaborations and AI-enhanced teleradiology services expand rural reach. Europe's steady adoption of digital workflows positions it for moderate yet consistent growth.
Asia Pacific
Asia Pacific emerged as the fastest-growing region, with a market share of 21% in 2024, projected to rise steadily through 2032. Rapid urbanization, expanding middle-class populations, and increased healthcare spending fuel demand across India, China, and Southeast Asia. Governments invest heavily in diagnostics infrastructure to improve rural access and early disease detection. Private imaging chains expand aggressively in metro and tier-2 cities. China leads in imaging unit deployment, while India sees rising demand for ultrasound and X-ray modalities. Local manufacturing and AI partnerships support affordable imaging solutions, making Asia Pacific a key growth hub.
Latin America
Latin America captured about 8% of the global Diagnostic Imaging Centers market in 2024. Brazil and Mexico are the primary contributors due to improving healthcare access and increasing chronic disease prevalence. The region benefits from public diagnostic screening campaigns, especially for cancer and maternal health. However, high equipment costs and limited reimbursement policies restrict wider access to advanced imaging like MRI and CT in rural zones. Private diagnostic chains continue to grow in urban areas, supported by regional partnerships and portable imaging solutions. Market growth remains steady, driven by rising awareness and improved insurance coverage.
Middle East & Africa
The Middle East & Africa region held a 7% market share in 2024, with potential for growth in select economies. Gulf nations such as the UAE and Saudi Arabia invest in advanced diagnostic infrastructure as part of healthcare transformation plans. These countries offer high adoption of MRI and CT technologies, supported by international hospital collaborations. In contrast, sub-Saharan Africa faces limited access due to cost and workforce shortages. Growth is primarily driven by mobile imaging units and government-led screening initiatives. Efforts to boost medical tourism and digital imaging will support gradual expansion across the region.
Diagnostic Imaging Centers Market Segmentations:
By Type:
- Computer Tomography (CT-Scan) Centers
- Medical Radiological Laboratories
- Dental or Medical X-ray Laboratories
- Ultrasound Imaging Centers
- Magnetic Resonance Imaging (MRI) Centers
By Application:
- Cardiology
- Oncology
- Neurology
- Orthopedics
- Gastroenterology
- Gynecology
- Others
By End Use:
- Hospitals
- Diagnostics Imaging Centers
- Others
By Geography
- North America
- U.S.
- Canada
- Mexico
- Europe
- Germany
- France
- U.K.
- Italy
- Spain
- Rest of Europe
- Asia Pacific
- China
- Japan
- India
- South Korea
- South-east Asia
- Rest of Asia Pacific
- Latin America
- Brazil
- Argentina
- Rest of Latin America
- Middle East & Africa
- GCC Countries
- South Africa
- Rest of the Middle East and Africa
Competitive Landscape
The Diagnostic Imaging Centers market features a mix of multinational corporations, regional providers, and specialized imaging service networks. Key players such as Siemens Healthineers, General Electric Company, Fujifilm Holdings Corporation, and Samsung Medison Co. Ltd. dominate through their integrated imaging equipment and diagnostics service portfolios. These companies maintain a competitive edge through continuous innovation in AI-powered imaging, radiation dose reduction, and 3D imaging technologies. Service providers like SimonMed/Dignity Health and Medical Imaging Corp. expand their presence through strategic acquisitions and outpatient center growth. Carestream Health, Hitachi Medical Corporation, and Hologic Inc. focus on modality-specific excellence, especially in women's health and portable imaging. The market is highly competitive, with pricing pressure in emerging regions and strong brand loyalty in developed markets. Partnerships with hospitals, equipment leasing models, and turnkey imaging solutions further shape competition. Vendors invest heavily in digital platforms, teleradiology integration, and patient-centric services to retain and expand their customer base.
Key Player Analysis
- Carestream Health Inc.
- Fujifilm Holdings Corporation
- General Electric Company
- Hitachi Medical Corporation
- Hologic Inc.
- Medical Imaging Corp.
- Samsung Medison Co. Ltd.
- Shimadzu Corporation
- Siemens
- SimonMed/Dignity Health
Recent Developments
- In March 2025, Bunkerhill Health and Cleerly partnered to advance noninvasive cardiovascular care using AI-powered coronary CT angiography.
- In January 2025, Sutter Health signed a seven-year strategic imaging partnership with GE HealthCare covering PET/CT, SPECT/CT, MRI, CT, X-ray, and ultrasound platforms.
- In November 2024, GE HealthCare and RadNet collaborated to integrate SmartMammo AI into GE’s Senographe Pristina mammography system.
Report Coverage
The research report offers an in-depth analysis based on Type, Application, End-Use and Geography. It details leading market players, providing an overview of their business, product offerings, investments, revenue streams, and key applications. Additionally, the report includes insights into the competitive environment, SWOT analysis, current market trends, as well as the primary drivers and constraints. Furthermore, it discusses various factors that have driven market expansion in recent years. The report also explores market dynamics, regulatory scenarios, and technological advancements that are shaping the industry. It assesses the impact of external factors and global economic changes on market growth. Lastly, it provides strategic recommendations for new entrants and established companies to navigate the complexities of the market.
Future Outlook
- Demand for advanced imaging centers will grow with the rising focus on early disease detection.
- AI-powered diagnostic tools will enhance image interpretation speed and accuracy.
- Outpatient imaging centers will expand rapidly in urban and semi-urban regions.
- Portable and point-of-care imaging devices will see higher adoption in rural areas.
- Integration of imaging systems with electronic health records will improve clinical workflows.
- Teleradiology services will expand to bridge the gap in radiologist availability.
- Low-dose and non-invasive imaging technologies will gain preference among patients and clinicians.
- Investment in specialized imaging for oncology, cardiology, and neurology will increase.
- Regulatory focus on safety, privacy, and quality assurance will shape service models.
- Strategic collaborations between hospitals, diagnostic firms, and tech providers will drive innovation.

Request a Free Sample
Fill in your details and we'll send you a free sample report.
- Sample data tables & charts
- Research methodology
Market Dynamics
Rising Chronic Disease Prevalence and Aging Population
The increasing incidence of chronic diseases such as cancer, cardiovascular disorders, and neurological conditions, combined with a growing elderly population, is driving demand for frequent and advanced diagnostic imaging services for early detection and ongoing management.
Technological Advancements in Imaging Modalities
Continuous innovation in imaging technologies, including AI-enabled MRI and CT systems, 3D/4D ultrasound, and digital radiology, is improving diagnostic accuracy, reducing scan times, and enhancing patient comfort, prompting healthcare providers to upgrade and expand imaging capabilities.
Expansion of Preventive and Personalized Healthcare
A global shift toward preventive care and personalized medicine is increasing the need for early-stage diagnostics and routine health screenings, positioning imaging centers as essential providers for proactive disease management and tailored treatment planning.
Integration of Artificial Intelligence and Teleradiology
The adoption of AI-powered image analysis and teleradiology platforms is streamlining workflows, enabling faster and more accurate interpretations, and expanding access to expert diagnostics in underserved and remote regions.
Growth in Outpatient and Standalone Imaging Centers
The rise of outpatient and standalone imaging centers, particularly in urban and semi-urban areas, is making advanced diagnostic services more accessible and convenient, supporting higher procedure volumes and market expansion.
Need a Custom Version of This Report?
Tailor the scope, geography, or segments to your exact requirements.
- Custom geography or segment scope
- Direct access to our analyst team
Frequently Asked Questions
What is the current market size for the Diagnostic Imaging Centers market, and what is its projected size in 2032?
At what Compound Annual Growth Rate is the Diagnostic Imaging Centers market projected to grow between 2024 and 2032?
Which Diagnostic Imaging Centers market segment held the largest share in 2024?
What are the primary factors fueling the growth of the Diagnostic Imaging Centers market?
Who are the leading companies in the Diagnostic Imaging Centers market?
Which region commanded the largest share of the Diagnostic Imaging Centers market in 2024?
Table of Content
Chapter 1 Market Segmentation
- 1.1 Segmentation Framework
- 1.1.1 Product and Service Classification
- 1.1.2 Application and End-Use Classification
- 1.1.3 Technology and Solution Classification
- 1.1.4 Customer and Distribution Channel Classification
- 1.1.5 Geographic Segmentation
- 1.1.6 Market Segment Definitions and Boundaries
- 1.2 By Type
- 1.2.1 Computer Tomography (CT-Scan) Centers
- 1.2.2 Medical Radiological Laboratories
- 1.2.3 Dental or Medical X-ray Laboratories
- 1.2.4 Ultrasound Imaging Centers
- 1.2.5 Magnetic Resonance Imaging (MRI) Centers
- 1.3 By End Use
- 1.3.1 Hospitals
- 1.3.2 Diagnostics Imaging Centers
- 1.3.3 Others
- 1.4 By Application
- 1.4.1 Cardiology
- 1.4.2 Oncology
- 1.4.3 Neurology
- 1.4.4 Orthopedics
- 1.4.5 Gastroenterology
- 1.4.6 Gynecology
- 1.4.7 Others
Chapter 2 Introduction
- 2.1 Report Objectives and Scope
- 2.2 Product Definition and Industry Terminology
- 2.3 Market Inclusions and Exclusions
- 2.4 Research Process
- 2.4.1 Primary Research and Expert Interviews
- 2.4.2 Secondary Research and Source Review
- 2.4.3 Top-Down and Bottom-Up Estimation
- 2.4.4 Data Triangulation and Verification
- 2.5 Market Size Measurement Basis
- 2.5.1 2024: USD 535,023 million → 2032: USD 822,962.1 million
- 2.6 Historical and Forecast Reference Periods
- 2.6.1 Base Year: 2024
- 2.6.2 Forecast Period: 2024-2032
- 2.7 Research Assumptions and Limitations
Chapter 3 Executive Summary
- 3.1 Market Snapshot and Key Findings
- 3.2 Base-Year Market Size, 2024
- 3.3 Forecast Market Size, 2032
- 3.4 Revenue and Volume Growth Outlook
- 3.5 Key Demand and Supply Indicators
- 3.6 Leading Market Segments
- 3.7 Fastest-Growing Market Opportunities
- 3.8 Regional Performance Highlights
- 3.9 Technology and Industry Transformation
- 3.10 Competitive Landscape Summary
- 3.11 Analyst View and Strategic Implications
Chapter 4 Global Diagnostic Imaging Centers Market Trends and Developments
- 4.1 Historical Industry Development
- 4.2 Recent Market Trends and Developments
- 4.3 Demand and Customer Behavior Trends
- 4.4 Technology and Product Innovation
- 4.5 Artificial Intelligence, Automation and Digitalization
- 4.6 Local Manufacturing and Supply Chain Realignment
- 4.7 Industry Partnerships, Mergers and Acquisitions
- 4.8 Sustainability and Circular Economy Developments
- 4.9 Government and Private Sector Investment Trends
- 4.10 Emerging Business Models and Commercialization
- 4.11 Industry Developments and Announcements
Chapter 5 Global Diagnostic Imaging Centers Market Production, Supply and Demand Analysis
- 5.1 Demand Trend and Consumption Analysis
- 5.2 Demand Forecast, 2024-2032
- 5.3 Production and Output Trend
- 5.4 Production and Output Forecast, 2024-2032
- 5.5 Installed Capacity and Capacity Utilization
- 5.6 Company-Wise Production Plants and Statistics
- 5.6.1 Installed Production Capacity
- 5.6.2 Actual Production
- 5.6.3 Planned Capacity and Expansion Targets
- 5.7 Supply Chain Structure and Procurement Trends
- 5.8 Supply-Demand Gap and Bottlenecks
- 5.9 Import Dependence and Sourcing Structure
- 5.10 Contract Manufacturing and Outsourcing
- 5.11 Regional Supply and Demand Concentration
Chapter 6 Global Diagnostic Imaging Centers Market Pricing Analysis
- 6.1 Pricing Structure and Measurement
- 6.2 Historical Pricing Trends
- 6.3 Pricing Outlook, 2024-2032
- 6.4 Average Selling Price and Unit Economics
- 6.5 Pricing by Product and Market Segment
- 6.6 Geographic Pricing Differences
- 6.7 Key Input, Energy, Labor and Logistics Costs
- 6.8 Contract Pricing and Purchasing Models
- 6.9 Pricing Sensitivity and Competitive Positioning
- 6.10 Price, Margin and Profitability Implications
Chapter 7 Global Diagnostic Imaging Centers Market Dynamics
- 7.1 Market Growth Drivers
- 7.1.1 Demand-Side Drivers
- 7.1.2 Technology and Innovation Drivers
- 7.1.3 Infrastructure and Investment Drivers
- 7.1.4 Regulatory and Policy Drivers
- 7.2 Market Restraints
- 7.2.1 Cost and Affordability Constraints
- 7.2.2 Technology and Adoption Barriers
- 7.2.3 Supply Chain and Operational Constraints
- 7.3 Market Challenges
- 7.3.1 Competitive Pressure and Margin Erosion
- 7.3.2 Skills, Infrastructure and Implementation Gaps
- 7.4 Emerging Market Opportunities
- 7.5 Market Dynamics Impact and Time-Horizon Assessment
Chapter 8 Global Diagnostic Imaging Centers Value Chain Analysis
- 8.1 Industry Value Chain Overview
- 8.2 Upstream Suppliers and Critical Inputs
- 8.3 Technology and Component Providers
- 8.4 Manufacturing or Service Delivery
- 8.5 Distribution, Channel Partners and Integrators
- 8.6 Downstream Applications and End Users
- 8.7 Value Addition and Profit Pools
- 8.8 Vertical Integration and Outsourcing
- 8.9 Supplier Concentration and Risk
- 8.10 Supply Chain Localization and Resilience
Chapter 9 Global Diagnostic Imaging Centers Market Regulations and Policies
- 9.1 Relevant Laws, Standards and Compliance Frameworks
- 9.2 Product, Service, Safety and Quality Requirements
- 9.3 Government Policies, Incentives and Subsidies
- 9.4 Imports, Exports and Trade Barriers
- 9.5 Public Procurement and Local Content Requirements
- 9.6 Environmental and Sustainability Compliance
- 9.7 Upcoming Policy Changes and Market Implications
Chapter 10 Global Diagnostic Imaging Centers Market Hotspots and Opportunities
- 10.1 Market Opportunity Mapping and Growth Hotspots
- 10.2 High-Growth Applications and Customer Groups
- 10.3 Underserved Markets and White-Space Opportunities
- 10.4 Emerging Technology and Product Opportunities
- 10.5 New Capacity and Investment Hotspots
- 10.6 Market Entry and Expansion Opportunities
- 10.7 Distribution and Partnership Opportunities
- 10.8 Near-Term and Long-Term Commercial Potential
- 10.9 Opportunity Attractiveness and Execution Risks
Chapter 11 Global Diagnostic Imaging Centers Market Outlook, 2024-2032
- 11.1 Market Size and Analysis
- 11.1.1 Revenue (Market Measurement: 2024: USD 535,023 million → 2032: USD 822,962.1 million)
- 11.1.2 Market Volume and Quantity Sold
- 11.1.3 Historical Market Size
- 11.1.4 Base-Year Market Size, 2024
- 11.2 Market Forecast, 2024-2032
- 11.2.1 Revenue Forecast to 2032
- 11.2.2 Volume Forecast to 2032
- 11.2.3 CAGR and Year-on-Year Growth
- 11.2.4 Incremental Revenue Opportunity
- 11.3 Forecast Assumptions and Scenario Analysis
- 11.3.1 Base-Case Forecast
- 11.3.2 Optimistic and Conservative Scenarios
- 11.3.3 Technology, Pricing and Policy Sensitivities
- 11.4 Market Attractiveness and Growth Outlook
Chapter 12 Global Diagnostic Imaging Centers Market Segmentation and Outlook
- 12.1 Segmentation Summary and Market Shares, 2024
- 12.2 Largest and Fastest-Growing Segments
- 12.3 By Type - Market Size and Forecast, 2024-2032
- 12.3.1 Segment Definition and Scope
- 12.3.2 Historical Market Size
- 12.3.3 Revenue Forecast, 2024-2032
- 12.3.4 Volume Forecast, 2024-2032
- 12.3.5 Base-Year Market Share, 2024
- 12.3.6 Segment CAGR and Growth Drivers
- 12.3.7 Subsegment Market Size and Forecast
- 12.3.7.1 Computer Tomography (CT-Scan) Centers
- 12.3.7.2 Medical Radiological Laboratories
- 12.3.7.3 Dental or Medical X-ray Laboratories
- 12.3.7.4 Ultrasound Imaging Centers
- 12.3.7.5 Magnetic Resonance Imaging (MRI) Centers
- 12.3.8 Subsegment Pricing and Adoption Trends
- 12.3.9 Leading Suppliers and Competition
- 12.3.10 Regional Demand and Opportunities
- 12.4 By End Use - Market Size and Forecast, 2024-2032
- 12.4.1 Segment Definition and Scope
- 12.4.2 Historical Market Size
- 12.4.3 Revenue Forecast, 2024-2032
- 12.4.4 Volume Forecast, 2024-2032
- 12.4.5 Base-Year Market Share, 2024
- 12.4.6 Segment CAGR and Growth Drivers
- 12.4.7 Subsegment Market Size and Forecast
- 12.4.7.1 Hospitals
- 12.4.7.2 Diagnostics Imaging Centers
- 12.4.7.3 Others
- 12.4.8 Subsegment Pricing and Adoption Trends
- 12.4.9 Leading Suppliers and Competition
- 12.4.10 Regional Demand and Opportunities
- 12.5 By Application - Market Size and Forecast, 2024-2032
- 12.5.1 Segment Definition and Scope
- 12.5.2 Historical Market Size
- 12.5.3 Revenue Forecast, 2024-2032
- 12.5.4 Volume Forecast, 2024-2032
- 12.5.5 Base-Year Market Share, 2024
- 12.5.6 Segment CAGR and Growth Drivers
- 12.5.7 Subsegment Market Size and Forecast
- 12.5.7.1 Cardiology
- 12.5.7.2 Oncology
- 12.5.7.3 Neurology
- 12.5.7.4 Orthopedics
- 12.5.7.5 Gastroenterology
- 12.5.7.6 Gynecology
- 12.5.7.7 Others
- 12.5.8 Subsegment Pricing and Adoption Trends
- 12.5.9 Leading Suppliers and Competition
- 12.5.10 Regional Demand and Opportunities
- 12.6 Segment Growth Comparison
- 12.7 Segment Attractiveness and Priority Matrix
Chapter 13 Global Diagnostic Imaging Centers End-Use and Application Market Outlook
- 13.1 End-Use Industry and Customer Demand Structure
- 13.2 Leading Applications and Customer Groups
- 13.3 End-Use Market Size, Share and Forecast
- 13.4 Major End-Use Industry Deep Dives
- 13.4.1 Customer Requirements and Use Cases
- 13.4.2 Demand and Replacement Cycles
- 13.4.3 Technical and Regulatory Considerations
- 13.4.4 Purchasing and Procurement Models
- 13.4.5 Leading Vendors and Distribution Channels
- 13.4.6 Forecast and Commercial Opportunities
- 13.5 Emerging Applications and Cross-Segment Demand
- 13.6 End-Use Industry Investment Priorities
Chapter 14 Global Diagnostic Imaging Centers Geographic Market Outlook, 2024-2032
- 14.1 Regional Market Size and Share, 2024
- 14.2 Regional Market Forecast, 2024-2032
- 14.3 Regional Pricing, Production and Demand Differences
- 14.4 North America
- 14.4.1 United States
- 14.4.2 Canada
- 14.4.3 Mexico
- 14.5 Europe
- 14.5.1 Germany
- 14.5.2 France
- 14.5.3 Italy
- 14.5.4 United Kingdom
- 14.5.5 Spain
- 14.5.6 Poland
- 14.5.7 Russia
- 14.5.8 Netherlands
- 14.5.9 Belgium
- 14.5.10 Sweden
- 14.5.11 Denmark
- 14.5.12 Norway
- 14.5.13 Rest of Europe
- 14.6 Asia Pacific
- 14.6.1 China
- 14.6.2 India
- 14.6.3 Japan
- 14.6.4 South Korea
- 14.6.5 Thailand
- 14.6.6 Indonesia
- 14.6.7 Vietnam
- 14.6.8 Malaysia
- 14.6.9 Australia
- 14.6.10 Rest of Asia Pacific
- 14.7 Latin America
- 14.7.1 Brazil
- 14.7.2 Argentina
- 14.7.3 Colombia
- 14.7.4 Chile
- 14.7.5 Rest of Latin America
- 14.8 Middle East
- 14.8.1 Saudi Arabia
- 14.8.2 United Arab Emirates
- 14.8.3 Turkey
- 14.8.4 Israel
- 14.8.5 Iran
- 14.8.6 Rest of the Middle East
- 14.9 Africa
- 14.9.1 South Africa
- 14.9.2 Egypt
- 14.9.3 Nigeria
- 14.9.4 Morocco
- 14.9.5 Rest of Africa
- 14.10 Regional Investment, Policy and Supply Chain Differences
- 14.11 Regional Competitive Landscape
- 14.12 Geographic Growth Hotspots
Chapter 15 Global Diagnostic Imaging Centers Technology, Innovation and Sustainability Outlook
- 15.1 Technology Landscape and Maturity
- 15.2 Product, Process and Service Innovation
- 15.3 AI, Automation and Digital Tools in the Industry
- 15.4 Technology Adoption and Performance Benchmarking
- 15.5 Innovation Pipeline and R&D Investment
- 15.6 Patent and Intellectual Property Trends
- 15.7 Energy Efficiency and Resource Management
- 15.8 Sustainability, Recycling and Circularity
- 15.9 Technology Roadmap, 2024-2032
- 15.10 Risks of Obsolescence and Technology Substitution
Chapter 16 Global Diagnostic Imaging Centers Market Key Strategic Imperatives
- 16.1 Growth and Market Entry Priorities
- 16.2 High-Return Products and Segments
- 16.3 Pricing, Profitability and Cost Optimization
- 16.4 Technology Investment and Product Differentiation
- 16.5 Supply Chain Localization and Resilience
- 16.6 Distribution and Customer Acquisition
- 16.7 Partnership, Acquisition and Capacity Strategy
- 16.8 Regional Expansion Priorities
- 16.9 Short-, Medium- and Long-Term Actions
Chapter 17 Competition Outlook
- 17.1 Industry Competition Characteristics
- 17.2 Market Structure and Concentration
- 17.3 Market Share and Competitive Positioning, 2024
- 17.4 Company-Wise Revenue and Product Benchmarking
- 17.5 Production and Service Capacity Benchmarking
- 17.6 Technology, Pricing and Differentiation
- 17.7 Regional Footprint and Distribution Strength
- 17.8 Mergers, Acquisitions and Strategic Alliances
- 17.9 New Entrants and Competitive Threats
- 17.10 Porter's Five Forces and Industry Attractiveness
- 17.11 Competitive Outlook, 2024-2032
Chapter 18 Company Profiles
- 18.1 Company Coverage and Selection Criteria
- 18.2 Siemens Healthineers
- 18.2.1 Business Description
- 18.2.2 Company Ownership and Geographic Presence
- 18.2.3 Product and Service Portfolio
- 18.2.4 Manufacturing and Operating Footprint
- 18.2.5 Production Capacity and Expansion Plans
- 18.2.6 Financial Performance and Investment
- 18.2.7 Market Share and Competitive Position
- 18.2.8 Technology and Innovation Capabilities
- 18.2.9 Strategic Alliances or Partnerships
- 18.2.10 Recent Developments
- 18.2.11 Growth Strategy and Outlook
- 18.3 General Electric Company (GE Healthcare)
- 18.4 Fujifilm Holdings Corporation
- 18.5 Samsung Medison Co. Ltd.
- 18.6 Hologic Inc.
- 18.7 SimonMed/Dignity Health
- 18.8 Medical Imaging Corp.
- 18.9 Carestream Health Inc.
- 18.10 Hitachi Medical Corporation
- 18.11 Shimadzu Corporation
- 18.12 Other Relevant Market Participants
Note: Every listed company is profiled on the structure shown under the first company. The company list is preliminary and may change based on research findings, market developments, data availability and client requirements.
Chapter 19 Disclaimer
- 19.1 Research and Forecast Disclaimer
- 19.2 Data Source and Estimation Limitations
Note: The depth of individual sections depends on data availability for this market. Volume, capacity, trade and other unit-based metrics are included where applicable.