
Market Overview:
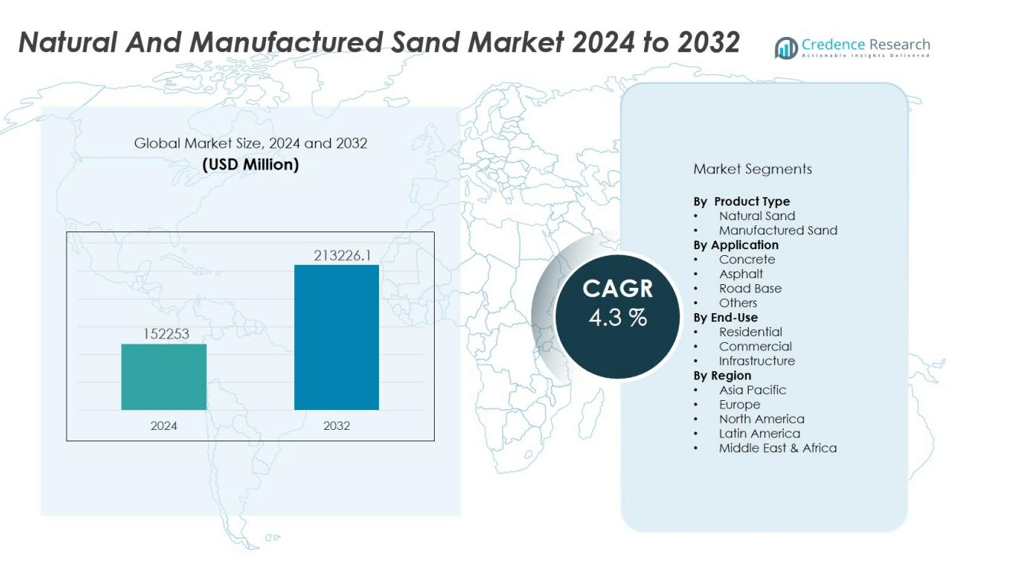
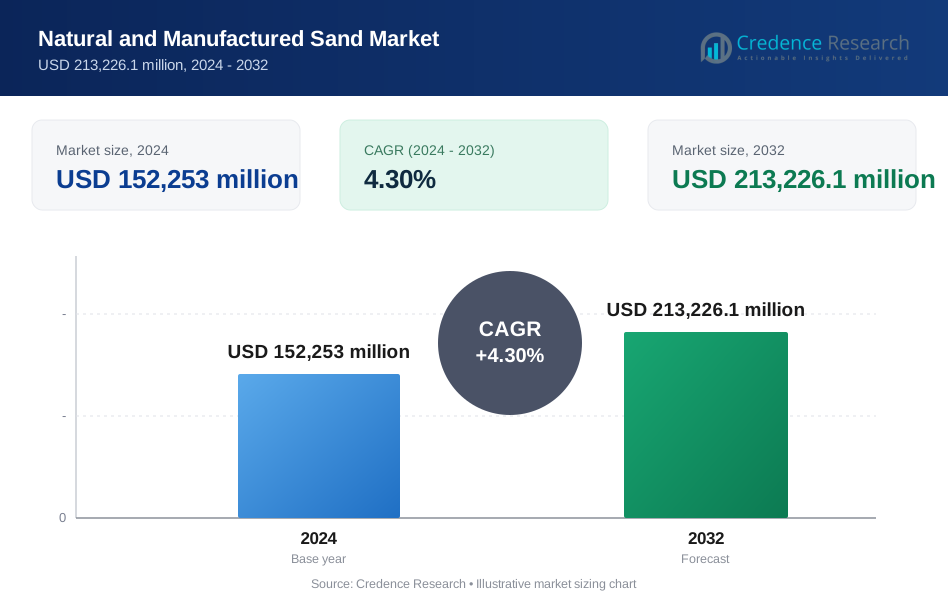
The natural and manufactured sand market size was valued at USD 152253 million in 2024 and is anticipated to reach USD 213226.1 million by 2032, at a CAGR of 4.3% during the forecast period (2024-2032).
| REPORT ATTRIBUTE | DETAILS |
|---|---|
| Historical Period | 2020-2023 |
| Base Year | 2024 |
| Forecast Period | 2025-2032 |
| Natural and Manufactured Sand Market Size 2024 | USD 152253 million |
| Natural and Manufactured Sand Market, CAGR | 4.3% |
| Natural and Manufactured Sand Market Size 2032 | USD 213226.1 million |
Market growth is fueled by rapid urbanization, increasing residential and commercial construction activities, and large-scale infrastructure development projects. The adoption of manufactured sand is further supported by its consistent quality, cost efficiency, and suitability for high-strength concrete applications. Government initiatives promoting sustainable mining practices and eco-friendly building materials are also accelerating market adoption. Technological advancements in sand processing equipment enhance production efficiency and quality, strengthening the market outlook.
Regionally, Asia-Pacific dominates the natural and manufactured sand market due to extensive construction activities in China, India, and Southeast Asia, coupled with high infrastructure spending. North America shows steady growth, supported by highway rehabilitation and urban redevelopment projects, while Europe is driven by strict environmental regulations and a focus on sustainable construction material.
Market Insights:
- The natural and manufactured sand market was valued at USD 152,253 million in 2024 and is projected to reach USD 213,226.1 million by 2032, reflecting a CAGR of 4.3%.
- Rapid urbanization and large-scale infrastructure projects worldwide are creating sustained demand for high-quality sand in concrete, asphalt, and other construction applications.
- Strict environmental regulations on natural sand mining are accelerating the shift toward manufactured sand, favored for its quality consistency and suitability for high-strength concrete.
- Technological advancements in crushing, screening, and washing equipment are improving production efficiency, ensuring uniform particle size and reducing impurities.
- Rising adoption of eco-friendly construction practices and government promotion of sustainable building materials are boosting demand for manufactured sand.
- Asia-Pacific leads with 56% market share, driven by major construction activity in China, India, and Southeast Asia, followed by North America at 18% and Europe at 15%.
- High production costs, logistical constraints, and regulatory compliance requirements remain key challenges, but growing investment in advanced processing facilities is expected to enhance supply reliability and market competitiveness.
Market Drivers:
Rapid Infrastructure Development and Urban Expansion Driving Sand Demand:
The natural and manufactured sand market is witnessing robust demand due to accelerated urbanization and large-scale infrastructure projects worldwide. Expanding residential, commercial, and industrial construction activities require high-quality sand for concrete, asphalt, and other building materials. Governments are prioritizing transportation networks, smart cities, and renewable energy infrastructure, further increasing consumption. This growth trend is particularly strong in emerging economies, where urban populations are rapidly increasing and housing demand is surging.
- For instance, CDE Global commissioned two EvoWash hydrocyclone sand-washing plants in Qatar, each processing 1,200 t/h of manufactured sand to meet stringent specifications for major urban developments.
Regulatory Restrictions on Natural Sand Mining Encouraging Manufactured Sand Adoption:
Stringent regulations on river sand extraction to protect ecosystems are encouraging the shift toward manufactured sand. It offers consistent quality, controlled gradation, and higher strength, making it suitable for modern construction needs. Builders and contractors are adopting manufactured sand to comply with environmental guidelines while meeting project specifications. The availability of advanced crushing and screening technologies supports efficient large-scale production.
Technological Advancements in Sand Processing Enhancing Quality and Efficiency:
Technological improvements in sand manufacturing and washing equipment are significantly improving efficiency, quality, and cost-effectiveness. Automation, precision screening, and advanced washing systems ensure uniform particle size, reduced impurities, and better workability in concrete mixes. These advancements are enabling suppliers to meet growing demand without compromising standards. It is also allowing producers to expand their reach in competitive construction markets.
- For instance, Collier Materials in Texas increased their production of C-33 spec sand by 50% and significantly reduced plant footprint after installing a CDE sand washing system.
Growing Emphasis on Sustainable and Eco-Friendly Construction Practices:
The increasing focus on sustainable construction is fueling demand for manufactured sand as an environmentally responsible alternative. Using crushed rock and quarry by-products reduces dependency on limited natural sand resources. Governments and industry bodies are promoting eco-friendly building materials, encouraging widespread acceptance. This shift aligns with global green building certifications and supports long-term environmental preservation goals.
Market Trends:
Rising Preference for Manufactured Sand in High-Performance Construction Applications:
The natural and manufactured sand market is experiencing a marked shift toward manufactured sand due to its consistent quality and suitability for high-strength concrete. Construction companies are increasingly relying on it for projects that demand precise particle size and improved durability, such as skyscrapers, bridges, and industrial facilities. Regulatory pressure on natural sand extraction is further accelerating this transition. Market participants are expanding production capacities and investing in modern crushing technologies to ensure supply reliability. The use of manufactured sand is also aligning with cost optimization strategies by reducing wastage and enhancing mix efficiency. This trend is expected to gain momentum in both developed and emerging construction markets.
- For instance, Heidelberg Materials Australia commissioned a 120 tonne-per-hour Kayasand VSI plant at Bass Point Quarry, achieving consistent particle grading with less than 1% fines under 75 µm and enabling up to two-thirds replacement of natural sand.
Integration of Advanced Processing Technologies and Sustainable Production Practices:
The adoption of advanced washing, screening, and grading systems is transforming the quality standards of sand production. It is enabling manufacturers to produce material with minimal impurities and optimal grain shape, enhancing performance in concrete and asphalt applications. Producers are incorporating energy-efficient machinery and water recycling systems to reduce environmental impact. The integration of digital monitoring and automation ensures higher productivity and consistent output. Sustainability-focused construction projects are creating a growing preference for eco-friendly and recycled aggregates. This combination of technology-driven quality improvement and environmental responsibility is shaping the competitive landscape of the market.
- For instance, at the Zawtika gas field in Myanmar, automated sand-prediction models and dashboard monitoring across 123 wells and 11 platforms have improved operational efficiency by streamlining sand production forecasts and reducing manual analysis time for well management.
Market Challenges Analysis:
Environmental Concerns and Regulatory Compliance Constraints:
The natural and manufactured sand market faces significant challenges from stringent environmental regulations and sustainability concerns. Many countries have imposed restrictions on natural sand mining to protect river ecosystems, leading to supply shortages in certain regions. It is increasing dependence on manufactured sand, which requires substantial investment in crushing, screening, and washing facilities. Small-scale producers often struggle to meet compliance standards and maintain consistent product quality. Delays in obtaining environmental clearances can disrupt production timelines and project schedules. These factors collectively create operational and cost pressures for industry participants.
High Production Costs and Logistics Limitations:
Manufactured sand production involves energy-intensive processes and advanced equipment, which elevate operational expenses. Transportation adds further cost burdens, particularly in regions with limited proximity to suitable raw material sources. The natural and manufactured sand market also contends with fluctuating fuel prices, impacting delivery costs and project profitability. Maintaining consistent supply during peak construction seasons becomes challenging in areas with underdeveloped logistics infrastructure. Market players must balance production efficiency with cost management to remain competitive. This challenge is more pronounced in emerging markets where infrastructure gaps and financing constraints hinder large-scale capacity expansion.
Market Opportunities:
Expansion of Infrastructure and Urban Development Projects:
The natural and manufactured sand market holds strong growth potential from ongoing and planned infrastructure investments worldwide. Rapid urbanization in emerging economies is creating demand for high-quality aggregates in housing, commercial spaces, transportation networks, and industrial facilities. It is driving opportunities for manufacturers to scale production and establish supply partnerships with large construction firms. Mega-projects such as smart cities, renewable energy parks, and transit corridors require consistent volumes of premium sand. Governments are prioritizing infrastructure upgrades, which will sustain long-term demand. This trend creates favorable conditions for both established players and new entrants to capture market share.
Advancements in Sustainable and High-Performance Construction Materials:
The increasing adoption of green building standards and sustainable construction practices is opening new avenues for manufactured sand producers. Advanced processing technologies enable the production of eco-friendly sand with optimized particle size and minimal impurities. The natural and manufactured sand market benefits from growing interest in replacing natural resources with recycled and engineered aggregates. Demand for high-performance concrete in complex structures further enhances the scope for value-added sand products. Strategic investments in technology, quality certification, and distribution networks can help suppliers penetrate premium market segments. This shift aligns with global priorities for environmental preservation and resource efficiency.
Market Segmentation Analysis:
By Product Type:
The natural and manufactured sand market is segmented into natural sand and manufactured sand. Natural sand remains in demand for applications where minimal processing is required, but its availability is declining due to mining restrictions. Manufactured sand is gaining market share due to consistent particle size, strength, and compliance with environmental regulations. It is widely used in high-performance concrete and asphalt production, supported by advancements in crushing and screening technologies.
By Application:
Key applications include concrete, asphalt, road base, and others such as landscaping and specialty mixes. Concrete production dominates consumption, driven by global infrastructure and residential projects. Asphalt applications benefit from urban road expansion and highway rehabilitation programs. Road base usage is increasing in developing regions with large-scale transport network construction. Specialty applications are emerging in industrial flooring and decorative concrete.
- For instance, BASF’s Ucrete industrial flooring system is installed at thicknesses of ¼ to ½ inch and has provided over 50th years of proven performance in harsh environments, ensuring high durability and sanitary conditions in facilities worldwide.
By End-Use:
End-use segments cover residential, commercial, and infrastructure sectors. Residential construction drives steady demand for both product types, supported by housing initiatives in emerging economies. Commercial projects, including retail spaces, offices, and industrial complexes, rely on high-strength sand for structural durability. Infrastructure remains the largest end-use segment, fueled by government investment in transportation, energy, and public facilities. It continues to shape demand patterns across both developed and developing regions.
- For instance, UltraTech Cement’s UltraTech Building Solutions (UBS) rollout enriched the lives of 3 million individual home builders across 1 million residential sites through its network of 150 UBS stores inaugurated in a single day.
Segmentations:
By Product Type:
- Natural Sand
- Manufactured Sand
By Application:
- Concrete
- Asphalt
- Road Base
- Others
By End-Use:
- Residential
- Commercial
- Infrastructure
By Region:
- North America
- U.S.
- Canada
- Mexico
- Europe
- UK
- France
- Germany
- Italy
- Spain
- Russia
- Belgium
- Netherlands
- Austria
- Sweden
- Poland
- Denmark
- Switzerland
- Rest of Europe
- Asia Pacific
- China
- Japan
- South Korea
- India
- Australia
- Thailand
- Indonesia
- Vietnam
- Malaysia
- Philippines
- Taiwan
- Rest of Asia Pacific
- Latin America
- Brazil
- Argentina
- Peru
- Chile
- Colombia
- Rest of Latin America
- Middle East
- UAE
- KSA
- Israel
- Turkey
- Iran
- Rest of Middle East
- Africa
- Egypt
- Nigeria
- Algeria
- Morocco
- Rest of Africa
Regional Analysis:
Asia-Pacific :
Asia-Pacific holds 56% market share, making it the largest regional contributor to the natural and manufactured sand market. Strong economic growth in China, India, and Southeast Asian nations fuels extensive infrastructure and real estate development. Government-backed initiatives such as smart cities, industrial corridors, and transport networks drive sustained demand. It benefits from abundant raw material availability and expanding manufacturing capacity for engineered sand. The adoption of manufactured sand is accelerating due to environmental restrictions on river sand mining. Increasing foreign investments in construction projects further support market expansion in this region.
North America :
North America accounts for 18% market share, supported by significant infrastructure rehabilitation and commercial development projects. Large-scale investments in road, bridge, and public transit upgrades are creating steady demand for high-quality sand. The natural and manufactured sand market in this region benefits from advanced production technology and strict quality standards. It is witnessing rising adoption of manufactured sand in response to environmental regulations and resource conservation policies. The presence of established construction firms and advanced logistics networks strengthens supply reliability. Growth is further supported by residential housing demand in urban and suburban areas.
Europe :
Europe holds 15% market share, driven by stringent environmental regulations and growing demand for sustainable construction materials. The region actively promotes the use of manufactured sand to reduce dependency on natural resources. It is seeing increased adoption in high-performance concrete for infrastructure, industrial, and residential applications. Investments in recycling facilities and advanced sand processing equipment enhance product quality and environmental compliance. The shift toward energy-efficient and eco-friendly building designs supports consistent demand. Cross-border construction collaborations within the EU also boost trade and supply chain efficiency for sand producers.
Key Player Analysis:
- CRH Plc
- LafargeHolcim
- Sibelco
- HeidelbergCement AG
- CEMEX S.A.B. de C.V.
- Adelaide Brighton Ltd
- Vulcan Materials Company
- Johnston North America
- McLanahan
- Duo PLC
- DMAC
Competitive Analysis:
The natural and manufactured sand market features a competitive landscape with a mix of multinational corporations and regional producers. Key players include CRH Plc, LafargeHolcim, Sibelco, HeidelbergCement AG, CEMEX S.A.B. de C.V., Adelaide Brighton Ltd, Vulcan Materials Company, and Johnston North America. It is characterized by a focus on quality consistency, large-scale production capacity, and strategic geographic presence. Companies invest in advanced crushing, screening, and washing technologies to improve product performance and meet environmental regulations. Expansion strategies include acquisitions, joint ventures, and partnerships with construction firms to secure long-term supply contracts. Strong distribution networks and proximity to raw material sources enhance competitiveness. The market is expected to see intensified rivalry as demand grows for sustainable and high-performance sand products across global construction sectors.
Recent Developments:
- In July 2025, CRH Plc announced the acquisition of Eco Material Technologies, a leading supplier of Supplementary Cementitious Materials in North America, for $2.1billion.
- In January 2025, PQ Group completed the acquisition of Sibelco's specialty silicate business in Lödöse, Sweden.
- In July 2025, McLanahan established a strategic partnership with Terran Resources to expand its dealer network and bring comprehensive mineral processing solutions to the CARICOM region.
Market Concentration & Characteristics:
The natural and manufactured sand market exhibits a moderately fragmented structure with a mix of global producers and regional suppliers competing for share. It is characterized by high demand from the construction, infrastructure, and industrial sectors, with manufactured sand gaining prominence due to environmental restrictions on natural sand mining. Market players differentiate through quality consistency, advanced processing technology, and reliable supply chains. Technological advancements in crushing, washing, and grading systems are enabling efficient large-scale production. Strategic partnerships with construction firms and government infrastructure projects strengthen market positioning. Regional availability of raw materials and logistics capabilities significantly influence competitive dynamics.
Report Coverage:
The research report offers an in-depth analysis based on Product Type, Application, End-Use and Region. It details leading Market players, providing an overview of their business, product offerings, investments, revenue streams, and key applications. Additionally, the report includes insights into the competitive environment, SWOT analysis, current Market trends, as well as the primary drivers and constraints. Furthermore, it discusses various factors that have driven Market expansion in recent years. The report also explores Market dynamics, regulatory scenarios, and technological advancements that are shaping the industry. It assesses the impact of external factors and global economic changes on Market growth. Lastly, it provides strategic recommendations for new entrants and established companies to navigate the complexities of the Market.
Future Outlook:
- Demand will remain strong, driven by sustained global infrastructure development and urban expansion.
- Adoption of manufactured sand will accelerate due to tightening environmental regulations on natural sand mining.
- Technological innovations in crushing, screening, and washing equipment will enhance production efficiency and quality.
- Integration of automation and digital monitoring systems will improve operational consistency and reduce wastage.
- Sustainable construction practices will increase reliance on eco-friendly sand alternatives and recycled aggregates.
- Strategic investments in capacity expansion will help producers meet rising demand in high-growth regions.
- Partnerships between sand suppliers and large construction firms will strengthen supply chain reliability.
- Regional supply imbalances may create opportunities for cross-border trade and export growth.
- Development of premium sand products for high-performance concrete will open new revenue streams.
- The market will witness heightened competition, encouraging players to focus on cost optimization, quality certification, and value-added services.
Request a Free Sample
Fill in your details and we'll send you a free sample report.
- Sample data tables & charts
- Research methodology
Need a Custom Version of This Report?
Tailor the scope, geography, or segments to your exact requirements.
- Custom geography or segment scope
- Direct access to our analyst team
Frequently Asked Questions
What is the current market size for the natural and manufactured sand market, and what is its projected size in 2032?
Which natural and manufactured sand market segment held the largest share in 2024?
Who are the leading companies in the natural and manufactured sand market?
Which region commanded the largest share of the natural and manufactured sand market in 2024?
Table of Content
Chapter 1. Report Introduction
- 1.1 Report Description & Purpose
- 1.1.1 Report Title & Market Definition
- 1.1.2 Unique Selling Propositions (USP) & Key Differentiators
- 1.1.3 Value Proposition for Stakeholders
- 1.2 Research Objectives
- 1.2.1 Market Sizing Objectives (Volume & Revenue)
- 1.2.2 Segmentation Objectives
- 1.2.3 Competitive Intelligence Objectives
- 1.2.4 Forecast & Scenario Objectives
- 1.3 Report Scope
- 1.3.1 Natural and Manufactured Sand Scope – Types & Subtypes Covered
- 1.3.2 Geographic Scope – Regions & Countries Covered
- 1.3.3 Historical Period, Base Year & Forecast Period (2024; forecast to 2032)
- 1.3.4 Inclusions & Exclusions
- 1.4 HS Code & Classification Framework
- 1.5 Currency, Units & Pricing Basis
- 1.6 Target Stakeholders
- 1.7 Limitations & Assumptions
Chapter 2. Executive Summary
- 2.1 Global Natural and Manufactured Sand Market Snapshot
- 2.1.1 Market Size – Historical (2024) & Forecast (2024-2032) (2024: USD 152,253 million → 2032: USD 213,226.1 million)
- 2.1.2 Volume & Revenue – Global Totals
- 2.1.3 Key Market Highlights – Top Five Facts
- 2.2 Natural and Manufactured Sand Market Segmentation Snapshot
- 2.2.1 Market Split by Region – 2024 vs. 2032
- 2.3 Competitive Snapshot
- 2.3.1 Top 10 Players by Revenue Share – 2024
- 2.3.2 Top 10 Players by Volume Share – 2024
- 2.3.3 Recent Strategic Developments (18-Month Summary)
- 2.4 Key Investment Highlights & Strategic Conclusions
Chapter 3. Natural and Manufactured Sand Market Dynamics & Industry Analysis
- 3.1 Market Overview & Context
- 3.1.1 Natural and Manufactured Sand Market Position in the Broader Automotive Value Chain
- 3.1.2 OEM vs. Replacement Market Dynamics
- 3.1.3 Market Maturity & Development Stage by Region
- 3.2 Natural and Manufactured Sand Market Drivers
- 3.3 Natural and Manufactured Sand Market Restraints & Challenges
- 3.4 Natural and Manufactured Sand Market Opportunities
- 3.5 Porter's Five Forces Analysis
- 3.5.1 Threat of New Entrants
- 3.5.2 Bargaining Power of Suppliers
- 3.5.3 Bargaining Power of Buyers
- 3.5.4 Threat of Substitutes
- 3.5.5 Competitive Rivalry – Intensity Assessment
- 3.6 Natural and Manufactured Sand Value Chain Analysis
- 3.6.1 Upstream – Raw Material/Input Suppliers
- 3.6.1.1 Raw Material/Input 1
- 3.6.1.2 Raw Material/Input 2
- 3.6.1.3 Raw Material/Input 3
- 3.6.2 Midstream – Production/Manufacturing/Service Delivery
- 3.6.2.1 Production/Process Overview
- 3.6.2.2 Key Facility Locations & Capacity by Manufacturer
- 3.6.3 Downstream – Distribution & End Consumer
- 3.6.3.1 Primary Channel – B2B/OEM
- 3.6.3.2 Secondary Channels – Dealer, Retail, Online, Direct
- 3.6.4 Value Chain Profitability Analysis
- 3.6.1 Upstream – Raw Material/Input Suppliers
- 3.7 PESTEL Analysis
- 3.7.1 Political Factors
- 3.7.2 Economic Factors
- 3.7.3 Social Factors
- 3.7.4 Technological Factors
- 3.7.5 Environmental Factors
- 3.7.6 Legal Factors
- 3.8 Natural and Manufactured Sand Supply Chain Analysis
- 3.8.1 Raw Material/Input Supply Risk Assessment
- 3.8.2 Manufacturing Concentration Risk (Geographic Exposure)
- 3.8.3 Trade Disruption Impact Analysis
- 3.9 Regulatory & Policy Landscape
Note: The regulatory and policy landscape section covers regulations based on their applicability to the market, Natural and Manufactured Sand category, geography, and scope of the study. Only regulatory frameworks with a material impact on operations, compliance, trade, sustainability, or market access are analyzed in detail.
Chapter 4. Key Investment Pockets & Opportunity Analysis
- 4.1 Natural and Manufactured Sand Market Attractiveness Analysis
- 4.1.1 By Region – Investment Attractiveness Matrix (Volume × CAGR)
- 4.2 Absolute Revenue Growth Opportunity
- 4.2.1 By Region – Absolute USD Growth Through 2032
- 4.3 Incremental Volume Opportunity
- 4.3.1 By Region – Incremental Volume Through 2032
- 4.3.2 Segment – Incremental Volume
- 4.4 Emerging Submarket Opportunity Deep Dive (Subject to Applicability)
- 4.5 Emerging Market Opportunity Scorecards
- 4.5.1 United States
- 4.5.2 Europe
- 4.5.3 Asia
- 4.5.4 Middle East & Africa
Note: Emerging Market Opportunity Scorecards will be included based on relevance and strategic importance. Regions listed are indicative and may vary depending on data availability and market dynamics.
Chapter 5. Natural and Manufactured Sand Import-Export Analysis & Trade Flows
- 5.1 Global Trade Overview
- 5.1.1 Global Export Value by Country (2024)
- 5.1.2 Global Export Volume by Country (2024)
- 5.1.3 Global Import Value by Country (2024)
- 5.1.4 Global Import Volume by Country (2024)
- 5.1.5 Net Trade Balance by Country (2024)
- 5.2 Export Analysis – Segment
- 5.2.1 Type 1 (HS Code)
- 5.2.2 Type 2 (HS Code)
- 5.2.3 Type 3 (HS Code)
- 5.2.4 Type 4 (HS Code)
- 5.2.5 Type 5 (HS Code)
- 5.3 Import Analysis – Segment
- 5.3.1 Type 1 (HS Code)
- 5.3.2 Type 2 (HS Code)
- 5.3.3 Type 3 (HS Code)
- 5.3.4 Type 4 (HS Code)
- 5.3.5 Type 5 (HS Code)
- 5.4 Average Unit Trade Prices
- 5.4.1 Average Export Price – Segment & Country
- 5.4.2 Average Import Price – Segment & Source Country
- 5.4.3 Price Trends (2024)
- 5.5 Key Trade Route Analysis
- 5.5.1 Trade Route 1
- 5.5.2 Trade Route 2
- 5.5.3 Trade Route 3
- 5.5.4 Trade Route 4
- 5.5.5 Trade Route 5
- 5.6 Trade Policy Impact Assessment
- 5.6.1 US Anti-Dumping & Section 301 Tariffs
- 5.6.2 EU Customs Union Impact
- 5.6.3 Major Free Trade Agreements
- 5.6.4 USMCA Rules of Origin
Note: Trade policy analysis will be included only where relevant to the Natural and Manufactured Sand market.
Chapter 6. Competitive Landscape & Company Benchmarking
- 6.1 Natural and Manufactured Sand Market Concentration & Structure
- 6.1.1 Herfindahl-Hirschman Index (HHI) – vs. 2024
- 6.1.2 Tier 1, Tier 2 & Tier 3 Market Structure
- 6.1.3 Global, Regional & Local Player Dynamics
- 6.2 Natural and Manufactured Sand Market Share Analysis – 2024
- 6.2.1 Global Revenue Share by Company
- 6.2.2 Global Volume Share by Company
- 6.2.3 Regional Revenue Share
- 6.2.4 Market Share Evolution ( vs. 2024)
- 6.2.5 OEM Segment Share by Company
- 6.2.6 Replacement Segment Share by Company
- 6.3 Production/Delivery Capacity & Facility Analysis
- 6.3.1 Global Installed Capacity
- 6.3.2 Capacity Utilization Rates
- 6.3.3 Production/Output Volume
- 6.3.4 Facility Locations & Capacity Map
- 6.3.5 Planned Capacity Additions
- 6.4 Natural and Manufactured Sand Competitive Benchmarking Matrix
- 6.4.1 Revenue, Volume, CAGR & Profitability Comparison
- 6.4.2 Channel Revenue Mix
- 6.4.3 Geographic Revenue Exposure
- 6.4.4 R&D Intensity
- 6.4.5 Sustainability Maturity
- 6.5 Strategic Developments in Natural and Manufactured Sand (Last 24 Months)
- 6.5.1 Mergers, Acquisitions & Divestments
- 6.5.2 New Natural and Manufactured Sand Launches
- 6.5.3 Facility Expansions
- 6.5.4 Strategic Alliances, Joint Ventures & Partnerships
- 6.5.5 Distribution Expansion & Market Entry
- 6.5.6 Sustainability & ESG Initiatives
- 6.6 Competitive Strategy Mapping
- 6.6.1 Leader, Challenger, Follower & Niche Classification
- 6.6.2 Pricing Strategy Comparison
- 6.6.3 Channel Strategy Matrix
Note: Strategic developments are included based on their materiality and the availability of reliable information.
Chapter 7. Global Natural and Manufactured Sand Market – By Distribution Channel
- 7.1 Segment Overview
- 7.1.1 Volume & Revenue Split by Channel (2024 & 2032)
- 7.1.2 Channel Mix Evolution (2024-2032)
Chapter 8. Regional Market Analysis – Global Overview
- 8.1 Global Regional Overview
- 8.1.1 Regional Volume Share
- 8.1.2 Regional Revenue Share
- 8.1.3 Regional Volume by Region
- 8.1.4 Regional Revenue by Region
- 8.1.5 Regional Forecast Through 2032
- 8.2 Cross-Regional Segment Analysis
- 8.2.1 By Distribution Channel
- 8.2.2 By Brand/Price Tier
Chapter 9. North America Natural and Manufactured Sand Market
- 9.1 United States
- 9.2 Canada
- 9.3 Mexico
Chapter 10. Europe Natural and Manufactured Sand Market
- 10.1 Germany
- 10.2 France
- 10.3 Italy
- 10.4 United Kingdom
- 10.5 Spain
- 10.6 Poland
- 10.7 Russia
- 10.8 Netherlands
- 10.9 Belgium
- 10.10 Sweden
- 10.11 Denmark
- 10.12 Norway
- 10.13 Rest of Europe
Chapter 11. Asia Pacific Natural and Manufactured Sand Market
- 11.1 China
- 11.2 India
- 11.3 Japan
- 11.4 South Korea
- 11.5 Thailand
- 11.6 Indonesia
- 11.7 Vietnam
- 11.8 Malaysia
- 11.9 Australia
- 11.10 Rest of Asia Pacific
Chapter 12. Latin America Natural and Manufactured Sand Market
- 12.1 Brazil
- 12.2 Argentina
- 12.3 Colombia
- 12.4 Chile
- 12.5 Rest of Latin America
Chapter 13. Middle East Natural and Manufactured Sand Market
- 13.1 Saudi Arabia
- 13.2 United Arab Emirates
- 13.3 Turkey
- 13.4 Israel
- 13.5 Iran
- 13.6 Rest of the Middle East
Chapter 14. Africa Natural and Manufactured Sand Market
- 14.1 South Africa
- 14.2 Egypt
- 14.3 Nigeria
- 14.4 Morocco
- 14.5 Rest of Africa
Chapter 15. Natural and Manufactured Sand Company Profiles
- 15.1 [Company 01]
- 15.1.1 Company Overview
- 15.1.2 Key Management Personnel
- 15.1.3 Products & Services Portfolio
- 15.1.4 Financial Performance
- 15.1.5 Key Market Focus & Geographic Presence
- 15.1.6 Recent Developments & Strategic Initiatives
Note: The company profile list is preliminary and may change based on research findings, market developments, data availability, and client requirements.
Chapter 16. Appendices
- Appendix A – List of Abbreviations & Acronyms
- Appendix B – Industry Classification Code Reference – Full Series
- Appendix C – Production & Capacity Data Tables
- Appendix D – End-Use & Demand Base Tables
- Appendix E – Consumption & Replacement Rate Assumptions
- Appendix F – ASP Reference Tables
- Appendix G – Manufacturing & Facility Database
- Appendix H – Import-Export Data Tables
- Appendix I – Regulatory Summary Tables
- Appendix J – Primary Research Participant List (Anonymized)
- Appendix K – Primary Research Questionnaire Framework
- Appendix L – Data Sources & Bibliography
- Appendix M – Market Size Divergence & Source Comparison
Chapter 17. Research Methodology
- 17.1 Research Framework & Philosophy
- 17.2 Secondary Research – Sources, Hierarchy & Data Extraction
- 17.3 Data Modeling – Bottom-Up & Top-Down Market Sizing
- 17.4 Primary Research – Stakeholder Framework, LOI & Sample Sizes
- 17.5 Forecast Methodology – Regression, Scenario & Sensitivity Analysis
- 17.6 Quality Control – Four-Layer Validation Framework
- 17.7 Limitations & Standard Assumptions
- 17.8 Disclaimer
