Bags and seats now carry a large slice of airline income
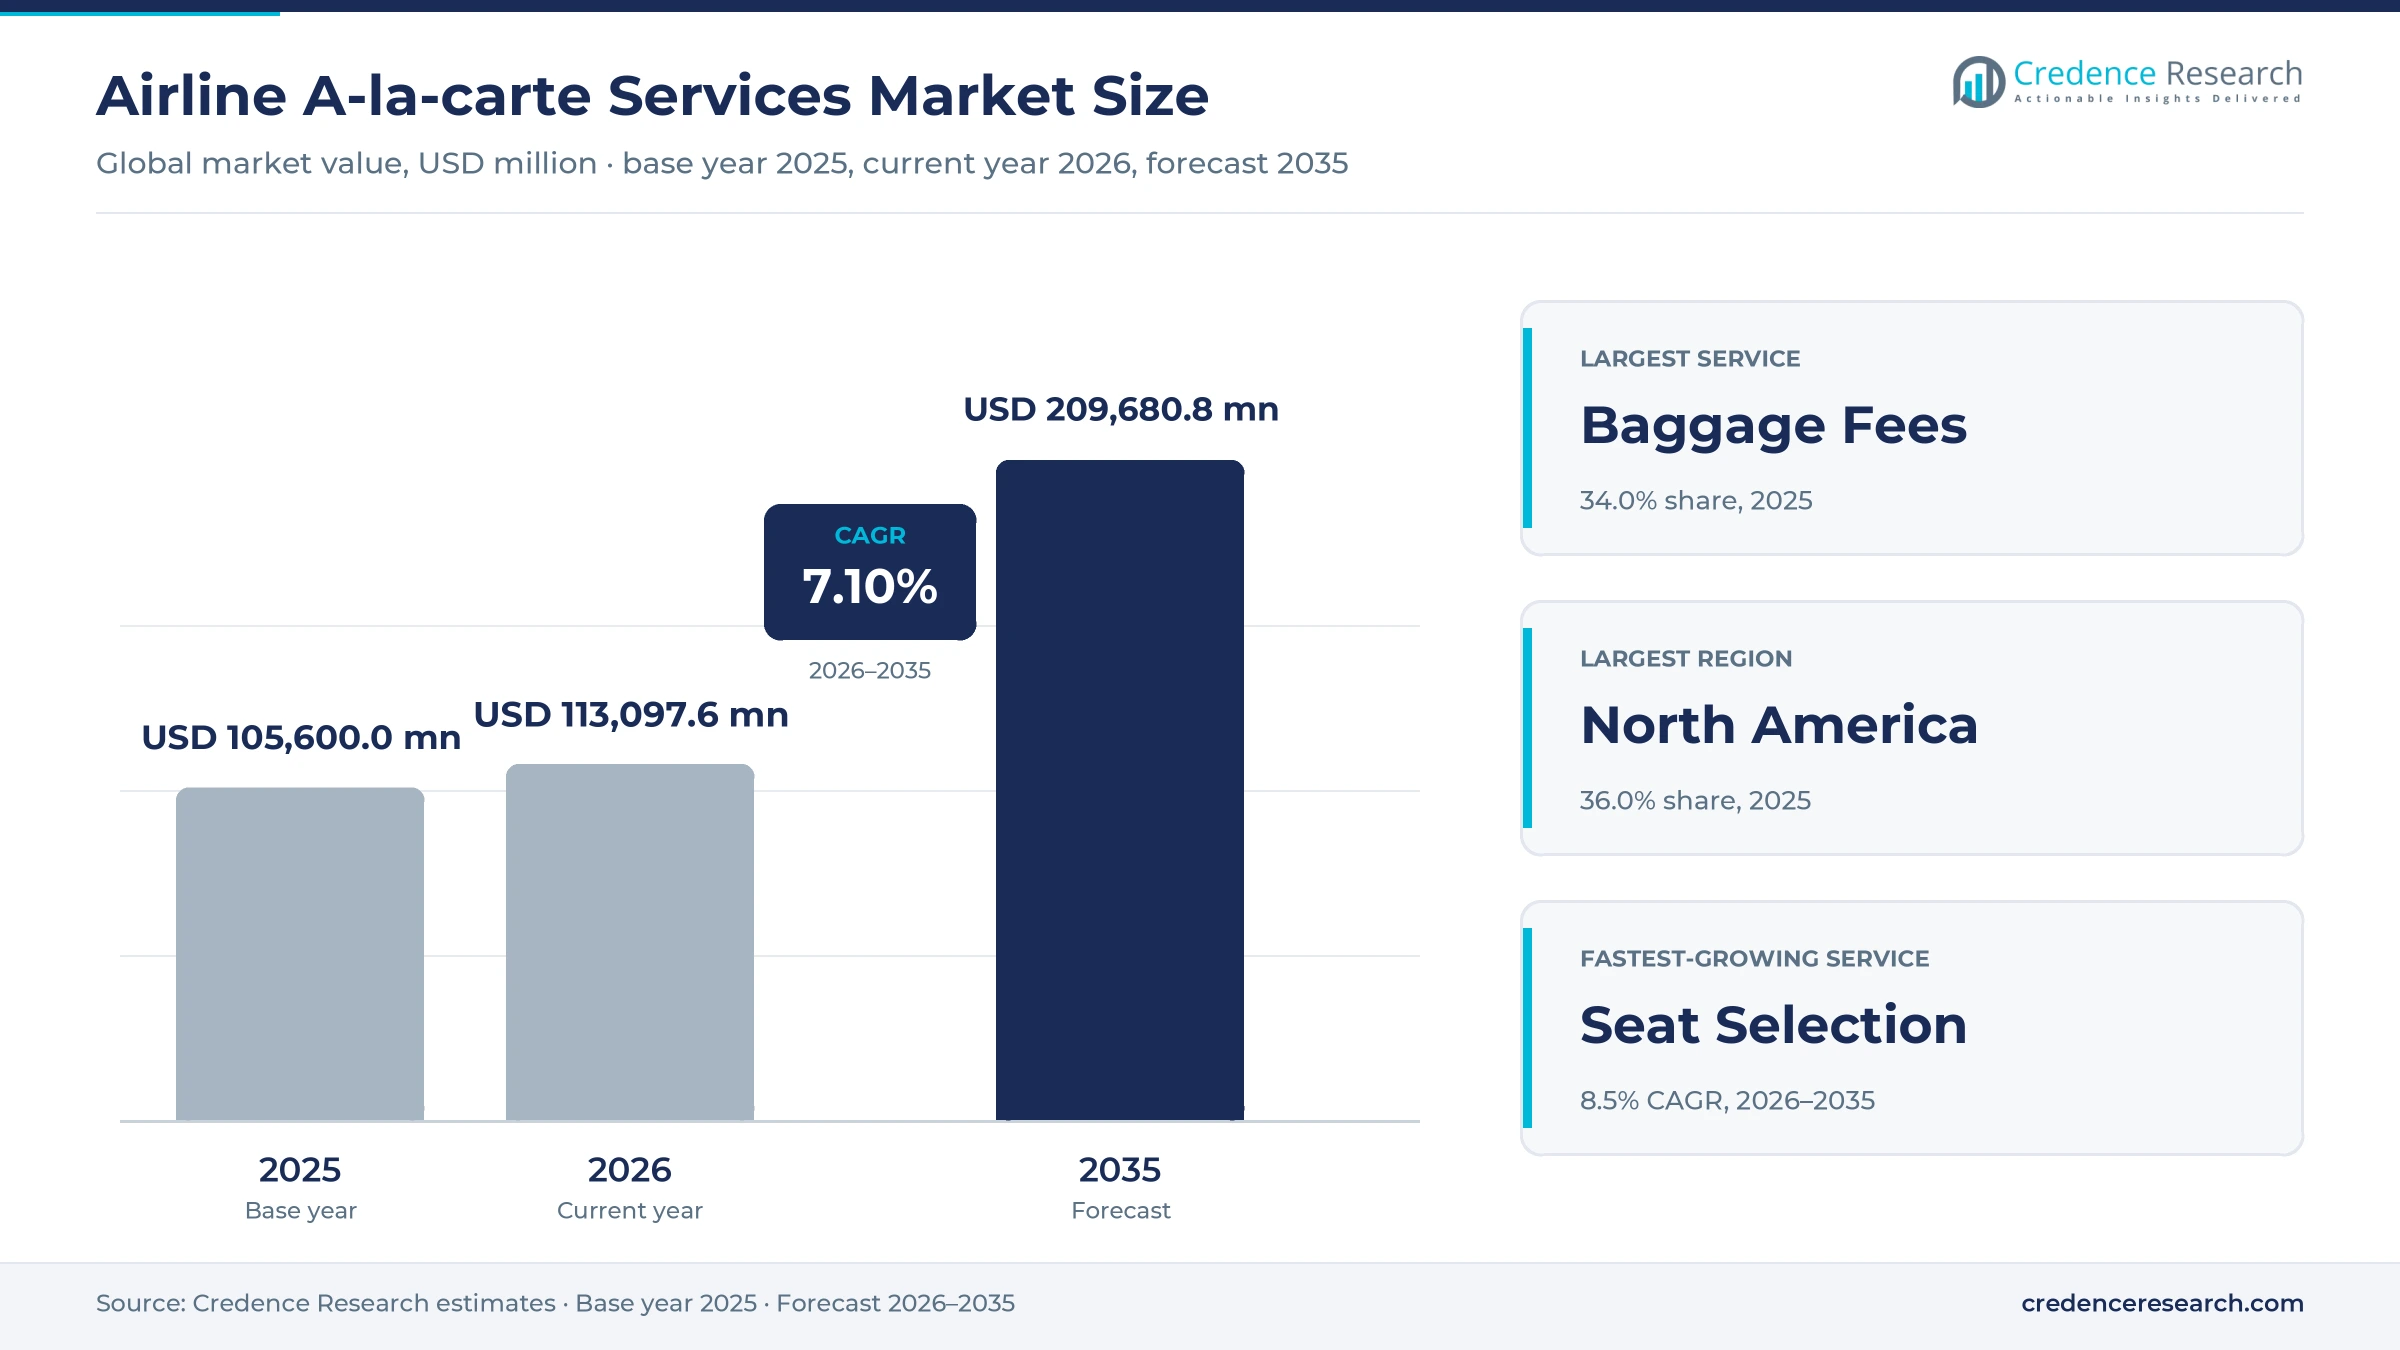
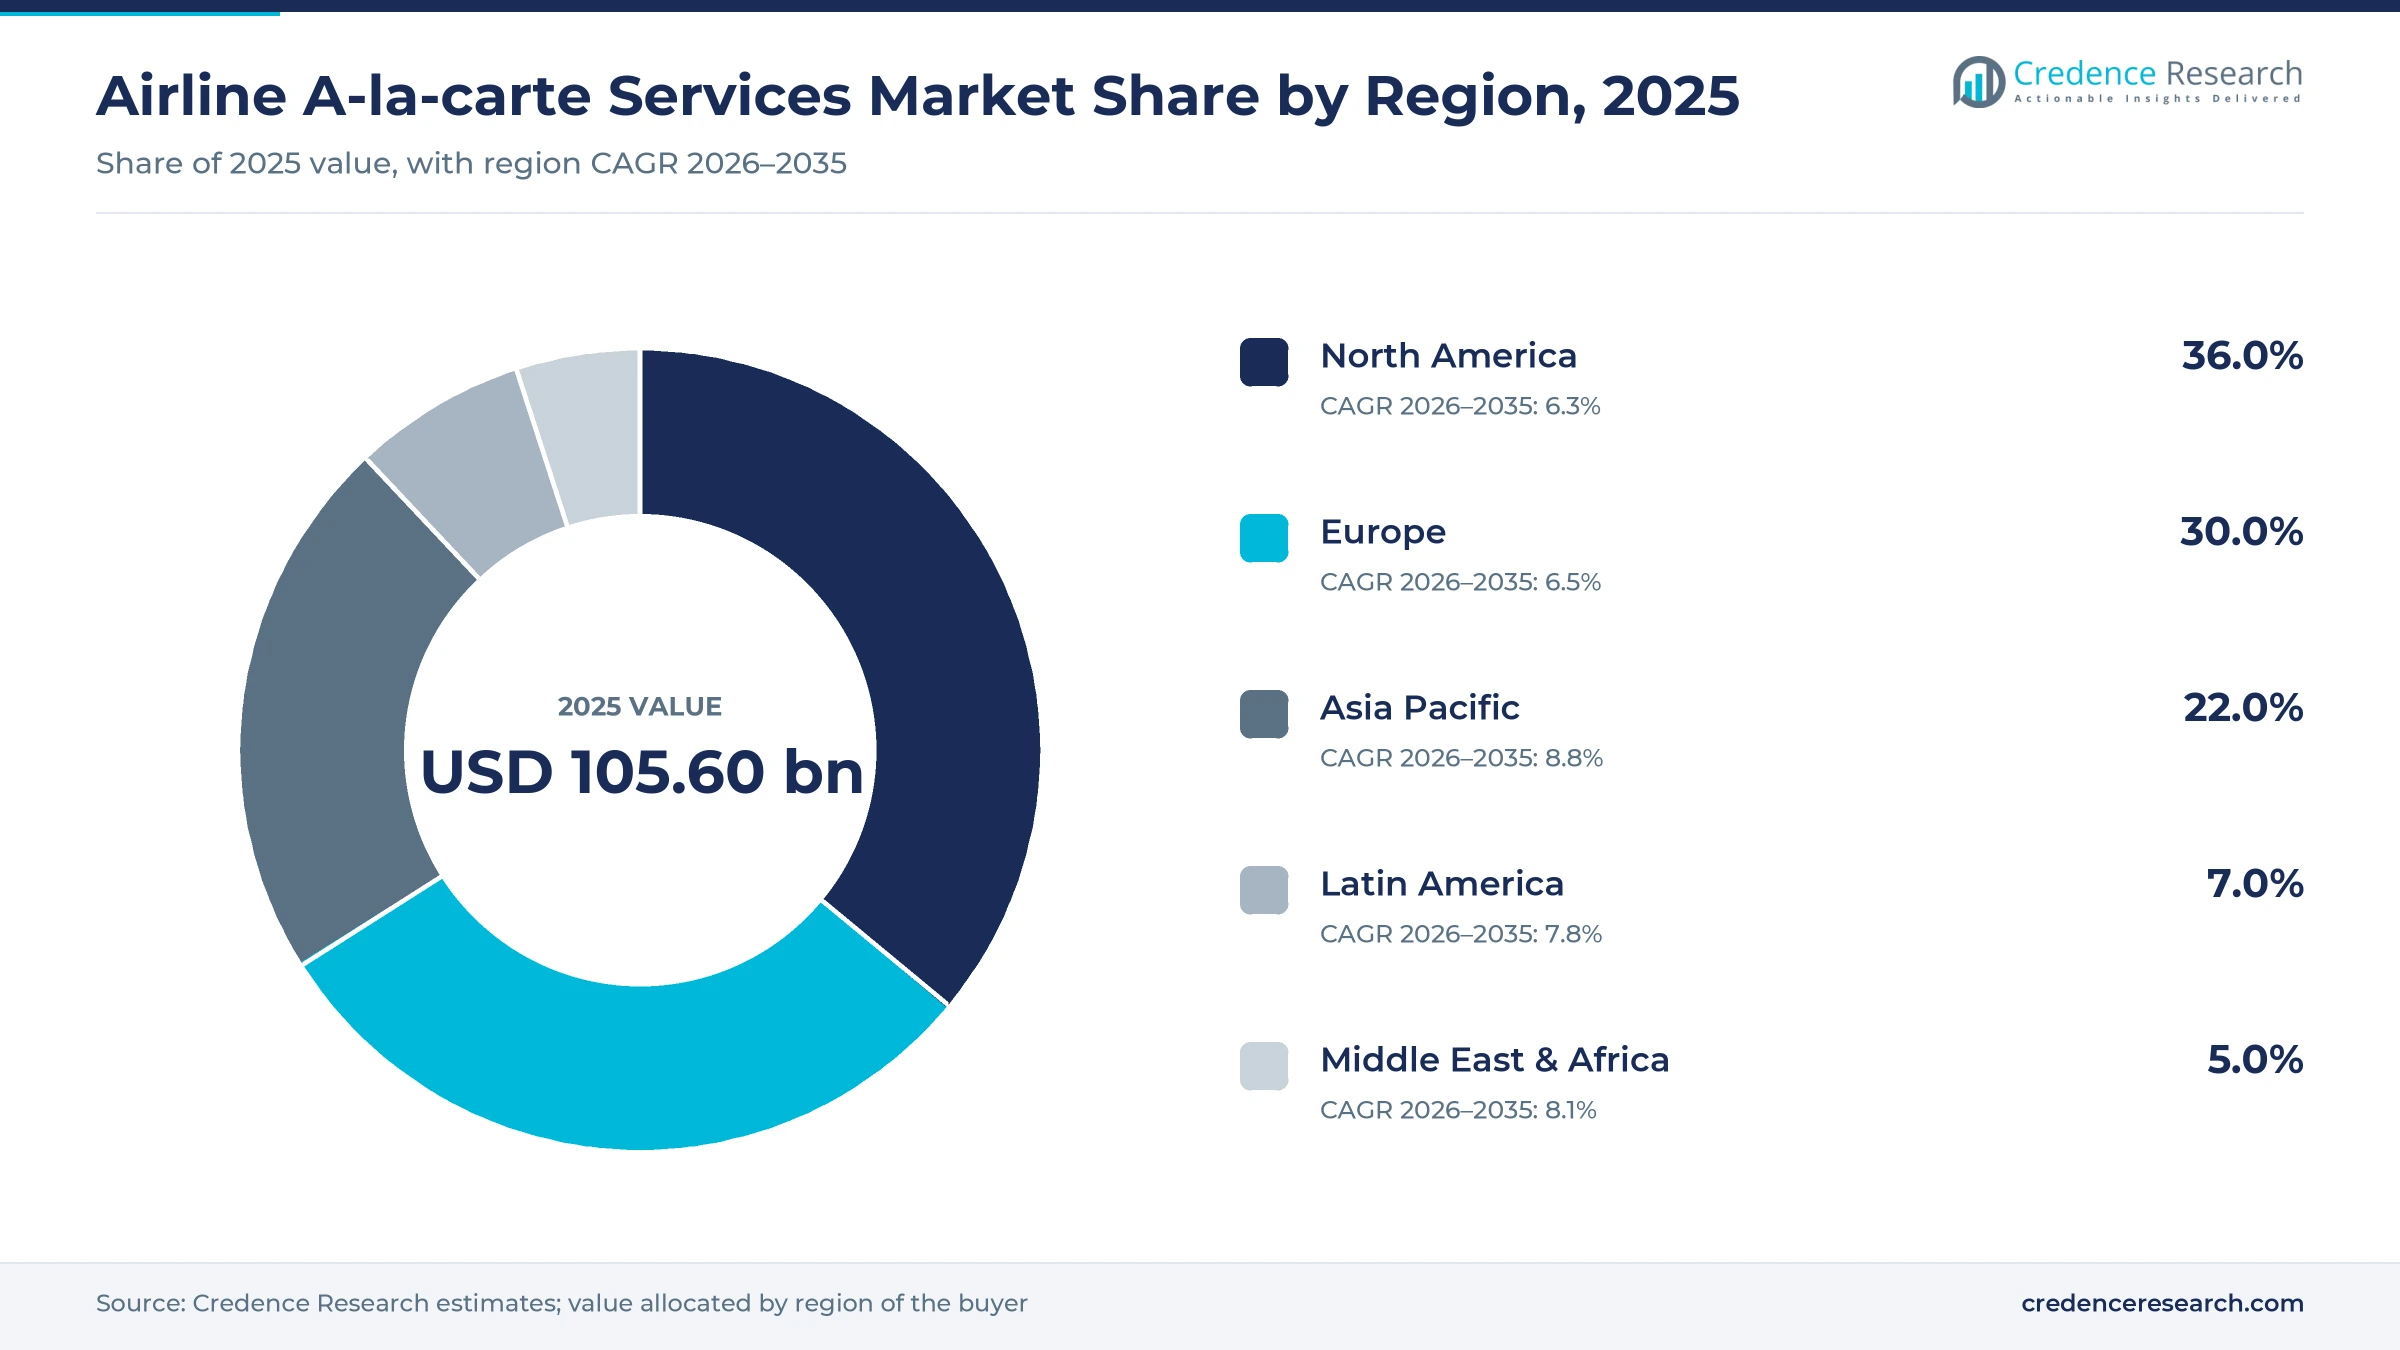
The global airline a-la-carte services market was valued at USD 105.60 billion in 2025 and is projected to increase from USD 113.10 billion in 2026 to USD 209.68 billion by 2035, registering a CAGR of 7.10% during 2026–2035. Spending comes from passengers who buy checked bags, assigned or extra-legroom seats, priority boarding, onboard food and connectivity on top of a base fare that no longer includes them. North America held the largest regional share, 36.0% in 2025, because the large network carriers there charge for checked bags on most domestic economy fares. Asia Pacific is the fastest-growing region at 8.8% a year, as low-cost carriers in India and Southeast Asia add passengers faster than mature markets. Regulation is the main swing factor, as Europe and India move to limit what airlines can charge for cabin bags and seats while airlines elsewhere keep widening the list of paid options.
What do passengers pay for beyond the base fare?
The market counts fees that passengers pay airlines for optional items bought one at a time, before or during the trip. These include checked and cabin bags, seat assignment and extra legroom, priority boarding, branded fare bundles, onboard meals and retail, inflight Wi-Fi and fees for changes or name corrections.
The scope excludes ticket revenue, frequent-flyer mile sales to banks and co-branded card income, and commissions that airlines earn on hotels, car hire or insurance sold on their websites. Airlines set and collect the fees, while reservation, merchandising and payment systems, travel agents and booking apps carry the offers to the traveler.
Airline A-la-carte Services Market Insights
- The airline a-la-carte services market grows from USD 105.60 billion in 2025 to USD 209.68 billion by 2035 at a 7.10% CAGR as more passengers pay separately for bags and seats.
- North America held 36.0% of 2025 value, as U.S. carriers keep charging for first checked bags on most domestic economy tickets.
- Baggage Fees led with 34.0% of 2025 value, because checked luggage is the most frequent paid extra on short-haul flights.
- Southwest Airlines ended more than 50 years of open seating on Jan. 27, 2026, adding paid seat choice at a major U.S. carrier.
- The European Parliament gave final approval to new passenger rules on July 7, 2026, guaranteeing a free personal item from 2027.
Bag fees lead while paid seat choice grows fastest
Why do bag fees still lead paid extras?
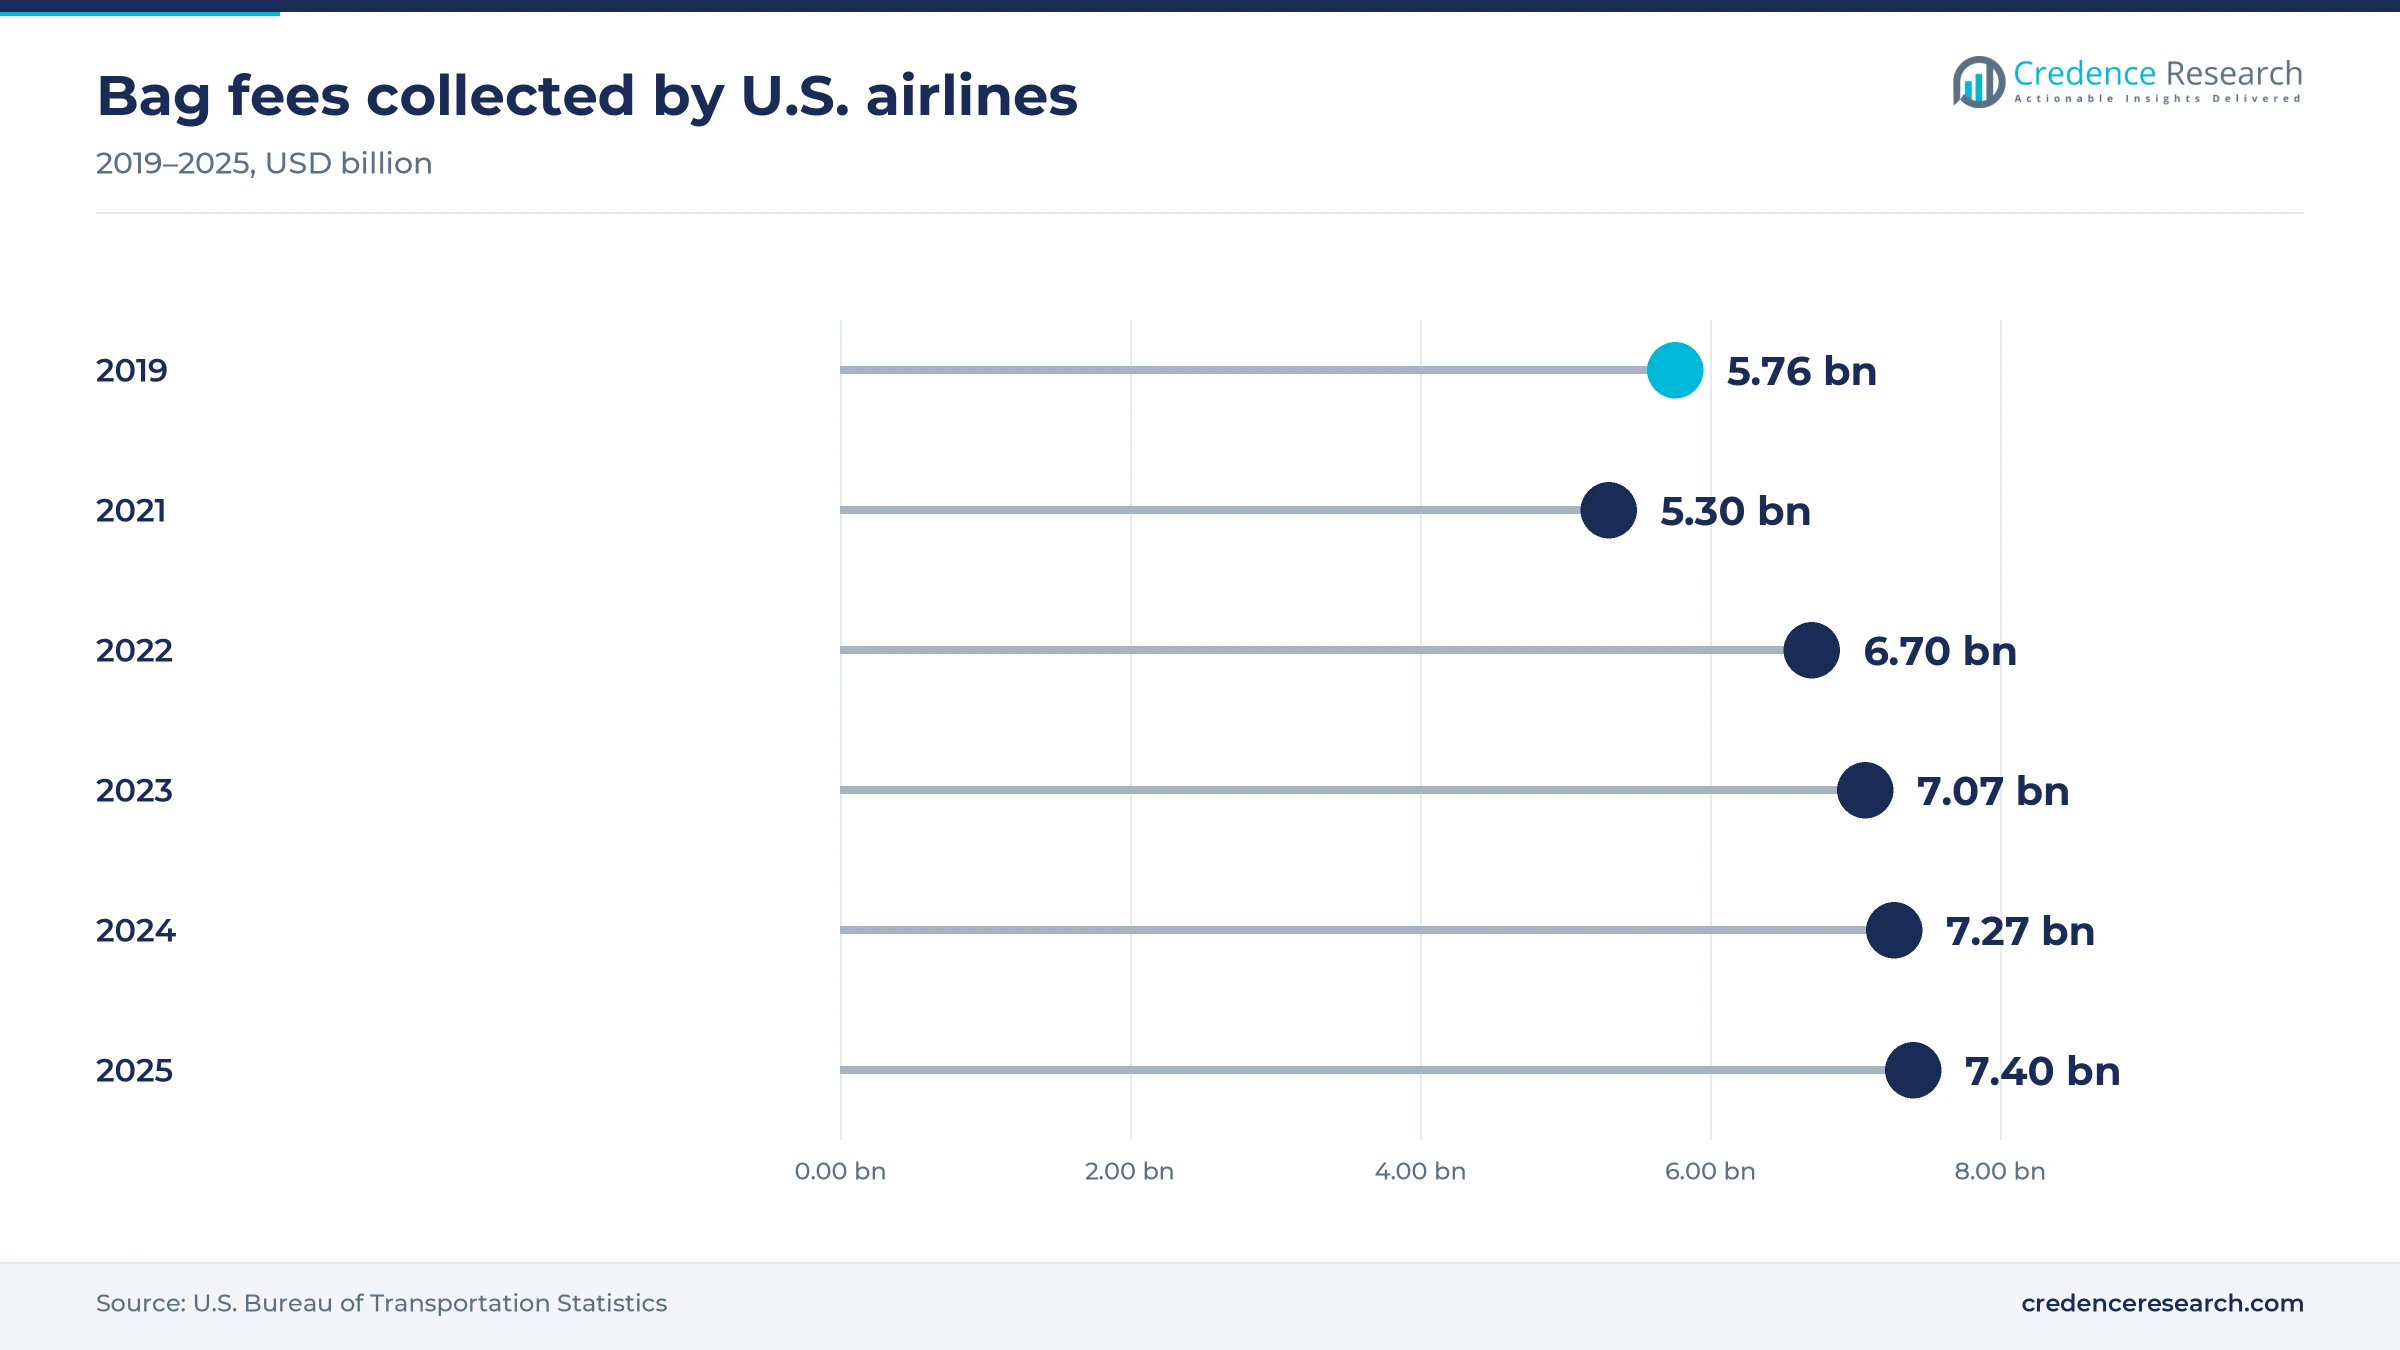
Based on service type, the market is categorized into baggage fees, seat selection, priority boarding and fare bundles, in-flight meals and retail, and Wi-Fi and other extras. Baggage Fees led with 34.0% of 2025 value because checked luggage is priced on almost every short-haul economy ticket, and U.S. domestic flights alone generated $5.7 billion of bag fees in 2023, according to the Bureau of Transportation Statistics. Seat Selection grows fastest at 8.5% a year as Wizz Air reported higher demand for its reserved seating product in its June 11, 2026, results, showing that travelers pay to sit together even on short flights.
How do direct channels keep most fee income?
Based on booking channel, the market is categorized into airline websites and mobile apps, travel agents and OTAs, and airport and onboard sales. Airline Websites & Mobile Apps led with 62.0% of 2025 value because airlines steer buyers to their own screens, and American Airlines limited miles from May 1, 2024, mostly to direct and preferred-agency bookings. Travel Agents & OTAs grow fastest at 8.2% a year as agencies sell extras inside the booking, and Capital A said in February 2026 that its AirAsia MOVE app records attach rates 23% higher than peer OTAs, a gain linked to mobile travel booking habits.
Why does economy carry most paid extras?
Based on flight class, the market is categorized into economy, premium economy and business and first. Economy led with 71.0% of 2025 value because the cheapest fare brands strip out seats and bags, and Emirates charges for every seat type on Economy Special and Saver fares. Premium Economy grows fastest at 9.1% a year as travelers trade up from the main cabin, and Southwest Airlines added paid extra-legroom rows when it moved to assigned seats on Jan. 27, 2026, according to ABC News and The Points Guy. Upgrades sold with these seats often include lounge passes, which ties carriers to airport lounge operation partners.
| Segment Group | Leading Sub-segment | Share, 2025 | Fastest-growing Sub-segment | CAGR, 2026–2035 |
|---|---|---|---|---|
| By Service Type | Baggage Fees | 34.0% | Seat Selection | 8.5% |
| By Booking Channel | Airline Websites & Mobile Apps | 62.0% | Travel Agents & OTAs | 8.2% |
| By Flight Class | Economy | 71.0% | Premium Economy | 9.1% |
Bag and seat fees vary by route, timing and fare brand
Airlines price most extras per item and per segment, and the fee usually rises the closer the purchase is to departure or when it is made at the airport rather than online. Seat fees move with route length, demand and seat position, so the same extra-legroom seat can cost several times more on a peak long-haul flight. Fare brands fold some extras into higher tickets, which lets carriers show a low entry fare while capturing most of the value from travelers who trade up. For buyers, the cheapest fare is rarely the cheapest trip once two bags and seats are added.
| Extra or carrier | Typical price or fee | Basis |
|---|---|---|
| First checked bag, American Airlines domestic | $35 online, $40 at airport | American Airlines, Feb. 2024 |
| First and second checked bag, Southwest Airlines | $35 and $45 | Southwest Airlines, May 2025 |
| Extra-legroom economy seat, Emirates | $30 to $260 per seat | Emirates seat selection page, 2026 |
| Seat selection, Indian domestic flights | Rs 200 to Rs 2,100 | Press Trust of India, March 2026 |
| All You Can Fly annual pass, Wizz Air | €499 to €599 plus €9.99 per flight | Euronews, Aug. 2024 |
Request a Free Sample
Fill in your details and we'll send you a free sample report.
- Sample data tables & charts
- Research methodology
Traffic growth and unbundled fares widen the fee base
Record passenger counts widen the base of fee buyers
Every additional passenger is a potential buyer of a bag, a seat or a snack, so traffic growth lifts fee income even when prices stay flat. In its Dec. 9, 2025, outlook, IATA expects 5.2 billion passengers in 2026, 4.4% more than in 2025. The same outlook puts ancillary and other revenue at $145 billion in 2026, up 5.5% against 4.8% growth in passenger ticket revenue, so optional fees now grow faster than the core business they sit on. The gain is uneven, because passengers on dense short-haul networks face fresh bag and seat choices on every segment. Carriers with large domestic networks in the United States, India and Southeast Asia therefore capture more of each new traveler than long-haul carriers that include bags in most fares.
U.S. network carriers keep pricing bags separately
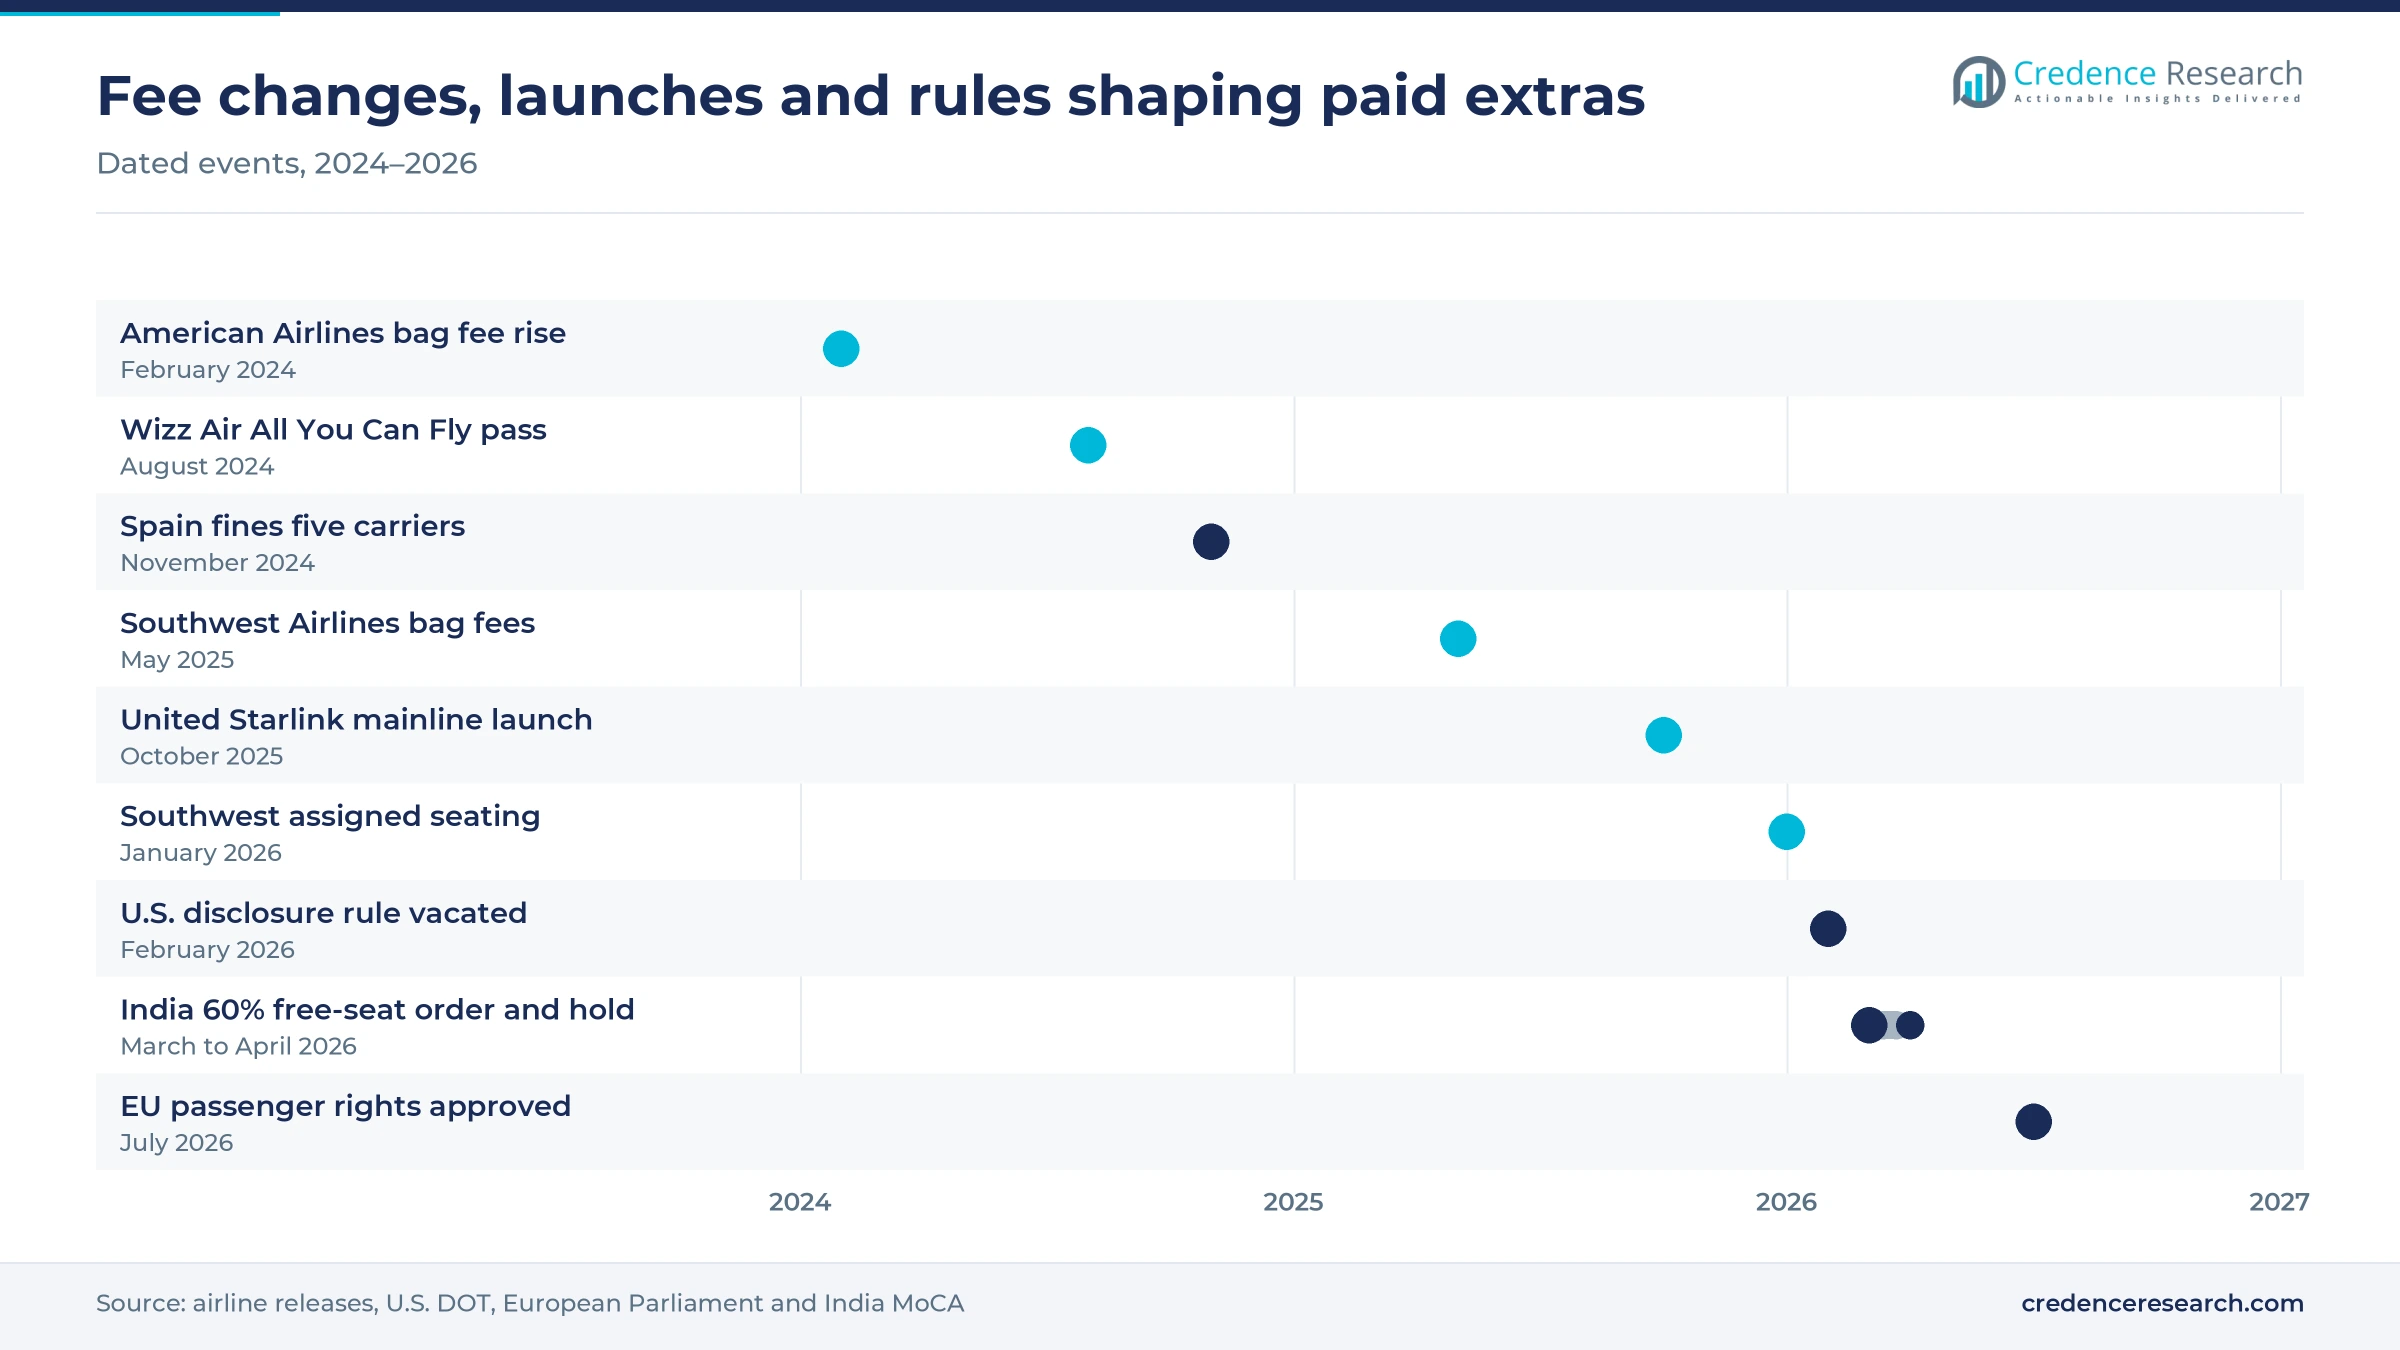
Checked-bag charges remain the anchor of fee income in the United States, and recent pricing moves show carriers still see room to raise them. On Feb. 20, 2024, American Airlines announced a higher first-bag fee of $35 online and $40 at the airport. Southwest Airlines dropped its free-bag policy for tickets bought from May 28, 2025, charging $35 for a first bag and $45 for a second. Across all U.S. scheduled carriers, the Bureau of Transportation Statistics counted $7.4 billion in bag fees in 2025, equal to 2.9% of operating revenue. With the last major free-bag holdout gone, U.S. economy travelers now face similar fee tables on every large carrier, which favors the carriers with the most direct-booking traffic.
Low-cost carriers depend on extras to keep fares low
Low-cost carriers price seats near cost and earn margin on optional items, and their results show how large that dependence has become. Ryanair took about €24 in extras per passenger in the year to March 2026, against an average fare of about €51, so extras equal close to half of what each traveler pays for the ticket. Wizz Air and Volaris run the same model, pricing every bag, seat and boarding option separately on their lowest fares, so the traveler builds the trip item by item. This model pushes rivals to unbundle as well, because a lower headline fare wins the first screen of a fare search.
Paid seat choice spreads to carriers and routes that gave it free
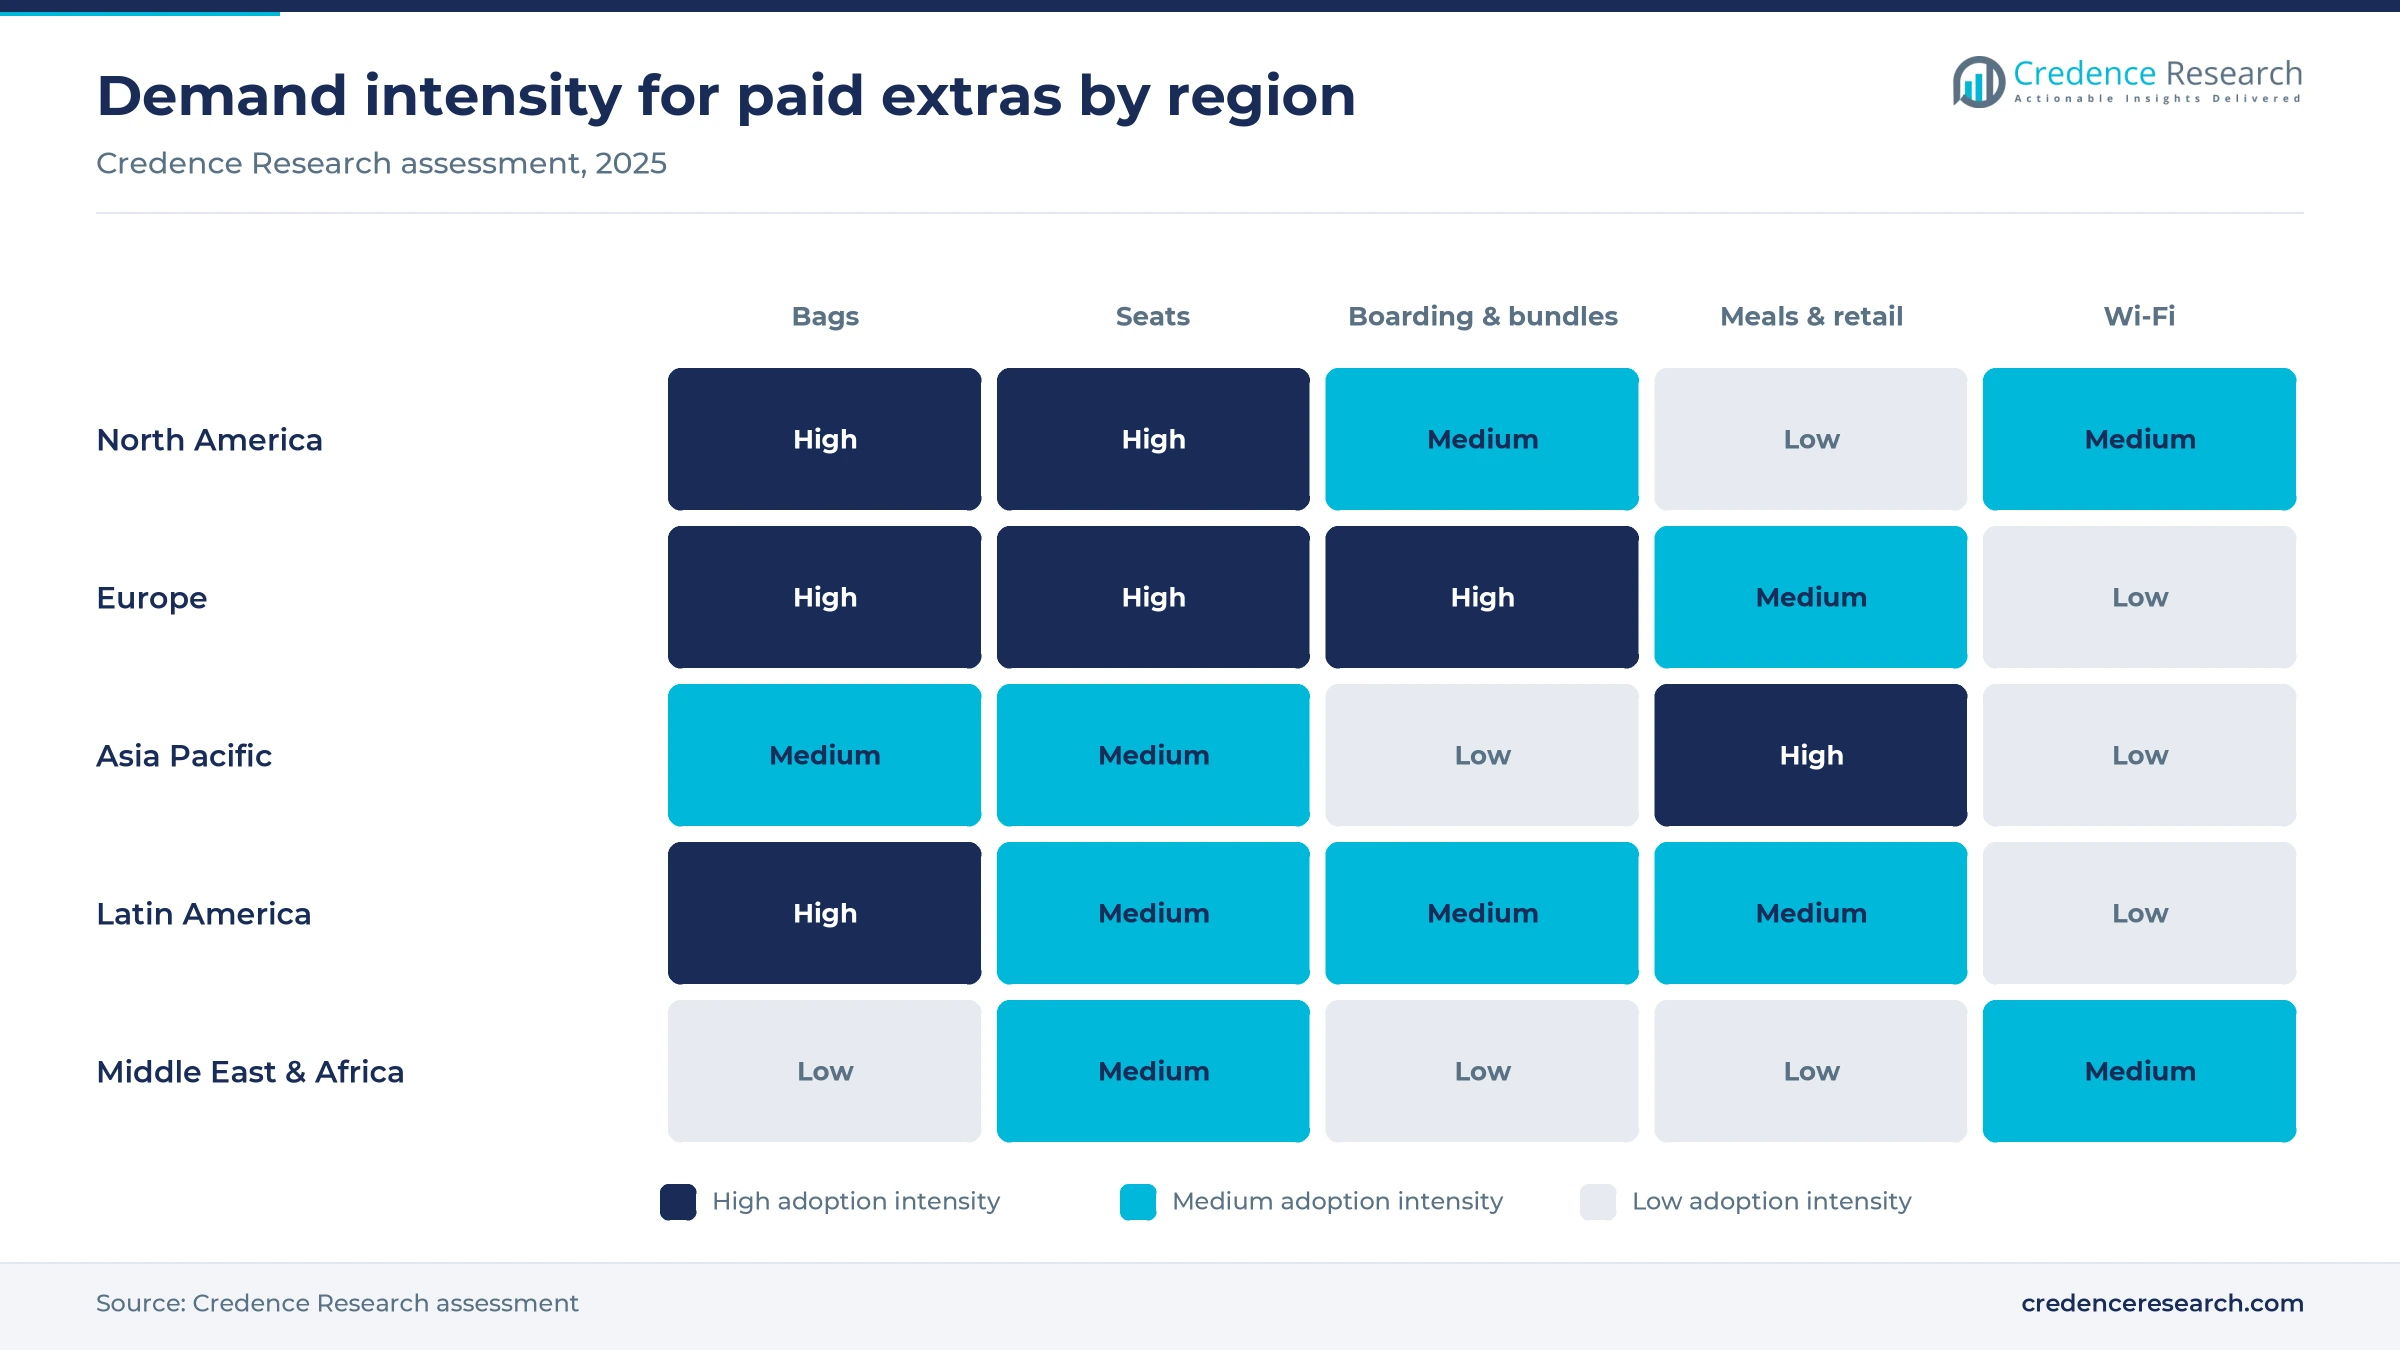
Seat assignment is moving from a free courtesy to a priced product, especially where families and groups want to sit together. Seat selection is the fastest-growing service type at 8.5% a year, because seat fees can be added to almost any fare. In India, only about 20% of seats on domestic flights were free to choose in March 2026, with selection fees from Rs 200 to Rs 2,100, according to a Press Trust of India report. Emirates, by contrast, waives regular, preferred and twin seat charges for any economy passenger who picks a seat at online check-in, 48 hours before departure, so its fees price early choice rather than the seat itself. Seat products carry little added cost, so most of each fee falls through to airline margin.
Subscriptions and order-based retailing reshape extras
Flight subscriptions emerge as a new paid product
Some low-cost carriers are shifting toward subscription passes to lock in frequent leisure travelers before they compare fares. Wizz Air launched its All You Can Fly annual pass in August 2024 at an introductory €499, later €599, according to Euronews. Members still pay a flat €9.99 for each flight and can book only within 72 hours of departure. The pass excludes bags and seat selection, so every trip it generates still produces separate fee sales. Wizz Air limited the first release to 10,000 memberships, which keeps the test small while the carrier measures how often members fly and what extras they buy. A subscription turns empty seats into fee-paying trips, which favors carriers with high-frequency point-to-point networks.
Order-based retailing shifts extras into one airline record
Airlines are shifting from ticket and coupon records toward a single order that can hold any mix of fares and extras, which lets agents and apps sell bags and seats at the same moment as the flight. IATA counted 26 production pilots of offers and orders systems in its October 2026 readiness roadmap, up from 20 a year earlier. The same survey recorded 72 proofs of concept and pilots across 16 IT providers and about 10 full-scope order management contracts. Most providers expect their systems to be built in 2027–2028, with legacy systems switched off between about 2027 and 2032. Carriers that finish this move first can price extras per customer across every channel.
Family and group seating offers an opening for compliant bundles
Rules on family seating create an opening for bundles that seat children next to adults at a clear, fair price. Spain fined five low-cost carriers €179 million in November 2024, citing among other practices paid seat selection for children and dependents traveling with companions, according to ch-aviation. India told airlines in March 2026 to seat passengers on the same booking close together where possible. Emirates already gives children aged 2 to 12 a 50% discount on regular and preferred seats. A family bundle priced per booking rather than per seat can keep fee income while reducing regulatory exposure, especially for carriers with large leisure networks in Europe and India.
India and Southeast Asia offer the largest pool of new fee buyers
The opening for fee sellers is largest where low-cost carriers still add millions of first-time and occasional flyers each year. IndiGo carried 123.4 million passengers in the year to March 2026, up 4.0%, according to its May 29, 2026, results. IndiGo prices seats, meals and bags separately on its domestic fares, so traffic growth of this size feeds fee income directly and is the main reason Asia Pacific grows fastest to 2035. Carriers that build mobile checkout for bags, seats and meals in local currencies and payment methods stand to gain most from this traffic.
Fee caps, free Wi-Fi and rule changes squeeze extras
New passenger rules cap what airlines can charge
Regulators in two large markets are narrowing which items airlines can sell as extras. The European Parliament approved revised passenger rights on July 7, 2026, by 646 votes to 12, with rules from 2027 that require fares shown on intermediary sites to include carry-on luggage. India ordered on March 17, 2026, that 60% of seats be free to choose, then suspended the order on April 2 after airline objections. Low-cost carriers in Europe and India are most exposed, because bags and seats form most of their fee income.
Free satellite Wi-Fi erodes paid connectivity
Connectivity is turning from a paid extra into a loyalty perk, which removes a fee line at the airlines that adopt it. United Airlines launched its first Starlink-equipped mainline flight in October 2025, offering the service free to MileagePlus members and planning installations on up to 15 Boeing 737-800s a month. Rivals that still charge for Wi-Fi face pressure to match, and suppliers of satellite in-flight connectivity now sell to airlines that recover cost through loyalty programs rather than session fees.
Unbundling alone no longer protects ultra-low-cost carriers
The collapse of Spirit Airlines shows that low fares plus fees no longer guarantee a viable model once larger rivals copy it. Spirit ceased operations on May 2, 2026, after two bankruptcy filings since 2024, according to OPB. Its U.S. passenger share had fallen from 5.1% to 3.9% year over year in February 2026, as network carriers sold basic economy fares with similar fee structures. Smaller ultra-low-cost carriers without loyalty income or premium seats are the most exposed to this squeeze.
Shifting U.S. disclosure rules complicate fee display
Fee display rules in the United States have changed twice in two years, which raises compliance costs for airlines and travel agents. The Fifth Circuit vacated the 2024 ancillary fee disclosure rule on Feb. 3, 2026, and a Transportation Department final rule published in the Federal Register on July 2, 2026, restored the 2011 standards. A separate proposal published July 1 would loosen how fare components are advertised. Online agencies and metasearch sites carry the largest rebuild costs, because each change alters what they must show during search.
North America leads as Asia Pacific grows fastest
| Region | Value, 2025 (USD billion) | Share, 2025 | CAGR, 2026–2035 |
|---|---|---|---|
| North America | 38.02 | 36.0% | 6.2% |
| Europe | 31.68 | 30.0% | 6.5% |
| Asia Pacific | 23.23 | 22.0% | 8.8% |
| Latin America | 7.39 | 7.0% | 7.8% |
| Middle East & Africa | 5.28 | 5.0% | 8.1% |
North America leads on bag and change fees
North America held 36.0% of 2025 value and grows at 6.2% a year, the slowest pace, because most fee types are already in place. U.S. carriers also collected $1.1 billion in reservation change fees in 2025, 0.4% of operating revenue, according to the Bureau of Transportation Statistics. Alaska Airlines and Hawaiian Airlines, merged under Alaska Air Group, received a single operating certificate in October 2025, which lets the combined group sell one set of seat and bag products across Hawaii and the West Coast.
Europe grows on low-cost traffic despite tighter rules
Europe held a 30.0% share of 2025 value and grows at 6.5% a year, held back by the new cabin bag and display rules. Because the free 40 x 30 x 15 cm personal item guaranteed from 2027 caps the smallest bag fee, European carriers are shifting fee income toward seats, priority boarding and onboard sales, where in-flight catering still adds margin on short flights. Low-cost carriers still carry most of the region's traffic, so fee volumes stay high even as the rules tighten.
Asia Pacific adds fee buyers fastest
Asia Pacific held 22.0% of 2025 value and grows fastest at 8.8% a year, because low-cost carriers are still adding first-time flyers. Cebu Pacific carried a record 26.9 million passengers in 2025, up 10%, according to PortCalls Asia reporting on March 23, 2026, a sign of strong regional demand for air travel. Each new low-cost passenger in the Philippines and wider Southeast Asia adds a separate bag, seat or meal decision, which carriers now capture through mobile checkout.
Latin America relies on low-cost fee models
Latin America held a 7.0% share of 2025 value and grows at 7.8% a year, led by Mexican low-cost carriers that sell most extras separately. Volaris booked 31.0 million passengers in 2025, up 5.2%, according to its 2025 results, and sells bags, seats and boarding separately on every fare, which ties regional fee income directly to traffic. That link supports further unbundling across Mexico and Central America as low-cost capacity grows.
Middle East & Africa monetizes long-haul seats
Middle East & Africa held a 5.0% share of 2025 value and grows at 8.1% a year, as Gulf carriers price seat choice on long-haul economy fares. Emirates lists regular economy seats at $7 to $40 and preferred seats at $15 to $100, while Skywards Platinum members receive all seat types free. Tier-based waivers mean fee income depends on how many travelers buy the cheapest fare brands, which keeps the region small but growing faster than the global average. Public fee data for African carriers is sparse, so the regional estimate leans mainly on Gulf carrier pricing.
Seating, connectivity and fee rules reset in 2025–2026
| Development | Status and market relevance |
|---|---|
| In October 2025, Alaska Airlines and Hawaiian Airlines received a single operating certificate from the FAA. | Completed. It allows one set of seat, bag and loyalty products across both brands. |
| In October 2025, United Airlines flew its first Starlink-equipped mainline aircraft between Newark and Houston. | Operational launch. Wi-Fi is free for MileagePlus members, which removes a paid connectivity fee. |
| In May 2026, Spirit Airlines ceased operations and began an orderly wind-down of the business. | Completed shutdown. It removes a U.S. ultra-low-cost carrier whose model relied on separately priced bags and seats. |
| In February 2026, the Fifth Circuit vacated the U.S. 2024 ancillary fee disclosure rule. | Court decision, followed by a Transportation Department final rule restoring 2011 standards in July 2026. |
| In July 2026, the European Parliament gave final approval to revised air passenger rights. | Approval. The rules, including a free personal item, apply from 2027. |
Retailing systems decide how many extras each flyer buys
- Ancillary pricing engines set bag and seat prices by route, date and demand, replacing fixed fee tables with prices that move like fares.
- Offer and order management systems hold flights and extras in one record, so agents and apps can sell and change them in a single step.
- Satellite connectivity gives faster inflight internet, which airlines either sell by the session or give free to loyalty members.
- Mobile apps and digital wallets carry most post-booking sales, prompting travelers to add bags, seats and meals before check-in.
Need a Custom Version of This Report?
Tailor the scope, geography, or segments to your exact requirements.
- Custom geography or segment scope
- Direct access to our analyst team
Low-cost carriers set the pace that network airlines copy
Competition in the airline a-la-carte services market is set by low-cost carriers, which built the model and still depend most on extras to keep fares low. Ryanair, Wizz Air, easyJet, Volaris, IndiGo and Cebu Pacific design low headline fares and sell bags, seats and priority boarding separately. Network carriers such as Delta Air Lines, United Airlines and American Airlines copied the approach with basic economy fares and now compete through premium seats, loyalty waivers and free connectivity for members. Southwest Airlines and Alaska Air Group joined the fee model more recently, while Emirates, Turkish Airlines, Singapore Airlines and Air France-KLM rely on fare brands that bundle or price seat choice and bags by fare level and route.
Who controls the fee table and where the margin sits
Airlines set, collect and keep almost all a-la-carte fees, so the supply side is as concentrated as each domestic airline market. Low-cost carriers depend most on extras, while network carriers collect large fee volumes from bags, seats and upgrades because of their size. Barriers to entry are those of running an airline, since no fee seller exists without a seat to fly. Margin sits mostly with the carrier, because seats, boarding and change fees carry little added cost, while onboard food, bags and Wi-Fi carry handling, catering and satellite costs.
Companies profiled and their roles in this market
| Company | Type | Role in the market |
|---|---|---|
| Ryanair | Low-cost carrier | Priority boarding, reserved seats and bag fees across Europe |
| Delta Air Lines | Network carrier | Premium seat upsell and bag fees on U.S. domestic fares |
| United Airlines | Network carrier | Bag and seat fees; free Starlink Wi-Fi for members |
| American Airlines | Network carrier | Bag fees with lower prices for online purchase |
| Southwest Airlines | Low-cost carrier | Bag fees from 2025 and assigned seats from 2026 |
| Alaska Air Group (Alaska Airlines, Hawaiian Airlines) | Network carrier | Combined seat and bag products after 2025 integration |
| easyJet | Low-cost carrier | Bags, seats and inflight retail in Europe |
| Wizz Air | Low-cost carrier | Reserved seating and All You Can Fly pass |
| Air France-KLM | Network carrier | Fare brands with paid seats and bags |
| Emirates | Network carrier | Tiered seat selection on long-haul economy |
| Turkish Airlines | Network carrier | Economy fare packages with paid seats and extra bags |
| Singapore Airlines | Network carrier | Paid advance seat selection on lower fares |
| IndiGo (InterGlobe Aviation) | Low-cost carrier | Seats, meals and bags on Indian domestic flights |
| Volaris | Low-cost carrier | Fee-led model in Mexico and Central America |
| Cebu Pacific | Low-cost carrier | Bags, seats and meals in the Philippines |
Seat and bundle design will matter more than new fees
Credence Research's view is that growth in the airline a-la-carte services market will come less from new fees and more from how airlines package seats, bags and boarding for each traveler. Regulators in Europe and India have shown they will intervene when fees look like hidden parts of the fare, so carriers that rely on aggressive cabin bag charges carry the most risk. Airlines that move to order-based retailing, sell family and group bundles at clear prices and keep extras visible in every channel are better placed than those that simply raise fee levels.
Estimate built from passenger counts and fee disclosures
The report uses 2025 as the base year and 2026–2035 as the forecast period. Market values come from the Credence Research model, which multiplies passenger counts from IATA by an estimate of a-la-carte spending per passenger and checks the result against U.S. Bureau of Transportation Statistics fee data. Regional and segment splits are Credence Research estimates based on airline results, fee schedules and regulatory filings published in 2024–2026. No interviews or surveys were conducted for this edition of the report.
Per-passenger spend and Asian traffic carry growth to 2035
The airline a-la-carte services market is expected to keep growing faster than ticket revenue through 2035, as passenger numbers rise and more carriers price seats separately. Asia Pacific should add the most new fee buyers, while North America and Europe grow more slowly because most fee types are already in place there. The main uncertainty is regulation, since wider caps on cabin bags or seats could cut growth by close to two percentage points a year. Order-based retailing is the main upside, because it would let agents and apps sell extras as easily as airline websites.
Regulation and retailing decide the 2035 range
The range of outcomes depends mostly on whether fee rules spread beyond Europe and India and on how quickly airlines move to order-based retailing. A downside case follows if more governments cap bag and seat charges and free Wi-Fi spreads to most large carriers. The upside case needs offers and orders systems to reach most airlines before 2030, letting agents and apps sell extras as easily as airline websites.
| Scenario | CAGR, 2026–2035 | Value, 2035 | What has to hold |
|---|---|---|---|
| Downside | 5.3% | USD 180.02 billion | Fee caps spread to more markets and free Wi-Fi becomes standard on large carriers |
| Base | 7.10% | USD 209.68 billion | Passenger growth near 4% a year and steady gains in spend per traveler |
| Upside | 8.6% | USD 237.64 billion | Order-based retailing reaches most airlines before 2030 and lifts sales through indirect channels |
Frequently Asked Questions
How big is the airline a-la-carte services market?
What counts as an airline a-la-carte service?
Which region leads the market?
Which service type is largest?
How much do U.S. airlines earn from bag fees?
How will the new EU passenger rules affect fees?
Why do low-cost carriers depend on these fees?
Which region grows fastest?
Table of Content
Chapter 1 Market Segmentation
- 1.1 Segmentation Framework
- 1.1.1 Product and Service Classification
- 1.1.2 Application and End-Use Classification
- 1.1.3 Technology and Solution Classification
- 1.1.4 Customer and Distribution Channel Classification
- 1.1.5 Geographic Segmentation
- 1.1.6 Market Segment Definitions and Boundaries
- 1.2 By Service Type
- 1.2.1 Baggage Fees
- 1.2.2 Seat Selection
- 1.2.3 Priority Boarding & Fare Bundles
- 1.2.4 In-Flight Meals & Retail
- 1.2.5 Wi-Fi & Other Extras
- 1.3 By Booking Channel
- 1.3.1 Airline Websites & Mobile Apps
- 1.3.2 Travel Agents & OTAs
- 1.3.3 Airport & Onboard Sales
- 1.4 By Flight Class
- 1.4.1 Economy
- 1.4.2 Premium Economy
- 1.4.3 Business & First
Chapter 2 Introduction
- 2.1 Report Objectives and Scope
- 2.2 Product Definition and Industry Terminology
- 2.3 Market Inclusions and Exclusions
- 2.4 Research Process
- 2.4.1 Primary Research and Expert Interviews
- 2.4.2 Secondary Research and Source Review
- 2.4.3 Top-Down and Bottom-Up Estimation
- 2.4.4 Data Triangulation and Verification
- 2.5 Market Size Measurement Basis
- 2.5.1 2025: USD 105.60 billion → 2035: USD 209.68 billion
- 2.6 Historical and Forecast Reference Periods
- 2.6.1 Historical Period: 2018-2025
- 2.6.2 Base Year: 2025
- 2.6.3 Forecast Period: 2025-2035
- 2.7 Research Assumptions and Limitations
Chapter 3 Executive Summary
- 3.1 Market Snapshot and Key Findings
- 3.2 Base-Year Market Size, 2025
- 3.3 Forecast Market Size, 2035
- 3.4 Revenue and Volume Growth Outlook
- 3.5 Key Demand and Supply Indicators
- 3.6 Leading Market Segments
- 3.7 Fastest-Growing Market Opportunities
- 3.8 Regional Performance Highlights
- 3.9 Technology and Industry Transformation
- 3.10 Competitive Landscape Summary
- 3.11 Analyst View and Strategic Implications
Chapter 4 Global Airline A-la-carte Services Market Trends and Developments
- 4.1 Historical Industry Development, 2018-2025
- 4.2 Recent Market Trends and Developments
- 4.3 Demand and Customer Behavior Trends
- 4.4 Technology and Product Innovation
- 4.5 Artificial Intelligence, Automation and Digitalization
- 4.6 Local Manufacturing and Supply Chain Realignment
- 4.7 Industry Partnerships, Mergers and Acquisitions
- 4.8 Sustainability and Circular Economy Developments
- 4.9 Government and Private Sector Investment Trends
- 4.10 Emerging Business Models and Commercialization
- 4.11 Industry Developments and Announcements
Chapter 5 Global Airline A-la-carte Services Market Supply and Demand Analysis
- 5.1 Demand Trend and Consumption Analysis, 2018-2025
- 5.2 Demand Forecast, 2025-2035
- 5.3 Supply Chain Structure and Procurement Trends
- 5.4 Supply-Demand Gap and Bottlenecks
- 5.5 Import Dependence and Sourcing Structure
- 5.6 Regional Supply and Demand Concentration
Chapter 6 Global Airline A-la-carte Services Market Pricing Analysis
- 6.1 Pricing Structure and Measurement
- 6.2 Historical Pricing Trends, 2018-2025
- 6.3 Pricing Outlook, 2025-2035
- 6.4 Pricing by Product and Market Segment
- 6.5 Geographic Pricing Differences
- 6.6 Key Input, Energy, Labor and Logistics Costs
- 6.7 Contract Pricing and Purchasing Models
- 6.8 Pricing Sensitivity and Competitive Positioning
- 6.9 Price, Margin and Profitability Implications
Chapter 7 Global Airline A-la-carte Services Market Dynamics
- 7.1 Market Growth Drivers
- 7.1.1 Demand-Side Drivers
- 7.1.2 Technology and Innovation Drivers
- 7.1.3 Infrastructure and Investment Drivers
- 7.1.4 Regulatory and Policy Drivers
- 7.2 Market Restraints
- 7.2.1 Cost and Affordability Constraints
- 7.2.2 Technology and Adoption Barriers
- 7.2.3 Supply Chain and Operational Constraints
- 7.3 Market Challenges
- 7.3.1 Competitive Pressure and Margin Erosion
- 7.3.2 Skills, Infrastructure and Implementation Gaps
- 7.4 Emerging Market Opportunities
- 7.5 Market Dynamics Impact and Time-Horizon Assessment
Chapter 8 Global Airline A-la-carte Services Value Chain Analysis
- 8.1 Industry Value Chain Overview
- 8.2 Upstream Suppliers and Critical Inputs
- 8.3 Technology and Component Providers
- 8.4 Manufacturing or Service Delivery
- 8.5 Distribution, Channel Partners and Integrators
- 8.6 Downstream Applications and End Users
- 8.7 Value Addition and Profit Pools
- 8.8 Vertical Integration and Outsourcing
- 8.9 Supplier Concentration and Risk
- 8.10 Supply Chain Localization and Resilience
Chapter 9 Global Airline A-la-carte Services Market Regulations and Policies
- 9.1 Relevant Laws, Standards and Compliance Frameworks
- 9.2 Product, Service, Safety and Quality Requirements
- 9.3 Government Policies, Incentives and Subsidies
- 9.4 Imports, Exports and Trade Barriers
- 9.5 Public Procurement and Local Content Requirements
- 9.6 Data Protection, AI and Cybersecurity Compliance
- 9.7 Upcoming Policy Changes and Market Implications
Chapter 10 Global Airline A-la-carte Services Market Hotspots and Opportunities
- 10.1 Market Opportunity Mapping and Growth Hotspots
- 10.2 High-Growth Applications and Customer Groups
- 10.3 Underserved Markets and White-Space Opportunities
- 10.4 Emerging Technology and Product Opportunities
- 10.5 New Capacity and Investment Hotspots
- 10.6 Market Entry and Expansion Opportunities
- 10.7 Distribution and Partnership Opportunities
- 10.8 Near-Term and Long-Term Commercial Potential
- 10.9 Opportunity Attractiveness and Execution Risks
Chapter 11 Global Airline A-la-carte Services Market Outlook, 2025-2035
- 11.1 Market Size and Analysis
- 11.1.1 Revenue (Market Measurement: 2025: USD 105.60 billion → 2035: USD 209.68 billion)
- 11.1.2 Historical Market Size, 2018-2025
- 11.1.3 Base-Year Market Size, 2025
- 11.2 Market Forecast, 2025-2035
- 11.2.1 Revenue Forecast to 2035
- 11.2.2 CAGR and Year-on-Year Growth
- 11.2.3 Incremental Revenue Opportunity
- 11.3 Forecast Assumptions and Scenario Analysis
- 11.3.1 Base-Case Forecast
- 11.3.2 Optimistic and Conservative Scenarios
- 11.3.3 Technology, Pricing and Policy Sensitivities
- 11.4 Market Attractiveness and Growth Outlook
Chapter 12 Global Airline A-la-carte Services Market Segmentation and Outlook
- 12.1 Segmentation Summary and Market Shares, 2025
- 12.2 Largest and Fastest-Growing Segments
- 12.3 By Service Type - Market Size and Forecast, 2025-2035
- 12.3.1 Segment Definition and Scope
- 12.3.2 Historical Market Size, 2018-2025
- 12.3.3 Revenue Forecast, 2025-2035
- 12.3.4 Base-Year Market Share, 2025
- 12.3.5 Segment CAGR and Growth Drivers
- 12.3.6 Subsegment Market Size and Forecast
- 12.3.6.1 Baggage Fees
- 12.3.6.2 Seat Selection
- 12.3.6.3 Priority Boarding & Fare Bundles
- 12.3.6.4 In-Flight Meals & Retail
- 12.3.6.5 Wi-Fi & Other Extras
- 12.3.7 Subsegment Pricing and Adoption Trends
- 12.3.8 Leading Suppliers and Competition
- 12.3.9 Regional Demand and Opportunities
- 12.4 By Booking Channel - Market Size and Forecast, 2025-2035
- 12.4.1 Segment Definition and Scope
- 12.4.2 Historical Market Size, 2018-2025
- 12.4.3 Revenue Forecast, 2025-2035
- 12.4.4 Base-Year Market Share, 2025
- 12.4.5 Segment CAGR and Growth Drivers
- 12.4.6 Subsegment Market Size and Forecast
- 12.4.6.1 Airline Websites & Mobile Apps
- 12.4.6.2 Travel Agents & OTAs
- 12.4.6.3 Airport & Onboard Sales
- 12.4.7 Subsegment Pricing and Adoption Trends
- 12.4.8 Leading Suppliers and Competition
- 12.4.9 Regional Demand and Opportunities
- 12.5 By Flight Class - Market Size and Forecast, 2025-2035
- 12.5.1 Segment Definition and Scope
- 12.5.2 Historical Market Size, 2018-2025
- 12.5.3 Revenue Forecast, 2025-2035
- 12.5.4 Base-Year Market Share, 2025
- 12.5.5 Segment CAGR and Growth Drivers
- 12.5.6 Subsegment Market Size and Forecast
- 12.5.6.1 Economy
- 12.5.6.2 Premium Economy
- 12.5.6.3 Business & First
- 12.5.7 Subsegment Pricing and Adoption Trends
- 12.5.8 Leading Suppliers and Competition
- 12.5.9 Regional Demand and Opportunities
- 12.6 Segment Growth Comparison
- 12.7 Segment Attractiveness and Priority Matrix
Chapter 13 Global Airline A-la-carte Services Geographic Market Outlook, 2025-2035
- 13.1 Regional Market Size and Share, 2025
- 13.2 Regional Market Forecast, 2025-2035
- 13.3 Regional Pricing, Production and Demand Differences
- 13.4 North America
- 13.4.1 United States
- 13.4.2 Canada
- 13.4.3 Mexico
- 13.5 Europe
- 13.5.1 Germany
- 13.5.2 France
- 13.5.3 Italy
- 13.5.4 United Kingdom
- 13.5.5 Spain
- 13.5.6 Poland
- 13.5.7 Russia
- 13.5.8 Netherlands
- 13.5.9 Belgium
- 13.5.10 Sweden
- 13.5.11 Denmark
- 13.5.12 Norway
- 13.5.13 Rest of Europe
- 13.6 Asia Pacific
- 13.6.1 China
- 13.6.2 India
- 13.6.3 Japan
- 13.6.4 South Korea
- 13.6.5 Thailand
- 13.6.6 Indonesia
- 13.6.7 Vietnam
- 13.6.8 Malaysia
- 13.6.9 Australia
- 13.6.10 Rest of Asia Pacific
- 13.7 Latin America
- 13.7.1 Brazil
- 13.7.2 Argentina
- 13.7.3 Colombia
- 13.7.4 Chile
- 13.7.5 Rest of Latin America
- 13.8 Middle East
- 13.8.1 Saudi Arabia
- 13.8.2 United Arab Emirates
- 13.8.3 Turkey
- 13.8.4 Israel
- 13.8.5 Iran
- 13.8.6 Rest of the Middle East
- 13.9 Africa
- 13.9.1 South Africa
- 13.9.2 Egypt
- 13.9.3 Nigeria
- 13.9.4 Morocco
- 13.9.5 Rest of Africa
- 13.10 Regional Investment, Policy and Supply Chain Differences
- 13.11 Regional Competitive Landscape
- 13.12 Geographic Growth Hotspots
Chapter 14 Global Airline A-la-carte Services Technology, Innovation and Sustainability Outlook
- 14.1 Technology Landscape and Maturity
- 14.2 Product, Process and Service Innovation
- 14.3 AI, Automation and Digital Tools in the Industry
- 14.4 Technology Adoption and Performance Benchmarking
- 14.5 Innovation Pipeline and R&D Investment
- 14.6 Energy Efficiency and Resource Management
- 14.7 Sustainability, Recycling and Circularity
- 14.8 Technology Roadmap, 2025-2035
- 14.9 Risks of Obsolescence and Technology Substitution
Chapter 15 Global Airline A-la-carte Services Market Key Strategic Imperatives
- 15.1 Growth and Market Entry Priorities
- 15.2 High-Return Products and Segments
- 15.3 Pricing, Profitability and Cost Optimization
- 15.4 Technology Investment and Product Differentiation
- 15.5 Supply Chain Localization and Resilience
- 15.6 Distribution and Customer Acquisition
- 15.7 Partnership, Acquisition and Capacity Strategy
- 15.8 Regional Expansion Priorities
- 15.9 Short-, Medium- and Long-Term Actions
Chapter 16 Competition Outlook
- 16.1 Industry Competition Characteristics
- 16.2 Market Structure and Concentration
- 16.3 Market Share and Competitive Positioning, 2025
- 16.4 Company-Wise Revenue and Product Benchmarking
- 16.5 Production and Service Capacity Benchmarking
- 16.6 Technology, Pricing and Differentiation
- 16.7 Regional Footprint and Distribution Strength
- 16.8 Mergers, Acquisitions and Strategic Alliances
- 16.9 New Entrants and Competitive Threats
- 16.10 Porter's Five Forces and Industry Attractiveness
- 16.11 Competitive Outlook, 2025-2035
Chapter 17 Company Profiles
- 17.1 Company Coverage and Selection Criteria
- 17.2 Ryanair
- 17.2.1 Business Description
- 17.2.2 Company Ownership and Geographic Presence
- 17.2.3 Product and Service Portfolio
- 17.2.4 Manufacturing and Operating Footprint
- 17.2.5 Financial Performance and Investment
- 17.2.6 Market Share and Competitive Position
- 17.2.7 Technology and Innovation Capabilities
- 17.2.8 Strategic Alliances or Partnerships
- 17.2.9 Recent Developments
- 17.2.10 Growth Strategy and Outlook
- 17.3 Delta Air Lines
- 17.4 United Airlines
- 17.5 American Airlines
- 17.6 Southwest Airlines
- 17.7 Alaska Air Group (Alaska Airlines, Hawaiian Airlines)
- 17.8 easyJet
- 17.9 Wizz Air
- 17.10 Air France-KLM
- 17.11 Emirates
- 17.12 Turkish Airlines
- 17.13 Singapore Airlines
- 17.14 IndiGo (InterGlobe Aviation)
- 17.15 Volaris
- 17.16 Cebu Pacific
- 17.17 Other Relevant Market Participants
Note: Every listed company is profiled on the structure shown under the first company. The company list is preliminary and may change based on research findings, market developments, data availability and client requirements.
Chapter 18 Disclaimer
- 18.1 Research and Forecast Disclaimer
- 18.2 Data Source and Estimation Limitations
Note: The depth of individual sections depends on data availability for this market. Volume, capacity, trade and other unit-based metrics are included where applicable.