Allantoin extract for skincare products rides barrier care
The global allantoin extract for skincare products market was valued at USD 178.6 million in 2025 and is projected to increase from USD 186.6 million in 2026 to USD 277.4 million by 2035, registering a CAGR of 4.50% during 2026–2035. Demand comes from makers of body lotions, facial creams, baby care, lip protectants and sensitive-skin serums that use allantoin as a soothing and skin protecting active at low doses. Asia Pacific held the largest regional share, 38.0% in 2025, and is also the fastest-growing region at 5.3% a year, because Chinese plants sell bulk grades at the lowest listed prices and Korean contract manufacturers export skin care worldwide. In the United States, allantoin is one of the few cosmetic actives that can also carry an over-the-counter skin protectant claim. Buyers pay little for the ingredient per jar, so they choose suppliers on documentation, purity and supply security. Tariffs on Chinese hydantoin derivatives and consolidation among Western ingredient suppliers are the main forces changing purchasing terms in 2025 and 2026.
Which allantoin grades and buyers does the estimate count?
The estimate counts allantoin sold to skincare formulators, whether made by synthesis or taken from plant sources, together with allantoin complexes such as alcloxa, valued at the price the ingredient supplier receives. Cosmetic, pharmacopeial and micronized grades are included when they go into moisturizers, facial creams, sunscreens, cleansers or serums.
Finished skincare products, oral care, hair care, wound care drugs and agricultural uses sit outside the estimate, although they use the same molecule. Large brand owners buy on annual contracts from producers or their agents, while smaller brands and contract fillers buy drums and pails through chemical distributors and online ingredient shops.

Allantoin Extract for Skincare Products Market Insights
- The market is valued at USD 178.6 million in 2025 and is projected to reach USD 277.4 million by 2035, growing at a 4.50% CAGR as soothing and barrier claims spread across skincare.
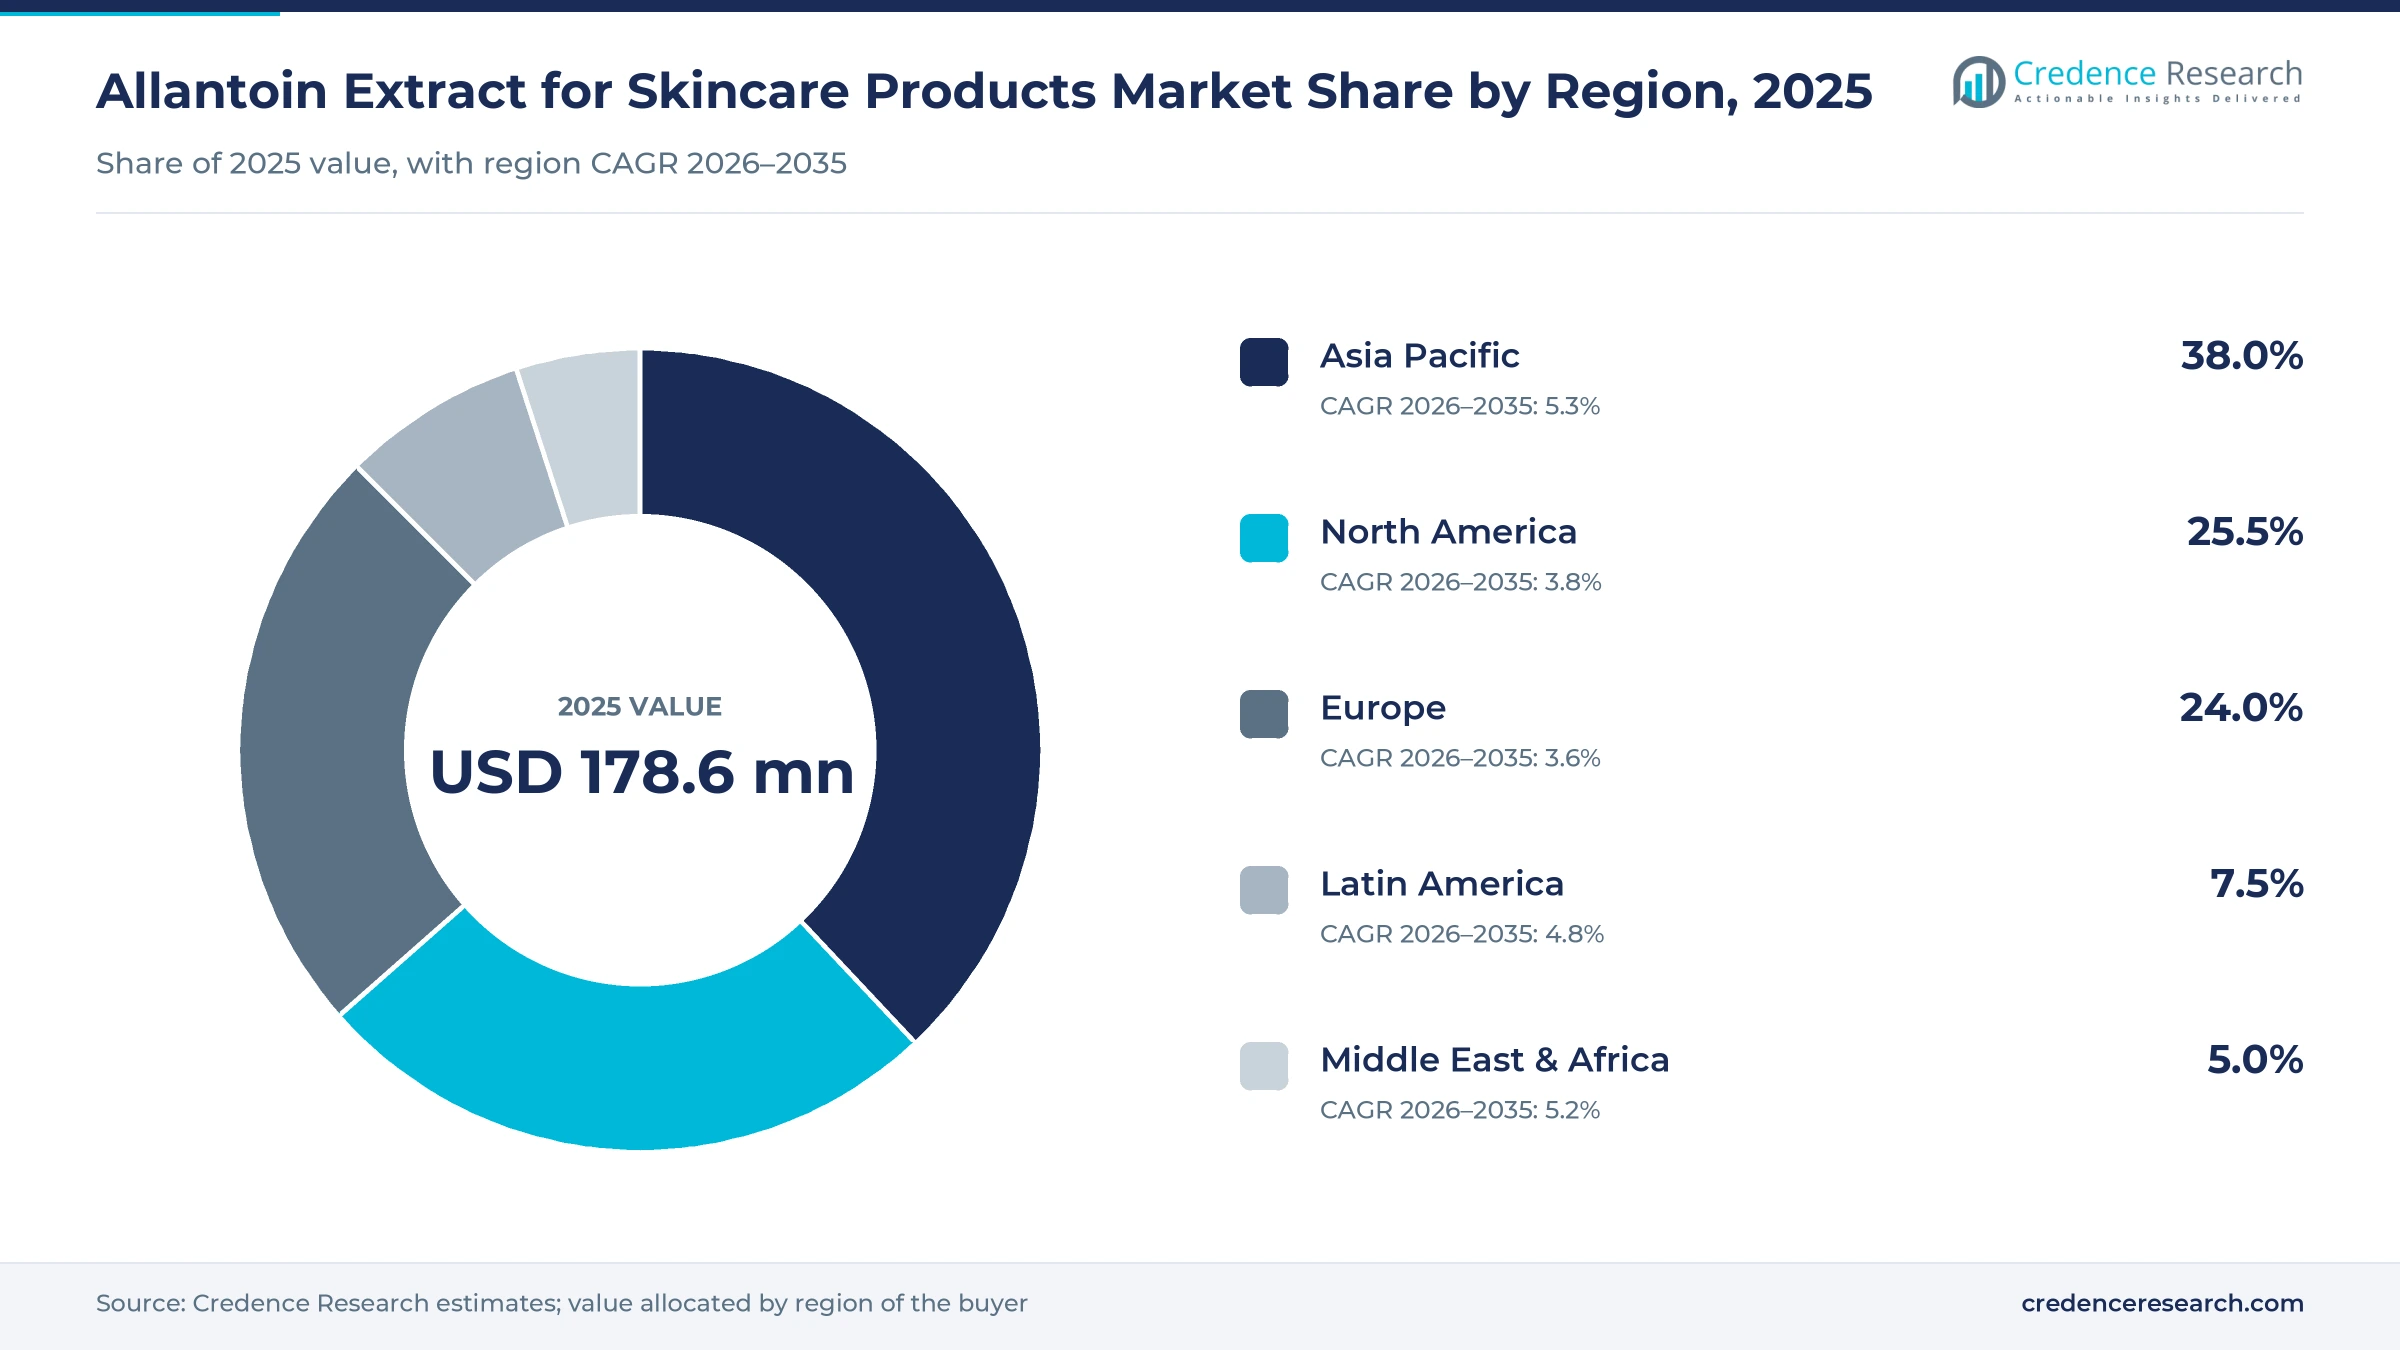
- Asia Pacific led with 38.0% of 2025 value and grows fastest at 5.3% a year, as Chinese plants and Korean contract manufacturers expand.
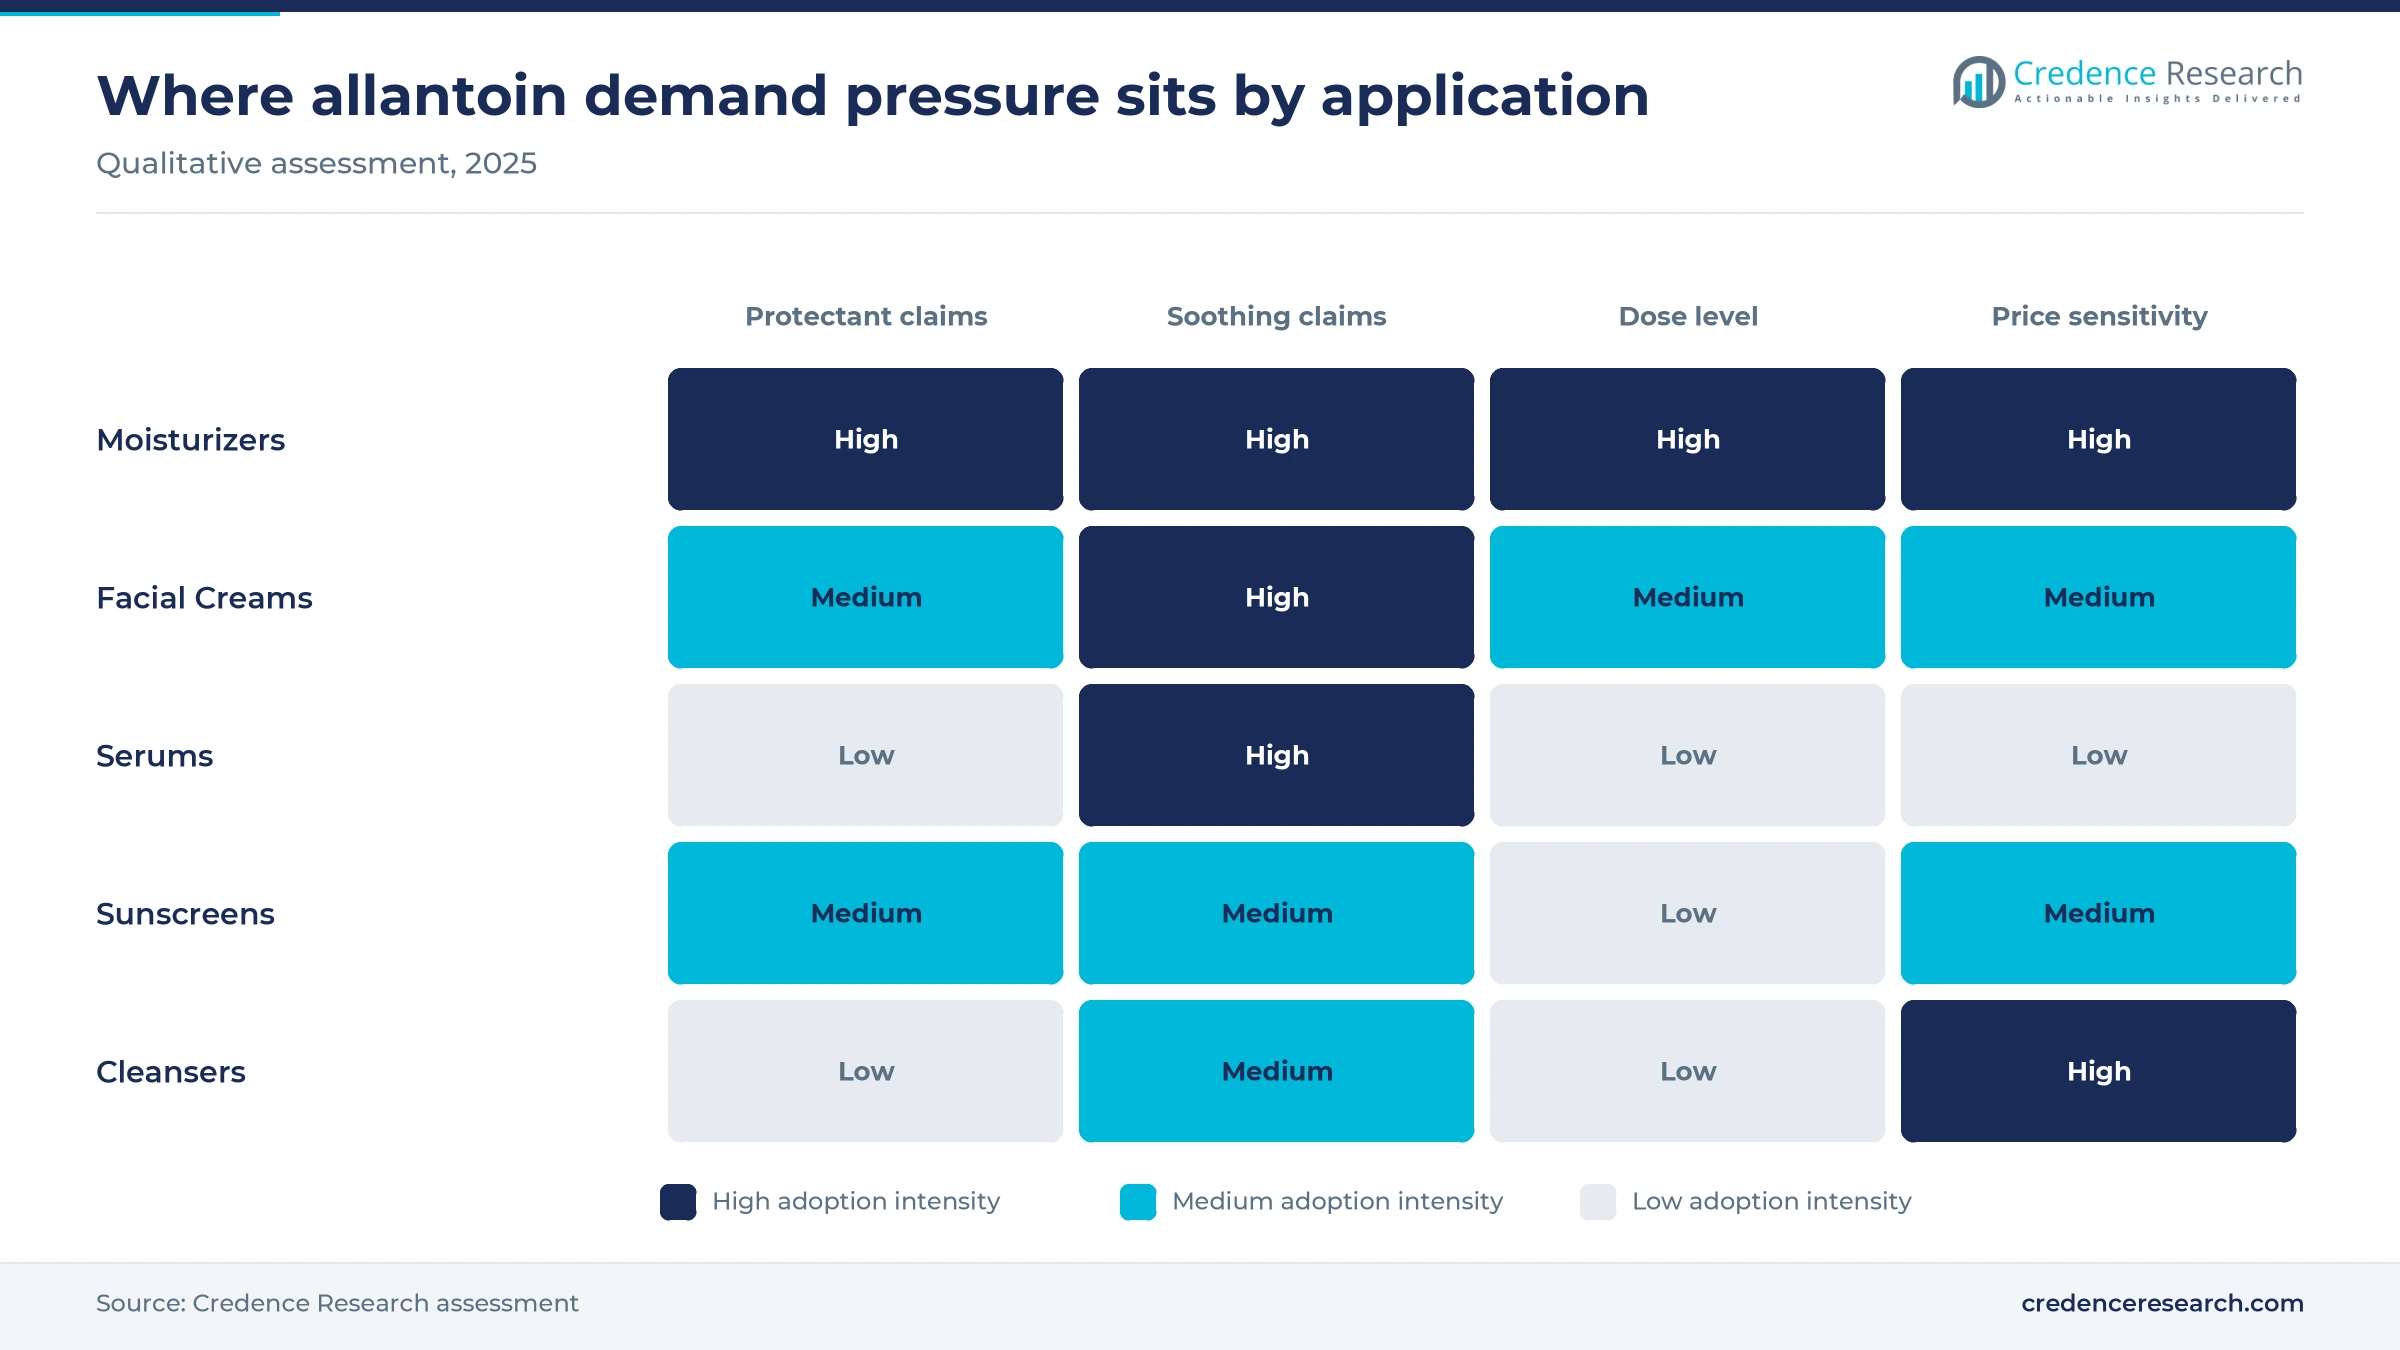
- Moisturizers held 33.0% of 2025 value, because body and hand lotions most often pair allantoin with skin protectant claims.
- South Korea's cosmetics exports reached a record USD 10.2 billion in 2024, pulling more soothing actives through Asian supply chains.
- China took USD 2.5 billion and Japan USD 1 billion of Korean cosmetics exports in 2024, keeping Northeast Asia the densest outlet for soothing actives.
Moisturizers and creams lead while serums and gels gain
Why do moisturizers lead while serums grow fastest?
Based on application, the market is categorized into moisturizers, facial creams, sunscreens, cleansers and serums. Moisturizers led the application segment with 33.0% of global value in 2025. Body, hand and baby lotions are where brands most often pair allantoin with protectant claims at up to 2% of the formula, the ceiling the Cosmetic Ingredient Review recorded in its survey of use concentrations. Serums grow fastest at 5.6% a year as Korean-style essences and ampoules spread, with Korean skin care exports reaching USD 7.67 billion in 2024. Serum makers face a limit, since water-thin formats hold little dissolved allantoin.
Why do cream bases dominate and gels gain share?
Based on formulation type, the market is categorized into cream-based, water-based, gel-based and oil-based products. Cream-Based formats led the formulation segment with 42.0% of global value in 2025. They lead because allantoin dissolves in water only to about 0.5%, and supplier Lotioncrafter advises suspending higher doses in a thick base to stop recrystallization. Creams take the ingredient easily when it is added below 50 degrees Celsius. Gel-Based formats grow fastest at 5.5% a year as gel networks hold suspended crystals in clear textures. Formulators that blend allantoin with emollients in creams keep most of the volume.
Why does personal care lead while professional skincare grows fastest?
Based on end use, the market is categorized into personal care, professional skincare and cosmetic products. Personal Care led the end use segment with 56.0% of global value in 2025. Mass lotions, baby care and hand creams buy the largest tonnage, and skin care was the largest cosmetics category in Europe at EUR 32.3 billion in 2025, according to Cosmetics Europe. Professional Skincare grows fastest at 5.5% a year as clinic and pharmacy brands add soothing actives to post-procedure and sensitive-skin ranges, although no public statistic separates this channel, so the rate is a Credence Research estimate. Color cosmetics with skin care claims, such as tinted balms, add smaller volumes.
| Segment Group | Leading Sub-segment | Share, 2025 | Fastest-growing Sub-segment | CAGR, 2026–2035 |
|---|---|---|---|---|
| By Application | Moisturizers | 33.0% | Serums | 5.6% |
| By Formulation Type | Cream-Based | 42.0% | Gel-Based | 5.5% |
| By End Use | Personal Care | 56.0% | Professional Skincare | 5.5% |
Documentation, not dose cost, sets allantoin prices
Allantoin is priced per kilogram, and the spread between Chinese bulk listings and documented Western grades is wide. A small-lot U.S. supplier lists 20 pounds of Allantoin USP at USD 349.95, about USD 38.6 per kilogram, several times the USD 8 to 9 per kilogram that a Chinese seller posts for a 99% grade on the echemi marketplace. Price matters little to the finished product, because a 50 gram cream dosed at half a percent holds only 0.25 gram of allantoin. Buyers choose on documentation, consistency and supply security, which lets audited suppliers hold premiums while commodity sellers compete on freight and payment terms.
| Grade or reference | Typical price or fee | Basis |
|---|---|---|
| Chinese 99% allantoin listing, FOB | USD 8–9 per kg | Guangzhou Yaoguang Technology listing on echemi, November 2026 |
| Allantoin USP, 20 lb pail, United States | USD 349.95, about USD 38.6 per kg | Lotioncrafter list price, November 2026 |
| Branded cosmetic or USP grade, drum lots | About USD 15–25 per kg | Credence Research estimate between bulk and small-lot prices |
Request a Free Sample
Fill in your details and we'll send you a free sample report.
- Sample data tables & charts
- Research methodology
Protectant status, Korean exports and sensitive skin
OTC skin protectant status anchors drug-grade demand
Allantoin holds an unusual position among cosmetic actives, because U.S. rules let finished products carry a drug claim when the ingredient sits within a fixed range. The federal skin protectant monograph lists allantoin at 0.5 to 2 percent as an approved active. Brands that sell diaper rash creams, lip protectants and chafing balms can label skin protection without a new drug application. Ashland says its Allantoin USP meets both the U.S. and European Pharmacopoeia monographs, the standard that such drug-claim products require. Competing actives in the same monograph include dimethicone at 1% to 30% and colloidal oatmeal at a 0.007% minimum, so allantoin wins where formulators want a protectant claim at a low dose. Suppliers holding pharmacopeial grades and paperwork win this volume, while cosmetic-grade sellers compete for claim-free formulas.
K-beauty export growth pulls soothing actives through Asia
Korean skin care exports have become one of the largest single pulls on soothing actives, because Korean contract manufacturers build barrier-repair and calming claims into toners, essences and creams sold worldwide. South Korea's cosmetics exports reached a record USD 10.2 billion in 2024, up 20.6% from a year earlier, according to the Ministry of Food and Drug Safety. Shipments to the United States rose 57%, which carries Korean formulas into the largest prestige market outside Asia. Allantoin suits these formulas because it adds a soothing claim at low cost per dose and leaves no color or odor. Each Korean formula qualified on a given allantoin grade then generates repeat orders for that grade. Producers that can ship cosmetic grades quickly to Korean manufacturers gain volume ahead of distant suppliers.
European skin care spending sustains a large protectant base
Europe remains a deep outlet for allantoin, because skin care is the largest category of cosmetics spending in the region and the ingredient faces few use limits. Retail sales of cosmetics and personal care in Europe reached EUR 110 billion in 2025, and skin care accounted for EUR 32.3 billion, according to Cosmetics Europe. The COSMILE Europe ingredient database lists allantoin as skin conditioning, skin protecting and soothing, and it lists no restriction on its use. Those functions recur on sensitive-skin, hand care and baby care labels in mass and pharmacy channels alike, which keeps baseline demand stable through economic cycles. Producers with REACH registration and plants inside Europe keep an advantage with brand owners that audit their supply chains.
Sensitive-skin positioning lifts use in pharmacy brands
Brands building sensitive-skin and post-procedure ranges use allantoin as a low-risk soothing agent, which widens demand beyond basic moisturizers. The Cosmetic Ingredient Review expert panel concluded in 2010 that allantoin and its complexes are safe as used in cosmetics, noting that 1,376 cosmetic products using allantoin had been reported to the FDA and that allantoin ascorbate was used at no more than 0.05%. Supplier dsm-firmenich describes its allantoin as an anti-irritant and protecting agent that improves skin moisture retention and suits anti-aging products. The same supplier lists the grade on Chinese, U.S. and European chemical inventories, so one material can serve global launches. Demand from dermocosmetics brands sold through pharmacies favors suppliers that provide safety files and clinical support for soothing claims.
China filing reform, portfolio sales and new channels
China's cosmetics reform is shifting safety files to companies
Chinese regulators are shifting raw material safety documentation from filing reviews toward company-held records, which raises the value of well-documented ingredient grades. The National Medical Products Administration issued opinions on deepening cosmetics regulation reform on Nov. 14, 2025, and introduced 24 measures in that notice. One measure lets enterprises archive raw material safety information for reference rather than pass it through the regulatory process. Another cuts the review time for high-risk changes to special cosmetics from 90 to 60 working days. Allantoin already appears on the Chinese inventory of existing cosmetic ingredients, as the dsm-firmenich listing noted above shows. Brand owners gain faster launches, while suppliers that hand over complete safety dossiers become preferred sources for Chinese formulators.
Ingredient groups are shifting cosmetic actives to new owners
Ownership of cosmetic active portfolios is shifting toward specialists and Asian groups, which changes who sells branded allantoin grades to formulators. Global New Material International acquired the Surface Solutions business of Merck KGaA on July 31, 2025, for EUR 665 million, and the business now trades as Susonity. The divested division was known for its RonaCare range of cosmetic ingredients, which includes a RonaCare Allantoin grade for skin and hair care. Susonity keeps its headquarters in Gernsheim, Germany, with about 1,100 employees worldwide, so European buyers face a new owner rather than a plant exit. Formulators that bought allantoin bundled with other actives must now requalify contracts with new owners, which gives buyers negotiating room while sellers work to keep service levels unchanged.
U.S. listing rules open room for documented supply
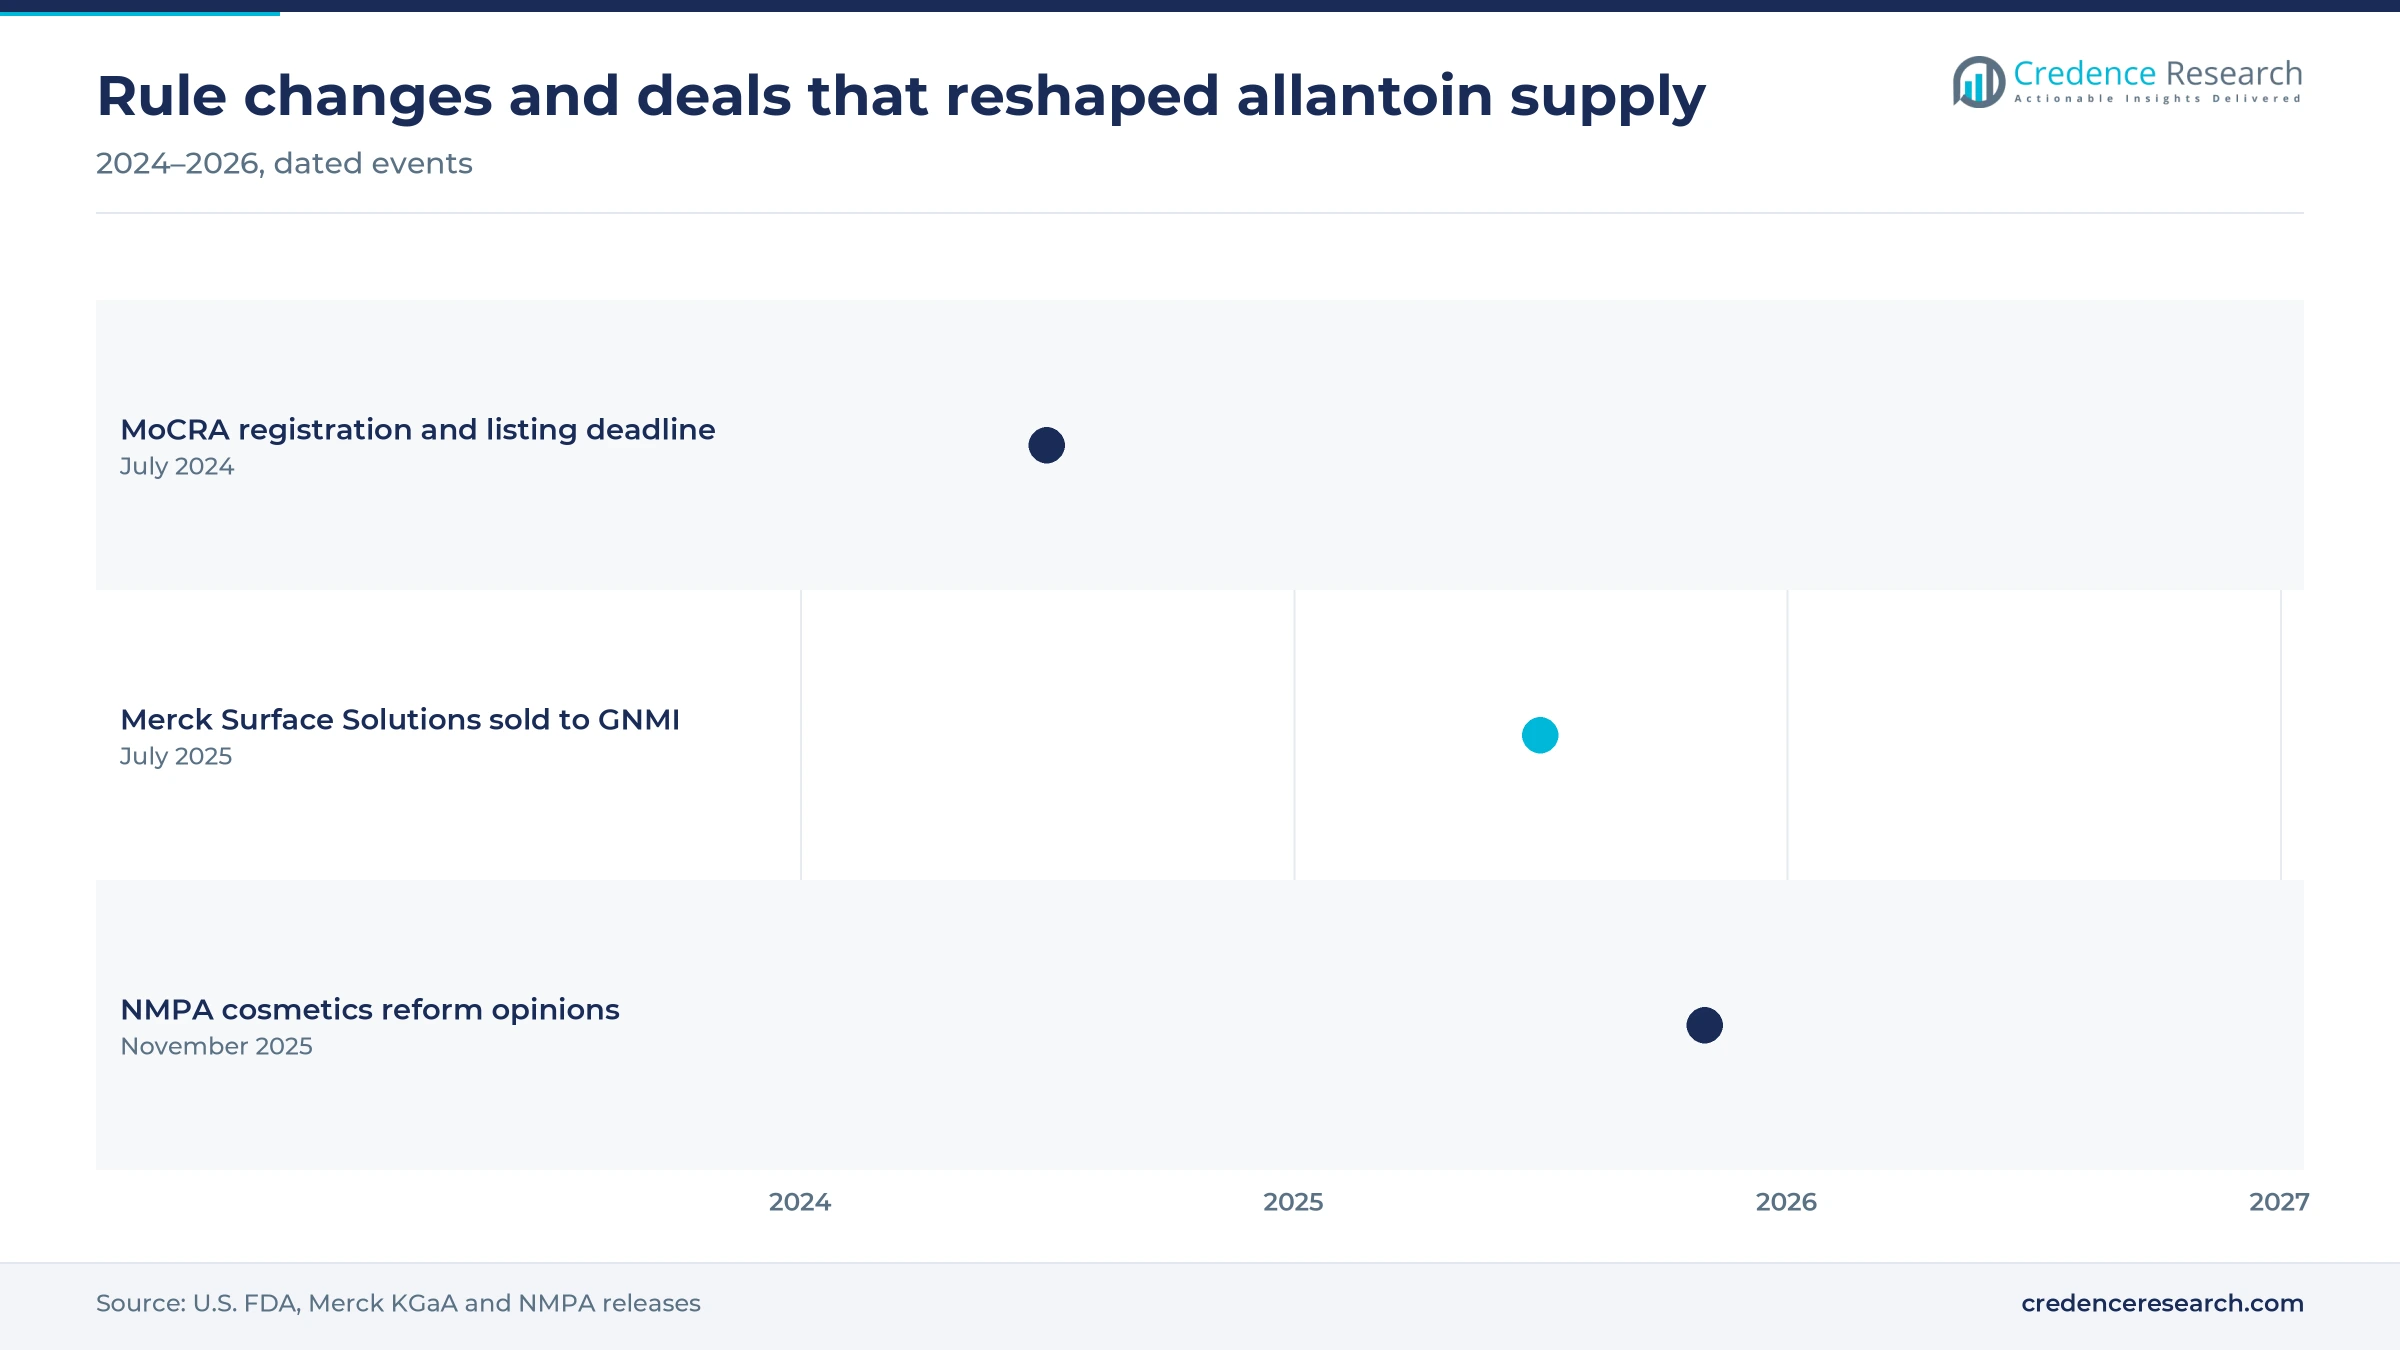
The U.S. cosmetics law of 2022 creates an opening for allantoin suppliers that can document grade, origin and manufacturing site for each lot. Under the Modernization of Cosmetics Regulation Act, facilities had to register and responsible persons had to list each product, including its ingredients, by July 1, 2024, the Food and Drug Administration said. Listings must be updated every year, so ingredient changes now leave a record that brands must manage. Smaller brands and contract fillers often lack regulatory staff, which makes supplier specification sheets and certificates more valuable to them, especially for drug-claim protectant lotions. Distributors and producers that bundle compliance files with allantoin can charge more than commodity importers and keep accounts longer.
Latin American and Gulf demand offers new distribution routes
Latin America and the Gulf offer an opening for allantoin suppliers that build regional distribution, because local skin care production and imports are both rising. Brazil's cosmetics, toiletry and perfumery exports rose 7.7% to USD 133.5 million in January and February 2024, according to industry association Abihpec, with skin creams among the top products. The United Arab Emirates entered the top ten destinations for Korean cosmetics in 2024, displacing Malaysia, the Korean ministry data show. Brazilian formulators and Gulf distributors buy smaller lots than Asian contract manufacturers, which favors suppliers with local warehouses. Latin America grows at 4.8% a year and Middle East & Africa at 5.2%, so suppliers with regional stock can win share from importers shipping drum lots from China.
Tariffs, comfrey risks and Chinese price pressure
U.S. tariffs raise the landed cost of Chinese allantoin
Tariffs raise landed costs for U.S. buyers that source allantoin from Chinese producers. The U.S. Harmonized Tariff Schedule applies a general duty of 6.5% to hydantoin and its derivatives under subheading 2933.21, and China-origin goods carry an additional 25% duty on China-origin goods on top of the general rate. Contract manufacturers and private-label brands that buy on price are most exposed, because imported Chinese grades anchor their cost sheets. Buyers can shift to suppliers in countries with U.S. trade agreements, such as South Korea, whose goods enter duty free, though often at higher base prices.
Comfrey safety concerns narrow plant-derived supply
Brands that want plant-derived allantoin face a narrow and risky supply route, because comfrey root, a traditional natural source, also contains pyrrolizidine alkaloids. U.S. regulators moved against comfrey in dietary supplements in July 2001 over pyrrolizidine alkaloids, and although that action did not cover cosmetics, it still shapes how brands judge comfrey-derived extracts. COSMILE Europe notes that allantoin occurs in comfrey root and horse chestnut bark, while dsm-firmenich lists its own grade as synthetic. Natural-claim brands are most exposed, since they must prove extracts are free of alkaloids or accept nature-identical material.
Weak Chinese beauty spending slows domestic offtake
Soft consumer spending on cosmetics in China slows offtake for domestic allantoin producers that rely on local brands. Retail sales of cosmetics fell 1.1% to 435.7 billion yuan in 2024, while total retail sales of consumer goods rose 3.5%, the National Bureau of Statistics said. Chinese mass-market brands cut launches and inventories when sales fall, and their ingredient orders shrink first. Domestic producers are the most exposed group, and the weak home market pushes more Chinese allantoin into export channels at lower prices.
Chinese plant scale compresses prices for Western producers
Large Chinese plants compress allantoin prices, which squeezes producers with higher labor and energy costs in Europe and North America. Wuhu Huahai Biology Engineering lists allantoin capacity of 300 metric tons a month, or about 3,600 metric tons a year, at its site in Wuhu, China. Its listing offers a 99% minimum assay in 25 kilogram drums, a standard cosmetic specification. Western producers are most exposed in commodity grades, and they defend share only where buyers pay for pharmacopeial documentation, audits and supply security.
Asia Pacific leads on Chinese plants and Korean formulators
| Region | Value, 2025 (USD million) | Share, 2025 | CAGR, 2026–2035 |
|---|---|---|---|
| Asia Pacific | 67.9 | 38.0% | 5.3% |
| North America | 45.5 | 25.5% | 3.8% |
| Europe | 42.9 | 24.0% | 3.6% |
| Latin America | 13.4 | 7.5% | 4.8% |
| Middle East & Africa | 8.9 | 5.0% | 5.2% |
Asia Pacific leads on Chinese plants and Korean formulators
Asia Pacific held 38.0% of 2025 value and grows fastest at 5.3% a year. The lead holds because the region hosts the largest allantoin plants identified in public listings and formulates a rising share of global skin care. Chinese producers such as Wuhu Huahai, with the listed capacity of about 3,600 metric tons a year described above, supply both local and export buyers. Korean contract manufacturers then turn imported and local supply into toners, creams and essences for export. China's weak cosmetics retail sales in 2024, noted in the challenges, temper growth, so formulators in Korea and Japan carry more of the gain.
North America relies on OTC protectant and lotion demand
North America held 25.5% of 2025 value and grows at 3.8% a year. Demand there rests on mature protectant, baby care and lotion categories rather than on new users. The July 1, 2024, MoCRA listing deadline, discussed above, put ingredient records for every marketed product in front of the Food and Drug Administration. Tariffs on Chinese hydantoin derivatives push some buyers toward documented Western grades. Ashland and dsm-firmenich supply pharmacopeial and cosmetic grades into the region, while private-label lotion makers still buy imported commodity material.
Europe keeps a mature base and local synthetic supply
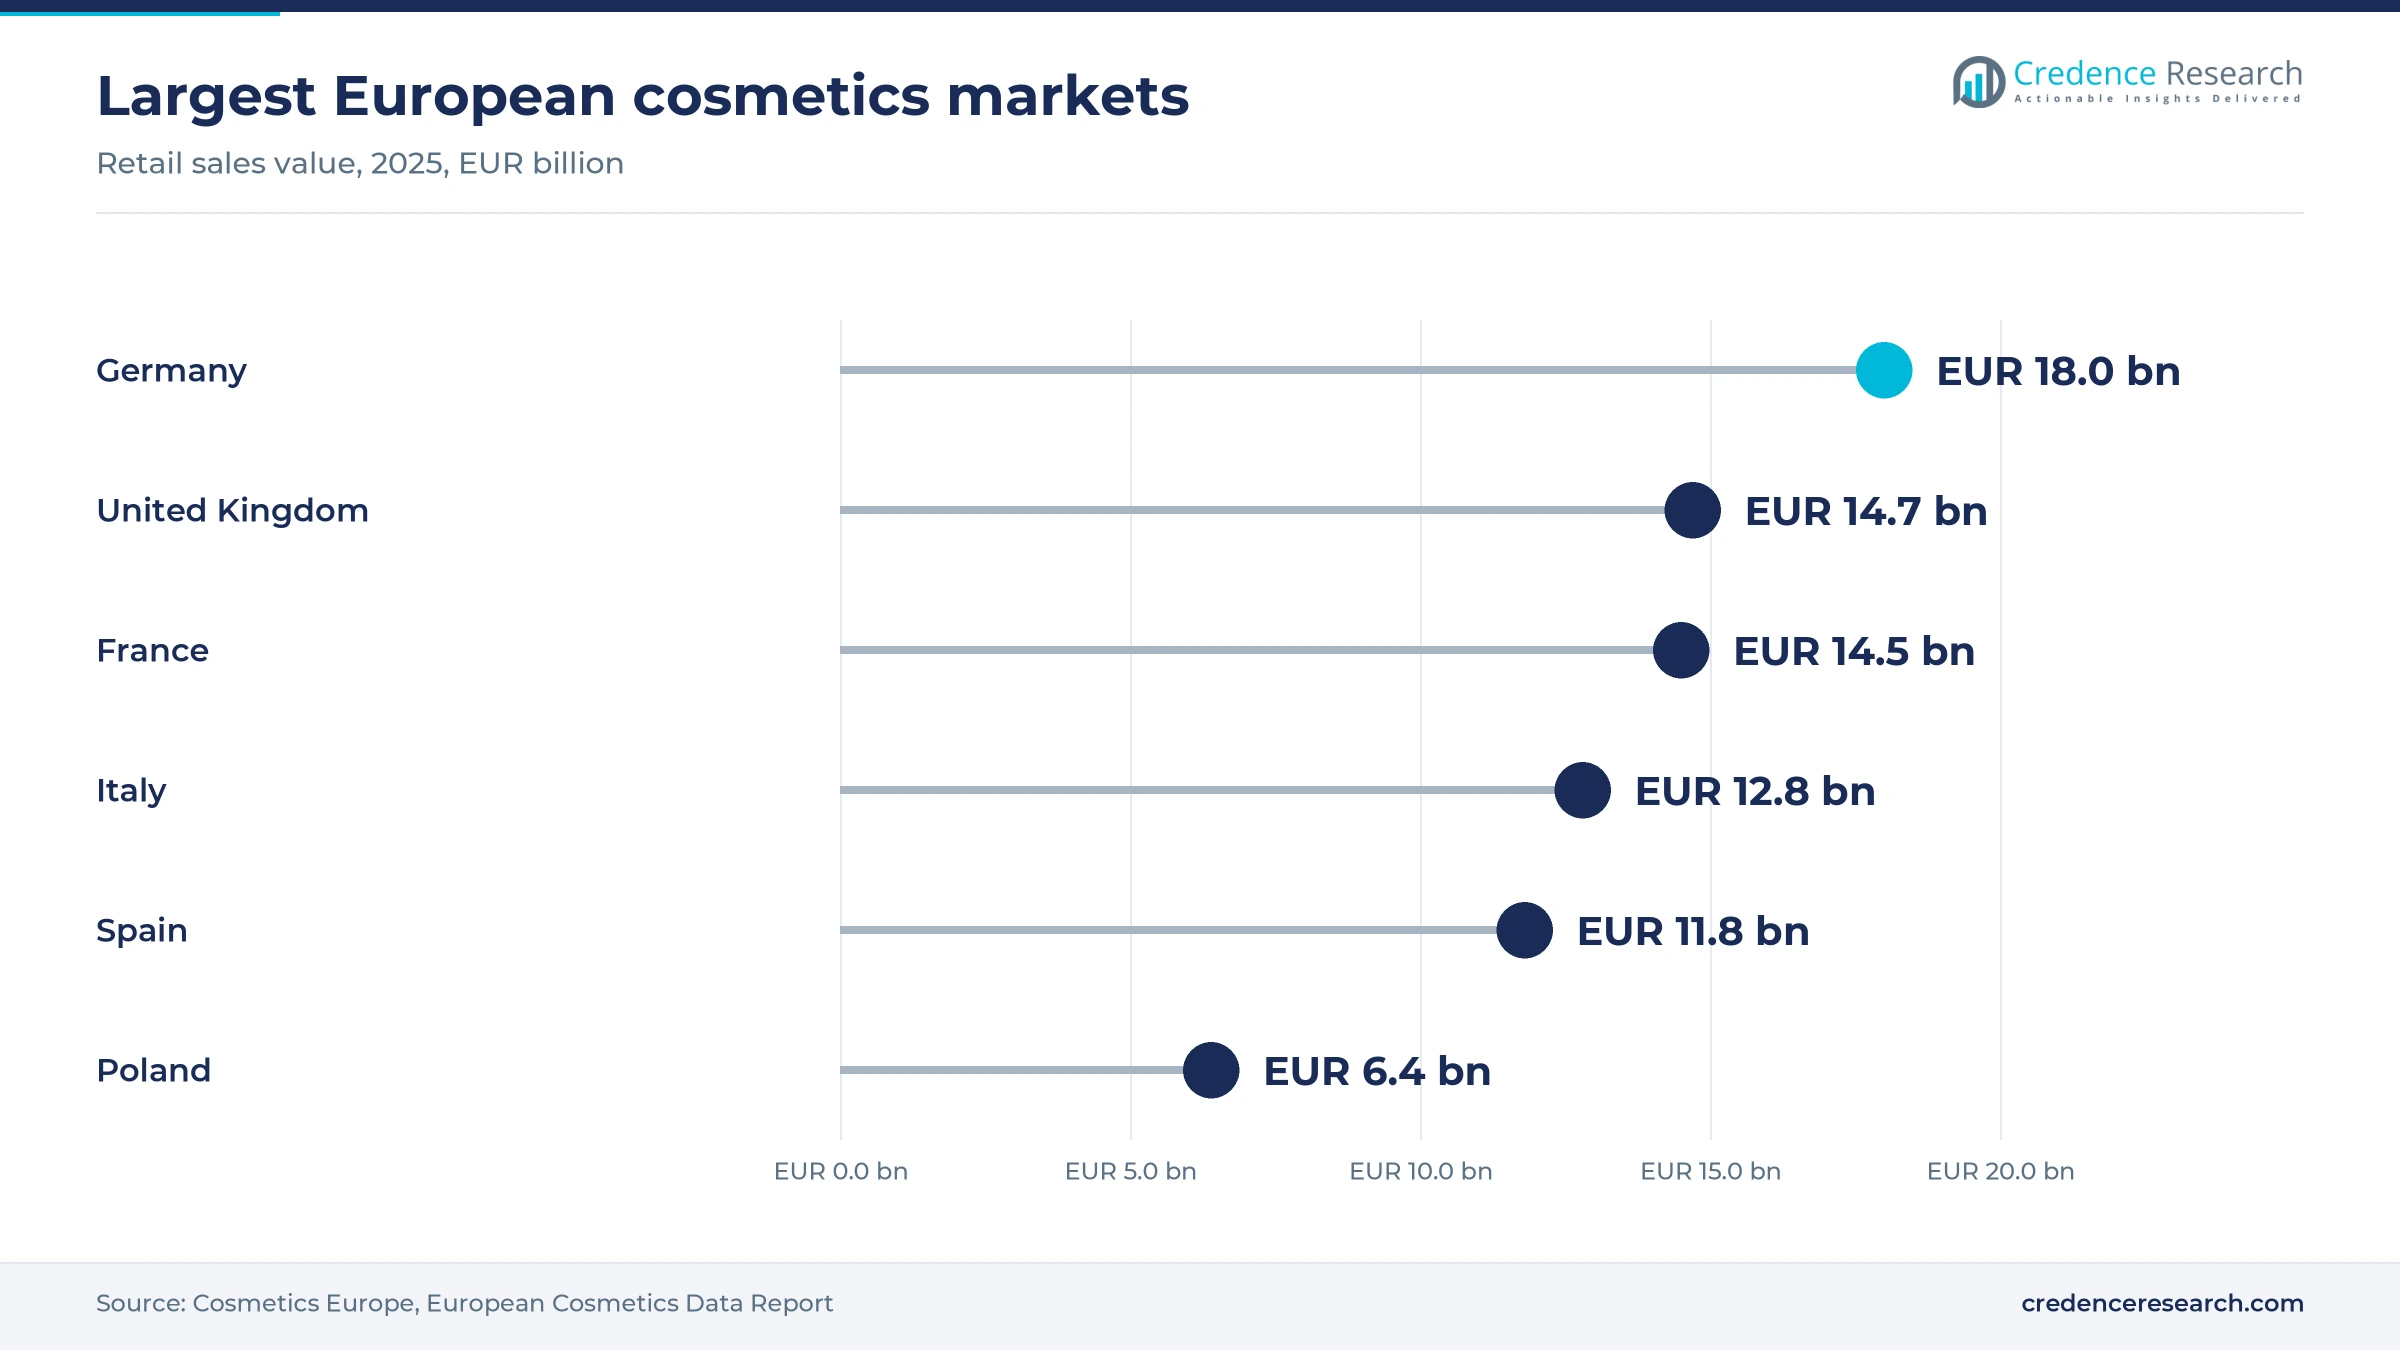
Europe held 24.0% of 2025 value and grows at 3.6% a year, the slowest rate among regions. Its large skin care base is mature and price competitive. Germany is the largest national cosmetics market at EUR 18.0 billion in 2025, ahead of France at EUR 14.5 billion, Cosmetics Europe data show. Local production supports supply security, since WeylChem makes synthetic allantoin at its Lamotte plant and Italian supplier Akema sells allantoin complexes such as Alcloxa. Pharmacy brands that audit their suppliers can value this documented European origin highly.
Latin America grows on Brazilian formulation and exports
Latin America held 7.5% of 2025 value and grows at 4.8% a year. Growth comes mainly because Brazil's personal care industry formulates for both domestic and regional buyers. Abihpec reported that Brazilian exports rose to Mexico, Colombia, Chile and Peru in early 2024, with skin creams among the leading products. Most allantoin reaches the region through distributors that import Chinese and European grades. Currency stress shapes ordering, as Argentina's foreign exchange shortage cut Brazilian shipments there by 25% in the same period.
Middle East & Africa builds on Gulf retail and halal demand
Middle East & Africa held 5.0% of 2025 value and grows at 5.2% a year. From the smallest base, growth follows expanding Gulf retail and halal-certified skin care. The United Arab Emirates joined the top ten markets for Korean cosmetics exports in 2024, as noted above. Halal documentation matters for ingredient suppliers here, and dsm-firmenich lists its allantoin grade as halal, kosher and vegan friendly. Regional distributors that hold such certificates stand to capture most of this growth.
Deals and rule changes reshaped supply in 2024 and 2025
| Development | Status and market relevance |
|---|---|
| In July 2024, the U.S. Food and Drug Administration's deadline for cosmetic facility registration and product listing, including ingredients, took effect under MoCRA. | Regulatory requirement in force; brands now need lot-level ingredient documentation from allantoin suppliers. |
| In July 2025, Merck KGaA completed the sale of its Surface Solutions business to Global New Material International for EUR 665 million, and the unit now trades as Susonity. | Completed divestment; buyers of the former RonaCare cosmetic ingredient range deal with a new owner. |
| In November 2025, China's National Medical Products Administration issued opinions on deepening cosmetics regulation reform, with 24 measures. | Policy issued; enterprises will archive raw material safety information, and review times for some changes fall. |
Synthesis, suspension and complexing set grade value
- Glyoxylic acid and urea condensation is one of the synthetic routes the Cosmetic Ingredient Review describes, and it lets producers make nature-identical allantoin at scale.
- Uric acid oxidation uses sodium hydroxide and potassium permanganate to convert uric acid, a second route described in the same review.
- Micronization and suspension reduce particle size so creams and gels can carry allantoin above its low water solubility without grit.
- Complexing with metal salts binds allantoin with aluminum compounds, as in Akema's Alcloxa, which adds astringent functions for oily and blemish-prone skin.
Need a Custom Version of This Report?
Tailor the scope, geography, or segments to your exact requirements.
- Custom geography or segment scope
- Direct access to our analyst team
Documented Western grades compete with Chinese bulk
Competition turns on documentation, purity and supply reliability rather than on list price, because allantoin costs a formulator very little per unit. Supplier dsm-firmenich sells a synthetic grade listed on the Chinese, U.S. and European inventories. Ashland supplies Allantoin USP that meets U.S. and European pharmacopeial monographs. WeylChem, part of International Chemical Investors Group, makes allantoin at its Lamotte plant and sells it directly to personal care buyers. Akema sells allantoin complexes, and Susonity took over the business that sold the RonaCare range. Chinese producers such as Wuhu Huahai Biology Engineering and Shandong Ailitong New Materials sell bulk cosmetic grades at the lowest prices. Suppliers of cosmetics active ingredients often bundle allantoin with other soothing agents. The seven companies profiled below cover Western documented supply and Chinese bulk capacity.
Why do Chinese bulk plants and audited Western grades split the margins?
Allantoin supply splits into two clear layers that serve different buyers. Chinese producers such as Wuhu Huahai and Shandong Ailitong make bulk cosmetic grades at scale and compete mainly on price. Western suppliers such as WeylChem, dsm-firmenich, Ashland, Akema and Susonity sell pharmacopeial or branded grades with full documentation, and WeylChem launched direct sales of allantoin to personal care buyers in January 2017. Entry barriers are low in commodity grades but high in drug-grade supply, where audits and pharmacopeial compliance take years to build. Margins sit with documented grades and with complexes such as alcloxa, while bulk sellers earn thin spreads.
Companies profiled and their roles in this market
| Company | Type | Role in the market |
|---|---|---|
| dsm-firmenich | Full-line supplier | Sells synthetic allantoin for skin care, sun care and toiletries worldwide |
| Ashland Inc. | Specialty ingredient supplier | Sells Allantoin USP meeting U.S. and European pharmacopeial monographs |
| WeylChem (International Chemical Investors Group) | Producer | Makes synthetic allantoin at Lamotte and sells directly to personal care |
| Akema S.r.l. | Specialist | Italian supplier of allantoin and complexes such as Alcloxa A.S. Modified |
| Susonity (Global New Material International) | Cosmetic ingredient supplier | Former Merck Surface Solutions unit, known for the RonaCare ingredient range |
| Wuhu Huahai Biology Engineering Co., Ltd. | Local manufacturer, China | Lists 300 metric tons a month of 99% allantoin capacity |
| Shandong Ailitong New Materials Co., Ltd. | Local manufacturer, China | Sells first-grade and premium-grade cosmetic allantoin |
Documentation, not price, decides supplier choice
Credence Research's view is that documentation, more than price, now decides which suppliers win business in the allantoin extract for skincare products market. The ingredient costs about a cent or less per jar, so brand owners care about pharmacopeial status, inventory listings, safety files and supply security. U.S. listing rules and China's shift of safety records to companies both reward suppliers that can document every lot. Chinese bulk producers will keep winning price-led volume, while Western and Korean-facing suppliers should compete on audited grades. Buyers that rely on a single Chinese source should qualify a documented second source before tariff or supply shocks hit.
Earlier estimate replaced by a tonnage and price build
The report uses 2025 as the base year and forecasts to 2035. The earlier Credence Research estimate for 2024 was tested against an estimate of global allantoin tonnage used in skincare multiplied by typical grade prices, using producer capacity listings, trade statistics for hydantoin derivatives and published price lists, and the 2025 value was reset to that estimate. Regional and segment shares are Credence Research estimates based on skin care manufacturing, export data and the location of allantoin plants. Sources include regulators, statistics offices, industry associations, company product data and trade press. No interviews or surveys were conducted for this update of the estimate.
Asian formulators and documented grades carry growth
Growth of the allantoin extract for skincare products market to 2035 depends on Asian skin care exports and on the price discipline of Chinese producers. The base case assumes Korean and Chinese formulators keep raising output, that U.S. protectant and baby care demand stays steady, and that bulk prices stay near 2026 levels. Serums and gel formats should gain share as micronized grades improve suspension. Western suppliers should lose some commodity volume to Chinese plants but hold documented grades, while new owners of cosmetic active portfolios keep competing for brand contracts.
Asian export demand and Chinese pricing set the range
The spread of outcomes depends mainly on how fast Korean and Chinese skin care exports grow, and on whether Chinese producers keep adding capacity faster than demand. Lower bulk prices would shrink market value even if shipped tonnage keeps rising. Stronger premiums for documented grades in the United States and China, driven by listing and safety file rules, are the main upside for this ingredient.
| Scenario | CAGR, 2026–2035 | Value, 2035 | What has to hold |
|---|---|---|---|
| Downside | 3.3% | USD 250.0 million | Chinese oversupply cuts prices and Western brands trim protectant claims in mass lotions |
| Base | 4.50% | USD 277.4 million | Skin care exports grow steadily and bulk prices stay near 2026 levels |
| Upside | 5.5% | USD 302.2 million | Korean and Chinese exports keep rising and documented grades earn wider premiums |
Frequently Asked Questions
How big is the allantoin extract for skincare products market?
Which application uses the most allantoin in skincare?
Which region leads demand for skincare allantoin?
What concentration of allantoin does the FDA allow as a skin protectant?
Is allantoin in skincare natural or synthetic?
How much does cosmetic grade allantoin cost?
Who are the main allantoin suppliers for skincare?
What restrains the market for skincare allantoin?
Table of Content
Chapter 1 Market Segmentation
- 1.1 Segmentation Framework
- 1.1.1 Product and Service Classification
- 1.1.2 Application and End-Use Classification
- 1.1.3 Technology and Solution Classification
- 1.1.4 Customer and Distribution Channel Classification
- 1.1.5 Geographic Segmentation
- 1.1.6 Market Segment Definitions and Boundaries
- 1.2 By Application
- 1.2.1 Moisturizers
- 1.2.2 Facial Creams
- 1.2.3 Serums
- 1.2.4 Sunscreens
- 1.2.5 Cleansers
- 1.3 By Formulation Type
- 1.3.1 Cream-Based
- 1.3.2 Water-Based
- 1.3.3 Gel-Based
- 1.3.4 Oil-Based
- 1.4 By End Use
- 1.4.1 Personal Care
- 1.4.2 Cosmetic Products
- 1.4.3 Professional Skincare
Chapter 2 Introduction
- 2.1 Report Objectives and Scope
- 2.2 Product Definition and Industry Terminology
- 2.3 Market Inclusions and Exclusions
- 2.4 Research Process
- 2.4.1 Primary Research and Expert Interviews
- 2.4.2 Secondary Research and Source Review
- 2.4.3 Top-Down and Bottom-Up Estimation
- 2.4.4 Data Triangulation and Verification
- 2.5 Market Size Measurement Basis
- 2.5.1 2025: USD 178.6 million → 2035: USD 277.4 million
- 2.6 Historical and Forecast Reference Periods
- 2.6.1 Historical Period: 2018-2025
- 2.6.2 Base Year: 2025
- 2.6.3 Forecast Period: 2025-2035
- 2.7 Research Assumptions and Limitations
Chapter 3 Executive Summary
- 3.1 Market Snapshot and Key Findings
- 3.2 Base-Year Market Size, 2025
- 3.3 Forecast Market Size, 2035
- 3.4 Revenue and Volume Growth Outlook
- 3.5 Key Demand and Supply Indicators
- 3.6 Leading Market Segments
- 3.7 Fastest-Growing Market Opportunities
- 3.8 Regional Performance Highlights
- 3.9 Technology and Industry Transformation
- 3.10 Competitive Landscape Summary
- 3.11 Analyst View and Strategic Implications
Chapter 4 Global Allantoin Extract for Skincare Products Market Trends and Developments
- 4.1 Historical Industry Development, 2018-2025
- 4.2 Recent Market Trends and Developments
- 4.3 Demand and Customer Behavior Trends
- 4.4 Technology and Product Innovation
- 4.5 Artificial Intelligence, Automation and Digitalization
- 4.6 Local Manufacturing and Supply Chain Realignment
- 4.7 Industry Partnerships, Mergers and Acquisitions
- 4.8 Sustainability and Circular Economy Developments
- 4.9 Government and Private Sector Investment Trends
- 4.10 Emerging Business Models and Commercialization
- 4.11 Industry Developments and Announcements
Chapter 5 Global Allantoin Extract for Skincare Products Market Production, Supply and Demand Analysis
- 5.1 Demand Trend and Consumption Analysis, 2018-2025
- 5.2 Demand Forecast, 2025-2035
- 5.3 Production and Output Trend, 2018-2025
- 5.4 Production and Output Forecast, 2025-2035
- 5.5 Installed Capacity and Capacity Utilization
- 5.6 Company-Wise Production Plants and Statistics
- 5.6.1 Installed Production Capacity
- 5.6.2 Actual Production
- 5.6.3 Planned Capacity and Expansion Targets
- 5.7 Supply Chain Structure and Procurement Trends
- 5.8 Supply-Demand Gap and Bottlenecks
- 5.9 Import Dependence and Sourcing Structure
- 5.10 Contract Manufacturing and Outsourcing
- 5.11 Regional Supply and Demand Concentration
Chapter 6 Global Allantoin Extract for Skincare Products Market Pricing Analysis
- 6.1 Pricing Structure and Measurement
- 6.2 Historical Pricing Trends, 2018-2025
- 6.3 Pricing Outlook, 2025-2035
- 6.4 Average Selling Price and Unit Economics
- 6.5 Pricing by Product and Market Segment
- 6.6 Geographic Pricing Differences
- 6.7 Key Input, Energy, Labor and Logistics Costs
- 6.8 Contract Pricing and Purchasing Models
- 6.9 Pricing Sensitivity and Competitive Positioning
- 6.10 Price, Margin and Profitability Implications
Chapter 7 Global Allantoin Extract for Skincare Products Market Dynamics
- 7.1 Market Growth Drivers
- 7.1.1 Demand-Side Drivers
- 7.1.2 Technology and Innovation Drivers
- 7.1.3 Infrastructure and Investment Drivers
- 7.1.4 Regulatory and Policy Drivers
- 7.2 Market Restraints
- 7.2.1 Cost and Affordability Constraints
- 7.2.2 Technology and Adoption Barriers
- 7.2.3 Supply Chain and Operational Constraints
- 7.3 Market Challenges
- 7.3.1 Competitive Pressure and Margin Erosion
- 7.3.2 Skills, Infrastructure and Implementation Gaps
- 7.4 Emerging Market Opportunities
- 7.5 Market Dynamics Impact and Time-Horizon Assessment
Chapter 8 Global Allantoin Extract for Skincare Products Value Chain Analysis
- 8.1 Industry Value Chain Overview
- 8.2 Upstream Suppliers and Critical Inputs
- 8.3 Technology and Component Providers
- 8.4 Manufacturing or Service Delivery
- 8.5 Distribution, Channel Partners and Integrators
- 8.6 Downstream Applications and End Users
- 8.7 Value Addition and Profit Pools
- 8.8 Vertical Integration and Outsourcing
- 8.9 Supplier Concentration and Risk
- 8.10 Supply Chain Localization and Resilience
Chapter 9 Global Allantoin Extract for Skincare Products Market Regulations and Policies
- 9.1 Relevant Laws, Standards and Compliance Frameworks
- 9.2 Product, Service, Safety and Quality Requirements
- 9.3 Government Policies, Incentives and Subsidies
- 9.4 Imports, Exports and Trade Barriers
- 9.5 Public Procurement and Local Content Requirements
- 9.6 Environmental and Sustainability Compliance
- 9.7 Upcoming Policy Changes and Market Implications
Chapter 10 Global Allantoin Extract for Skincare Products Market Hotspots and Opportunities
- 10.1 Market Opportunity Mapping and Growth Hotspots
- 10.2 High-Growth Applications and Customer Groups
- 10.3 Underserved Markets and White-Space Opportunities
- 10.4 Emerging Technology and Product Opportunities
- 10.5 New Capacity and Investment Hotspots
- 10.6 Market Entry and Expansion Opportunities
- 10.7 Distribution and Partnership Opportunities
- 10.8 Near-Term and Long-Term Commercial Potential
- 10.9 Opportunity Attractiveness and Execution Risks
Chapter 11 Global Allantoin Extract for Skincare Products Market Outlook, 2025-2035
- 11.1 Market Size and Analysis
- 11.1.1 Revenue (Market Measurement: 2025: USD 178.6 million → 2035: USD 277.4 million)
- 11.1.2 Market Volume and Quantity Sold
- 11.1.3 Historical Market Size, 2018-2025
- 11.1.4 Base-Year Market Size, 2025
- 11.2 Market Forecast, 2025-2035
- 11.2.1 Revenue Forecast to 2035
- 11.2.2 Volume Forecast to 2035
- 11.2.3 CAGR and Year-on-Year Growth
- 11.2.4 Incremental Revenue Opportunity
- 11.3 Forecast Assumptions and Scenario Analysis
- 11.3.1 Base-Case Forecast
- 11.3.2 Optimistic and Conservative Scenarios
- 11.3.3 Technology, Pricing and Policy Sensitivities
- 11.4 Market Attractiveness and Growth Outlook
Chapter 12 Global Allantoin Extract for Skincare Products Market Segmentation and Outlook
- 12.1 Segmentation Summary and Market Shares, 2025
- 12.2 Largest and Fastest-Growing Segments
- 12.3 By Application - Market Size and Forecast, 2025-2035
- 12.3.1 Segment Definition and Scope
- 12.3.2 Historical Market Size, 2018-2025
- 12.3.3 Revenue Forecast, 2025-2035
- 12.3.4 Volume Forecast, 2025-2035
- 12.3.5 Base-Year Market Share, 2025
- 12.3.6 Segment CAGR and Growth Drivers
- 12.3.7 Subsegment Market Size and Forecast
- 12.3.7.1 Moisturizers
- 12.3.7.2 Facial Creams
- 12.3.7.3 Serums
- 12.3.7.4 Sunscreens
- 12.3.7.5 Cleansers
- 12.3.8 Subsegment Pricing and Adoption Trends
- 12.3.9 Leading Suppliers and Competition
- 12.3.10 Regional Demand and Opportunities
- 12.4 By Formulation Type - Market Size and Forecast, 2025-2035
- 12.4.1 Segment Definition and Scope
- 12.4.2 Historical Market Size, 2018-2025
- 12.4.3 Revenue Forecast, 2025-2035
- 12.4.4 Volume Forecast, 2025-2035
- 12.4.5 Base-Year Market Share, 2025
- 12.4.6 Segment CAGR and Growth Drivers
- 12.4.7 Subsegment Market Size and Forecast
- 12.4.7.1 Cream-Based
- 12.4.7.2 Water-Based
- 12.4.7.3 Gel-Based
- 12.4.7.4 Oil-Based
- 12.4.8 Subsegment Pricing and Adoption Trends
- 12.4.9 Leading Suppliers and Competition
- 12.4.10 Regional Demand and Opportunities
- 12.5 By End Use - Market Size and Forecast, 2025-2035
- 12.5.1 Segment Definition and Scope
- 12.5.2 Historical Market Size, 2018-2025
- 12.5.3 Revenue Forecast, 2025-2035
- 12.5.4 Volume Forecast, 2025-2035
- 12.5.5 Base-Year Market Share, 2025
- 12.5.6 Segment CAGR and Growth Drivers
- 12.5.7 Subsegment Market Size and Forecast
- 12.5.7.1 Personal Care
- 12.5.7.2 Cosmetic Products
- 12.5.7.3 Professional Skincare
- 12.5.8 Subsegment Pricing and Adoption Trends
- 12.5.9 Leading Suppliers and Competition
- 12.5.10 Regional Demand and Opportunities
- 12.6 Segment Growth Comparison
- 12.7 Segment Attractiveness and Priority Matrix
Chapter 13 Global Allantoin Extract for Skincare Products End-Use and Application Market Outlook
- 13.1 End-Use Industry and Customer Demand Structure
- 13.2 Leading Applications and Customer Groups
- 13.3 End-Use Market Size, Share and Forecast
- 13.4 Major End-Use Industry Deep Dives
- 13.4.1 Customer Requirements and Use Cases
- 13.4.2 Demand and Replacement Cycles
- 13.4.3 Technical and Regulatory Considerations
- 13.4.4 Purchasing and Procurement Models
- 13.4.5 Leading Vendors and Distribution Channels
- 13.4.6 Forecast and Commercial Opportunities
- 13.5 Emerging Applications and Cross-Segment Demand
- 13.6 End-Use Industry Investment Priorities
Chapter 14 Global Allantoin Extract for Skincare Products Geographic Market Outlook, 2025-2035
- 14.1 Regional Market Size and Share, 2025
- 14.2 Regional Market Forecast, 2025-2035
- 14.3 Regional Pricing, Production and Demand Differences
- 14.4 North America
- 14.4.1 United States
- 14.4.2 Canada
- 14.4.3 Mexico
- 14.5 Europe
- 14.5.1 Germany
- 14.5.2 France
- 14.5.3 Italy
- 14.5.4 United Kingdom
- 14.5.5 Spain
- 14.5.6 Poland
- 14.5.7 Russia
- 14.5.8 Netherlands
- 14.5.9 Belgium
- 14.5.10 Sweden
- 14.5.11 Denmark
- 14.5.12 Norway
- 14.5.13 Rest of Europe
- 14.6 Asia Pacific
- 14.6.1 China
- 14.6.2 India
- 14.6.3 Japan
- 14.6.4 South Korea
- 14.6.5 Thailand
- 14.6.6 Indonesia
- 14.6.7 Vietnam
- 14.6.8 Malaysia
- 14.6.9 Australia
- 14.6.10 Rest of Asia Pacific
- 14.7 Latin America
- 14.7.1 Brazil
- 14.7.2 Argentina
- 14.7.3 Colombia
- 14.7.4 Chile
- 14.7.5 Rest of Latin America
- 14.8 Middle East
- 14.8.1 Saudi Arabia
- 14.8.2 United Arab Emirates
- 14.8.3 Turkey
- 14.8.4 Israel
- 14.8.5 Iran
- 14.8.6 Rest of the Middle East
- 14.9 Africa
- 14.9.1 South Africa
- 14.9.2 Egypt
- 14.9.3 Nigeria
- 14.9.4 Morocco
- 14.9.5 Rest of Africa
- 14.10 Regional Investment, Policy and Supply Chain Differences
- 14.11 Regional Competitive Landscape
- 14.12 Geographic Growth Hotspots
Chapter 15 Global Allantoin Extract for Skincare Products Technology, Innovation and Sustainability Outlook
- 15.1 Technology Landscape and Maturity
- 15.2 Product, Process and Service Innovation
- 15.3 AI, Automation and Digital Tools in the Industry
- 15.4 Technology Adoption and Performance Benchmarking
- 15.5 Innovation Pipeline and R&D Investment
- 15.6 Patent and Intellectual Property Trends
- 15.7 Energy Efficiency and Resource Management
- 15.8 Sustainability, Recycling and Circularity
- 15.9 Technology Roadmap, 2025-2035
- 15.10 Risks of Obsolescence and Technology Substitution
Chapter 16 Global Allantoin Extract for Skincare Products Market Key Strategic Imperatives
- 16.1 Growth and Market Entry Priorities
- 16.2 High-Return Products and Segments
- 16.3 Pricing, Profitability and Cost Optimization
- 16.4 Technology Investment and Product Differentiation
- 16.5 Supply Chain Localization and Resilience
- 16.6 Distribution and Customer Acquisition
- 16.7 Partnership, Acquisition and Capacity Strategy
- 16.8 Regional Expansion Priorities
- 16.9 Short-, Medium- and Long-Term Actions
Chapter 17 Competition Outlook
- 17.1 Industry Competition Characteristics
- 17.2 Market Structure and Concentration
- 17.3 Market Share and Competitive Positioning, 2025
- 17.4 Company-Wise Revenue and Product Benchmarking
- 17.5 Production and Service Capacity Benchmarking
- 17.6 Technology, Pricing and Differentiation
- 17.7 Regional Footprint and Distribution Strength
- 17.8 Mergers, Acquisitions and Strategic Alliances
- 17.9 New Entrants and Competitive Threats
- 17.10 Porter's Five Forces and Industry Attractiveness
- 17.11 Competitive Outlook, 2025-2035
Chapter 18 Company Profiles
- 18.1 Company Coverage and Selection Criteria
- 18.2 dsm-firmenich
- 18.2.1 Business Description
- 18.2.2 Company Ownership and Geographic Presence
- 18.2.3 Product and Service Portfolio
- 18.2.4 Manufacturing and Operating Footprint
- 18.2.5 Production Capacity and Expansion Plans
- 18.2.6 Financial Performance and Investment
- 18.2.7 Market Share and Competitive Position
- 18.2.8 Technology and Innovation Capabilities
- 18.2.9 Strategic Alliances or Partnerships
- 18.2.10 Recent Developments
- 18.2.11 Growth Strategy and Outlook
- 18.3 Ashland Inc.
- 18.4 WeylChem (International Chemical Investors Group)
- 18.5 Akema S.r.l.
- 18.6 Susonity (Global New Material International)
- 18.7 Wuhu Huahai Biology Engineering Co., Ltd.
- 18.8 Shandong Ailitong New Materials Co., Ltd.
- 18.9 Other Relevant Market Participants
Note: Every listed company is profiled on the structure shown under the first company. The company list is preliminary and may change based on research findings, market developments, data availability and client requirements.
Chapter 19 Disclaimer
- 19.1 Research and Forecast Disclaimer
- 19.2 Data Source and Estimation Limitations
Note: The depth of individual sections depends on data availability for this market. Volume, capacity, trade and other unit-based metrics are included where applicable.