Old floors and solvent rules decide which formulas sell
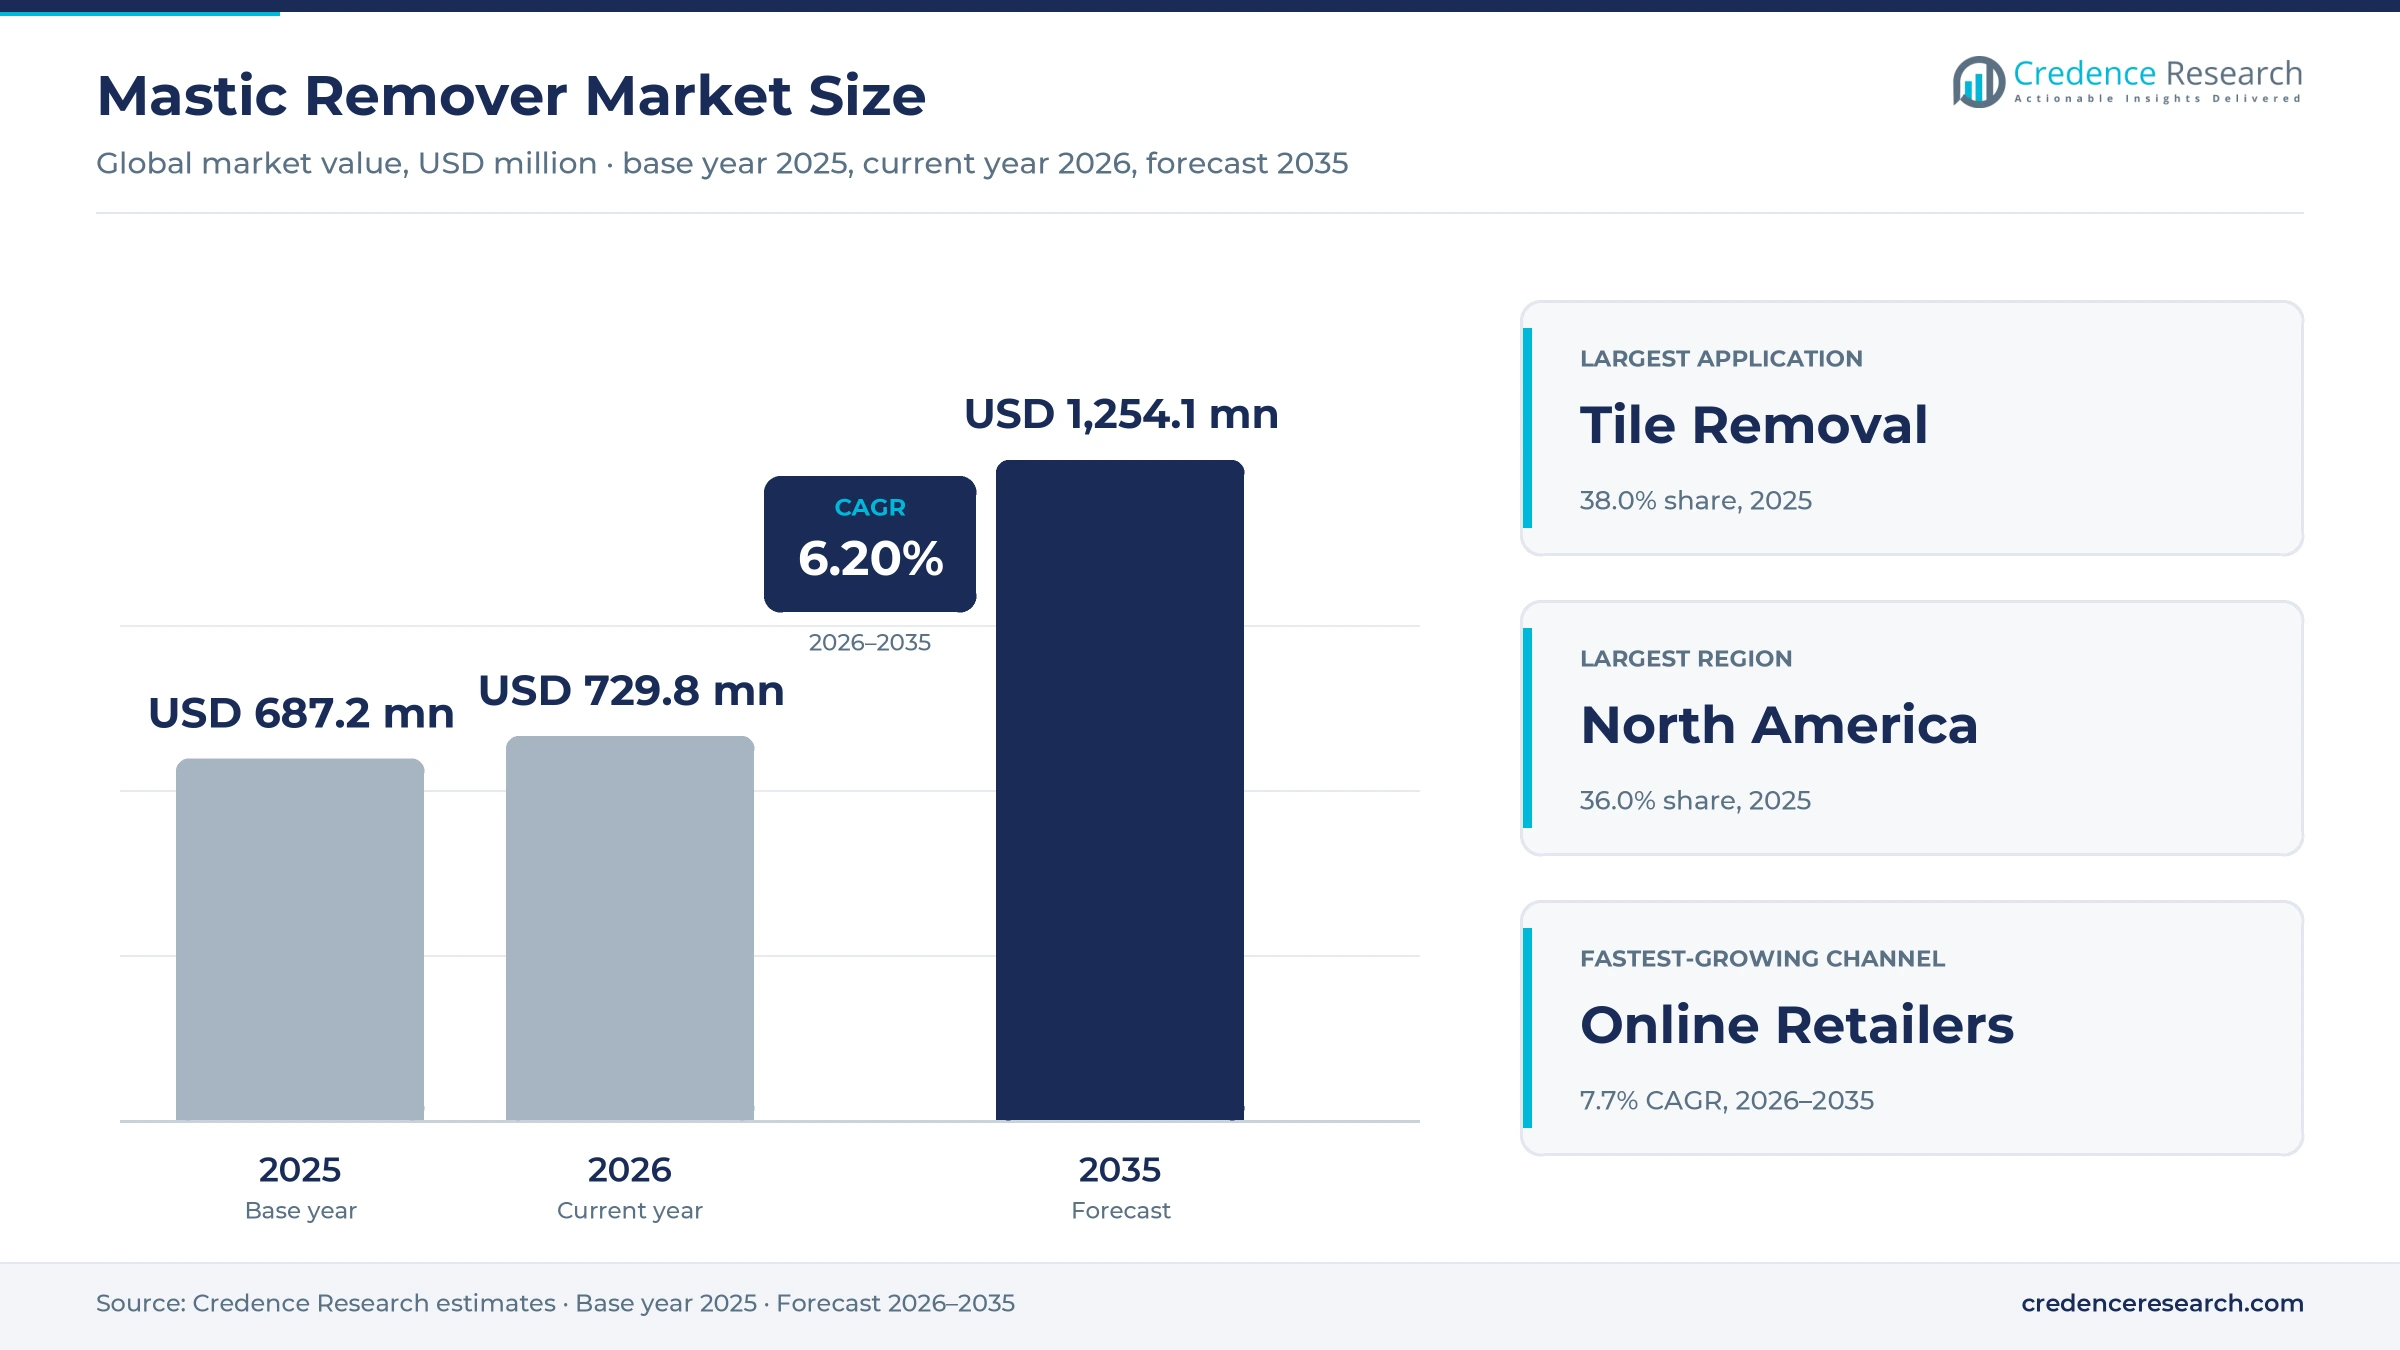
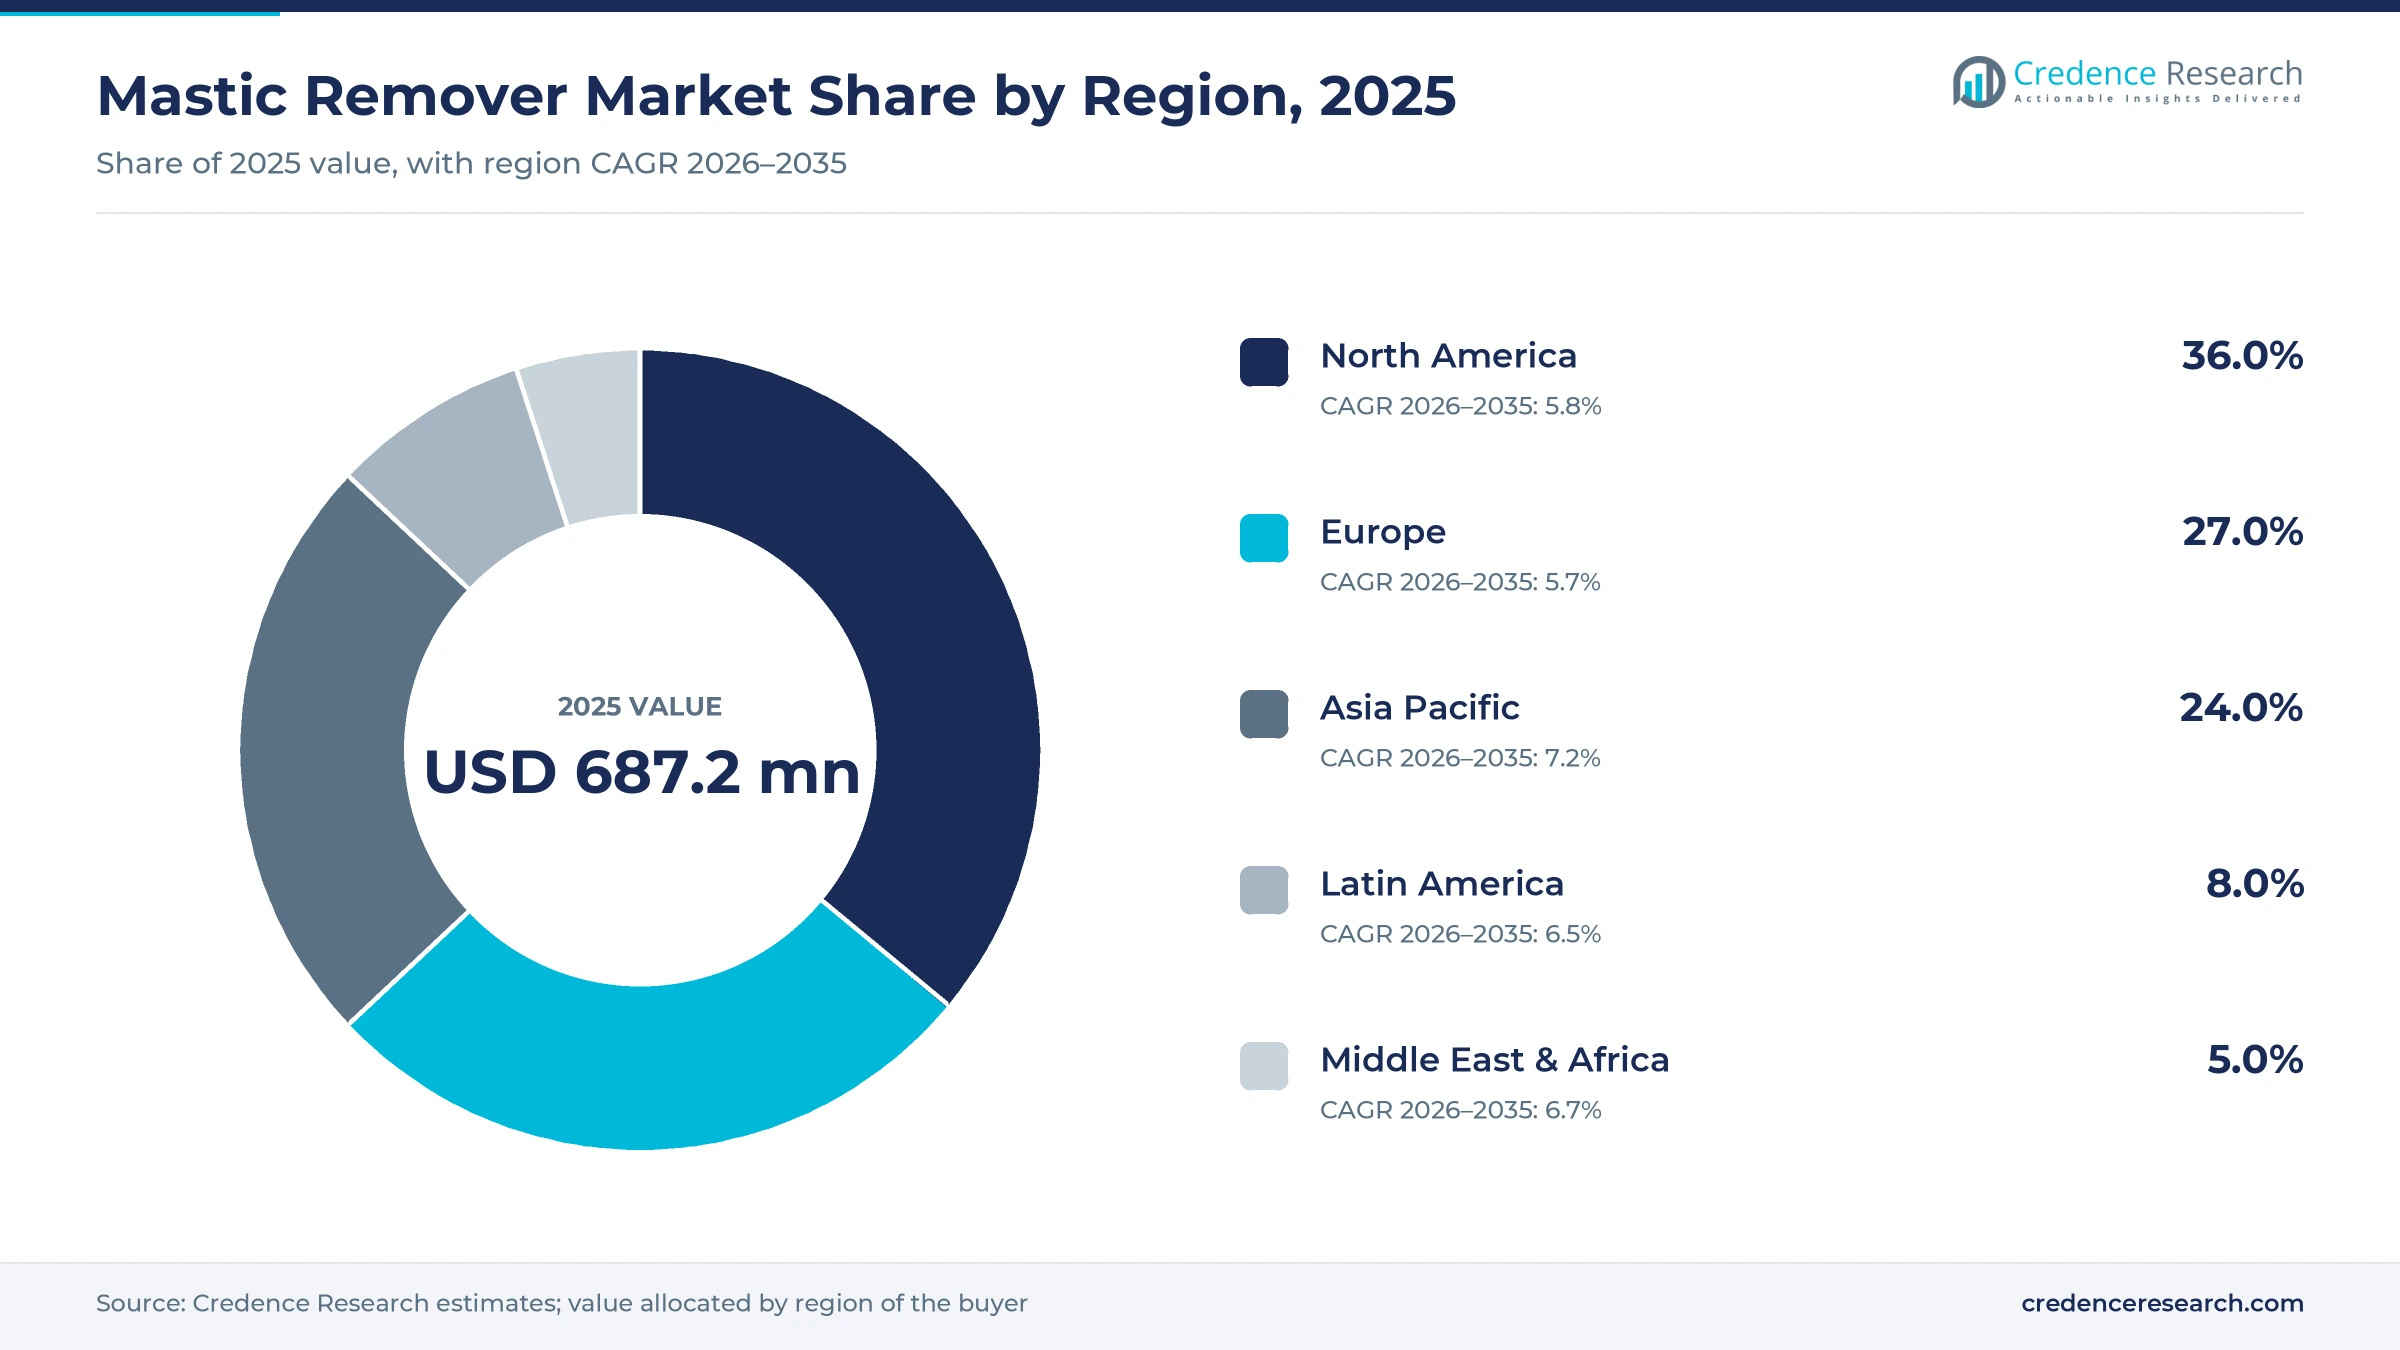
The global mastic remover market was valued at USD 687.2 million in 2025 and is projected to increase from USD 729.8 million in 2026 to USD 1.25 billion by 2035, registering a CAGR of 6.20% during 2026–2035. Demand comes from flooring contractors, asbestos abatement firms, facility managers and homeowners who strip old vinyl tile, carpet, sheet goods and ceramic tile before laying new floors over concrete or wood. North America held the largest regional share, 36.0% in 2025, because its aging housing stock and federal rules on asbestos flooring keep chemical removal common on tear-out jobs. Asia Pacific is the fastest-growing region at 7.2% a year as Chinese cities renovate older residential compounds. The main commercial change is regulatory, since U.S. limits on methylene chloride and California caps on volatile organic compounds push formulators toward soy, benzyl alcohol and water-based chemistries. Buyers now compare coverage per gallon, odor and drying time as closely as shelf price.
Floor tear-outs over concrete create most of the demand
The estimate counts liquid and gel chemical removers sold to dissolve or soften black cutback, tile mastic, carpet glue, sheet vinyl adhesive and similar floor adhesives so that they can be scraped from concrete, wood or tile substrates. Solvent-based, water-based and bio-based formulas are included, sold in quarts to drums through retail and trade channels.
General-purpose household goo removers, paint and coating strippers, and mechanical removal equipment such as grinders and floor scrapers sit outside the estimate. Most volume moves from formulators to flooring and abatement distributors in five-gallon pails, while home centers sell gallon jugs to homeowners and small installers.
Mastic Remover Market Insights
- The market is valued at USD 687.2 million in 2025 and is projected to reach USD 1.25 billion by 2035, growing at a 6.20% CAGR on floor replacement, abatement work and low-VOC reformulation.
- North America led with 36.0% of 2025 value, because the median U.S. owner-occupied home was 41 years old in 2023, so many tear-outs uncover old adhesives.
- Tile Removal held 38.0% of 2025 value, because federal rules forbid sanding old resilient tile and require wet scraping of residual adhesive.
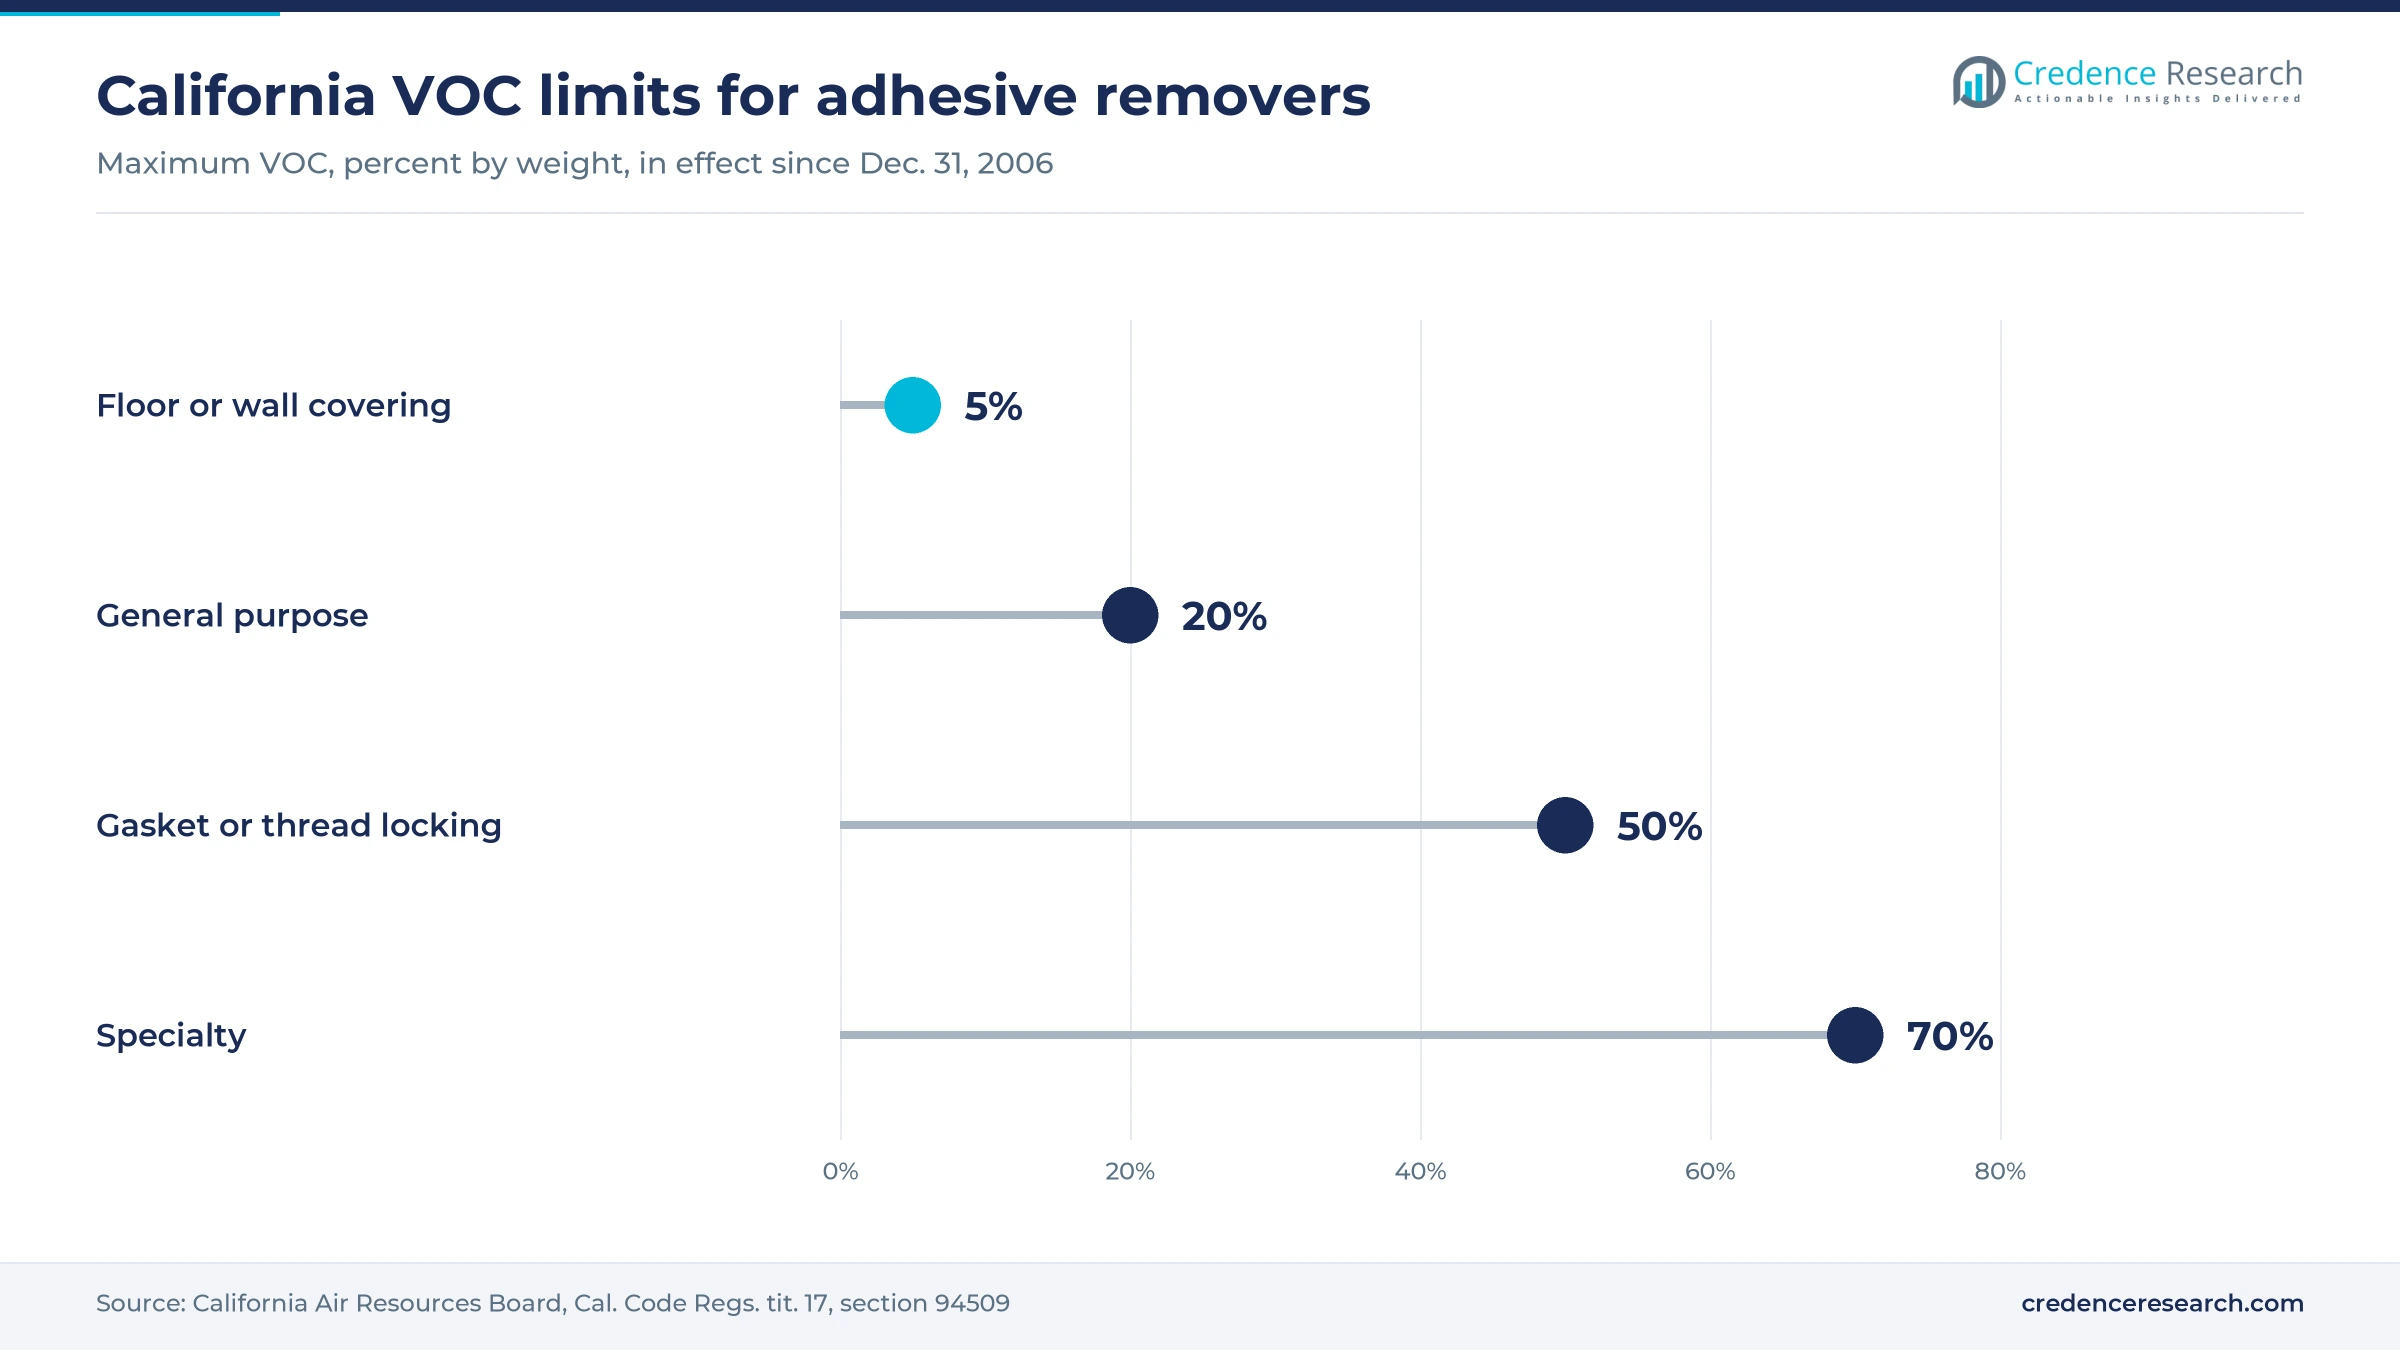
- The EPA finalized its methylene chloride rule on April 30, 2024, phasing out consumer uses within one year and most commercial uses within two years, which pushes removers toward safer solvents.
- Online Retailers grow fastest at 7.7% a year, as U.S. e-commerce reached 17.9% of retail sales in the third quarter of 2026.
Tile tear-outs lead while bio-based formulas gain ground
Why do solvent formulas lead while bio-based removers grow fastest?
Based on product type, the market is categorized into solvent-based, water-based, bio-based and other formulas. Solvent-based removers led with 43.0% of 2025 value because abatement crews still favor fast dissolving power on black cutback, and Tools4Flooring lists coverage of 100 to 200 square feet per gallon for Sentinel's 747 Plus. Bio-based removers grow fastest at 7.4% a year as federal buyers favor certified products, as USDA designates adhesive and mastic removers for federal biobased procurement preference and Franmar states VOC below 3% for its soy Blue Bear remover.
Why does tile removal lead while vinyl flooring removal grows fastest?
Based on application, the market is categorized into tile removal, carpet removal, vinyl flooring removal and other adhesive removal. Tile Removal held 38.0% of 2025 value because old vinyl composition and asphalt tiles were often laid in black mastic, and OSHA forbids sanding such flooring while requiring wet methods for scraping residual adhesive. Vinyl Flooring Removal grows fastest at 7.0% a year as glue-down luxury vinyl reaches replacement age, with FCNews counting 721 million square feet of commercial glue-down flex LVT sold in 2025.
Why do specialty stores lead while online retailers grow fastest?
Based on distribution channel, the market is categorized into hardware stores, home improvement centers, online retailers and specialty stores. Specialty Stores led with 35.0% of 2025 value because abatement and flooring contractors buy five-gallon pails from trade distributors, and Aramsco acquired the assets of Jon-Don in May 2025 after that distributor closed. Online Retailers grow fastest at 7.7% a year, and the Census Bureau announced that U.S. e-commerce rose 10.4% year on year in the third quarter of 2026.
| Segment Group | Leading Sub-segment | Share, 2025 | Fastest-growing Sub-segment | CAGR, 2026–2035 |
|---|---|---|---|---|
| By Product Type | Solvent-based | 43.0% | Bio-based | 7.4% |
| By Application | Tile Removal | 38.0% | Vinyl Flooring Removal | 7.0% |
| By Distribution Channel | Specialty Stores | 35.0% | Online Retailers | 7.7% |
Coverage per gallon sets the real price of removal
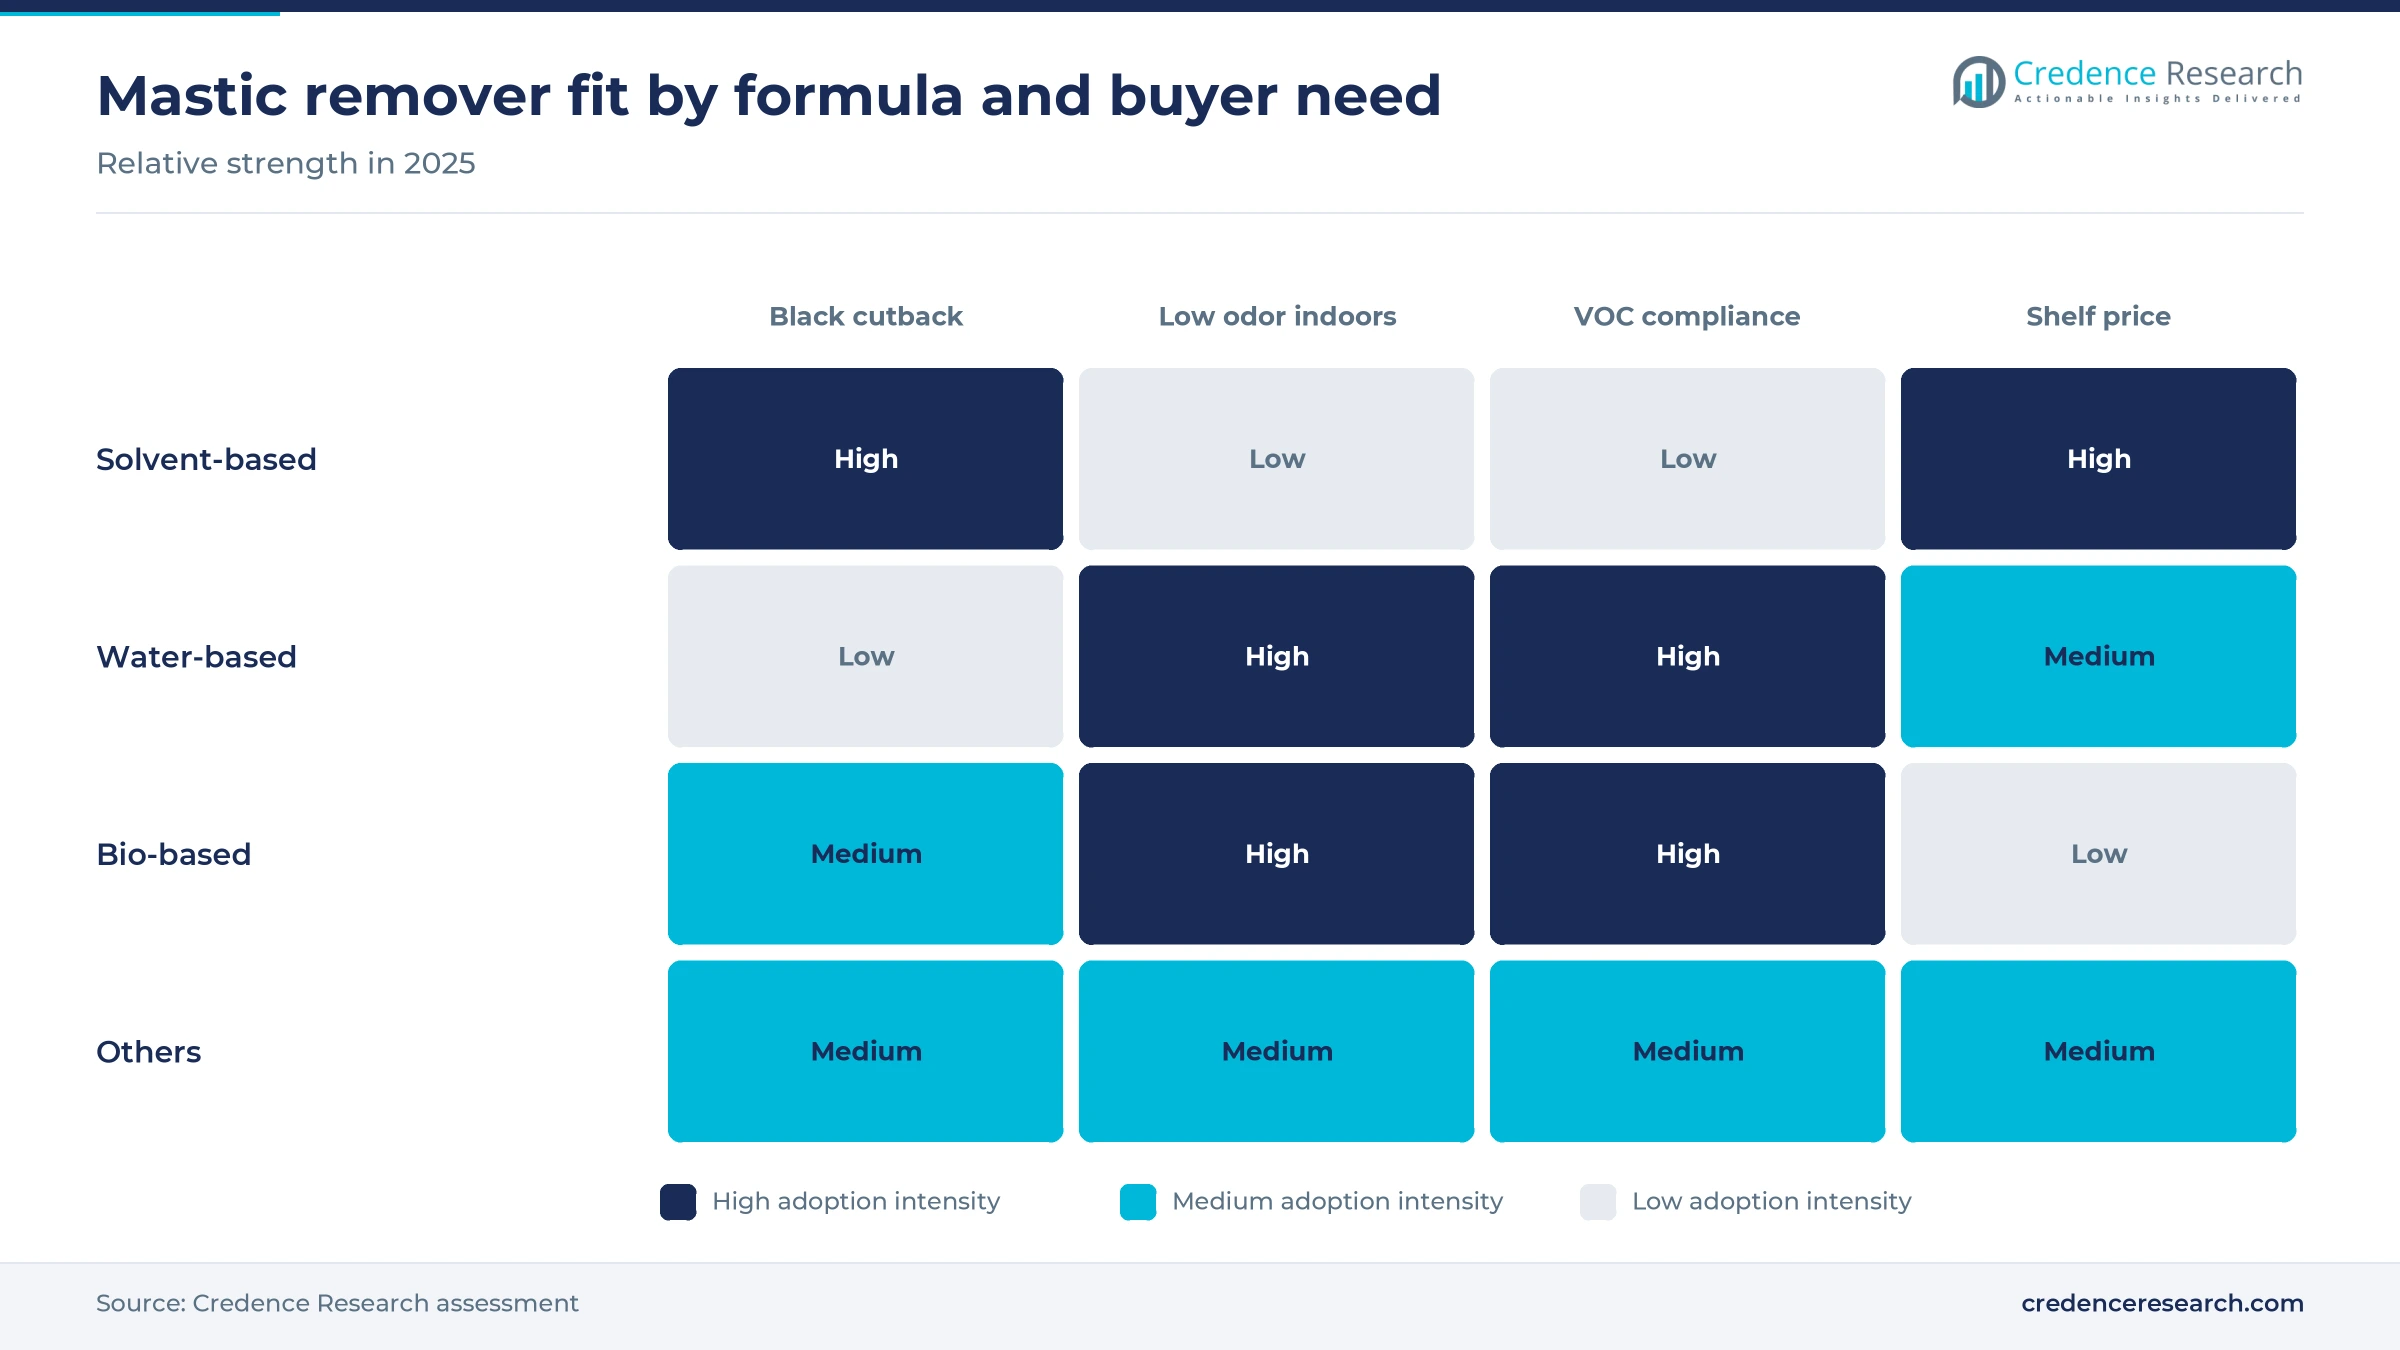
Shelf prices for mastic removers span roughly USD 33 to USD 58 a gallon, but contractors judge them on cost per square foot cleared, since coverage varies several times over between formulas. Soy formulas carry the highest gallon prices, yet their stated coverage matches that of solvent products. A five-gallon pail of Blue Bear cuts the unit price by about 15%, which favors trade distributors and large crews. Odor, drying time and VOC compliance in California and other regulated states now move price as much as dissolving strength does.
| Product or pack | Typical price or fee | Basis |
|---|---|---|
| Sentinel 747 Plus, 1 gallon, solvent formula | USD 32.87 per gallon, 100 to 200 sq ft | Tools4Flooring list price, November 2026 |
| Sentinel 747C low odor, 5-gallon pail | USD 162.66 per pail | Jendco Safety list price, November 2026 |
| Blue Bear 500MR soy formula, 1 gallon | USD 57.77 per gallon, 100 to 200 sq ft | Walmart.com listing, November 2026 |
| Blue Bear 500MR soy formula, 5 gallons | USD 244.01 per pail | Walmart.com listing, November 2026 |
| Henry EasyRelease water-based, 1 gallon | CAD 44.98, up to 100 sq ft | Home Depot Canada listing, November 2026 |
| Cost per square foot cleared | About USD 0.16 to 0.58 | Credence Research estimate from list prices and stated coverage |
Request a Free Sample
Fill in your details and we'll send you a free sample report.
- Sample data tables & charts
- Research methodology
Aging floors and wet-method rules sustain chemical removal
Aging housing stock keeps old adhesives under new floors
Replacement of old floors is the base of demand, because every tear-out over concrete leaves adhesive that must come off before a new floor can bond. The median U.S. owner-occupied home was 41 years old in 2023, up from 31 years in 2005, and almost half were built before 1980, according to the National Association of Home Builders. Homes of that age can hide vinyl tile laid in black cutback or carpet glued to slabs. In Europe, the European Commission says 85% of buildings were built before 2000, which extends the same pattern across the EU. Formulators that sell removers rated for cutback and multilayer adhesives win repeat orders from remodelers working through this older stock.
Wet-method asbestos rules favor chemical removal
Asbestos rules sustain chemical removal, because they restrict the dry mechanical methods that would otherwise replace a remover. A May 2005 OSHA interpretation states that asbestos flooring or its backing shall not be sanded and that scraping of residual adhesive must use wet methods, while a settlement agreement lets employers instead run a low-speed floor machine at no more than 175 revolutions per minute with wetted sand or a removal solution. In the United Kingdom, where about 5,000 people a year die from past exposure, the Health and Safety Executive lets trained non-licensed workers remove asbestos floor tiles and mastic by hand but requires a licensed contractor for grinding. Abatement contractors therefore buy removers by the pail, which supports the specialty channel.
Stricter EU asbestos limits raise the bar on removal methods
European renovation is set to bring more asbestos flooring into regulated removal. Directive (EU) 2023/2668 cut the occupational exposure limit to 0.01 fibers per cubic centimeter, with member states due to transpose it by Dec. 21, 2025, and it moves fiber counting to electron microscopy by Dec. 21, 2029. The recast Energy Performance of Buildings Directive, in force since May 28, 2024, requires renovation of the 16% worst-performing nonresidential buildings by 2030. Lower limits make dust-free scraping more valuable, because aggressive grinding raises fiber counts. Suppliers with low-odor removers suited to enclosed spaces can gain share with contractors who face tighter air monitoring.
Federal biobased procurement supports soy formulas
Public buyers support bio-based removers, because federal agencies must give preference to designated biobased products. Franmar markets Blue Bear 500MR as made with 100% American-grown soybeans and below 3% VOC, a profile that fits school, hospital and military renovation specifications. Klean-Strip Green floor adhesive remover is marketed as free of methylene chloride, caustic and petroleum distillates, which shows how mainstream brands now match that profile. Bio-based removers grow at 7.4% a year, the fastest rate among formulas, as specifiers write low-VOC requirements into school and hospital renovation contracts. Formulators that hold certified biobased content gain access to public tenders that many solvent products cannot meet.
Solvent limits and glue-down vinyl reshape remover sales
Methylene chloride limits shift formulators toward safer solvents
Formulators are shifting away from chlorinated solvents to meet federal rules, creating openings for benzyl alcohol, ester and soy blends across professional floor work. The EPA finalized its methylene chloride rule on April 30, 2024, phasing out consumer uses within one year and most commercial uses within two years. The EPA also finalized a trichloroethylene ban in December 2024, though it has since postponed some conditions until court review ends. Sunnyside lists benzyl alcohol at 25% to 45% in its Mastic Remover Advanced formula, while a Back to Nature mastic remover listed at 887 g/L of VOC has been discontinued. Formulators that reformulated early face less risk of stranded inventory.
Glue-down vinyl floors create the next removal cycle
Flooring buyers are shifting toward resilient products, which creates a future removal cycle for glue-down vinyl adhesives. Resilient flooring took 36.5% of U.S. floor covering dollars in 2025, FCNews reported, and glue-down products made up 775 million of the 850 million square feet of residential flex LVT sold. Pressure sensitive adhesives under those floors respond to different chemistry than black cutback. Commercial vinyl composition tile still sold 283 million square feet that year, and much of it will be stripped over the next decade. Suppliers that develop removers for modern acrylic and pressure sensitive adhesives under luxury vinyl tile floors can capture this cycle.
Low-VOC caps open room for water-based removers
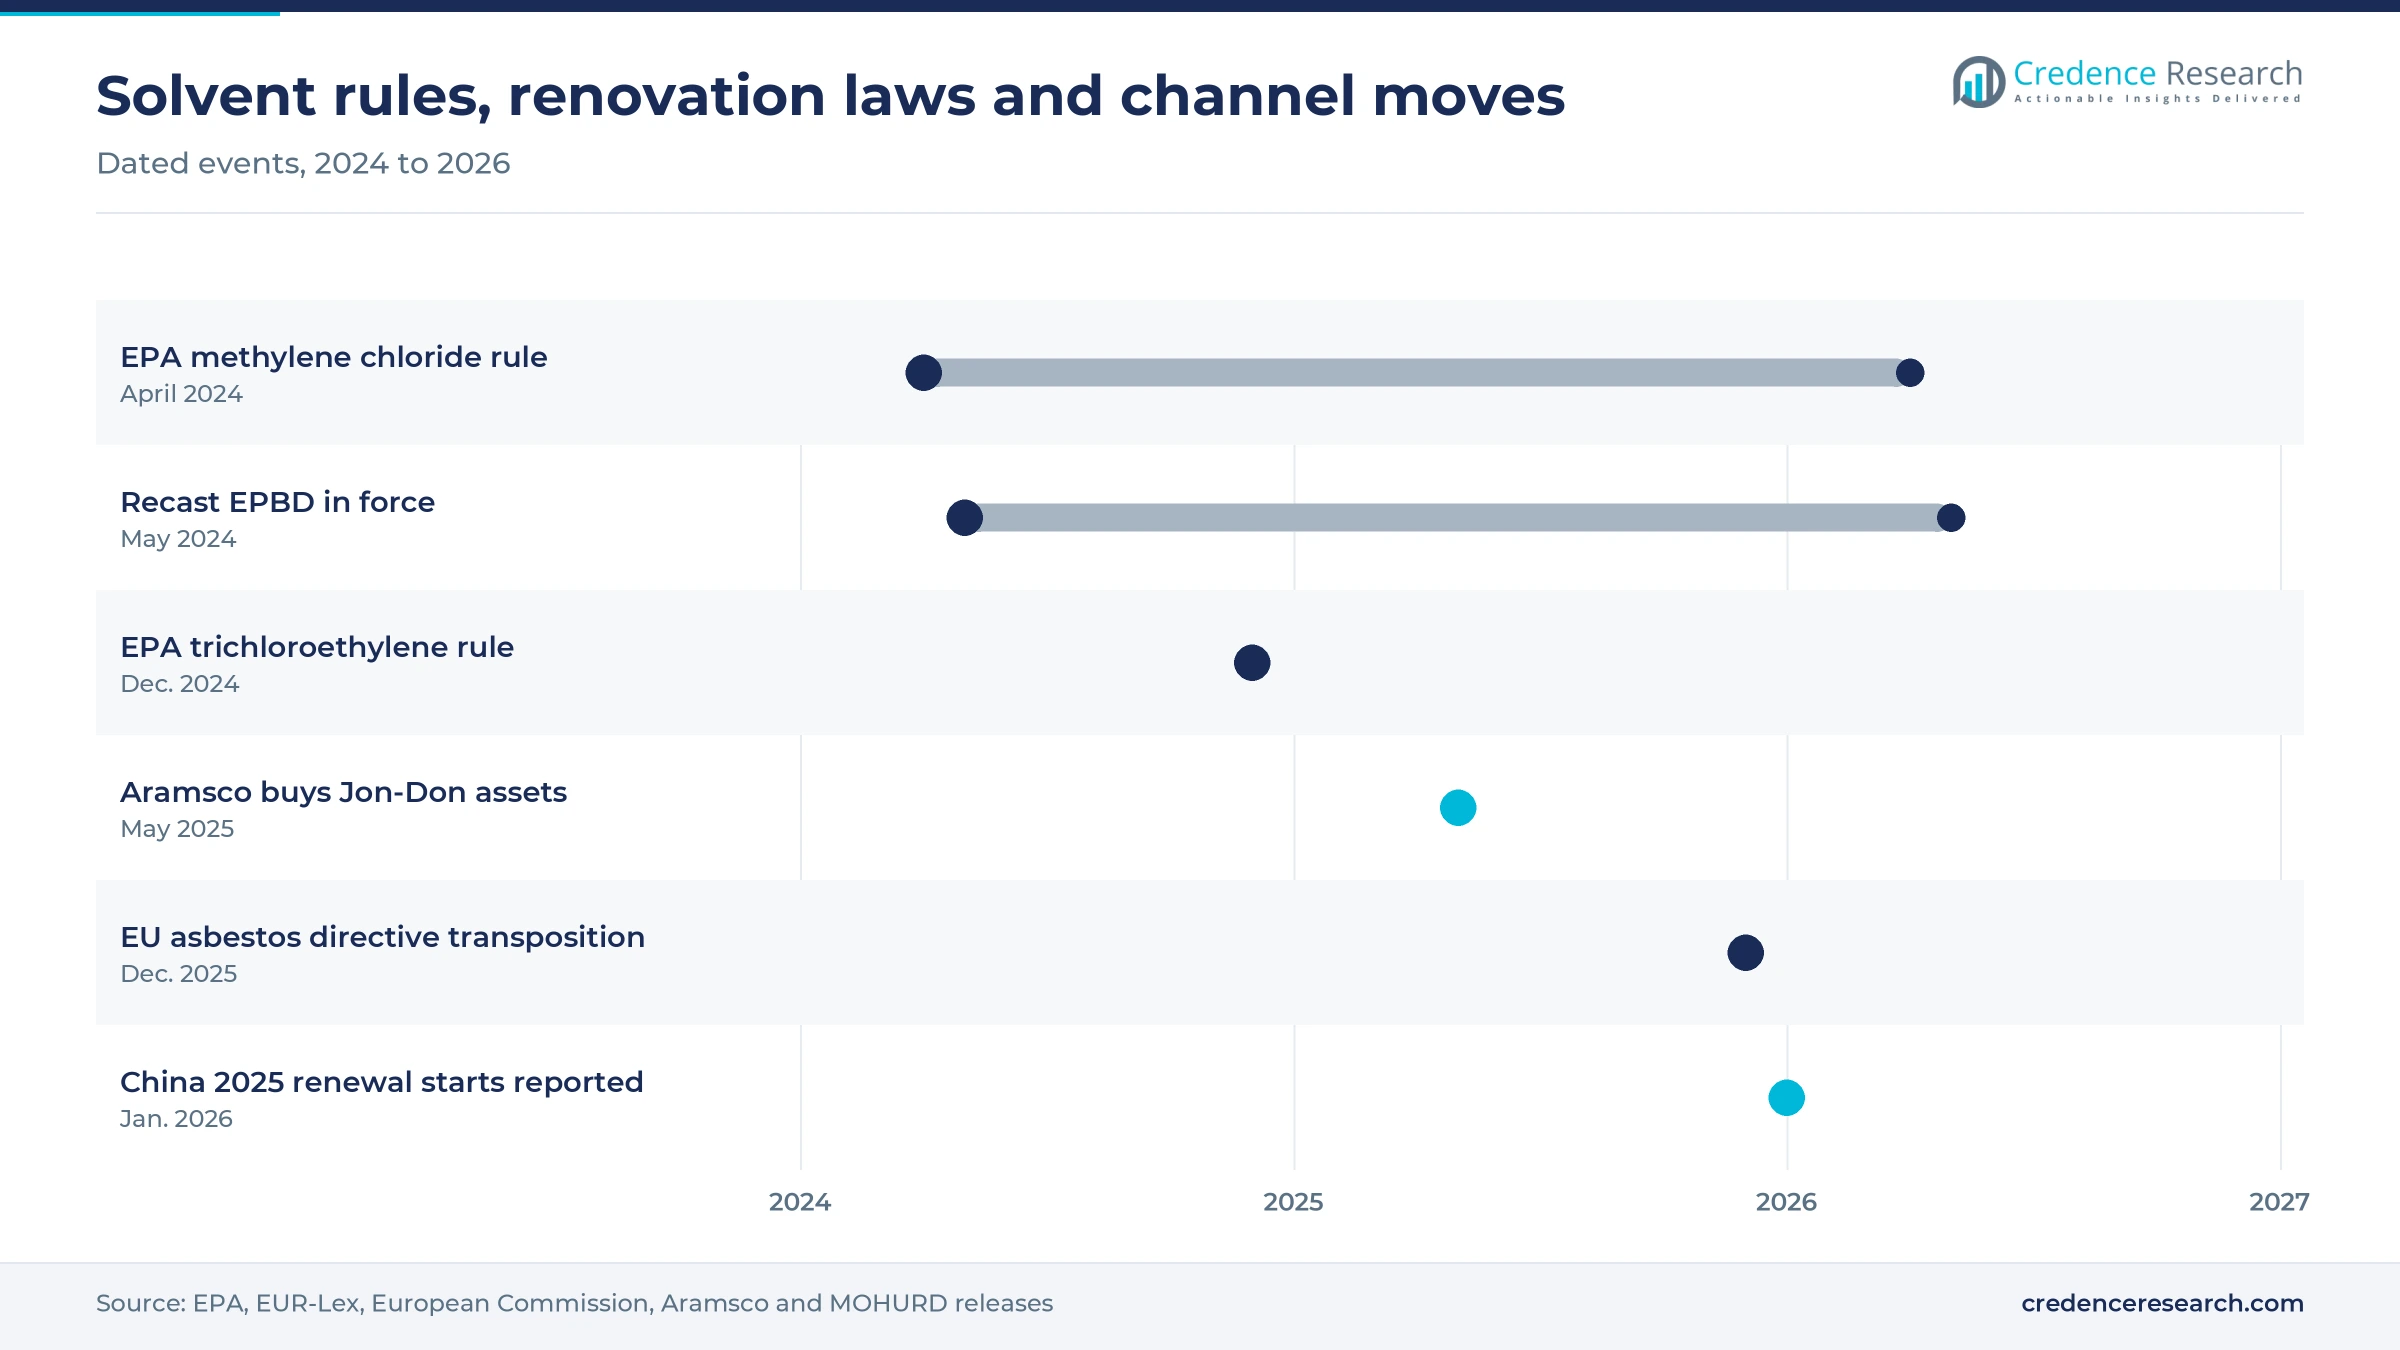
State VOC caps create an opening for water-based removers that can be sold in every U.S. state without a separate formula. California rules limit floor and wall covering adhesive removers to 5% VOC by weight, against 20% for general purpose adhesive removers and 70% for specialty types, according to the California Air Resources Board. Henry EasyRelease, a water-based and solvent-free product from the ARDEX Group, can be poured through carpet to break the adhesive bond before removal. Bio-based formulas lead growth, but water-based products fit carpet jobs where odor matters most. Brands that offer one compliant formula nationwide simplify inventory for retailers and distributors alike.
Online sales open a direct route to small contractors
Small contractors and homeowners create an opening for direct online sales, because they buy in small lots and compare coverage claims before purchase. The Census Bureau reported that e-commerce reached 17.9% of U.S. retail sales in the third quarter of 2026. Walmart.com lists Blue Bear 500MR in quart, gallon and five-gallon sizes, and Green Building Supply sells the same product online at USD 57.86 a gallon, close to the shelf price. Search-led buying favors brands whose product pages state coverage, VOC content and approved adhesives in plain terms. Brands that publish clear coverage rates and safety data online can reach buyers without paying for shelf space in home centers.
Slower remodeling and costlier soy formulas weigh on demand
Slower remodeling growth limits replacement volume
A slowing remodeling cycle limits demand for removers, because fewer floor replacements mean fewer tear-outs. The Harvard Joint Center for Housing Studies projects annual U.S. remodeling spending of about USD 523 billion in early 2027, with growth slowing sharply. U.S. resilient flooring volume fell about 1.2% to 5.8 billion square feet in 2025, FCNews reported. Small contractors and retail brands are most exposed, while abatement suppliers depend more on regulated public projects.
Soy formulas cost more per gallon than solvents
Bio-based removers face a price barrier on shelves, because soy formulas list at about USD 58 a gallon against about USD 33 for a solvent product, as the pricing table shows. Homeowners and small installers who buy one gallon per job often choose the cheaper solvent product, even when coverage is similar. Soy formulators are most exposed in price-led home centers, so they rely on public tenders and green building specifications.
Carpet replacement keeps shrinking
Carpet removal demand is falling, because buyers keep moving to hard surfaces that rarely need carpet adhesive removal. Carpet keeps losing dollar share to hard surfaces, and resilient flooring led carpet by USD 1.8 billion in 2025 excluding area rugs, FCNews reported. Removers sold mainly for carpet glue face a shrinking base, while products that also handle tile mastic and vinyl adhesives are better protected. Suppliers that position one product across several adhesives lose less volume.
Unclear rules on aggressive methods slow abatement jobs
Abatement crews face uncertainty over which machine methods count as aggressive, which can slow jobs and raise costs. OSHA treats an abrasive buffer as aggressive even when its pad is soaked in solvent, according to its May 18, 2005 interpretation letter. Contractors that misjudge methods risk citations and costly changes of work practice midway. Smaller abatement firms without compliance staff are most exposed, while suppliers that publish approved procedures help buyers.
North America leads on old housing stock and strict rules
| Region | Value, 2025 (USD million) | Share, 2025 | CAGR, 2026–2035 |
|---|---|---|---|
| North America | 247.4 | 36.0% | 5.8% |
| Europe | 185.5 | 27.0% | 5.7% |
| Asia Pacific | 164.9 | 24.0% | 7.2% |
| Latin America | 55.0 | 8.0% | 6.5% |
| Middle East & Africa | 34.4 | 5.0% | 6.7% |
North America leads on old housing stock and strict rules
North America held 36.0% of 2025 value and grows at 5.8% a year, because the United States combines an old housing stock with federal asbestos and solvent rules. U.S. resilient flooring alone generated USD 8.59 billion on 5.8 billion square feet in 2025, so the installed base of glued floors is very large. Franmar, WM Barr and Sentinel sell their removers through U.S. home centers, online stores and abatement distributors. Sentinel sells its 747C as a VOC-compliant low-odor formula, which shows how professional lines adapt to state caps such as California's.
Europe grows on renovation duties and asbestos limits
Europe held 27.0% of 2025 value and grows at 5.7% a year, the slowest pace, because floor preparation there leans more on mechanical methods, a Credence Research assessment, and asbestos removal is tightly licensed. The United Kingdom banned asbestos in 1999, and the Health and Safety Executive links about 5,000 deaths a year to past exposure. HG International sells a floor glue remover for carpet, linoleum, vinyl, cork and floor tile glues through U.K. DIY retailers. Renovation deadlines under the recast buildings directive, due in national law by May 29, 2026, support volumes through 2033.
Asia Pacific grows fastest on urban renewal programs
Asia Pacific held 24.0% of 2025 value and grows fastest at 7.2% a year, because China and Australia are renovating large stocks of older buildings. China started renovation of 27,100 old urban neighborhoods in 2025, above its target of 25,000, the Ministry of Housing and Urban-Rural Development announced in January 2026. Australia banned asbestos in 2003, and the New South Wales government warns that many homes built or renovated before 1990 still contain it. No public data separate Asian remover sales from wider construction chemicals, so the share is a Credence Research estimate.
Latin America follows Brazil's asbestos ban
Latin America held 8.0% of 2025 value and grows at 6.5% a year, because demand centers on commercial refurbishment in Brazil and Mexico rather than on residential tear-outs, a Credence Research estimate. Brazil's Supreme Federal Court banned chrysotile asbestos on Nov. 29, 2017, by a 7 to 2 vote, which raises the profile of safe removal in older buildings. No regional mastic remover producer was identified, so local buyers rely on imported brands and general solvents, and this share carries a wide error range.
Middle East & Africa rests on commercial refurbishment
Middle East & Africa held 5.0% of 2025 value and grows at 6.7% a year, because demand there comes mainly from refurbishment of older commercial buildings rather than from homes. South Africa banned the use, manufacture, import and export of asbestos in March 2008, which shapes demand in older commercial buildings there. Public data on remover consumption in the region are thin, so the estimate rests on construction activity and the reach of imported brands.
Solvent rules and distributor deals marked 2024 to 2026
| Development | Status and market relevance |
|---|---|
| In April 2024, the EPA finalized its methylene chloride rule, phasing out consumer uses within one year and most commercial uses within two years. | Final rule, now in force; it pushes floor and coating remover makers toward non-chlorinated solvents and soy blends. |
| In May 2024, the recast Energy Performance of Buildings Directive entered into force with renovation targets for the worst-performing nonresidential buildings. | Law in force, national transposition due May 2026; it supports renovation volume in Europe through 2033. |
| In December 2024, the EPA finalized a rule banning trichloroethylene, and in May 2026 it postponed some conditions until court review ends. | Final rule under litigation; the solvent remains off the table for new remover formulas. |
| In May 2025, Aramsco acquired the assets of Jon-Don, a contractor supply distributor that closed after more than 40 years. | Completed asset purchase; it concentrates trade distribution of abatement and floor preparation products. |
| In December 2025, the deadline passed for EU member states to transpose Directive (EU) 2023/2668 on worker exposure to asbestos. | Transposition deadline passed; lower exposure limits apply to removal work across the EU. |
Chemistry choices trade speed against odor and VOC limits
- Soy methyl ester blends soften cutback and tile mastic with low odor and VOC, which suits occupied schools and hospitals.
- Benzyl alcohol and dibasic ester blends replace methylene chloride in faster professional formulas, as Sunnyside's Mastic Remover Advanced composition shows.
- Water-based concentrates are diluted and poured through carpet or over sheet goods to release adhesive before the old floor is lifted.
- Wet scraping and low-speed machines pair with removal solutions so crews can clear residual adhesive without sanding or grinding asbestos flooring.
Need a Custom Version of This Report?
Tailor the scope, geography, or segments to your exact requirements.
- Custom geography or segment scope
- Direct access to our analyst team
Formulators compete on VOC compliance and contractor reach
Competition in this market turns on VOC compliance, coverage per gallon and reach into contractor channels rather than on list price alone. Franmar competes in soy formulas with its Blue Bear line, sold online, through green building suppliers and through abatement distributors. Sentinel serves professional flooring and abatement crews with low-odor removers in gallons and pails. WM Barr reaches homeowners through its Klean-Strip Green floor adhesive remover in U.S. home centers and hardware chains. Sunnyside sells benzyl alcohol formulas, while ARDEX through its Henry brand and Bostik add removers to their flooring adhesive ranges. HG International supplies floor glue removers to European DIY retailers. Distributors such as Aramsco, which acquired the Jon-Don business assets in 2025, resell these products and are not profiled as producers.
How is the supply side organized and where do margins sit?
The supply side of this market is fragmented among mid-sized U.S. formulators, building chemical groups and European DIY brands. Franmar, Sentinel and Sunnyside focus on removers, strippers and solvents, while WM Barr, ARDEX and Bostik sell them beside flooring adhesives and coatings. Raw materials such as soy esters, benzyl alcohol and dibasic esters are bought from chemical suppliers, so formulators earn margin on blending, VOC compliance and brand. Entry barriers are modest in chemistry but higher in shelf access and in contractor trust, which trade distributors control.
Companies profiled and their roles in this market
| Company | Type | Role in the market |
|---|---|---|
| Franmar Chemical, Inc. | Bio-based formulator | Makes Blue Bear 500MR soy mastic remover with stated VOC below 3% |
| W.M. Barr & Company, Inc. | Consumer chemicals maker | Sells Klean-Strip Green floor adhesive remover through U.S. home centers |
| Sentinel Products, Inc. | Flooring chemicals formulator | Makes 747 Plus and 747C low-odor removers for flooring and abatement crews |
| Sunnyside Corporation | Solvents and removers maker | Makes a benzyl alcohol based Mastic Remover Advanced formula |
| ARDEX Group (W.W. Henry Company) | Flooring installation systems | Sells Henry EasyRelease water-based vinyl and carpet adhesive remover |
| Bostik (Arkema) | Flooring adhesives maker | Sells Ultimate Adhesive Remover for urethane wood flooring adhesive |
| HG International B.V. | European DIY brand | Sells HG floor glue remover for carpet, vinyl, cork and tile glues |
Compliance and coverage per gallon will decide winners
Credence Research's view is that compliance and real coverage per gallon, more than headline dissolving power, will decide which suppliers gain share in this market. Solvent rules in the United States and asbestos limits in Europe steadily narrow the formulas that contractors can use indoors. Soy and benzyl alcohol formulas are best placed, but their higher shelf price keeps solvent products alive in price-led channels. Abatement buyers should qualify at least two compliant removers, and formulators should publish tested coverage rates by adhesive type.
Earlier estimate rolled forward and tested on volumes
The report uses 2025 as the base year and forecasts to 2035. The earlier Credence Research estimate for 2024 was rolled forward one year at its own growth rate and tested against U.S. floor covering volumes, listed retail prices per gallon and stated coverage rates. Regional and segment shares are Credence Research estimates based on building age, asbestos and solvent rules, flooring volumes and channel evidence. Sources include the EPA, OSHA, EU law, the California Air Resources Board, USDA, the Census Bureau, housing and flooring trade data, company product sheets and retailer listings. No interviews or surveys were conducted for this update of the estimate.
Low-VOC chemistry and renovation programs carry demand
Growth to 2035 depends on renovation volumes in older buildings and on how quickly solvent rules reshape formulas. The base case assumes U.S. remodeling grows slowly after 2027, while EU renovation duties and Chinese urban renewal keep regulated removal work rising. Tile removal should stay the largest application as old asbestos flooring is cleared, while glue-down vinyl replacement lifts demand for removers suited to modern adhesives. Bio-based and water-based formulas should gain share as methylene chloride and high-VOC products leave the market.
Remodeling cycles and solvent rules set the range of outcomes
The spread of outcomes depends mainly on U.S. and European renovation volumes and on how quickly solvent rules push buyers to new formulas. A prolonged remodeling slowdown would cut tear-outs and favor cheaper solvent products. Fast EU transposition of renovation and asbestos rules, plus continued Chinese urban renewal, form the main upside for compliant low-odor removers.
| Scenario | CAGR, 2026–2035 | Value, 2035 | What has to hold |
|---|---|---|---|
| Downside | 4.6% | USD 1.09 billion | U.S. remodeling stalls through 2028 and buyers trade down to cheap solvent removers |
| Base | 6.20% | USD 1.25 billion | Remodeling grows slowly while low-VOC and soy formulas gain steady share |
| Upside | 7.5% | USD 1.40 billion | EU renovation duties and Chinese urban renewal lift regulated removal work |
Frequently Asked Questions
How big is the mastic remover market?
What is a mastic remover used for?
Which application holds the largest share?
Are soy-based mastic removers effective?
Which region leads the market?
Can methylene chloride still be used to remove mastic?
What restrains the mastic remover market?
Who are the main mastic remover suppliers?
Table of Content
Chapter 1 Market Segmentation
- 1.1 Segmentation Framework
- 1.1.1 Product and Service Classification
- 1.1.2 Application and End-Use Classification
- 1.1.3 Technology and Solution Classification
- 1.1.4 Customer and Distribution Channel Classification
- 1.1.5 Geographic Segmentation
- 1.1.6 Market Segment Definitions and Boundaries
- 1.2 By Product Type
- 1.2.1 Solvent-based
- 1.2.2 Water-based
- 1.2.3 Bio-based
- 1.2.4 Others
- 1.3 By Application
- 1.3.1 Tile Removal
- 1.3.2 Carpet Removal
- 1.3.3 Vinyl Flooring Removal
- 1.3.4 Other Adhesive Removal
Chapter 2 Introduction
- 2.1 Report Objectives and Scope
- 2.2 Product Definition and Industry Terminology
- 2.3 Market Inclusions and Exclusions
- 2.4 Research Process
- 2.4.1 Primary Research and Expert Interviews
- 2.4.2 Secondary Research and Source Review
- 2.4.3 Top-Down and Bottom-Up Estimation
- 2.4.4 Data Triangulation and Verification
- 2.5 Market Size Measurement Basis
- 2.5.1 2025: USD 687.2 million → 2035: USD 1.25 billion
- 2.6 Historical and Forecast Reference Periods
- 2.6.1 Historical Period: 2018-2025
- 2.6.2 Base Year: 2025
- 2.6.3 Forecast Period: 2025-2035
- 2.7 Research Assumptions and Limitations
Chapter 3 Executive Summary
- 3.1 Market Snapshot and Key Findings
- 3.2 Base-Year Market Size, 2025
- 3.3 Forecast Market Size, 2035
- 3.4 Revenue and Volume Growth Outlook
- 3.5 Key Demand and Supply Indicators
- 3.6 Leading Market Segments
- 3.7 Fastest-Growing Market Opportunities
- 3.8 Regional Performance Highlights
- 3.9 Technology and Industry Transformation
- 3.10 Competitive Landscape Summary
- 3.11 Analyst View and Strategic Implications
Chapter 4 Global Mastic Remover Market Trends and Developments
- 4.1 Historical Industry Development, 2018-2025
- 4.2 Recent Market Trends and Developments
- 4.3 Demand and Customer Behavior Trends
- 4.4 Technology and Product Innovation
- 4.5 Artificial Intelligence, Automation and Digitalization
- 4.6 Local Manufacturing and Supply Chain Realignment
- 4.7 Industry Partnerships, Mergers and Acquisitions
- 4.8 Sustainability and Circular Economy Developments
- 4.9 Government and Private Sector Investment Trends
- 4.10 Emerging Business Models and Commercialization
- 4.11 Industry Developments and Announcements
Chapter 5 Global Mastic Remover Market Production, Supply and Demand Analysis
- 5.1 Demand Trend and Consumption Analysis, 2018-2025
- 5.2 Demand Forecast, 2025-2035
- 5.3 Production and Output Trend, 2018-2025
- 5.4 Production and Output Forecast, 2025-2035
- 5.5 Installed Capacity and Capacity Utilization
- 5.6 Company-Wise Production Plants and Statistics
- 5.6.1 Installed Production Capacity
- 5.6.2 Actual Production
- 5.6.3 Planned Capacity and Expansion Targets
- 5.7 Supply Chain Structure and Procurement Trends
- 5.8 Supply-Demand Gap and Bottlenecks
- 5.9 Import Dependence and Sourcing Structure
- 5.10 Contract Manufacturing and Outsourcing
- 5.11 Regional Supply and Demand Concentration
Chapter 6 Global Mastic Remover Market Pricing Analysis
- 6.1 Pricing Structure and Measurement
- 6.2 Historical Pricing Trends, 2018-2025
- 6.3 Pricing Outlook, 2025-2035
- 6.4 Average Selling Price and Unit Economics
- 6.5 Pricing by Product and Market Segment
- 6.6 Geographic Pricing Differences
- 6.7 Key Input, Energy, Labor and Logistics Costs
- 6.8 Contract Pricing and Purchasing Models
- 6.9 Pricing Sensitivity and Competitive Positioning
- 6.10 Price, Margin and Profitability Implications
Chapter 7 Global Mastic Remover Market Dynamics
- 7.1 Market Growth Drivers
- 7.1.1 Demand-Side Drivers
- 7.1.2 Technology and Innovation Drivers
- 7.1.3 Infrastructure and Investment Drivers
- 7.1.4 Regulatory and Policy Drivers
- 7.2 Market Restraints
- 7.2.1 Cost and Affordability Constraints
- 7.2.2 Technology and Adoption Barriers
- 7.2.3 Supply Chain and Operational Constraints
- 7.3 Market Challenges
- 7.3.1 Competitive Pressure and Margin Erosion
- 7.3.2 Skills, Infrastructure and Implementation Gaps
- 7.4 Emerging Market Opportunities
- 7.5 Market Dynamics Impact and Time-Horizon Assessment
Chapter 8 Global Mastic Remover Value Chain Analysis
- 8.1 Industry Value Chain Overview
- 8.2 Upstream Suppliers and Critical Inputs
- 8.3 Technology and Component Providers
- 8.4 Manufacturing or Service Delivery
- 8.5 Distribution, Channel Partners and Integrators
- 8.6 Downstream Applications and End Users
- 8.7 Value Addition and Profit Pools
- 8.8 Vertical Integration and Outsourcing
- 8.9 Supplier Concentration and Risk
- 8.10 Supply Chain Localization and Resilience
Chapter 9 Global Mastic Remover Market Regulations and Policies
- 9.1 Relevant Laws, Standards and Compliance Frameworks
- 9.2 Product, Service, Safety and Quality Requirements
- 9.3 Government Policies, Incentives and Subsidies
- 9.4 Imports, Exports and Trade Barriers
- 9.5 Public Procurement and Local Content Requirements
- 9.6 Environmental and Sustainability Compliance
- 9.7 Upcoming Policy Changes and Market Implications
Chapter 10 Global Mastic Remover Market Hotspots and Opportunities
- 10.1 Market Opportunity Mapping and Growth Hotspots
- 10.2 High-Growth Applications and Customer Groups
- 10.3 Underserved Markets and White-Space Opportunities
- 10.4 Emerging Technology and Product Opportunities
- 10.5 New Capacity and Investment Hotspots
- 10.6 Market Entry and Expansion Opportunities
- 10.7 Distribution and Partnership Opportunities
- 10.8 Near-Term and Long-Term Commercial Potential
- 10.9 Opportunity Attractiveness and Execution Risks
Chapter 11 Global Mastic Remover Market Outlook, 2025-2035
- 11.1 Market Size and Analysis
- 11.1.1 Revenue (Market Measurement: 2025: USD 687.2 million → 2035: USD 1.25 billion)
- 11.1.2 Market Volume and Quantity Sold
- 11.1.3 Historical Market Size, 2018-2025
- 11.1.4 Base-Year Market Size, 2025
- 11.2 Market Forecast, 2025-2035
- 11.2.1 Revenue Forecast to 2035
- 11.2.2 Volume Forecast to 2035
- 11.2.3 CAGR and Year-on-Year Growth
- 11.2.4 Incremental Revenue Opportunity
- 11.3 Forecast Assumptions and Scenario Analysis
- 11.3.1 Base-Case Forecast
- 11.3.2 Optimistic and Conservative Scenarios
- 11.3.3 Technology, Pricing and Policy Sensitivities
- 11.4 Market Attractiveness and Growth Outlook
Chapter 12 Global Mastic Remover Market Segmentation and Outlook
- 12.1 Segmentation Summary and Market Shares, 2025
- 12.2 Largest and Fastest-Growing Segments
- 12.3 By Product Type - Market Size and Forecast, 2025-2035
- 12.3.1 Segment Definition and Scope
- 12.3.2 Historical Market Size, 2018-2025
- 12.3.3 Revenue Forecast, 2025-2035
- 12.3.4 Volume Forecast, 2025-2035
- 12.3.5 Base-Year Market Share, 2025
- 12.3.6 Segment CAGR and Growth Drivers
- 12.3.7 Subsegment Market Size and Forecast
- 12.3.7.1 Solvent-based
- 12.3.7.2 Water-based
- 12.3.7.3 Bio-based
- 12.3.7.4 Others
- 12.3.8 Subsegment Pricing and Adoption Trends
- 12.3.9 Leading Suppliers and Competition
- 12.3.10 Regional Demand and Opportunities
- 12.4 By Application - Market Size and Forecast, 2025-2035
- 12.4.1 Segment Definition and Scope
- 12.4.2 Historical Market Size, 2018-2025
- 12.4.3 Revenue Forecast, 2025-2035
- 12.4.4 Volume Forecast, 2025-2035
- 12.4.5 Base-Year Market Share, 2025
- 12.4.6 Segment CAGR and Growth Drivers
- 12.4.7 Subsegment Market Size and Forecast
- 12.4.7.1 Tile Removal
- 12.4.7.2 Carpet Removal
- 12.4.7.3 Vinyl Flooring Removal
- 12.4.7.4 Other Adhesive Removal
- 12.4.8 Subsegment Pricing and Adoption Trends
- 12.4.9 Leading Suppliers and Competition
- 12.4.10 Regional Demand and Opportunities
- 12.5 Segment Growth Comparison
- 12.6 Segment Attractiveness and Priority Matrix
Chapter 13 Global Mastic Remover End-Use and Application Market Outlook
- 13.1 End-Use Industry and Customer Demand Structure
- 13.2 Leading Applications and Customer Groups
- 13.3 End-Use Market Size, Share and Forecast
- 13.4 Major End-Use Industry Deep Dives
- 13.4.1 Customer Requirements and Use Cases
- 13.4.2 Demand and Replacement Cycles
- 13.4.3 Technical and Regulatory Considerations
- 13.4.4 Purchasing and Procurement Models
- 13.4.5 Leading Vendors and Distribution Channels
- 13.4.6 Forecast and Commercial Opportunities
- 13.5 Emerging Applications and Cross-Segment Demand
- 13.6 End-Use Industry Investment Priorities
Chapter 14 Global Mastic Remover Geographic Market Outlook, 2025-2035
- 14.1 Regional Market Size and Share, 2025
- 14.2 Regional Market Forecast, 2025-2035
- 14.3 Regional Pricing, Production and Demand Differences
- 14.4 North America
- 14.4.1 United States
- 14.4.2 Canada
- 14.4.3 Mexico
- 14.5 Europe
- 14.5.1 Germany
- 14.5.2 France
- 14.5.3 Italy
- 14.5.4 United Kingdom
- 14.5.5 Spain
- 14.5.6 Poland
- 14.5.7 Russia
- 14.5.8 Netherlands
- 14.5.9 Belgium
- 14.5.10 Sweden
- 14.5.11 Denmark
- 14.5.12 Norway
- 14.5.13 Rest of Europe
- 14.6 Asia Pacific
- 14.6.1 China
- 14.6.2 India
- 14.6.3 Japan
- 14.6.4 South Korea
- 14.6.5 Thailand
- 14.6.6 Indonesia
- 14.6.7 Vietnam
- 14.6.8 Malaysia
- 14.6.9 Australia
- 14.6.10 Rest of Asia Pacific
- 14.7 Latin America
- 14.7.1 Brazil
- 14.7.2 Argentina
- 14.7.3 Colombia
- 14.7.4 Chile
- 14.7.5 Rest of Latin America
- 14.8 Middle East
- 14.8.1 Saudi Arabia
- 14.8.2 United Arab Emirates
- 14.8.3 Turkey
- 14.8.4 Israel
- 14.8.5 Iran
- 14.8.6 Rest of the Middle East
- 14.9 Africa
- 14.9.1 South Africa
- 14.9.2 Egypt
- 14.9.3 Nigeria
- 14.9.4 Morocco
- 14.9.5 Rest of Africa
- 14.10 Regional Investment, Policy and Supply Chain Differences
- 14.11 Regional Competitive Landscape
- 14.12 Geographic Growth Hotspots
Chapter 15 Global Mastic Remover Technology, Innovation and Sustainability Outlook
- 15.1 Technology Landscape and Maturity
- 15.2 Product, Process and Service Innovation
- 15.3 AI, Automation and Digital Tools in the Industry
- 15.4 Technology Adoption and Performance Benchmarking
- 15.5 Innovation Pipeline and R&D Investment
- 15.6 Patent and Intellectual Property Trends
- 15.7 Energy Efficiency and Resource Management
- 15.8 Sustainability, Recycling and Circularity
- 15.9 Technology Roadmap, 2025-2035
- 15.10 Risks of Obsolescence and Technology Substitution
Chapter 16 Global Mastic Remover Market Key Strategic Imperatives
- 16.1 Growth and Market Entry Priorities
- 16.2 High-Return Products and Segments
- 16.3 Pricing, Profitability and Cost Optimization
- 16.4 Technology Investment and Product Differentiation
- 16.5 Supply Chain Localization and Resilience
- 16.6 Distribution and Customer Acquisition
- 16.7 Partnership, Acquisition and Capacity Strategy
- 16.8 Regional Expansion Priorities
- 16.9 Short-, Medium- and Long-Term Actions
Chapter 17 Competition Outlook
- 17.1 Industry Competition Characteristics
- 17.2 Market Structure and Concentration
- 17.3 Market Share and Competitive Positioning, 2025
- 17.4 Company-Wise Revenue and Product Benchmarking
- 17.5 Production and Service Capacity Benchmarking
- 17.6 Technology, Pricing and Differentiation
- 17.7 Regional Footprint and Distribution Strength
- 17.8 Mergers, Acquisitions and Strategic Alliances
- 17.9 New Entrants and Competitive Threats
- 17.10 Porter's Five Forces and Industry Attractiveness
- 17.11 Competitive Outlook, 2025-2035
Chapter 18 Company Profiles
- 18.1 Company Coverage and Selection Criteria
- 18.2 Franmar Chemical, Inc.
- 18.2.1 Business Description
- 18.2.2 Company Ownership and Geographic Presence
- 18.2.3 Product and Service Portfolio
- 18.2.4 Manufacturing and Operating Footprint
- 18.2.5 Production Capacity and Expansion Plans
- 18.2.6 Financial Performance and Investment
- 18.2.7 Market Share and Competitive Position
- 18.2.8 Technology and Innovation Capabilities
- 18.2.9 Strategic Alliances or Partnerships
- 18.2.10 Recent Developments
- 18.2.11 Growth Strategy and Outlook
- 18.3 W.M. Barr & Company, Inc.
- 18.4 Sentinel Products, Inc.
- 18.5 Sunnyside Corporation
- 18.6 ARDEX Group (W.W. Henry Company)
- 18.7 Bostik (Arkema)
- 18.8 HG International B.V.
- 18.9 Other Relevant Market Participants
Note: Every listed company is profiled on the structure shown under the first company. The company list is preliminary and may change based on research findings, market developments, data availability and client requirements.
Chapter 19 Disclaimer
- 19.1 Research and Forecast Disclaimer
- 19.2 Data Source and Estimation Limitations
Note: The depth of individual sections depends on data availability for this market. Volume, capacity, trade and other unit-based metrics are included where applicable.