
Nigeria cold chain and pharma logistics goes hub-based
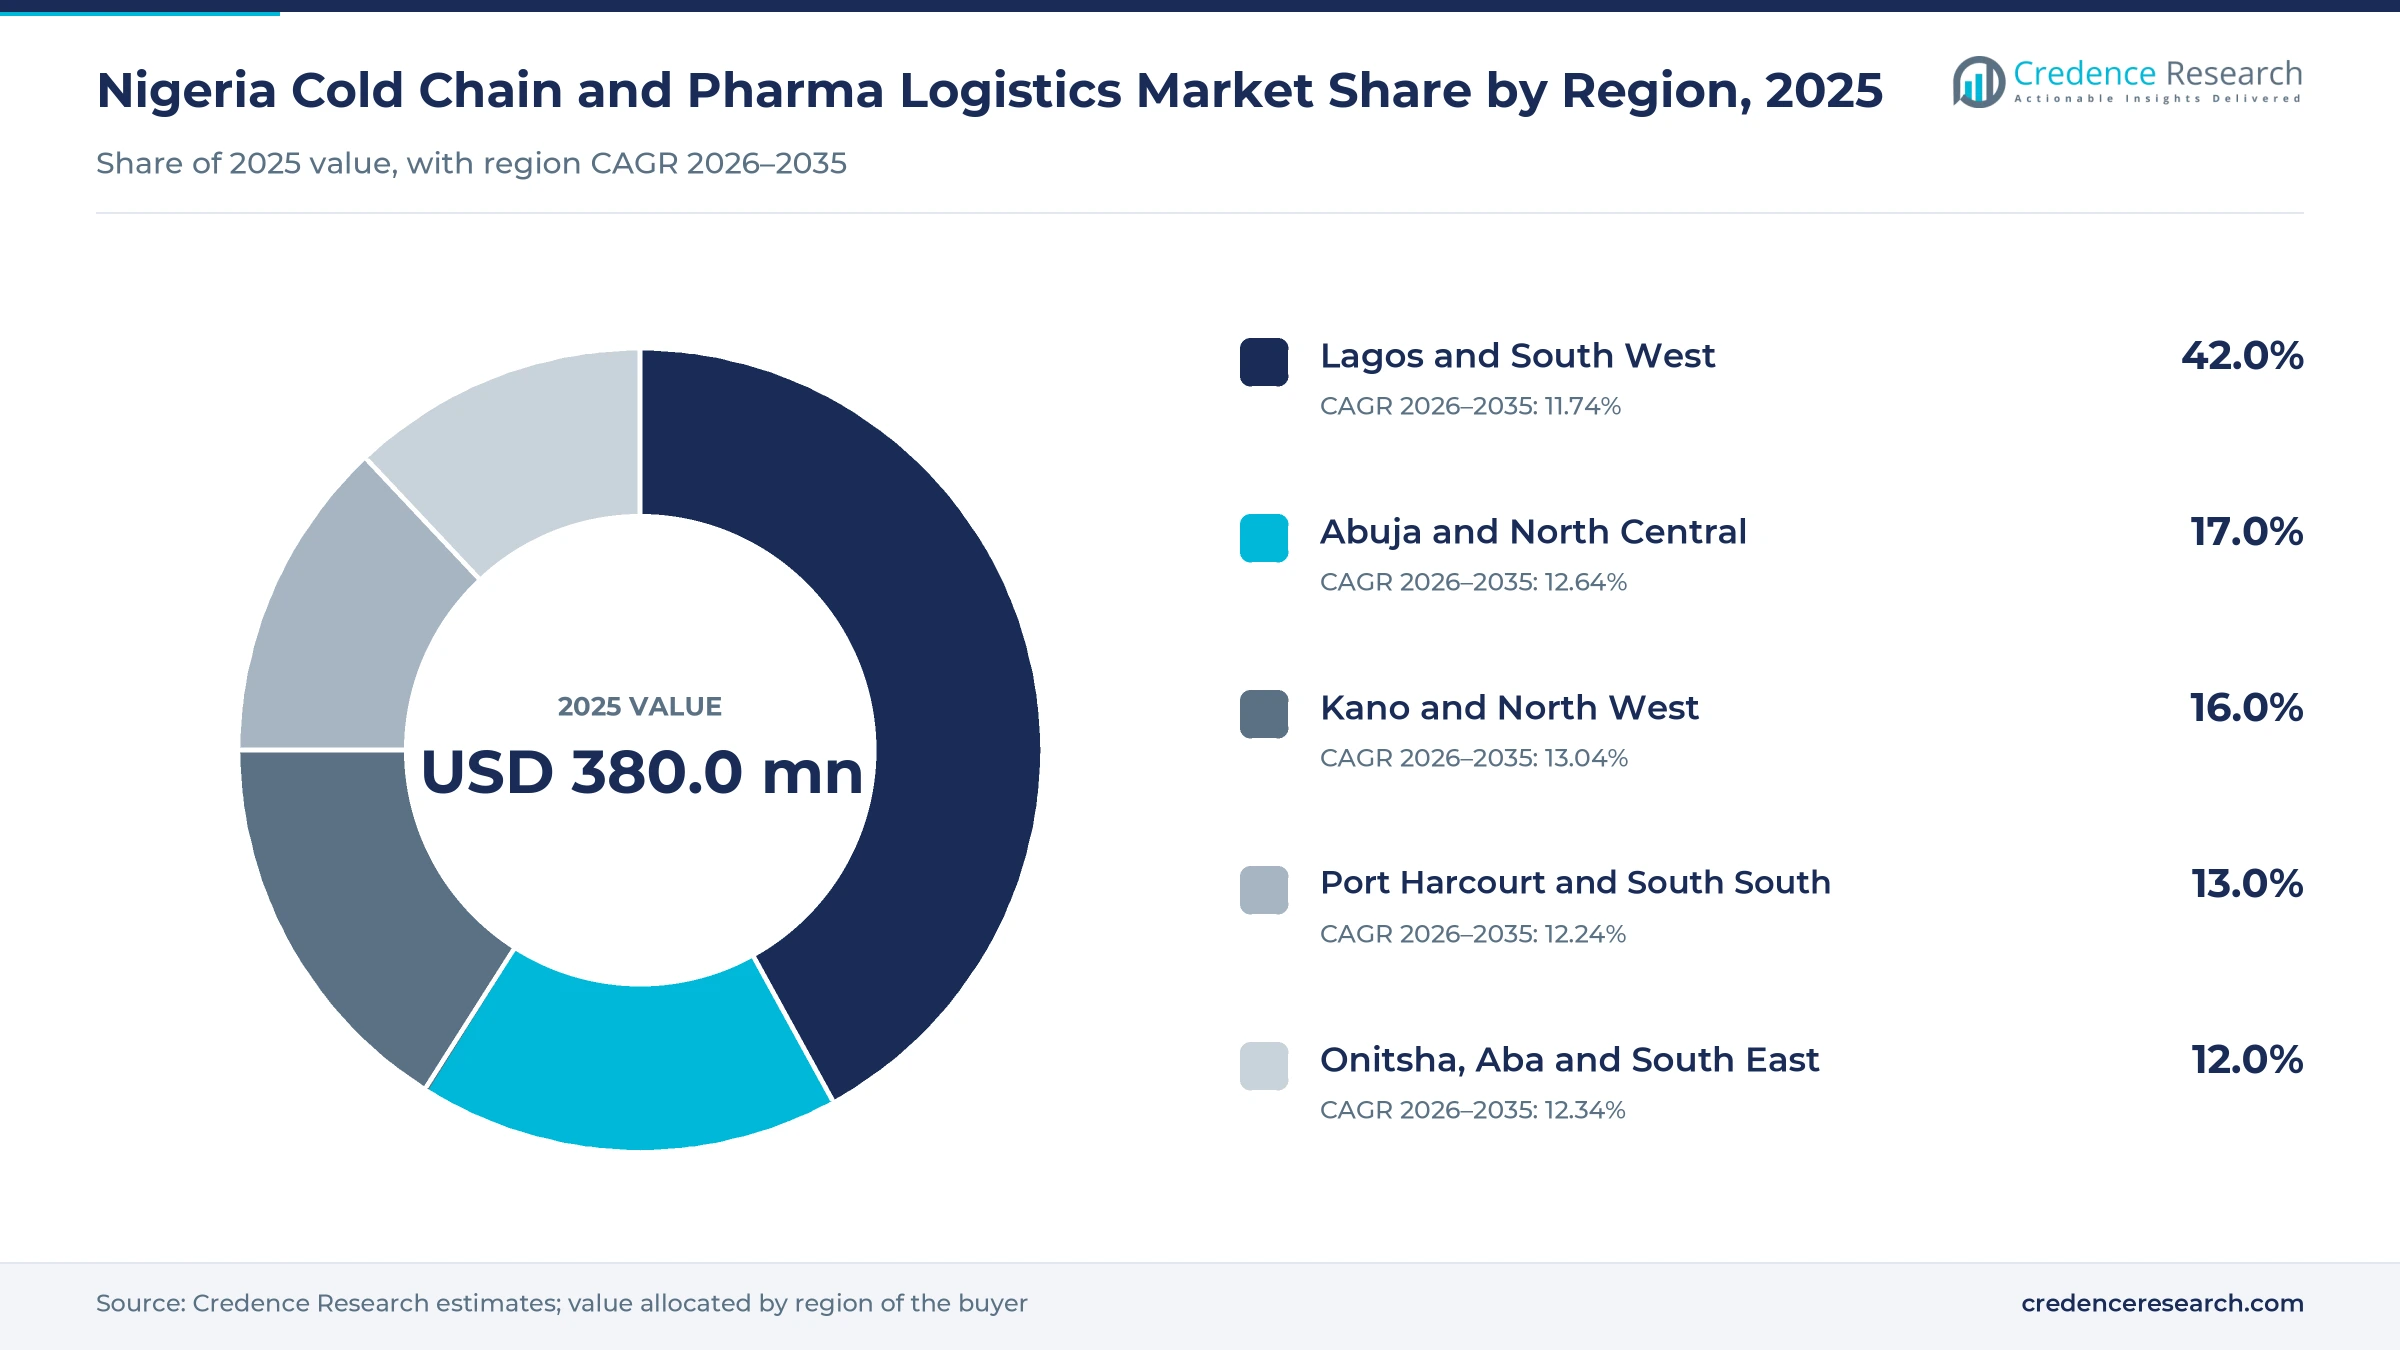
The Nigeria cold chain and pharma logistics market was valued at USD 380.0 million in 2025 and is projected to increase from USD 426.6 million in 2026 to USD 1.21 billion by 2035, registering a CAGR of 12.25% during 2026–2035. Demand comes from imported medicines that need validated handling, a public vaccine program that buys about USD 150 million of doses a year, and a distribution overhaul moving medicines out of open markets. Lagos and South West held the largest zonal share, 42.0% in 2025, because the main seaports, the main airport and the first national vaccine megastore sit there. Kano and North West is the fastest-growing zone at 13.04% a year, as a planned Kano hub and the largest federal allocation of solar refrigerators extend capacity north. Pack-level traceability under the 2024 NAFDAC regulation is also changing what buyers pay for, shifting spend from plain haulage toward monitoring and compliance.
What does the Nigerian market for temperature-controlled medicine logistics actually count?
The Nigeria cold chain and pharma logistics market counts third-party fees for refrigerated transport, temperature-controlled warehousing, validated packaging, monitoring and compliance services, and last-mile delivery of medicines and health products. Buyers are public health agencies, importers, wholesalers, manufacturers, hospitals and laboratories, and they usually purchase under annual contracts or program tenders.
The value of the medicines themselves is excluded, as are food cold chains, in-house fleets run by public agencies, and equipment sales such as refrigerators. The value chain runs from air and sea gateways through bonded and central stores to state warehouses, local government cold stores and primary health centers.
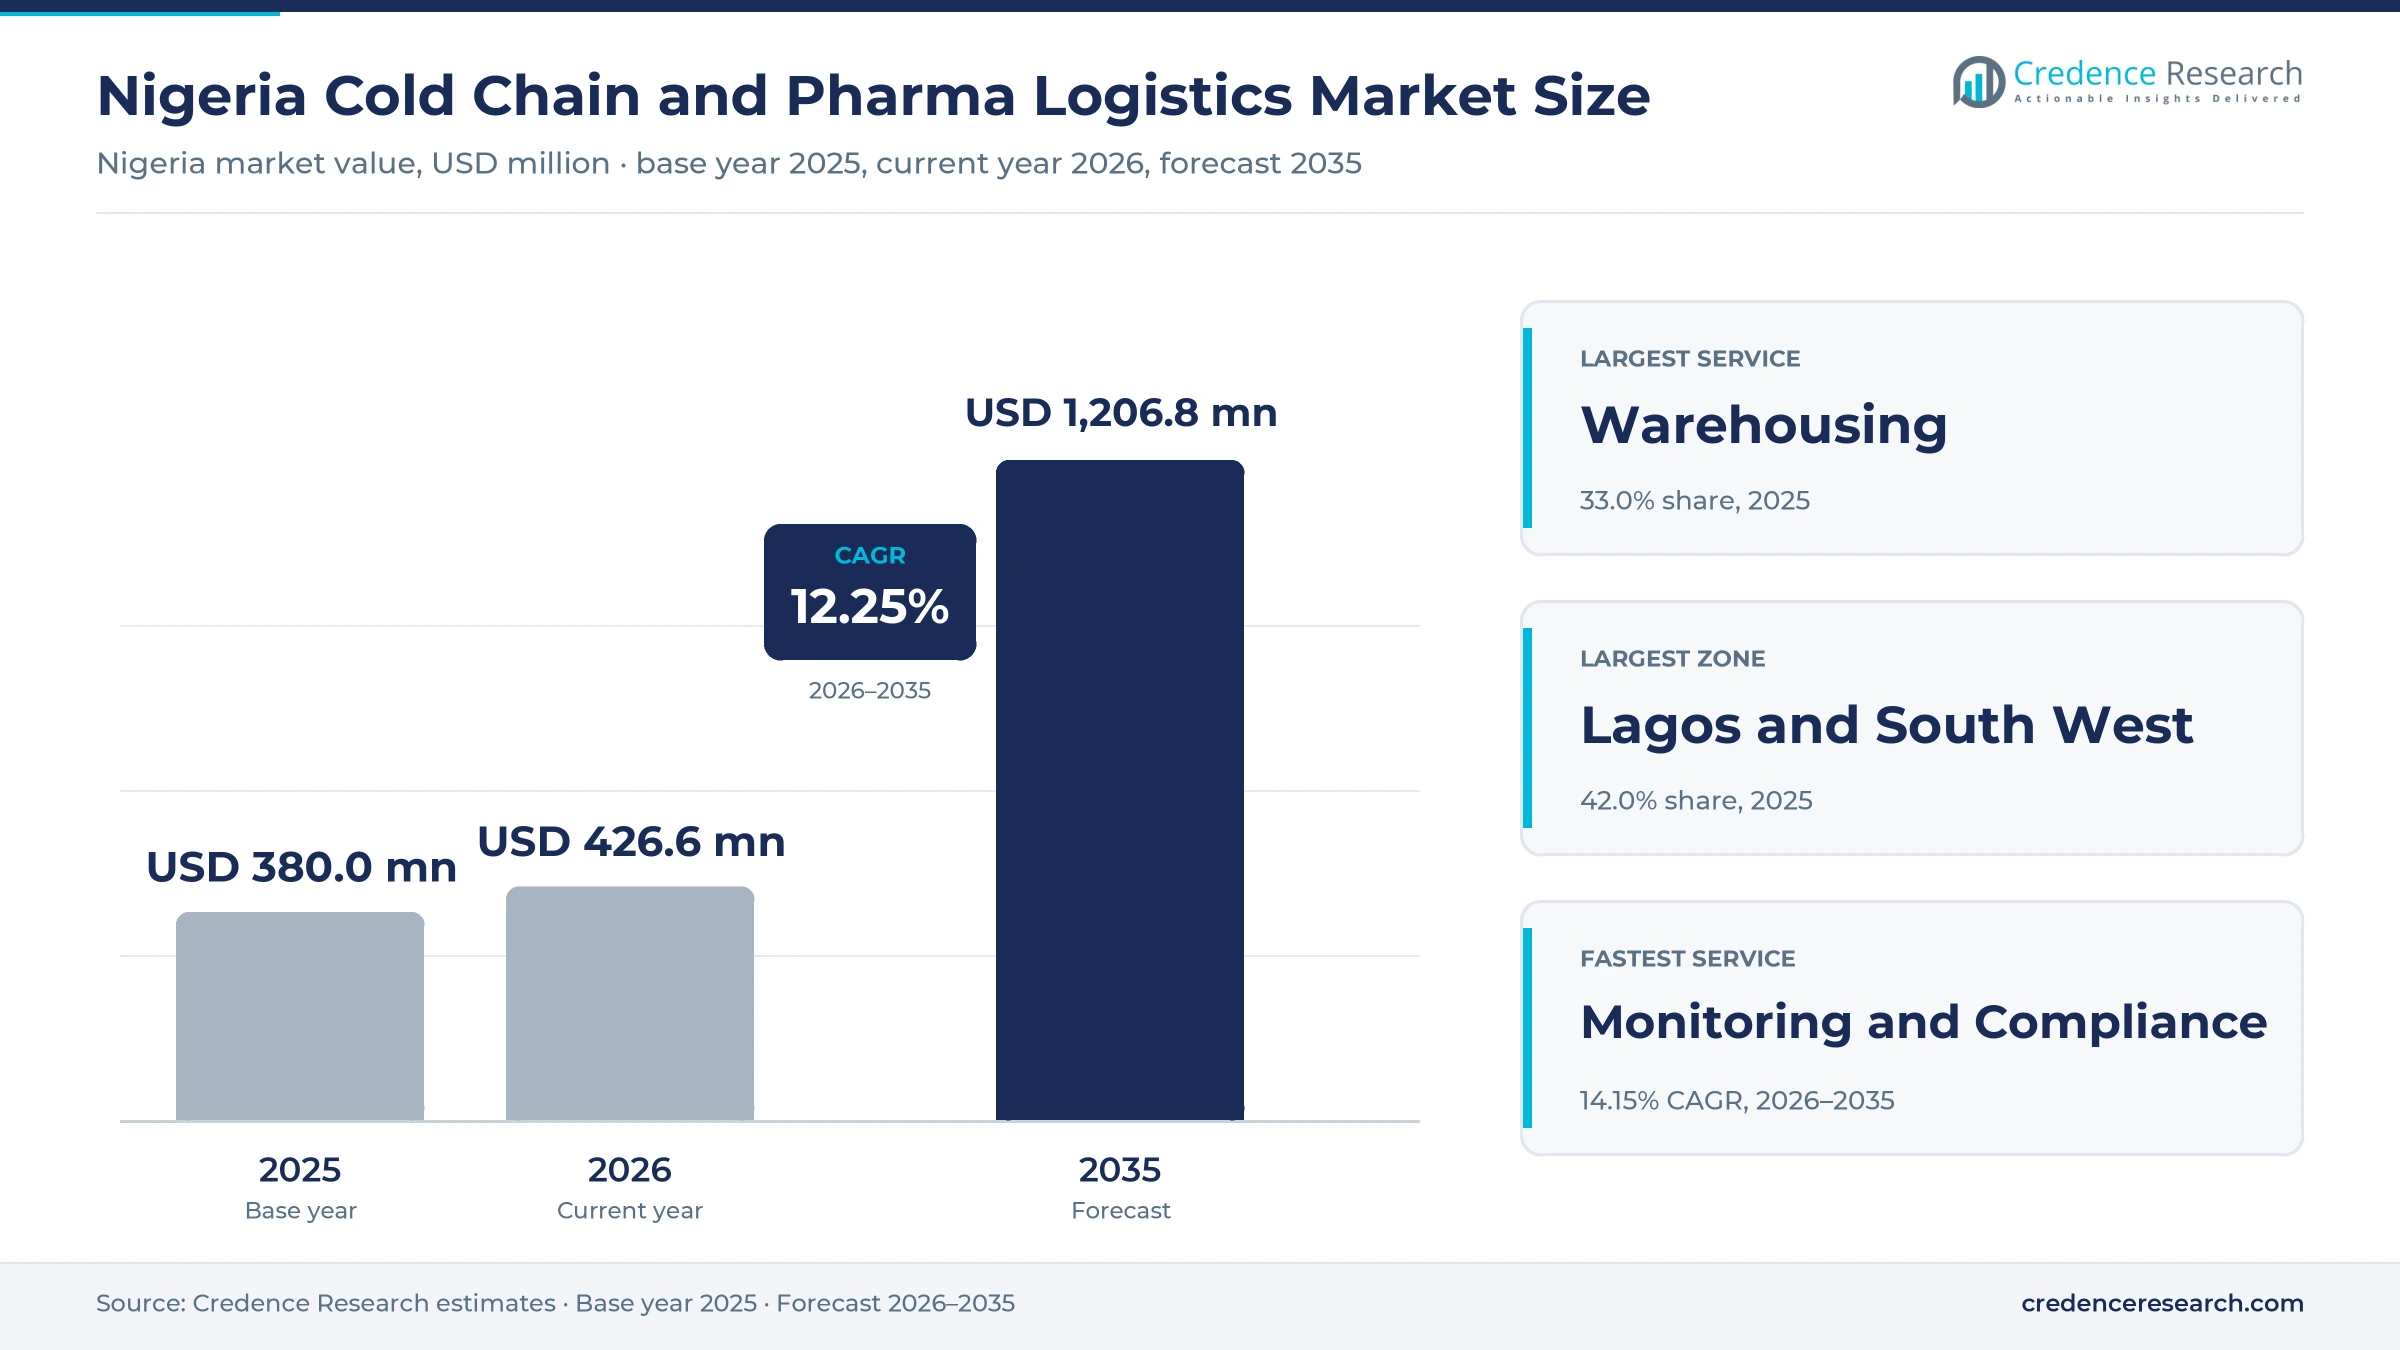
Nigeria Cold Chain and Pharma Logistics Market Insights
- The market grows from USD 380.0 million in 2025 to USD 1.21 billion by 2035, a 12.25% CAGR that rests on hub construction and regulated distribution rather than on volume alone.
- Lagos and South West led with 42.0% of 2025 value, supported by port and airport access and the May 2026 opening of the Lagos vaccine storage hub.
- Temperature-Controlled Warehousing led services with 33.0% of 2025 value, because federal and donor programs have put their capital into pharma-grade stores first.
- NAFDAC published its traceability regulation in October 2024, and revised storage and distribution guidelines took effect on Nov. 26, 2024, raising documentation standards across carriers.
- A $5.1 billion Nigeria and U.S. health pact running from April 2026 to December 2030 widens program freight, while outsourcing rules favor licensed operators with audited facilities.
Warehousing and public vaccine programs hold the value
Why does warehousing out-earn refrigerated trucking in Nigeria?
Based on service type, the market is categorized into temperature-controlled warehousing, refrigerated transport, validated packaging, monitoring and compliance, and last-mile delivery. Temperature-Controlled Warehousing led with 33.0% of 2025 value because public and private capital went to stores first, including 1,152 cubic meters of cold and freezer rooms at the Lagos hub reported by Vanguard in May 2026. Monitoring and Compliance grows fastest at 14.15% a year, as NAFDAC has now fielded more than 965 scanners and trained more than 2,500 health workers, and because its storage guidelines require calibrated sensors and driver alarms on refrigerated vehicles.
Which products pay for most temperature-controlled capacity?
Based on end-use industry, the market is categorized into vaccines and biologics, prescription pharmaceuticals, diagnostics and laboratory reagents, blood and plasma products, and clinical trial materials. Vaccines and Biologics led with 38.0% of 2025 value because the federal government spends about $150 million a year on vaccines, according to the NPHCDA in April 2026, and most of those doses need an unbroken chain. Blood and Plasma Products grows fastest at 13.65% a year, as emergency delivery models spread after Zipline began moving processed blood to Kaduna health facilities in June 2023, according to the News Agency of Nigeria.
Why do public agencies remain the largest buyers of cold freight?
Based on customer type, the market is categorized into public health agencies, distributors and wholesalers, pharmaceutical manufacturers, hospitals and clinics, and diagnostic and research institutions. Public Health Agencies led with 36.0% of 2025 value because donor and federal programs fund national flows, and the Federal Ministry of Information said in June 2025 that Global Fund support covers 22 medical warehouses in 21 states. Pharmaceutical Manufacturers grows fastest at 13.35% a year, as NAFDAC reported 190 local drug makers in 2026, up from 174, with 28 having completed new construction and begun operations.
How are contracts shifting from dedicated fleets to program logistics?
Based on business model, the market is categorized into dedicated contract logistics, shared-user third-party logistics, pay-per-use cold storage, managed control tower and public-private program logistics. Dedicated Contract Logistics led with 34.0% of 2025 value because multinational principals favor audited, dedicated warehouse and distribution contracts, a service MDS Logistics offers alongside its general warehousing. Public-Private Program Logistics grows fastest at 13.56% a year, as the Federal Ministry of Health framework published in May 2026 proposes public-private partnerships for warehousing and distribution, with licensed third-party operators working under service-level agreements.
| Segment Group | Leading Sub-segment | Share, 2025 | Fastest-growing Sub-segment | CAGR, 2026–2035 |
|---|---|---|---|---|
| By Service Type | Temperature-Controlled Warehousing | 33.0% | Monitoring and Compliance | 14.15% |
| By End-Use Industry | Vaccines and Biologics | 38.0% | Blood and Plasma Products | 13.65% |
| By Customer Type | Public Health Agencies | 36.0% | Pharmaceutical Manufacturers | 13.35% |
| By Business Model | Dedicated Contract Logistics | 34.0% | Public-Private Program Logistics | 13.56% |
Request a Free Sample
Fill in your details and we'll send you a free sample report.
- Sample data tables & charts
- Research methodology
Imports, immunization and traceability set volumes
How does import dependence create validated freight demand?
Imported medicines create the core freight base, because every shipment needs a bonded, temperature-qualified path from port or airport to a licensed store. UNCTAD data published by CEIC put medicament imports, the base of gateway demand, at about $605.9 million in 2024, and KPMG in Nigeria estimated in July 2026 that 60% to 75% of medicines are imported. NAFDAC reported a fall to a 50-to-50 import and local ratio by 2025, although the National Association of Industrial Pharmacists said in May 2026 that imports still exceed 70%. As a result, gateway work remains the largest single source of billable activity for operators in this market. Most pharmaceutical containers arrive refrigerated, according to BusinessDay, which keeps reefer handling central to importer contracts.
Why does the immunization program keep expanding cold capacity?
The immunization program is the largest single source of cold volume, and its gaps justify more capacity each year. WHO and UNICEF estimates put DTP3 coverage at 62% in 2023 and recorded a one-month vaccine stockout at national and subnational levels, while Gavi counts about 2.3 million zero-dose children, based on 2022 estimates. The NPHCDA said in April 2026 that malaria vaccination reached almost 1.3 million children after expanding to Bauchi and Ondo, with about 600,000 doses held in national stores. Because malaria vaccines need four doses per child, each new state adds repeat deliveries rather than a single campaign. In turn, Vaccines and Biologics holds 38.0% of 2025 value.
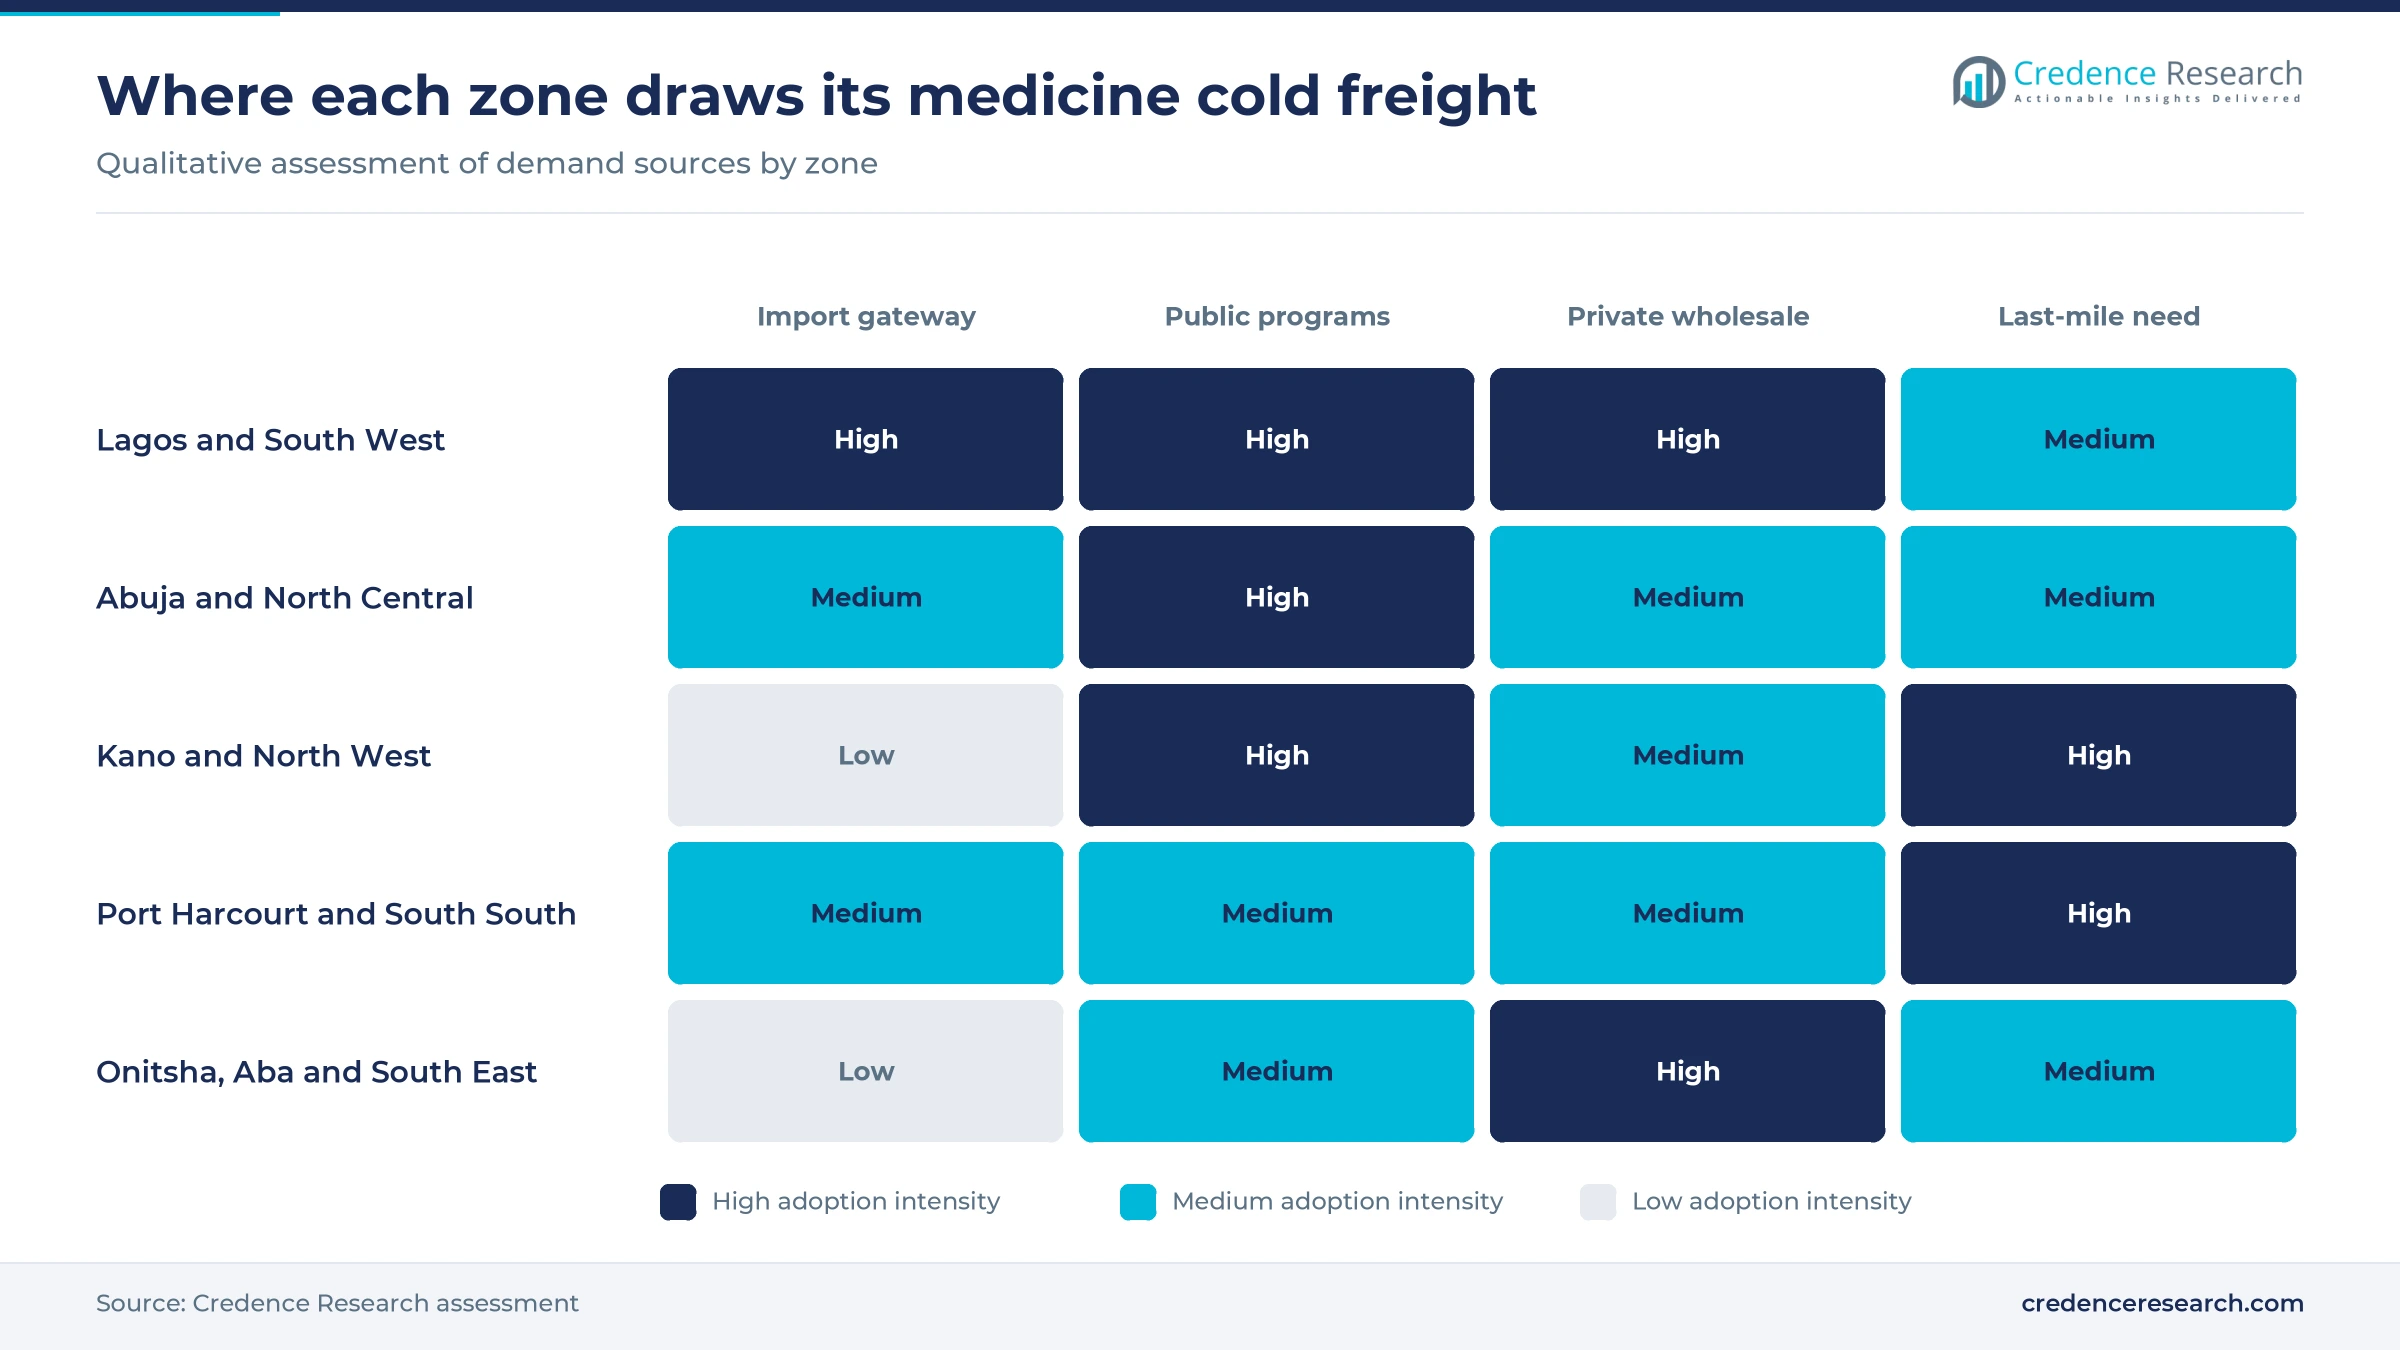
What do traceability and storage rules add to service scope?
New rules turn compliance into a paid service, because records now have to survive an audit at each custody change. NAFDAC published its traceability regulation in October 2024 with phased compliance, and its earlier COVID-19 pilot commissioned more than one million packs across 358 scanning locations. GS1 says Nigeria has required its standards for labeling all pharmaceuticals since 2024, and a recall of affected COVID-19 doses was traced in under one hour. DHL notes that the storage guidelines effective Nov. 26, 2024, require vehicles to hold temperature while parked with the engine off. Consequently, Monitoring and Compliance demand is growing at 14.15% a year, faster than any other service line.
How is the crackdown on open drug markets moving freight?
Enforcement against open drug markets is moving informal volume into licensed, inspectable channels that need documented storage. KPMG in Nigeria estimated in July 2026 that more than 70% of medicines still pass through informal sellers, which leaves a large base of demand to convert. NAFDAC sealed more than 11,000 shops across Idumota, Onitsha and Aba during raids from Feb. 9 to March 27, 2025, according to Nairametrics. Leadership reported in November 2024 that 1,370 wholesale outlets were sealed in Kano as the Dangwauro coordinated wholesale center directive took effect. This shift mainly benefits service demand from wholesalers, because relocated traders must now buy compliant storage and delivery that they previously handled themselves in market stalls.
Megastores, drones and local plants reshape freight flows
Shift to a three-hub vaccine megastore network
Vaccine storage is shifting from one national store and six zonal stores to a three-hub model covering Lagos, Abuja and Kano. Vanguard reported in May 2026 that the Lagos hub at Oshodi holds 15,312 cubic meters of dry storage and six temperature-controlled rooms, funded through the World Bank-supported IMPACT Project. It will serve 12 states and more than 90 million people by 2035, sitting eight kilometers from the international airport and 16 kilometers from Apapa Port. Abuja construction is underway, while Kano work is due to start later in 2026. As a result, secondary haulage from hubs to states is becoming a larger contracted lane, which supports growth in Kano and North West and other zones far from the coast.
Rise of drone and solar delivery at the last mile
The last mile is moving toward drones and off-grid refrigeration because road access and grid power remain unreliable in many districts. Techpoint Africa reported in July 2026 that Zipline had delivered 6.1 million vaccine doses in about 180,000 deliveries across Kaduna, Cross River and Bayelsa since 2022, and plans 12 more distribution sites. Nairametrics reported in August 2025 that 1,653 solar direct-drive refrigerators worth about $11 million were being distributed nationwide, with 10-year maintenance agreements. These units extend potency further down the chain, which lengthens the routes carriers can serve profitably. Temperature recorders ship with each unit, so facility data is also improving, and Monitoring and Compliance benefits directly from these newly monitored delivery points.
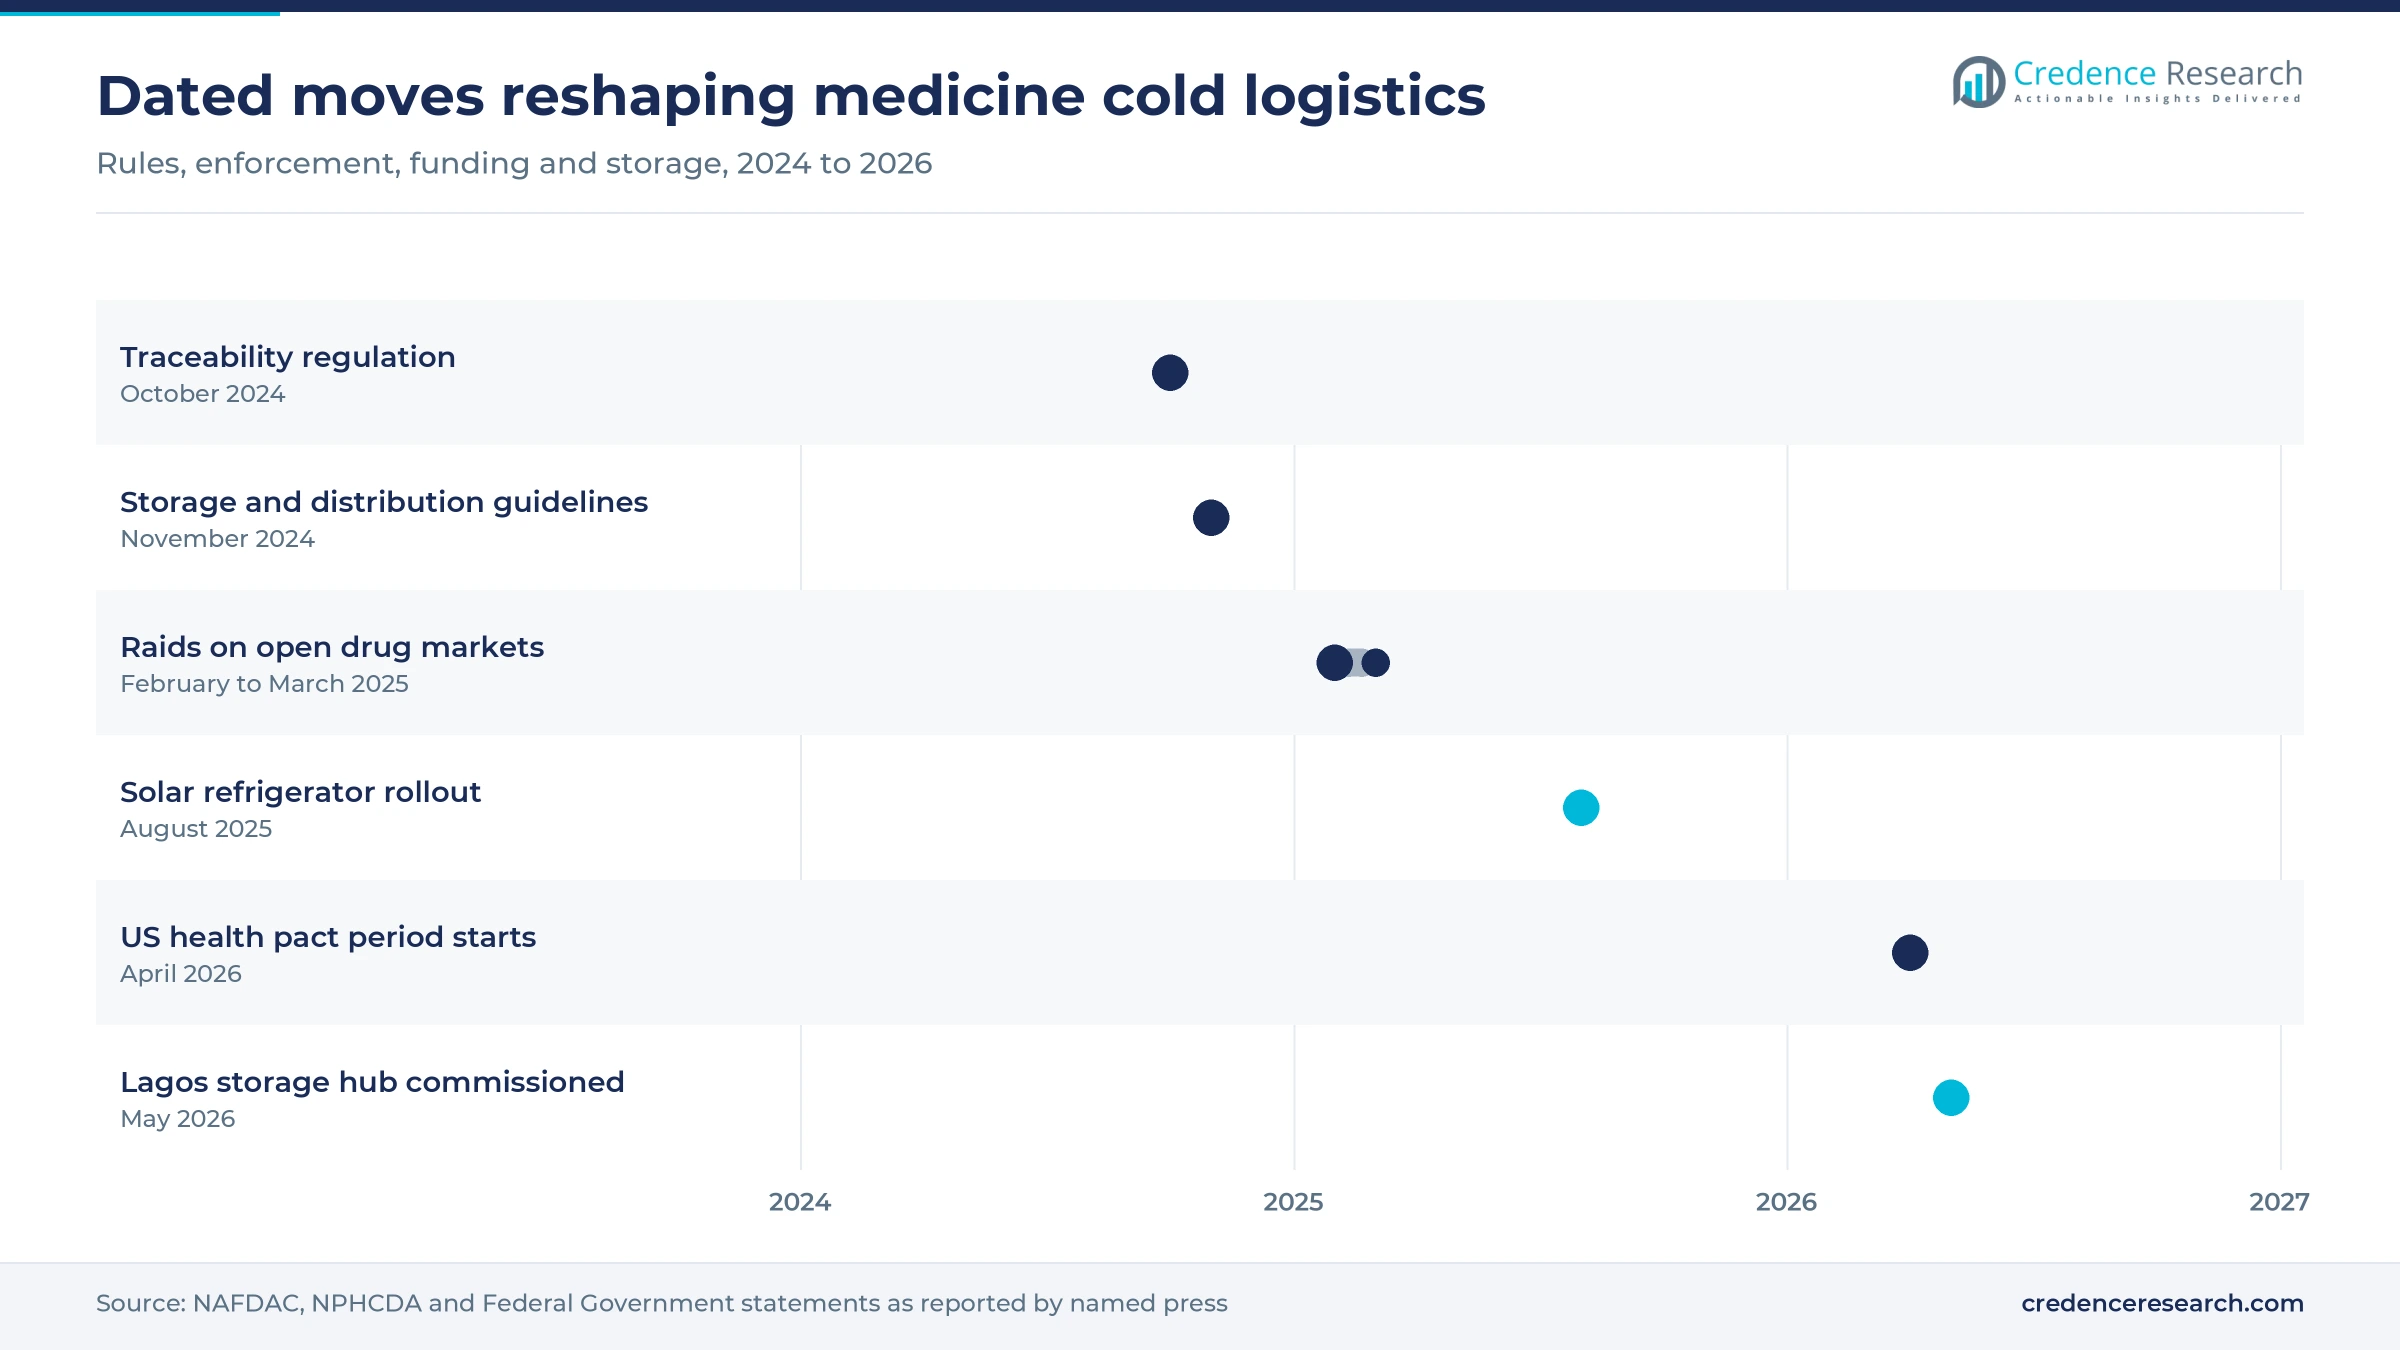
Opening in outsourced state warehouses and zonal hubs
State supply systems offer a clear opening for private operators, because federal policy now asks states to outsource rather than build fleets. The Federal Ministry of Health framework published in May 2026 calls for at least one zonal hub per senatorial zone and for licensed 3PL and 4PL providers under service-level agreements. It also proposes public-private partnerships to serve hard-to-reach areas and remote communities. The ministry reported that 27 of 37 state supply systems had been developed, while integration of logistics units stood at 57%. For a capable operator, this creates a pipeline of multi-year contracts beyond Lagos, and Public-Private Program Logistics is the fastest model at 13.56% a year. Early movers can also secure inspection-ready sites before the procurement rounds begin.
Opening in contract-manufacturer inbound and outbound lanes
Local manufacturing opens a new lane in which carriers move materials into plants and finished packs out to wholesalers. NAFDAC reported in 2026 that contract manufacturers rose from 10 in 2019 to 87, and that it had approved layouts for 176 companies by June 2026, including 106 new facilities. KPMG in Nigeria estimated that more than 90% of active ingredients and excipients are still imported, so inbound temperature-sensitive materials will continue alongside outbound product. The Ceiling List also expanded from nine products in 2020 to 36, pushing import volumes toward domestic plants. Operators serving Pharmaceutical Manufacturers, a group growing 13.35% a year, can sell plant-gate storage, qualified haulage and distribution as a single audited contract.
Diesel, port waits and donor exits squeeze service margins
Diesel costs keep reefer and warehouse margins thin
Power is the largest controllable cost, and it has moved sharply against operators. Cold storage demand now faces average retail diesel at N3,277.47 per liter in May 2026, up 86.40% in a year, the National Bureau of Statistics reported. Stores and reefers that run on generators cannot pass this through quickly under fixed-price program contracts, so smaller operators are hit hardest. Solar hybrid systems and fuel-indexed clauses are the usual mitigation, although KPMG in Nigeria noted a 26.5% policy rate in February 2026, which makes that capital expensive.
Port delays and clearing charges raise reefer exposure
Port delay is a product risk as well as a cost, because every extra day on plugged power adds excursion risk. KPMG in Nigeria cited waits of 10 to 21 days before berthing at Apapa and Tin Can in its July 2026 study. BusinessDay reported in October 2024 that clearing a 40-foot pharmaceutical container cost at least N28 million, against N7 million a year earlier. Importers absorb much of this cost, which raises the value of faster clearance and validated port-side storage.
Too few refrigerated trucks limit inland reach
Fleet scarcity limits inland service, particularly for routes north of Abuja. BusinessDay reported in April 2025 that Nigeria had fewer than 1,000 cold trucks against about 25,000 needed, a gap driven largely by food freight. Because perishable food haulage competes for the same vehicles, medicine shippers often pay for dedicated capacity. Operators are mitigating this with passive validated packaging on ordinary trucks, which adds qualification cost for each lane and season.
Shrinking donor support puts program freight at risk
Donor transition is the main demand risk, because programs pay for a large share of national flows. The NPHCDA said in April 2026 that donor support is shrinking, and the Federal Ministry of Health framework flags reduced Gavi support as a shortage and maintenance risk. The $5.1 billion pact with the United States, announced in December 2025, depends on Nigeria supplying about $3 billion itself. Late state or federal releases would delay carrier payments, so operators are seeking payment guarantees.
Lagos leads while Abuja and Kano hubs rebalance capacity
| Region | Value, 2025 (USD million) | Share, 2025 | CAGR, 2026–2035 |
|---|---|---|---|
| Lagos and South West | 159.6 | 42.0% | 11.74% |
| Abuja and North Central | 64.6 | 17.0% | 12.64% |
| Kano and North West | 60.8 | 16.0% | 13.04% |
| Port Harcourt and South South | 49.4 | 13.0% | 12.24% |
| Onitsha, Aba and South East | 45.6 | 12.0% | 12.34% |
Lagos and South West holds the gateways and the first megastore
Lagos and South West held 42.0% of 2025 value and grows at 11.74% a year, the slowest pace because it already has the deepest capacity. Lekki carried 40.6% of national cargo throughput in 2025 and Apapa 16.7%, according to Nigerian Ports Authority data cited by Ecofin Agency in May 2026. The zone also has the lowest average diesel price at N3,227.55 per liter, as the National Bureau of Statistics reported. Air Cargo Week reported in 2019 that Sifax SAHCOL runs a 22,000-square-meter Lagos airport warehouse with a cold room.
Abuja coordinates national health programs
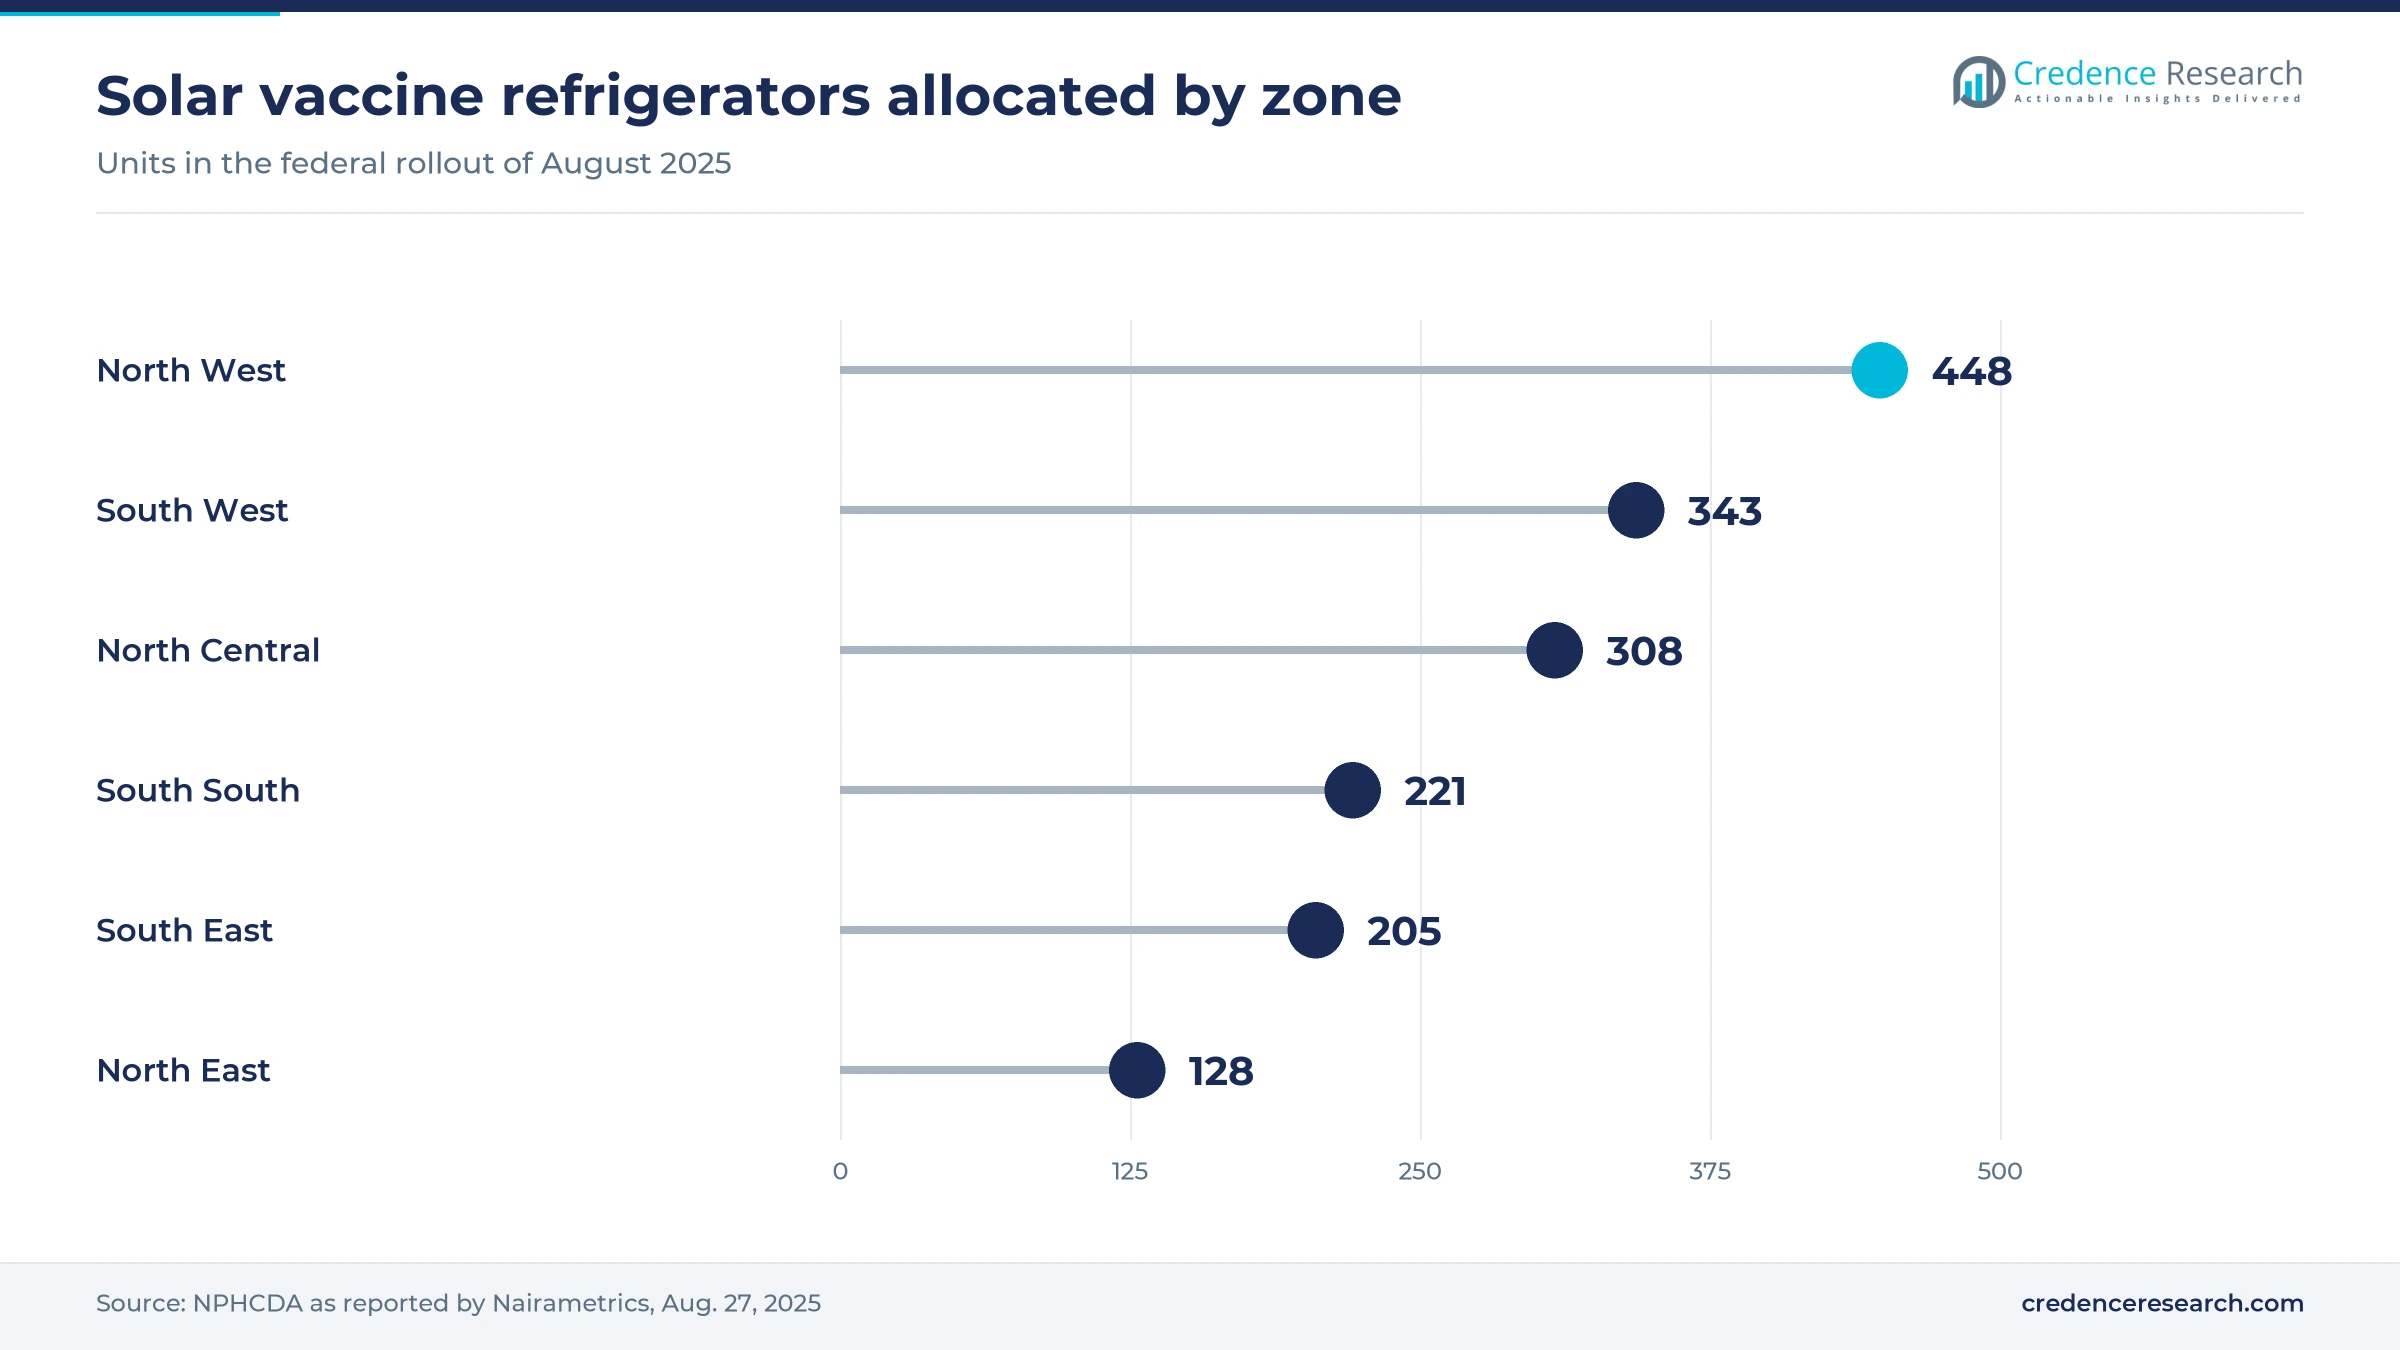
Abuja and North Central held 17.0% of 2025 value and grows at 12.64% a year, helped by federal agencies and donor offices clustered in the capital. The Federal Ministry of Information reported in June 2025 that the Global Fund had backed an expanded Abuja premier warehouse. North Central also received 308 of the 1,653 federal solar refrigerators, according to Nairametrics. Construction of the Abuja vaccine hub adds regional storage, which should shorten supply routes to the Middle Belt and neighboring North East.
Kano sets the fastest growth pace
Kano and North West held 16.0% of 2025 value and grows fastest at 13.04% a year, reflecting a low base and heavy program demand. The zone received 448 solar refrigerators, which was the largest allocation. Gavi also identifies northern states including Sokoto and Kano among the main zero-dose concentrations. The Dangwauro wholesale center gives Kano a licensed medicine trading base, and a federal vaccine hub is planned. However, the zone also carries the highest average diesel price, at N3,313.60 per liter.
Port Harcourt zone relies on Lagos and river routes
The Port Harcourt zone held 13.0% of 2025 value and grows at 12.24% a year, with demand linked to teaching hospitals and riverine outreach. The zone received 221 solar refrigerators, and the Lagos hub is designated to supply its states alongside the South West. Bayelsa was an early malaria vaccine state and, with Cross River, a Zipline partner, which shows how difficult road access shapes delivery. Because that hub sits in Lagos, road transit time from the west will shape pricing here.
Onitsha, Aba and South East is reorganizing around licensed trade
Onitsha, Aba and South East held 12.0% of 2025 value and grows at 12.34% a year, shaped by large private wholesale markets. Onitsha reopened on March 6, 2025, after about 4,000 shop operators had to meet NAFDAC requirements individually, according to Nairametrics. Aba and Onitsha are both designated for coordinated wholesale centers, which would create new inspected storage demand. The zone also received 205 solar refrigerators for public health facilities, although hospital cold demand remains smaller than in other zones.
Dated moves in vaccine storage and drug distribution
| Development | Status and market relevance |
|---|---|
| In May 2026, the Lagos Cold and Dry Storage Hub was commissioned at the Federal Central Medical Stores in Oshodi as the first of three national vaccine megastores. | Commissioned; serves 12 states; Abuja underway and Kano to follow |
| In May 2026, APM Terminals, part of the Maersk group, pledged $600 million to modernize the Apapa container terminal and its logistics infrastructure. | Pledge announced; no timeline or breakdown published |
| In December 2025, the federal government announced a five-year U.S. health agreement covering April 2026 to December 2030 and worth about $5.1 billion. | Runs to December 2030; NAFDAC track and trace monitors supplied products |
| In August 2025, the NPHCDA began distributing 1,653 solar direct-drive refrigerators supplied with Gavi and UNICEF support. | Rollout to all states and the Federal Capital Territory |
| In October 2024, NAFDAC published the Pharmaceutical Products Traceability Regulation with phased compliance for the supply chain. | Phased; maternal and child health pilot running since 2025 |
Sensors, serialization and solar units change service scope
- Scan-to-verify serialization uses GS1 2D DataMatrix codes so that health workers can record each custody change on a handset.
- IoT monitoring relies on IoT temperature sensors and alarms placed at likely hot spots, as storage guidelines now expect in qualified vehicles.
- Electronic stock systems reach deeper as OpenLMIS covers all 835 vaccine cold stores, while about 20,000 primary health facilities kept paper records until recently, according to DHL.
- Solar direct-drive refrigerators remove the battery and generator dependence that interrupts storage at remote clinics, and 30-day recorders document performance.
Need a Custom Version of This Report?
Tailor the scope, geography, or segments to your exact requirements.
- Custom geography or segment scope
- Direct access to our analyst team
Integrators and local fleets compete on validated reach
Competition splits between global integrators, Nigerian logistics groups and specialist couriers, and it turns on validated reach rather than on the headline freight rate. DHL offers monitored inbound air service and control towers for Nigeria, which suits multinational importers with strict audit needs. MDS Logistics, founded in 1965, competes on national depth across 31 states. Zenith Carex markets pharmaceutical and cold chain services backed by a fleet of more than 110 vehicles, while SIFAX Group brings airport handling through Sifax SAHCOL. Maersk has scale at sea through its terminal affiliate at Apapa. Public buyers increasingly require registered facilities and service-level reporting, so licensed warehouses are becoming the price of entry. Credence Research expects smaller carriers to partner with hub operators, because few can fund both qualified vehicles and monitored stores on their own. Demand in pharma logistics is also shifting toward integrated contracts that combine storage, haulage and reporting.
Companies profiled and their roles in this market
| Company | Type | Role in the market |
|---|---|---|
| MDS Logistics | National contract logistics | Warehousing, haulage and distribution, with listed pharma and cold storage services across 31 states |
| DHL Supply Chain Nigeria | Global integrator | Monitored inbound pharmaceutical air freight, road forwarding and control towers |
| Zenith Carex International | Lagos logistics group | Pharmaceutical logistics, cold chain, clearing and haulage with more than 110 vehicles |
| SIFAX Group | Aviation and logistics group | Airport cargo handling through Sifax SAHCOL, including a cold room in Lagos |
| Maersk Nigeria | Ocean carrier and terminal affiliate | Container shipping presence, with affiliate APM Terminals operating the Apapa container terminal |
Compliance capacity will decide who wins program contracts
Credence Research's view is that compliance capacity, not fleet size, will decide who wins the next round of program contracts. The Lagos hub shows that donors and the federal government will pay for pharma-grade assets, yet they still need private operators to move product from hubs to states. Pharma logistics operators that can show qualified vehicles, calibrated monitoring and traceable records should win longer contracts in a market growing 12.25% a year. Those relying on spot haulage face margin pressure from diesel and clearing costs, and they will also find it harder to pass the audits that buyers now require.
How the Nigerian temperature-controlled model was built
The report uses 2025 as the base year and forecasts to 2035. Market values come from the Credence Research model, which applies logistics fee ratios to public estimates of the Nigerian medicines market and checks the result against official import data and published cold storage capacity. Zonal, service, product, buyer and contract splits are Credence Research estimates. Source types used are regulators, ministries, statistics agencies, multilateral health bodies, company pages and named press reports. No interviews or surveys were conducted for this edition of the report.
Three-hub network and local plants frame growth to 2035
The Nigeria cold chain and pharma logistics market should reach USD 1.21 billion by 2035, with growth concentrated in the years when the Abuja and Kano hubs open and state zonal stores begin to contract out services. Local manufacturing will reduce some import-gateway freight, but it will add plant lanes for biologics only once domestic fill and finish expands, which remains a longer-term prospect. Monitoring and compliance fees should keep rising as traceability phases widen. The main swing factors are donor transition, diesel prices and how quickly state governments release counterpart funding for program distribution contracts.
Frequently Asked Questions
How big is the Nigeria cold chain and pharma logistics market?
Which zone leads medicine cold logistics in Nigeria?
Which service line earns the most?
Which service line is growing fastest?
What rules govern pharmaceutical logistics in Nigeria?
How much does Nigeria spend on vaccines each year?
What are the main risks for operators?
Which companies are active in this market?
Table of Content
Chapter 1 Market Segmentation
- 1.1 Segmentation Framework
- 1.1.1 Product and Service Classification
- 1.1.2 Application and End-Use Classification
- 1.1.3 Technology and Solution Classification
- 1.1.4 Customer and Distribution Channel Classification
- 1.1.5 Geographic Segmentation
- 1.1.6 Market Segment Definitions and Boundaries
- 1.2 By Service Type
- 1.2.1 Temperature-Controlled Warehousing
- 1.2.2 Refrigerated Transport
- 1.2.3 Last-Mile Delivery
- 1.2.4 Validated Packaging
- 1.2.5 Monitoring and Compliance
- 1.3 By End-Use Industry
- 1.3.1 Vaccines and Biologics
- 1.3.2 Prescription Pharmaceuticals
- 1.3.3 Diagnostics and Laboratory Reagents
- 1.3.4 Blood and Plasma Products
- 1.3.5 Clinical Trial Materials
- 1.4 By Customer Type
- 1.4.1 Public Health Agencies
- 1.4.2 Distributors and Wholesalers
- 1.4.3 Pharmaceutical Manufacturers
- 1.4.4 Hospitals and Clinics
- 1.4.5 Diagnostic and Research Institutions
- 1.5 By Business Model
- 1.5.1 Dedicated Contract Logistics
- 1.5.2 Shared-User Third-Party Logistics
- 1.5.3 Public-Private Program Logistics
- 1.5.4 Pay-Per-Use Cold Storage
- 1.5.5 Managed Control Tower
Chapter 2 Introduction
- 2.1 Report Objectives and Scope
- 2.2 Product Definition and Industry Terminology
- 2.3 Market Inclusions and Exclusions
- 2.4 Research Process
- 2.4.1 Primary Research and Expert Interviews
- 2.4.2 Secondary Research and Source Review
- 2.4.3 Top-Down and Bottom-Up Estimation
- 2.4.4 Data Triangulation and Verification
- 2.5 Market Size Measurement Basis
- 2.5.1 2025: USD 380.0 million → 2035: USD 1.21 billion
- 2.6 Historical and Forecast Reference Periods
- 2.6.1 Historical Period: 2018-2025
- 2.6.2 Base Year: 2025
- 2.6.3 Forecast Period: 2025-2035
- 2.7 Research Assumptions and Limitations
Chapter 3 Executive Summary
- 3.1 Market Snapshot and Key Findings
- 3.2 Base-Year Market Size, 2025
- 3.3 Forecast Market Size, 2035
- 3.4 Revenue and Volume Growth Outlook
- 3.5 Key Demand and Supply Indicators
- 3.6 Leading Market Segments
- 3.7 Fastest-Growing Market Opportunities
- 3.8 Regional Performance Highlights
- 3.9 Technology and Industry Transformation
- 3.10 Competitive Landscape Summary
- 3.11 Analyst View and Strategic Implications
Chapter 4 Nigeria Cold Chain and Pharma Logistics Market Trends and Developments
- 4.1 Historical Industry Development, 2018-2025
- 4.2 Recent Market Trends and Developments
- 4.3 Demand and Customer Behavior Trends
- 4.4 Technology and Product Innovation
- 4.5 Artificial Intelligence, Automation and Digitalization
- 4.6 Local Manufacturing and Supply Chain Realignment
- 4.7 Industry Partnerships, Mergers and Acquisitions
- 4.8 Sustainability and Circular Economy Developments
- 4.9 Government and Private Sector Investment Trends
- 4.10 Emerging Business Models and Commercialization
- 4.11 Industry Developments and Announcements
Chapter 5 Nigeria Cold Chain and Pharma Logistics Market Production, Supply and Demand Analysis
- 5.1 Demand Trend and Consumption Analysis, 2018-2025
- 5.2 Demand Forecast, 2025-2035
- 5.3 Production and Output Trend, 2018-2025
- 5.4 Production and Output Forecast, 2025-2035
- 5.5 Installed Capacity and Capacity Utilization
- 5.6 Company-Wise Production Plants and Statistics
- 5.6.1 Installed Production Capacity
- 5.6.2 Actual Production
- 5.6.3 Planned Capacity and Expansion Targets
- 5.7 Supply Chain Structure and Procurement Trends
- 5.8 Supply-Demand Gap and Bottlenecks
- 5.9 Import Dependence and Sourcing Structure
- 5.10 Contract Manufacturing and Outsourcing
- 5.11 Regional Supply and Demand Concentration
Chapter 6 Nigeria Cold Chain and Pharma Logistics Market Pricing Analysis
- 6.1 Pricing Structure and Measurement
- 6.2 Historical Pricing Trends, 2018-2025
- 6.3 Pricing Outlook, 2025-2035
- 6.4 Average Selling Price and Unit Economics
- 6.5 Pricing by Product and Market Segment
- 6.6 Geographic Pricing Differences
- 6.7 Key Input, Energy, Labor and Logistics Costs
- 6.8 Contract Pricing and Purchasing Models
- 6.9 Pricing Sensitivity and Competitive Positioning
- 6.10 Price, Margin and Profitability Implications
Chapter 7 Nigeria Cold Chain and Pharma Logistics Market Dynamics
- 7.1 Market Growth Drivers
- 7.1.1 Demand-Side Drivers
- 7.1.2 Technology and Innovation Drivers
- 7.1.3 Infrastructure and Investment Drivers
- 7.1.4 Regulatory and Policy Drivers
- 7.2 Market Restraints
- 7.2.1 Cost and Affordability Constraints
- 7.2.2 Technology and Adoption Barriers
- 7.2.3 Supply Chain and Operational Constraints
- 7.3 Market Challenges
- 7.3.1 Competitive Pressure and Margin Erosion
- 7.3.2 Skills, Infrastructure and Implementation Gaps
- 7.4 Emerging Market Opportunities
- 7.5 Market Dynamics Impact and Time-Horizon Assessment
Chapter 8 Nigeria Cold Chain and Pharma Logistics Value Chain Analysis
- 8.1 Industry Value Chain Overview
- 8.2 Upstream Suppliers and Critical Inputs
- 8.3 Technology and Component Providers
- 8.4 Manufacturing or Service Delivery
- 8.5 Distribution, Channel Partners and Integrators
- 8.6 Downstream Applications and End Users
- 8.7 Value Addition and Profit Pools
- 8.8 Vertical Integration and Outsourcing
- 8.9 Supplier Concentration and Risk
- 8.10 Supply Chain Localization and Resilience
Chapter 9 Nigeria Cold Chain and Pharma Logistics Market Regulations and Policies
- 9.1 Relevant Laws, Standards and Compliance Frameworks
- 9.2 Product, Service, Safety and Quality Requirements
- 9.3 Government Policies, Incentives and Subsidies
- 9.4 Imports, Exports and Trade Barriers
- 9.5 Public Procurement and Local Content Requirements
- 9.6 Environmental and Sustainability Compliance
- 9.7 Upcoming Policy Changes and Market Implications
Chapter 10 Nigeria Cold Chain and Pharma Logistics Market Hotspots and Opportunities
- 10.1 Market Opportunity Mapping and Growth Hotspots
- 10.2 High-Growth Applications and Customer Groups
- 10.3 Underserved Markets and White-Space Opportunities
- 10.4 Emerging Technology and Product Opportunities
- 10.5 New Capacity and Investment Hotspots
- 10.6 Market Entry and Expansion Opportunities
- 10.7 Distribution and Partnership Opportunities
- 10.8 Near-Term and Long-Term Commercial Potential
- 10.9 Opportunity Attractiveness and Execution Risks
Chapter 11 Nigeria Cold Chain and Pharma Logistics Market Outlook, 2025-2035
- 11.1 Market Size and Analysis
- 11.1.1 Revenue (Market Measurement: 2025: USD 380.0 million → 2035: USD 1.21 billion)
- 11.1.2 Market Volume and Quantity Sold
- 11.1.3 Historical Market Size, 2018-2025
- 11.1.4 Base-Year Market Size, 2025
- 11.2 Market Forecast, 2025-2035
- 11.2.1 Revenue Forecast to 2035
- 11.2.2 Volume Forecast to 2035
- 11.2.3 CAGR and Year-on-Year Growth
- 11.2.4 Incremental Revenue Opportunity
- 11.3 Forecast Assumptions and Scenario Analysis
- 11.3.1 Base-Case Forecast
- 11.3.2 Optimistic and Conservative Scenarios
- 11.3.3 Technology, Pricing and Policy Sensitivities
- 11.4 Market Attractiveness and Growth Outlook
Chapter 12 Nigeria Cold Chain and Pharma Logistics Market Segmentation and Outlook
- 12.1 Segmentation Summary and Market Shares, 2025
- 12.2 Largest and Fastest-Growing Segments
- 12.3 By Service Type - Market Size and Forecast, 2025-2035
- 12.3.1 Segment Definition and Scope
- 12.3.2 Historical Market Size, 2018-2025
- 12.3.3 Revenue Forecast, 2025-2035
- 12.3.4 Volume Forecast, 2025-2035
- 12.3.5 Base-Year Market Share, 2025
- 12.3.6 Segment CAGR and Growth Drivers
- 12.3.7 Subsegment Market Size and Forecast
- 12.3.7.1 Temperature-Controlled Warehousing
- 12.3.7.2 Refrigerated Transport
- 12.3.7.3 Last-Mile Delivery
- 12.3.7.4 Validated Packaging
- 12.3.7.5 Monitoring and Compliance
- 12.3.8 Subsegment Pricing and Adoption Trends
- 12.3.9 Leading Suppliers and Competition
- 12.3.10 Regional Demand and Opportunities
- 12.4 By End-Use Industry - Market Size and Forecast, 2025-2035
- 12.4.1 Segment Definition and Scope
- 12.4.2 Historical Market Size, 2018-2025
- 12.4.3 Revenue Forecast, 2025-2035
- 12.4.4 Volume Forecast, 2025-2035
- 12.4.5 Base-Year Market Share, 2025
- 12.4.6 Segment CAGR and Growth Drivers
- 12.4.7 Subsegment Market Size and Forecast
- 12.4.7.1 Vaccines and Biologics
- 12.4.7.2 Prescription Pharmaceuticals
- 12.4.7.3 Diagnostics and Laboratory Reagents
- 12.4.7.4 Blood and Plasma Products
- 12.4.7.5 Clinical Trial Materials
- 12.4.8 Subsegment Pricing and Adoption Trends
- 12.4.9 Leading Suppliers and Competition
- 12.4.10 Regional Demand and Opportunities
- 12.5 By Customer Type - Market Size and Forecast, 2025-2035
- 12.5.1 Segment Definition and Scope
- 12.5.2 Historical Market Size, 2018-2025
- 12.5.3 Revenue Forecast, 2025-2035
- 12.5.4 Volume Forecast, 2025-2035
- 12.5.5 Base-Year Market Share, 2025
- 12.5.6 Segment CAGR and Growth Drivers
- 12.5.7 Subsegment Market Size and Forecast
- 12.5.7.1 Public Health Agencies
- 12.5.7.2 Distributors and Wholesalers
- 12.5.7.3 Pharmaceutical Manufacturers
- 12.5.7.4 Hospitals and Clinics
- 12.5.7.5 Diagnostic and Research Institutions
- 12.5.8 Subsegment Pricing and Adoption Trends
- 12.5.9 Leading Suppliers and Competition
- 12.5.10 Regional Demand and Opportunities
- 12.6 By Business Model - Market Size and Forecast, 2025-2035
- 12.6.1 Segment Definition and Scope
- 12.6.2 Historical Market Size, 2018-2025
- 12.6.3 Revenue Forecast, 2025-2035
- 12.6.4 Volume Forecast, 2025-2035
- 12.6.5 Base-Year Market Share, 2025
- 12.6.6 Segment CAGR and Growth Drivers
- 12.6.7 Subsegment Market Size and Forecast
- 12.6.7.1 Dedicated Contract Logistics
- 12.6.7.2 Shared-User Third-Party Logistics
- 12.6.7.3 Public-Private Program Logistics
- 12.6.7.4 Pay-Per-Use Cold Storage
- 12.6.7.5 Managed Control Tower
- 12.6.8 Subsegment Pricing and Adoption Trends
- 12.6.9 Leading Suppliers and Competition
- 12.6.10 Regional Demand and Opportunities
- 12.7 Segment Growth Comparison
- 12.8 Segment Attractiveness and Priority Matrix
Chapter 13 Nigeria Cold Chain and Pharma Logistics End-Use and Application Market Outlook
- 13.1 End-Use Industry and Customer Demand Structure
- 13.2 Leading Applications and Customer Groups
- 13.3 End-Use Market Size, Share and Forecast
- 13.4 Major End-Use Industry Deep Dives
- 13.4.1 Customer Requirements and Use Cases
- 13.4.2 Demand and Replacement Cycles
- 13.4.3 Technical and Regulatory Considerations
- 13.4.4 Purchasing and Procurement Models
- 13.4.5 Leading Vendors and Distribution Channels
- 13.4.6 Forecast and Commercial Opportunities
- 13.5 Emerging Applications and Cross-Segment Demand
- 13.6 End-Use Industry Investment Priorities
Chapter 14 Nigeria Cold Chain and Pharma Logistics Geographic Market Outlook, 2025-2035
- 14.1 Domestic Market Distribution and Demand Clusters
- 14.2 State- or Province-Wise Market Size and Forecast, 2025-2035
- 14.3 City and Metropolitan Market Outlook
- 14.4 Industrial, Manufacturing and Commercial Clusters
- 14.5 Geographic Concentration of Key End Users
- 14.6 Local Pricing and Purchasing Differences
- 14.7 Domestic Production Facilities and Capacity Map
- 14.8 Local Infrastructure and Project Pipeline
- 14.9 State-Level Policy and Incentive Differences
- 14.10 Subnational Investment Hotspots and Opportunities
- 14.11 Distribution and Logistics Networks
- 14.12 Domestic Competitive Footprint
Chapter 15 Nigeria Cold Chain and Pharma Logistics Technology, Innovation and Sustainability Outlook
- 15.1 Technology Landscape and Maturity
- 15.2 Product, Process and Service Innovation
- 15.3 AI, Automation and Digital Tools in the Industry
- 15.4 Technology Adoption and Performance Benchmarking
- 15.5 Innovation Pipeline and R&D Investment
- 15.6 Patent and Intellectual Property Trends
- 15.7 Energy Efficiency and Resource Management
- 15.8 Sustainability, Recycling and Circularity
- 15.9 Technology Roadmap, 2025-2035
- 15.10 Risks of Obsolescence and Technology Substitution
Chapter 16 Nigeria Cold Chain and Pharma Logistics Market Key Strategic Imperatives
- 16.1 Growth and Market Entry Priorities
- 16.2 High-Return Products and Segments
- 16.3 Pricing, Profitability and Cost Optimization
- 16.4 Technology Investment and Product Differentiation
- 16.5 Supply Chain Localization and Resilience
- 16.6 Distribution and Customer Acquisition
- 16.7 Partnership, Acquisition and Capacity Strategy
- 16.8 Regional Expansion Priorities
- 16.9 Short-, Medium- and Long-Term Actions
Chapter 17 Competition Outlook
- 17.1 Industry Competition Characteristics
- 17.2 Market Structure and Concentration
- 17.3 Market Share and Competitive Positioning, 2025
- 17.4 Company-Wise Revenue and Product Benchmarking
- 17.5 Production and Service Capacity Benchmarking
- 17.6 Technology, Pricing and Differentiation
- 17.7 Regional Footprint and Distribution Strength
- 17.8 Mergers, Acquisitions and Strategic Alliances
- 17.9 New Entrants and Competitive Threats
- 17.10 Porter's Five Forces and Industry Attractiveness
- 17.11 Competitive Outlook, 2025-2035
Chapter 18 Company Profiles
- 18.1 Company Coverage and Selection Criteria
- 18.2 MDS Logistics
- 18.2.1 Business Description
- 18.2.2 Company Ownership and Geographic Presence
- 18.2.3 Product and Service Portfolio
- 18.2.4 Manufacturing and Operating Footprint
- 18.2.5 Production Capacity and Expansion Plans
- 18.2.6 Financial Performance and Investment
- 18.2.7 Market Share and Competitive Position
- 18.2.8 Technology and Innovation Capabilities
- 18.2.9 Strategic Alliances or Partnerships
- 18.2.10 Recent Developments
- 18.2.11 Growth Strategy and Outlook
- 18.3 DHL Supply Chain Nigeria
- 18.4 Kuehne + Nagel Nigeria
- 18.5 Maersk Nigeria
- 18.6 Zenith Carex International
- 18.7 GAC Nigeria
- 18.8 Red Star Express Plc
- 18.9 Cold Chain Solutions Nigeria
- 18.10 Cargoburg Nigeria
- 18.11 SIFAX Group
- 18.12 Other Relevant Market Participants
Note: Every listed company is profiled on the structure shown under the first company. The company list is preliminary and may change based on research findings, market developments, data availability and client requirements.
Chapter 19 Disclaimer
- 19.1 Research and Forecast Disclaimer
- 19.2 Data Source and Estimation Limitations
Note: The depth of individual sections depends on data availability for this market. Volume, capacity, trade and other unit-based metrics are included where applicable.

