
Public cover and private beds reshape Indian care
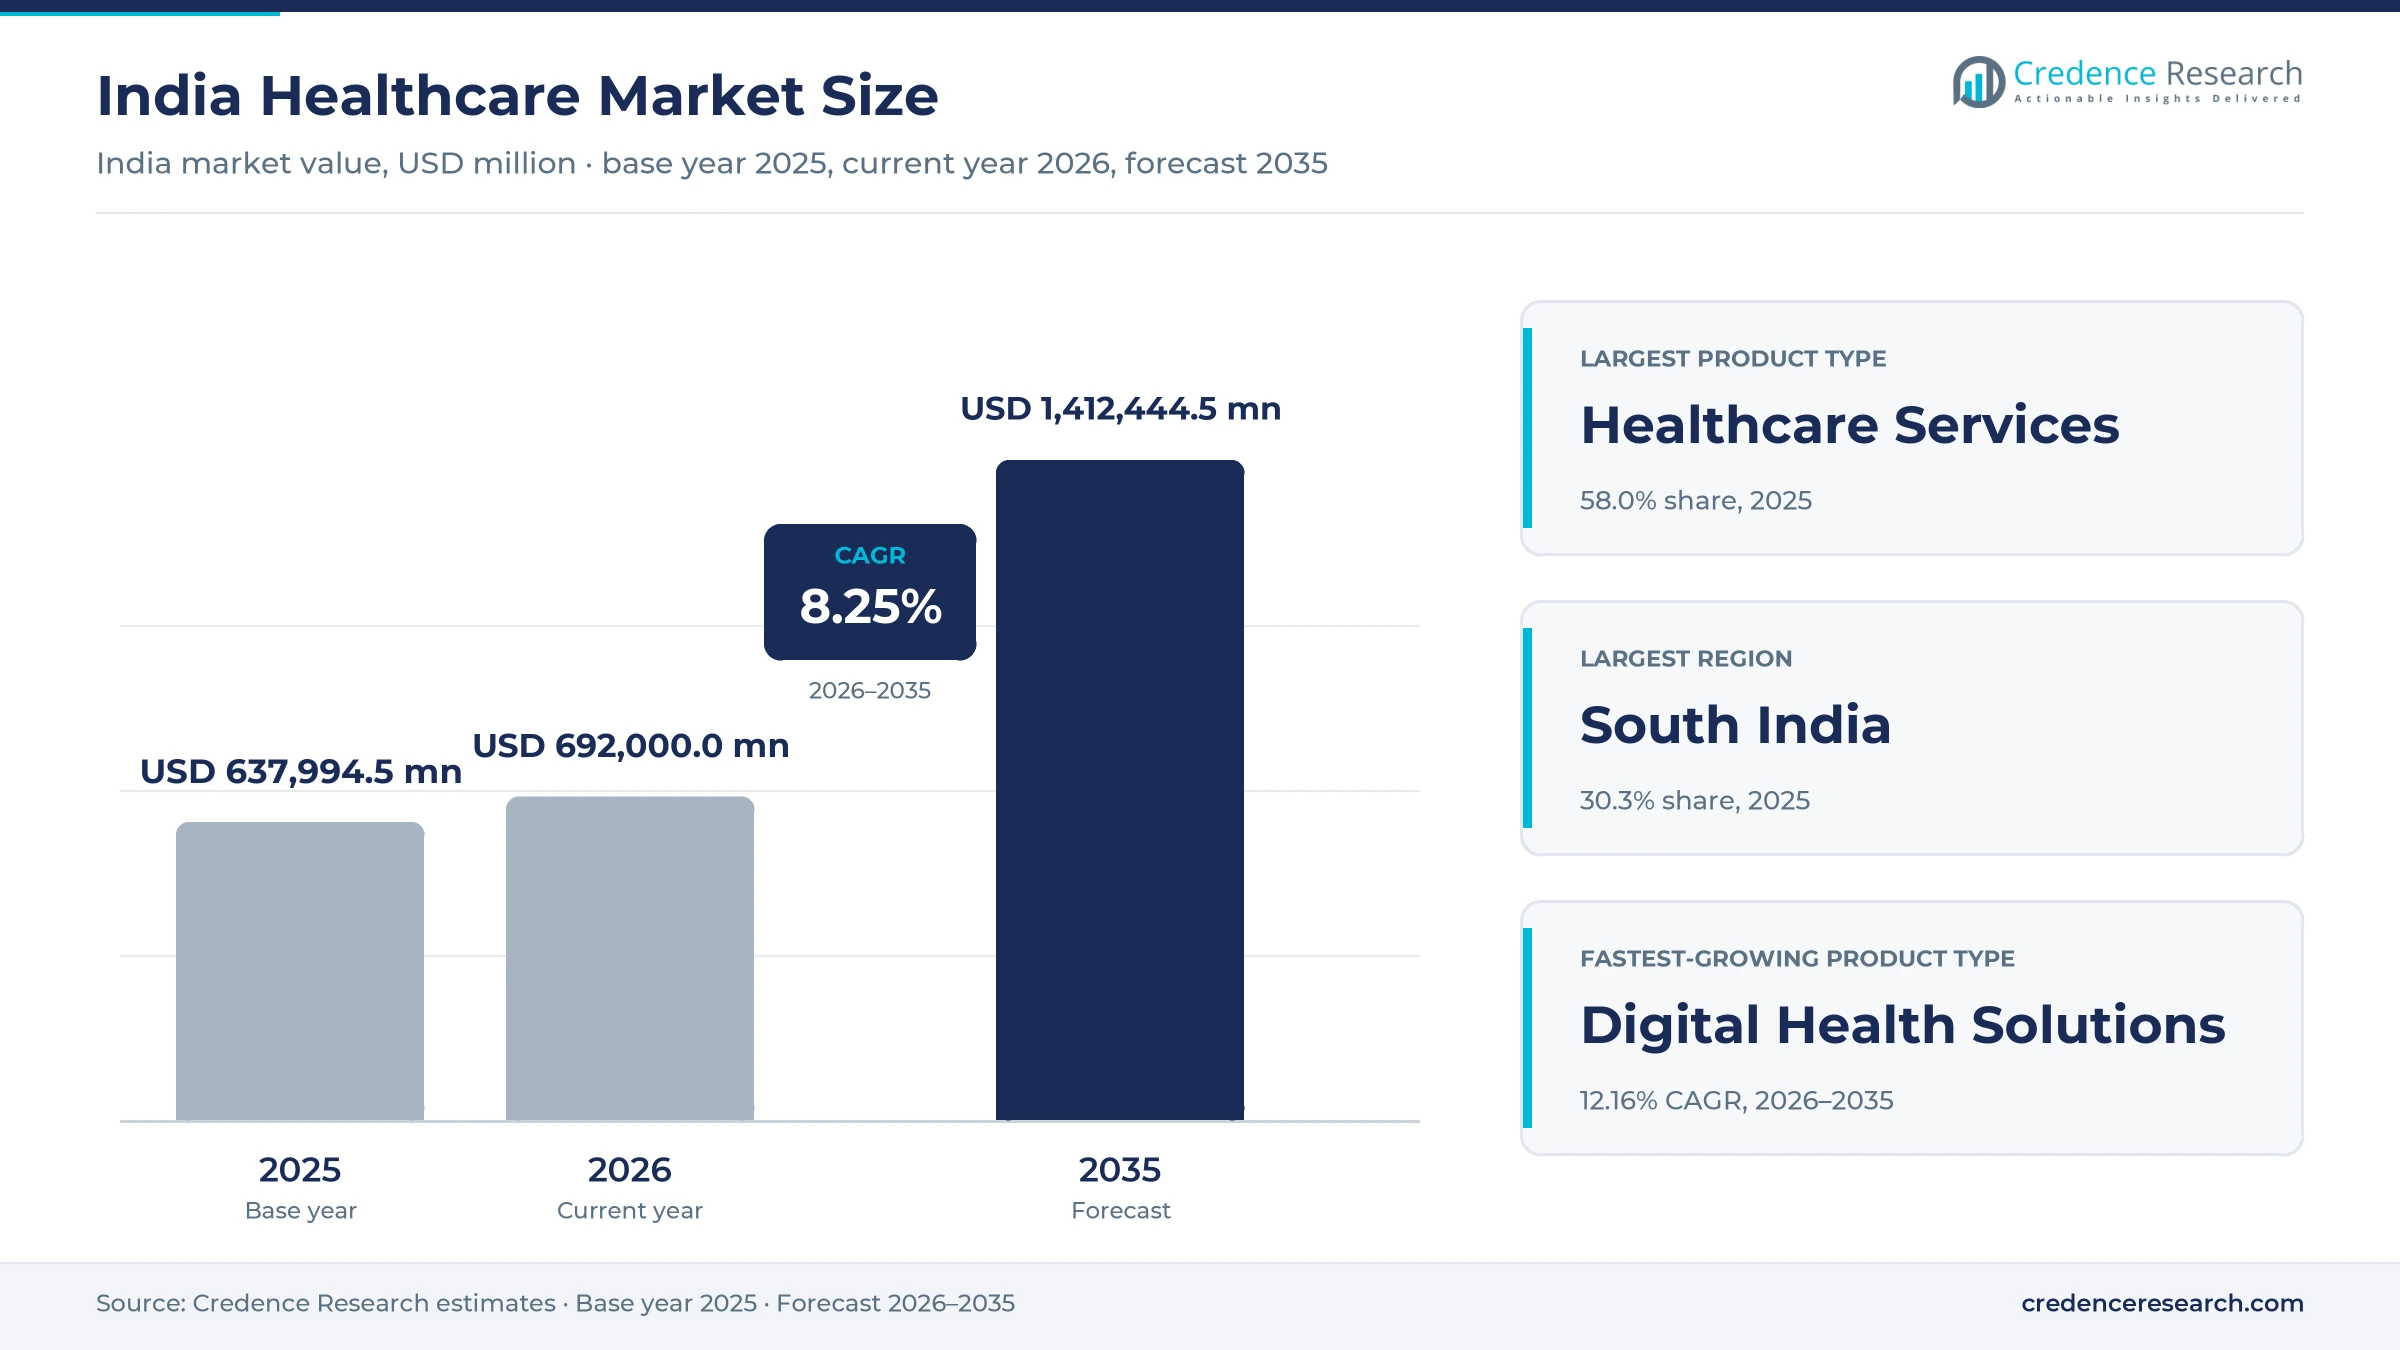
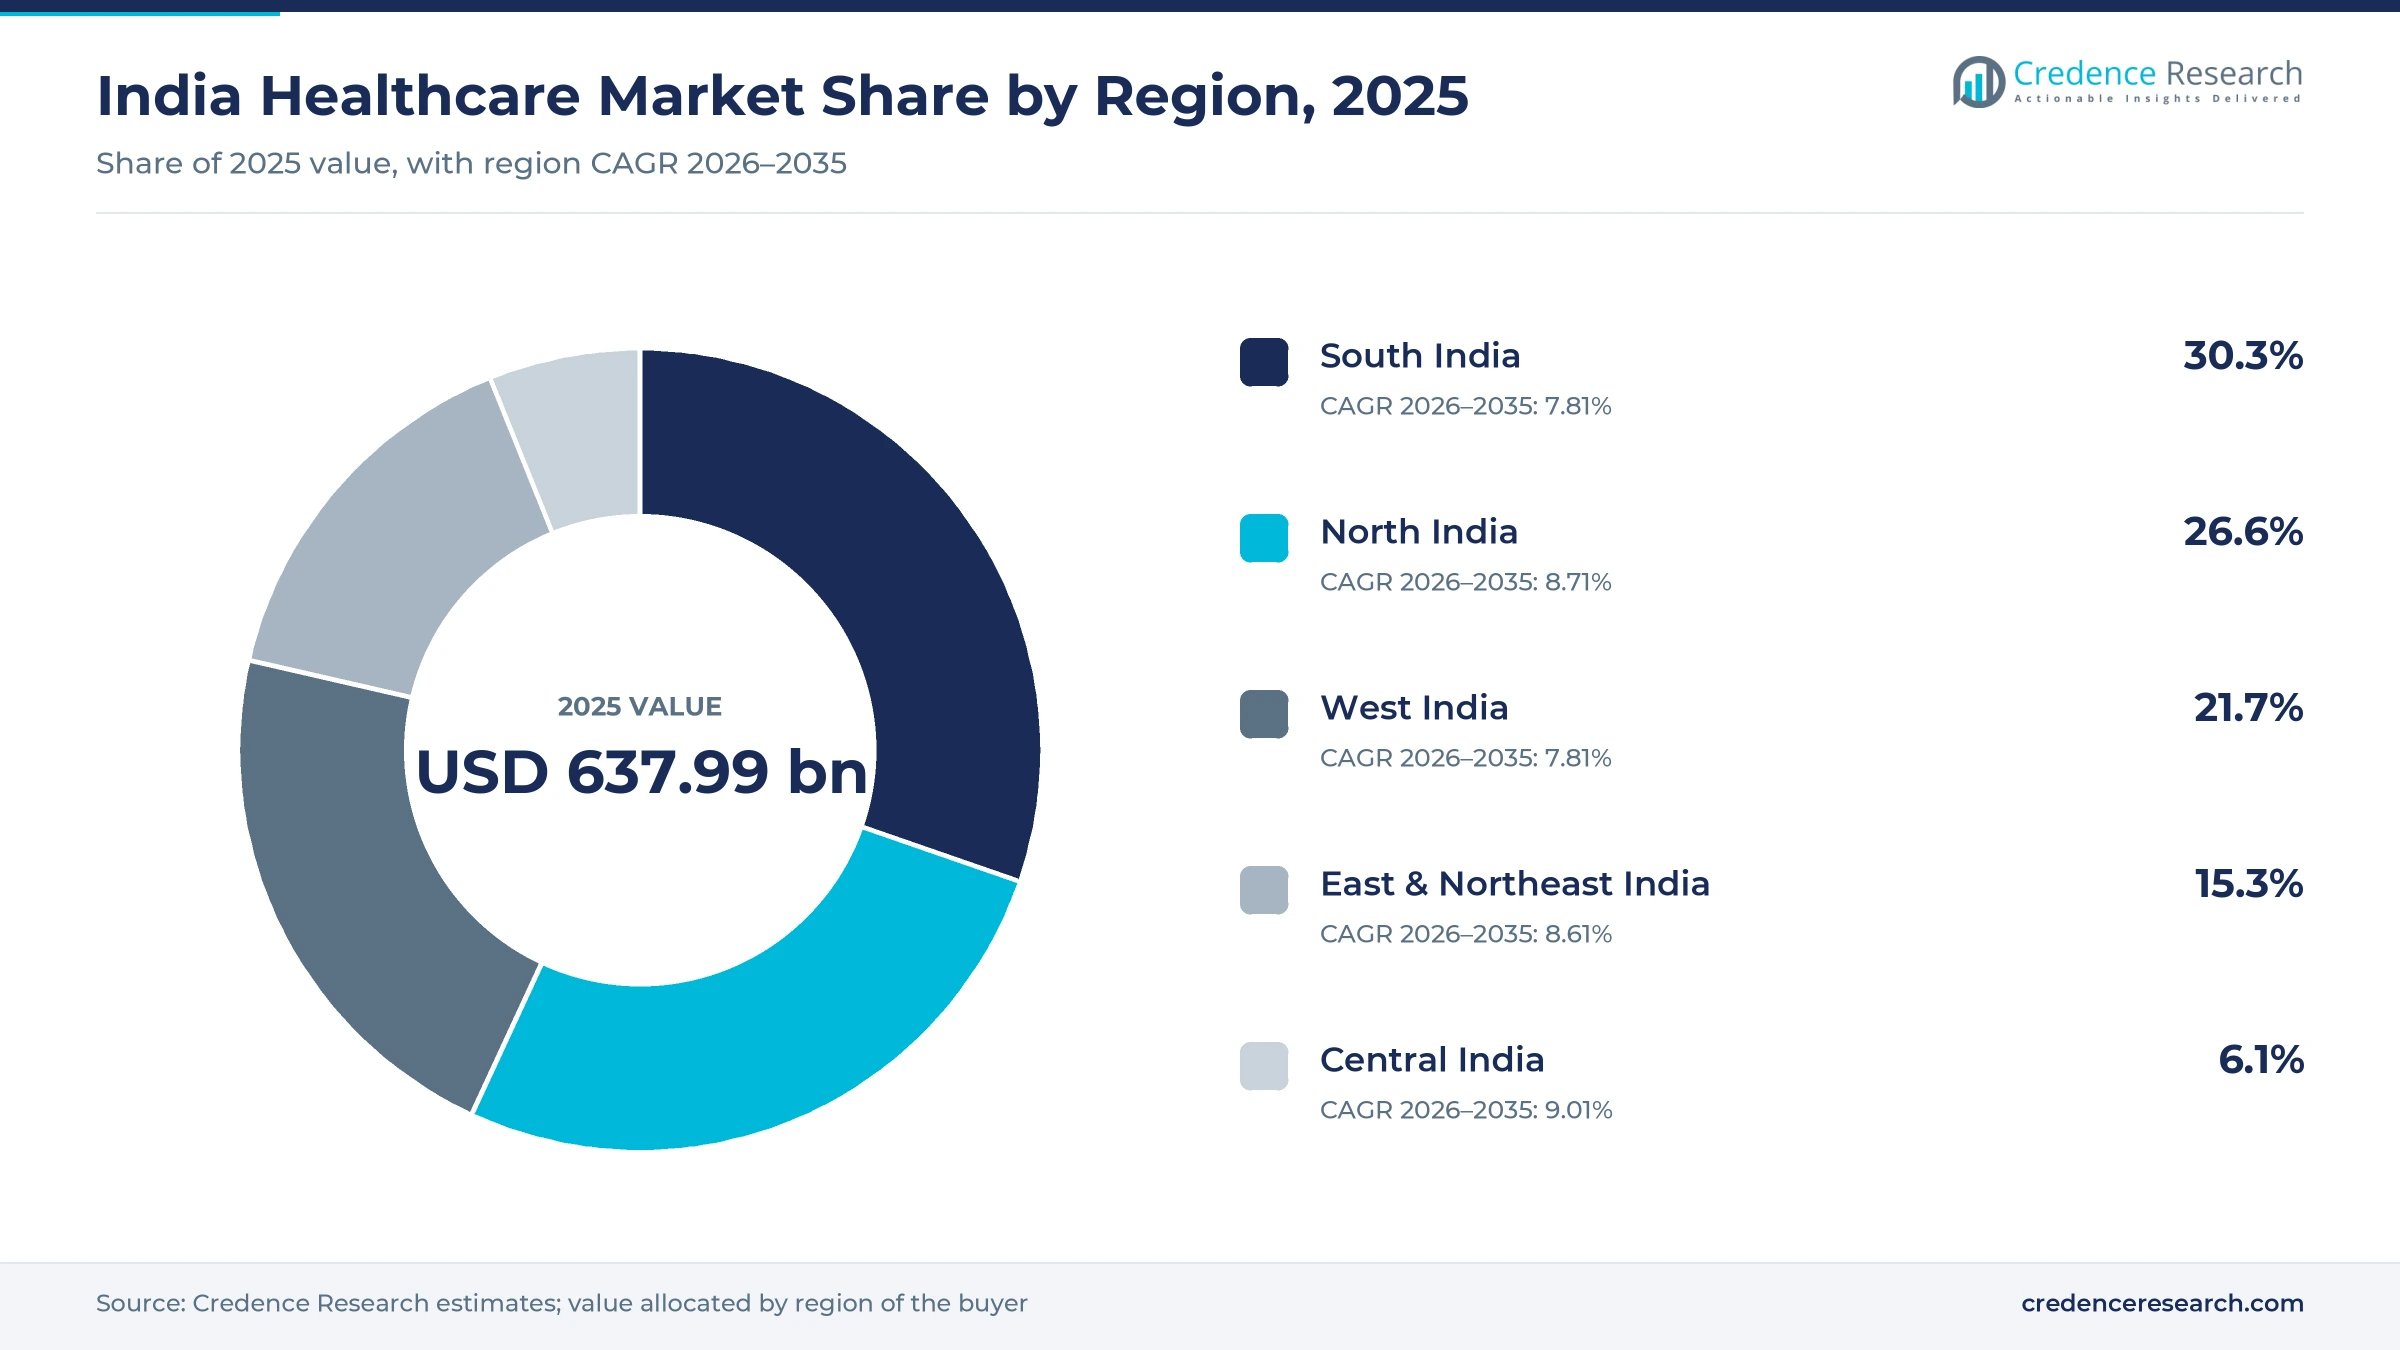
The India healthcare market was valued at USD 637.99 billion in 2025 and is projected to increase from USD 692.00 billion in 2026 to USD 1,412.44 billion by 2035, registering a CAGR of 8.25% during 2026–2035. Demand comes from public hospital cover, a chronic disease load that includes 101 million people with diabetes, and private bed additions planned across smaller cities. South India held the largest regional share, 30.3% in 2025, supported by its dense medical college and multispecialty hospital base. Central India is the fastest-growing region at 9.01% a year, starting from the lowest share among the five zones. The most important commercial change is consolidation, as Manipal, Aster and Max have all bought or merged hospital groups since mid-2025. In parallel, the Ayushman Bharat Digital Mission has moved records for most of the population onto shared national registries, which changes how providers and payers exchange clinical data.
What does the India healthcare market include, and who pays for it?
The market counts hospital and clinic services, medicines, diagnostic testing, medical devices and digital health platforms sold or delivered in India. Buyers are households paying directly, central and state insurance schemes, private insurers and third-party administrators, employers and patients traveling from abroad. Purchases run through public facilities, corporate hospital networks, retail pharmacy and laboratory chains, and online platforms.
The value is a Credence Research model estimate across those five product groups and is not derived from National Health Accounts data. Traditional wellness products sold without clinical purpose and veterinary care sit outside the estimate.
India Healthcare Market Insights
- The market stood at USD 637.99 billion in 2025 and is projected to reach USD 1,412.44 billion by 2035, an 8.25% CAGR across 2026–2035.
- South India held the largest regional share at 30.3% in 2025, while Central India grows fastest at 9.01% a year from a small base.
- Healthcare Services held 58.0% of 2025 value, and Acute-Care Hospitals accounted for 52.0% of value by care setting.
- The National Statistics Office found in April 2026 that insurance cover reached 47.4% of rural residents in 2025, up from 14.1% in 2017-18, mostly through government schemes.
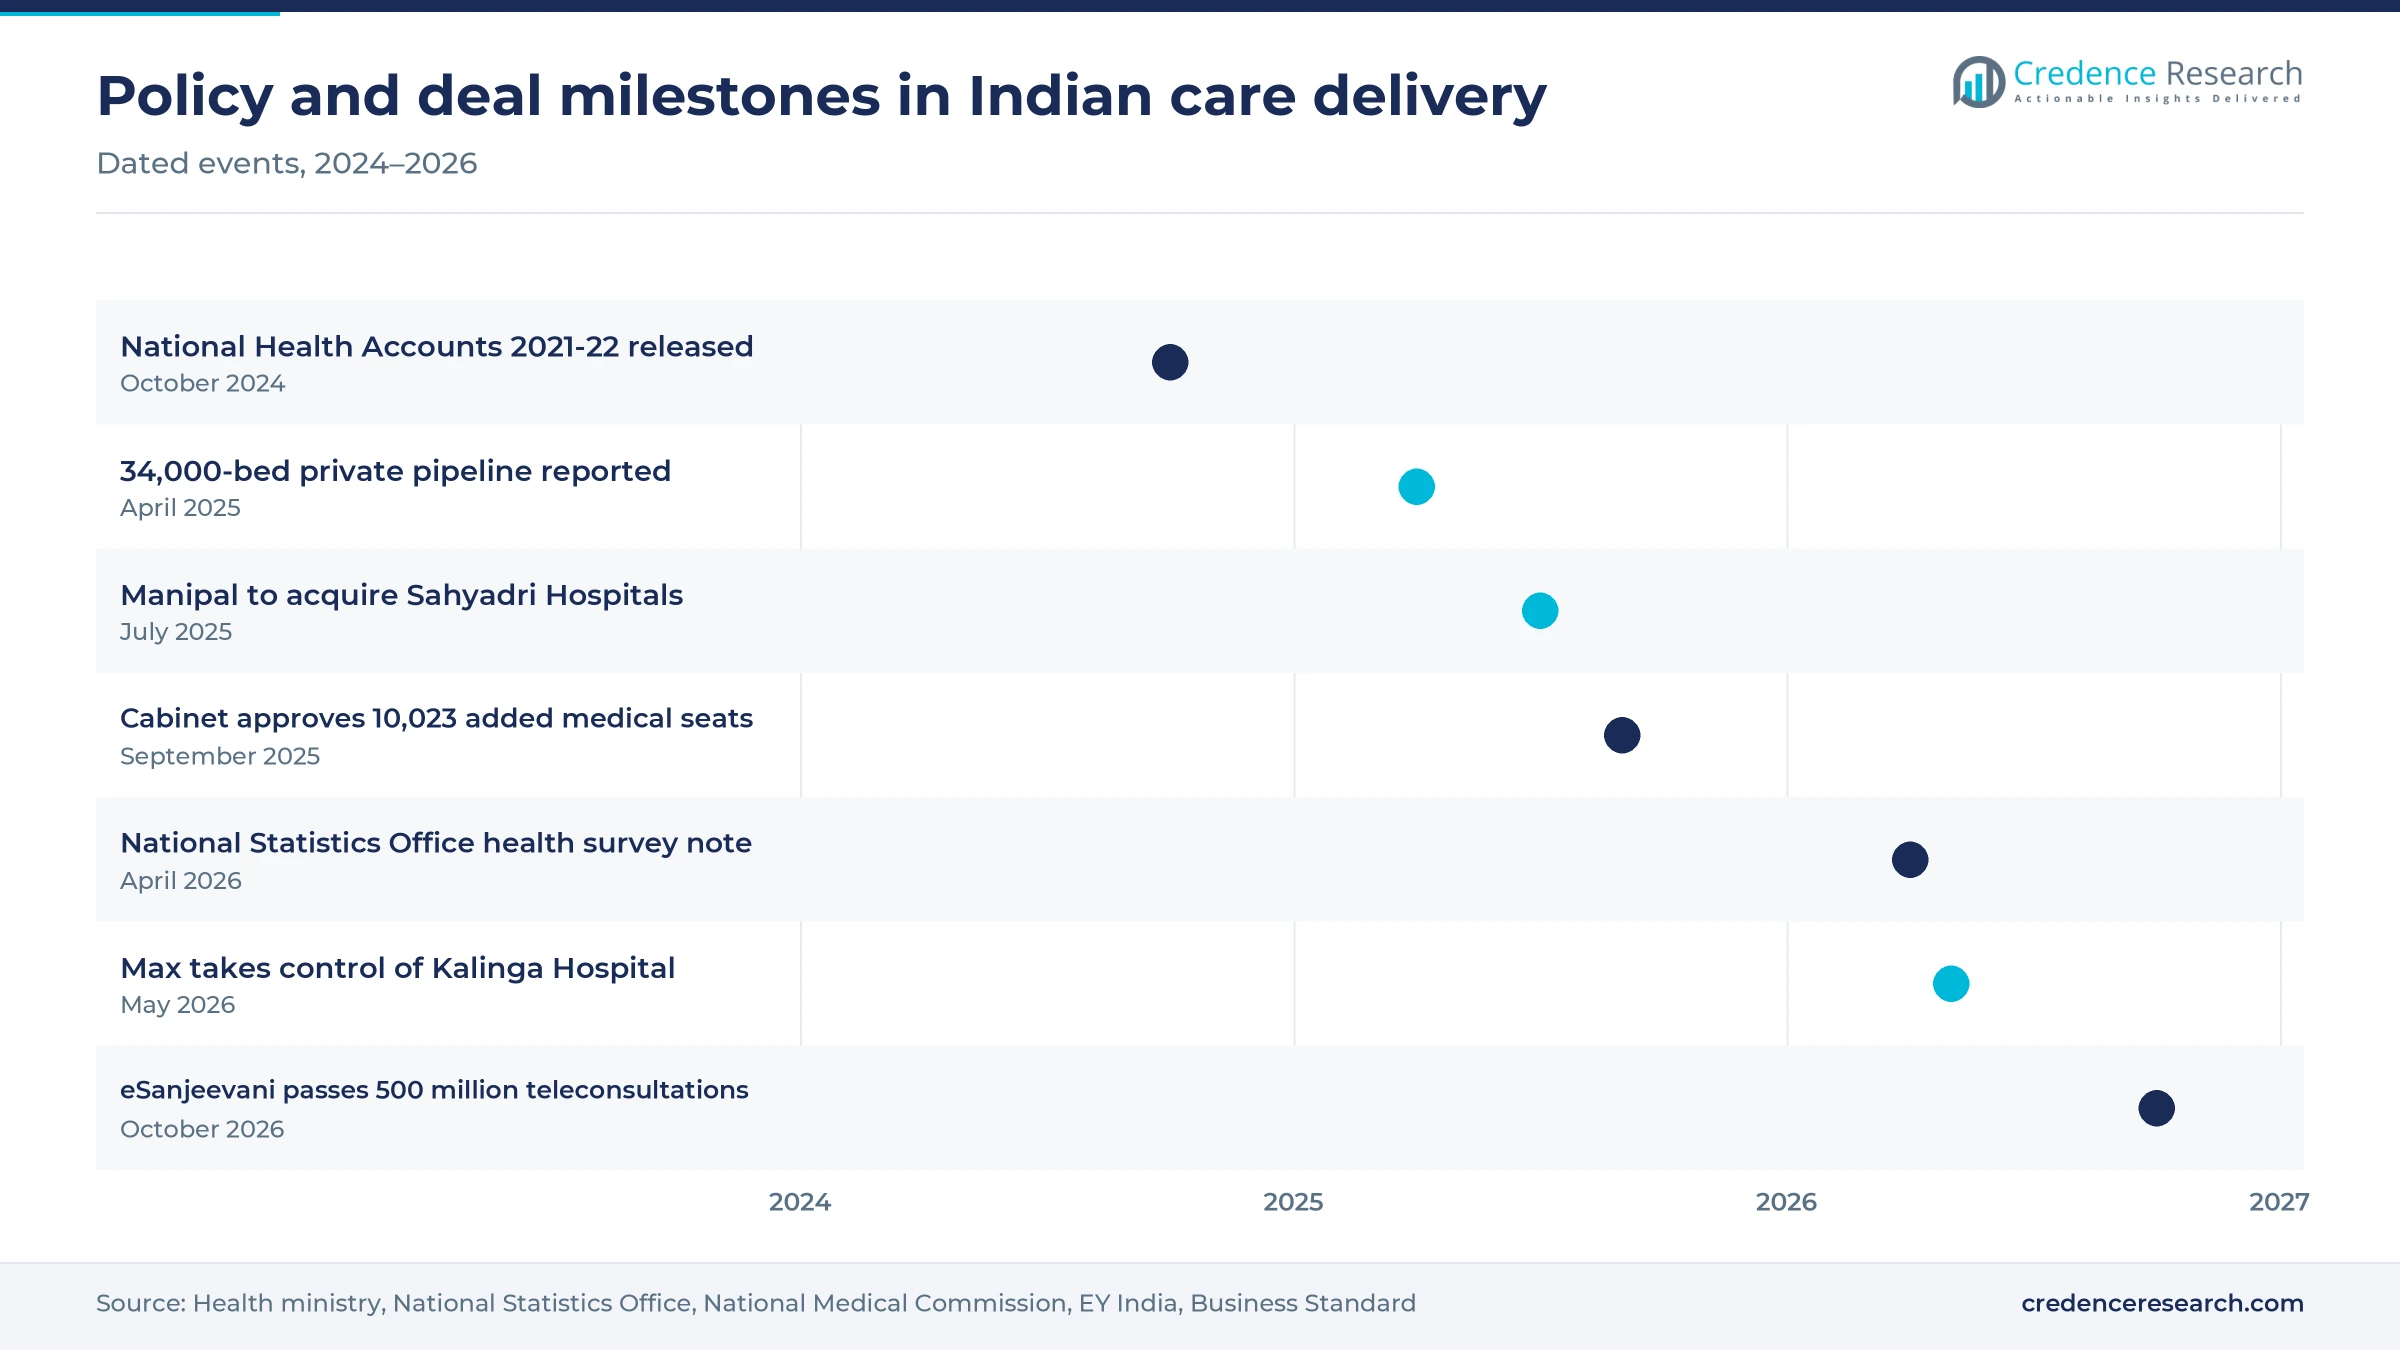
- Listed chains are buying capacity, with Manipal agreeing to acquire Sahyadri Hospitals in July 2025 and Max taking control of Kalinga Hospital in May 2026.
Services and hospitals carry most of the spending
Why do services outweigh medicines and devices?
Based on product type, the market is categorized into Healthcare Services, Pharmaceuticals & Therapeutics, Diagnostics & Laboratory Services, Medical Devices & Equipment, and Digital Health Solutions. Healthcare Services led with 58.0% of 2025 value because inpatient bills dominate spending, and the National Statistics Office recorded an average private hospitalization cost of Rs 50,508 per case in 2025. Digital Health Solutions grows fastest at 12.16% a year as adoption moves from registration to daily use. Indian Pharma Post reported in July 2026 that 272,000 facilities had adopted software enabled by the national digital mission, which creates a paying base for vendors.
Where does care move as hospitals stay dominant?
Based on care setting, the market is categorized into Acute-Care Hospitals, Ambulatory & Day-Care Centers, Primary & Community Care, Home Healthcare and Diagnostic Centers. Acute-Care Hospitals led with 52.0% of 2025 value because public cover pays mainly for admissions, and Organiser reported about 132.5 million admissions funded under PM-JAY by September 2026. Home Healthcare grows fastest at 10.20% a year as older patients need long-term support, with the National Statistics Office recording hospitalization rates of 9.3% for men and 6.9% for women aged 60 and above. Apollo HomeCare now sells and services respiratory equipment across six metropolitan areas, according to Indian Pharma Post in October 2026.
Who pays as insurance spreads beyond households?
Based on end user, the market is categorized into Individual Patients, Government Health Programs, Private Insurers & TPAs, Employers & Corporate Health Programs, and International Patients. Individual Patients led with 44.0% of 2025 value because direct payment stays large, with National Health Accounts 2021-22 placing out-of-pocket spending at 39.4% of total health expenditure. Private Insurers & TPAs grows fastest at 10.10% a year as retail and group policies expand. The India Brand Equity Foundation reports that health insurance premiums rose from Rs 118,688 crore in fiscal 2025 to Rs 137,144 crore in fiscal 2026, a gain of about 15.6% in one year.
Which conditions generate the steadiest clinical volume?
Based on disease area, the market is categorized into Cardiovascular & Metabolic Care, Oncology, Maternal & Child Health, Infectious Disease Care and Orthopedics & Neurology. Cardiovascular & Metabolic Care led with 36.0% of 2025 value because chronic patients need lifelong treatment, and an Indian Council of Medical Research study published in June 2023 counted 101 million people with diabetes and 315 million with hypertension. Oncology grows fastest at 10.32% a year as case numbers climb. National Cancer Registry Programme data shared with Parliament put estimated cases near 1.57 million in 2025, compared with about 1.43 million in 2021, according to ThePrint.
| Segment Group | Leading Sub-segment | Share, 2025 | Fastest-growing Sub-segment | CAGR, 2026–2035 |
|---|---|---|---|---|
| By Product Type | Healthcare Services | 58.0% | Digital Health Solutions | 12.16% |
| By Care Setting | Acute-Care Hospitals | 52.0% | Home Healthcare | 10.20% |
| By End User | Individual Patients | 44.0% | Private Insurers & TPAs | 10.10% |
| By Disease Area | Cardiovascular & Metabolic Care | 36.0% | Oncology | 10.32% |
Request a Free Sample
Fill in your details and we'll send you a free sample report.
- Sample data tables & charts
- Research methodology
Financing, digital rails and clinicians lift volumes
Expansion of public financing and hospital access
Public financing is turning unmet need into paid admissions, which gives hospitals a larger and more predictable patient base. Organiser reported in September 2026 that PM-JAY had issued more than 485 million cards and funded about 132.5 million admissions, worth roughly Rs 2.03 lakh crore by Aug. 31, 2026. The scheme now covers 1,961 procedures across 27 specialties at more than 38,000 empanelled hospitals. Budget support has followed, because the fiscal 2027 allocation of Rs 106,530 crore to the health ministry is about 10% above the prior revised estimate. Senior cover extends the effect, with more than 13.6 million Vay Vandana cards issued to people aged 70 and above by Sept. 21, 2026.
Digital public infrastructure at national scale
Shared digital rails lower the cost of registering, referring and treating patients, which widens the reach of both public and private providers. Indian Pharma Post reported in July 2026 that the Ayushman Bharat Digital Mission had created 939.5 million health accounts and linked more than 1.05 billion records. The same report counted 533,000 registered facilities, 985,000 registered professionals and nearly 240 million scan-and-register tokens, which shorten outpatient queues. Remote care is also established, because eSanjeevani passed 500 million teleconsultations in October 2026 and now handles 250,000 to 300,000 sessions a day. As a result, Digital Health Solutions grows at 12.16% a year, the fastest rate among product groups.
Expanding clinical workforce and training capacity
More trained clinicians directly raise the volume of care the system can deliver, particularly in districts that have lacked doctors. The National Medical Commission seat matrix for 2026-27 lists 140,664 MBBS seats across 839 colleges, including 41 newly established colleges with 3,850 seats. Further capacity is funded, because the Union Cabinet approved 5,023 MBBS and 5,000 postgraduate seats on Sept. 24, 2025, with Rs 15,035 crore sanctioned for completion by 2028-29, according to Deccan Herald. The India Brand Equity Foundation counts 1,388,185 registered allopathic doctors in March 2026 and 3.94 million nursing personnel. Private colleges hold 76,543 of the current seats, which ties workforce growth to private teaching hospitals as well as government institutions.
Private capital adding beds outside the largest metros
Private capital is the fourth driver, because new beds create supply in cities where patients previously traveled for complex care. Business Standard reported in April 2025 that private operators plan more than 34,000 new beds by fiscal 2029, at a capital outlay above Rs 40,000 crore. About 38% to 40% of that capacity, or roughly 14,000 beds, is aimed at Tier-2 and Tier-3 cities. Company plans confirm the direction, as EY India reported in July 2026 that the combined Aster DM Healthcare and Quality Care platform plans about 4,445 more beds and Narayana Hrudayalaya plans to pass 7,600 beds by fiscal 2030. This pipeline supports Acute-Care Hospitals, which held 52.0% of 2025 value.
Consolidation and insurance are changing who pays
Hospital consolidation shifts toward regional networks
Hospital ownership is shifting from single-city groups toward multi-state networks, which gives acquirers purchasing and payer leverage. Manipal Health Enterprises agreed on July 9, 2025, to acquire Sahyadri Hospitals in Maharashtra for Rs 6,000 crore, according to the India Brand Equity Foundation. EY India reported that Aster DM Healthcare shareholders approved a merger with Quality Care India, creating a 39-hospital network with about 10,600 beds. Max Healthcare then took control of the 250-bed Kalinga Hospital in Bhubaneswar in May 2026, adding a site in eastern India. Smaller listed groups follow the same logic, as Yatharth Hospital integrated the 250-bed Shantived Hospitals in Agra from February 2026 after paying Rs 260 crore.
Rising insured demand changes who settles the bill
The payer mix is shifting from households toward insurers and government schemes, which changes how hospitals price and how they collect. The National Statistics Office press note of April 2026 found that 47.4% of rural residents and 44.3% of urban residents held at least one health cover in 2025. Those shares were 14.1% and 19.1% in 2017-18, showing the speed of the change. Public programs account for most enrollment, while private premiums reached Rs 137,144 crore in fiscal 2026, according to the India Brand Equity Foundation. National Health Accounts data released in 2024 already showed government spending at 48% of total health expenditure in 2021-22, ahead of the out-of-pocket share.
Opportunity in Tier-2 specialty hospitals
Specialty hospitals in smaller cities offer an opening, because complex care remains scarce outside the largest metropolitan areas. Business Standard reported that about 14,000 planned private beds target Tier-2 and Tier-3 cities, which indicates where operators see unmet demand. Global Health plans 400-bed hospitals in Varanasi and Guwahati, with Varanasi approved in March 2026, according to EY India. HealthCare Global Enterprises plans more than 200 beds across Cuttack, Ranchi, Vizag, Bhavnagar and Bangalore over 24 months. Rainbow Children's Medicare has about 900 pediatric beds under execution across five cities, including Coimbatore and Indore. Operators with single-specialty protocols can therefore enter with smaller capital outlays than a full multispecialty campus would need.
Opportunity in inbound patients and local device supply
Inbound patients and local device manufacturing offer two further openings, and both bring revenue that does not depend on domestic insurance. The India Brand Equity Foundation records 507,244 foreign nationals arriving for treatment in 2025, a base that supports accredited metro hospitals and cross-border treatment packages. On supply, India Briefing reported that the production-linked incentive scheme had commissioned 22 greenfield plants making more than 55 devices. The scheme recorded exports of about Rs 5,869 crore by September 2025, while IANS reported cumulative device sales under it of Rs 29,402 crore in June 2026. Makers of diagnostic equipment and implants can therefore supply hospital pipelines from local plants instead of relying entirely on imports.
Specialists, bills and bed density limit the expansion
Rural specialist vacancies limit clinical reach
Rural specialist supply remains the sharpest constraint on access to care. Health Dynamics of India 2022-23 showed a shortfall of 17,551 specialists at rural community health centers in March 2023, or 79.9% of required posts, as reported by ThePrint. Madhya Pradesh reached 94%, which leaves patients traveling to district cities and private hospitals for routine surgery. New medical seats will ease this only slowly, so teleconsultation links through public platforms are the practical mitigation for several years.
Private hospital bills strain insured and uninsured patients
Hospital costs remain high despite wider cover, because many policies and schemes leave part of the bill unpaid. The National Statistics Office recorded average out-of-pocket hospitalization costs of Rs 50,508 per case in private hospitals in 2025, against Rs 6,631 in public facilities. This gap affects middle-income families most, since they often fall outside targeted schemes. Consequently, price scrutiny is rising, and providers are responding with packaged procedures, day-care formats and low-cost generic supply through more than 19,200 Jan Aushadhi Kendras reported by IANS in June 2026.
Low bed density leaves capacity uneven
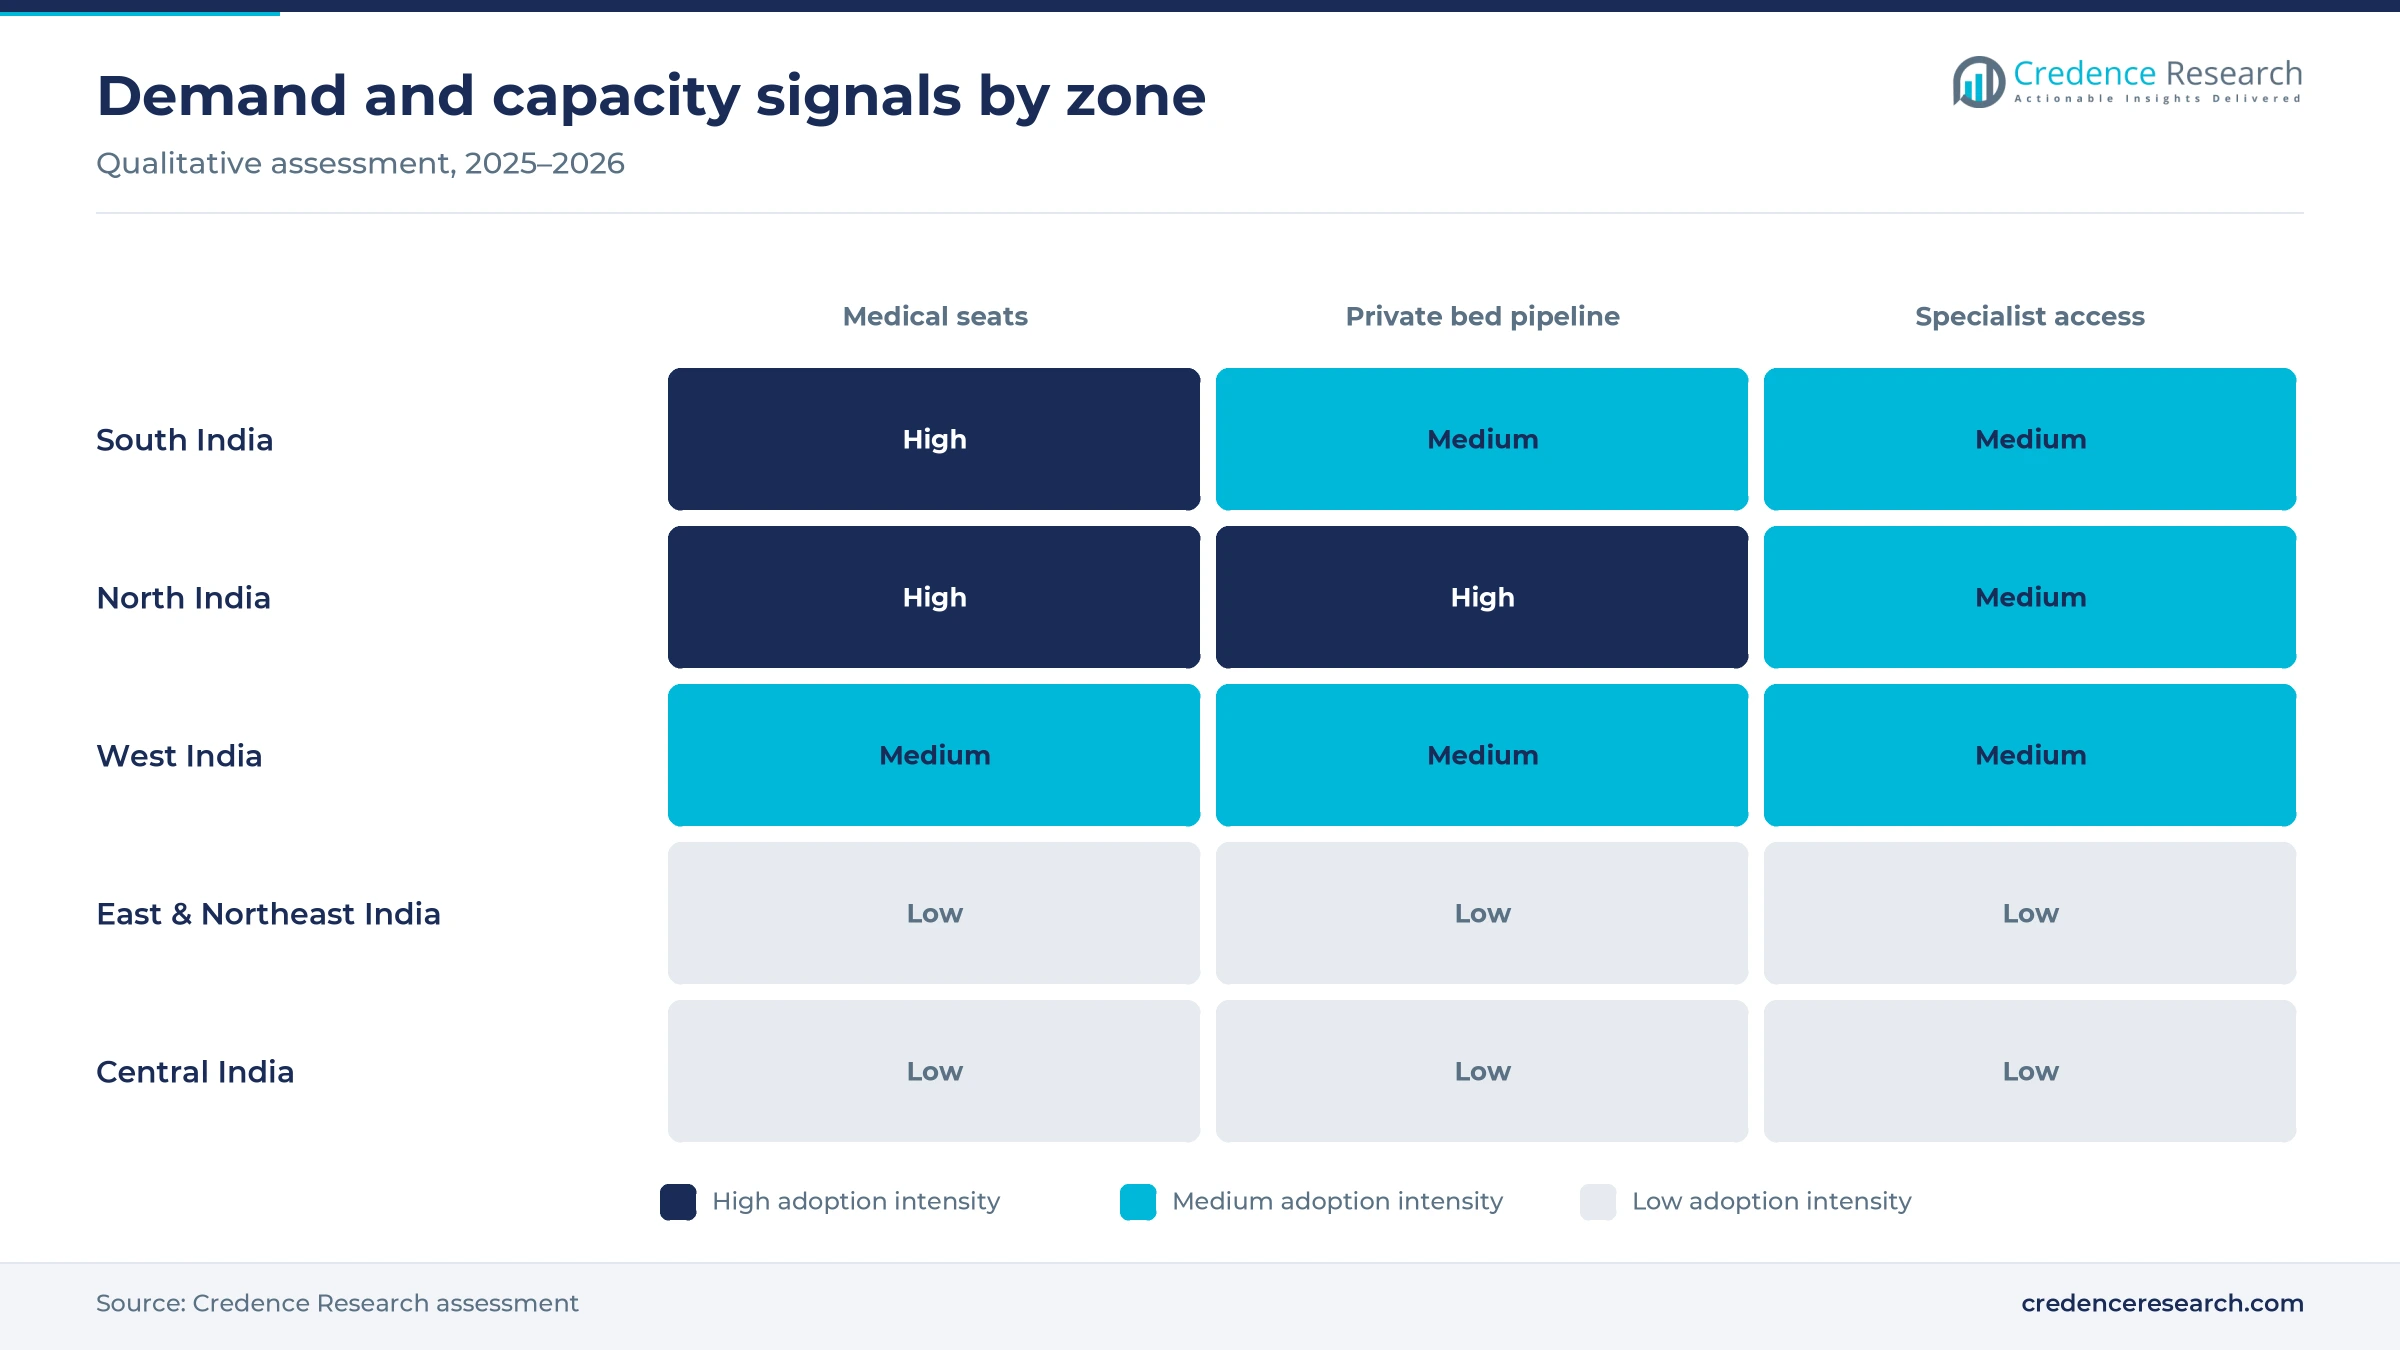
Bed supply is thin and unevenly placed, which limits how far demand can convert into treatment. India has about 13 beds per 10,000 people, compared with a global median of 29 beds, according to the India Brand Equity Foundation. In addition, Business Standard reported in April 2025 that about 46% of planned private beds were in the North and only about 11% in the East and Central zones. Eastern and central patients therefore continue to travel, although public medical college expansion and targeted acquisitions may narrow part of the gap.
New bed additions weigh on hospital margins
Rapid expansion carries a near-term financial cost, because new beds take time to fill while staff and depreciation start immediately. Asianet Newsable reported on June 6, 2026, that a Kotak Securities review found most listed hospitals raised operational beds 5% to 21% year on year and described margins as rangebound. This pressure affects chains building several sites at once, and it can delay later phases. Operators are mitigating it by favoring brownfield additions, with Fortis Healthcare adding about 800 such beds in fiscal 2026, according to EY India.
South India leads as northern bed pipelines grow
| Region | Value, 2025 (USD billion) | Share, 2025 | CAGR, 2026–2035 |
|---|---|---|---|
| South India | 193.31 | 30.3% | 7.81% |
| North India | 169.71 | 26.6% | 8.71% |
| West India | 138.44 | 21.7% | 7.81% |
| East & Northeast India | 97.61 | 15.3% | 8.61% |
| Central India | 38.92 | 6.1% | 9.01% |
South India keeps the lead on teaching capacity
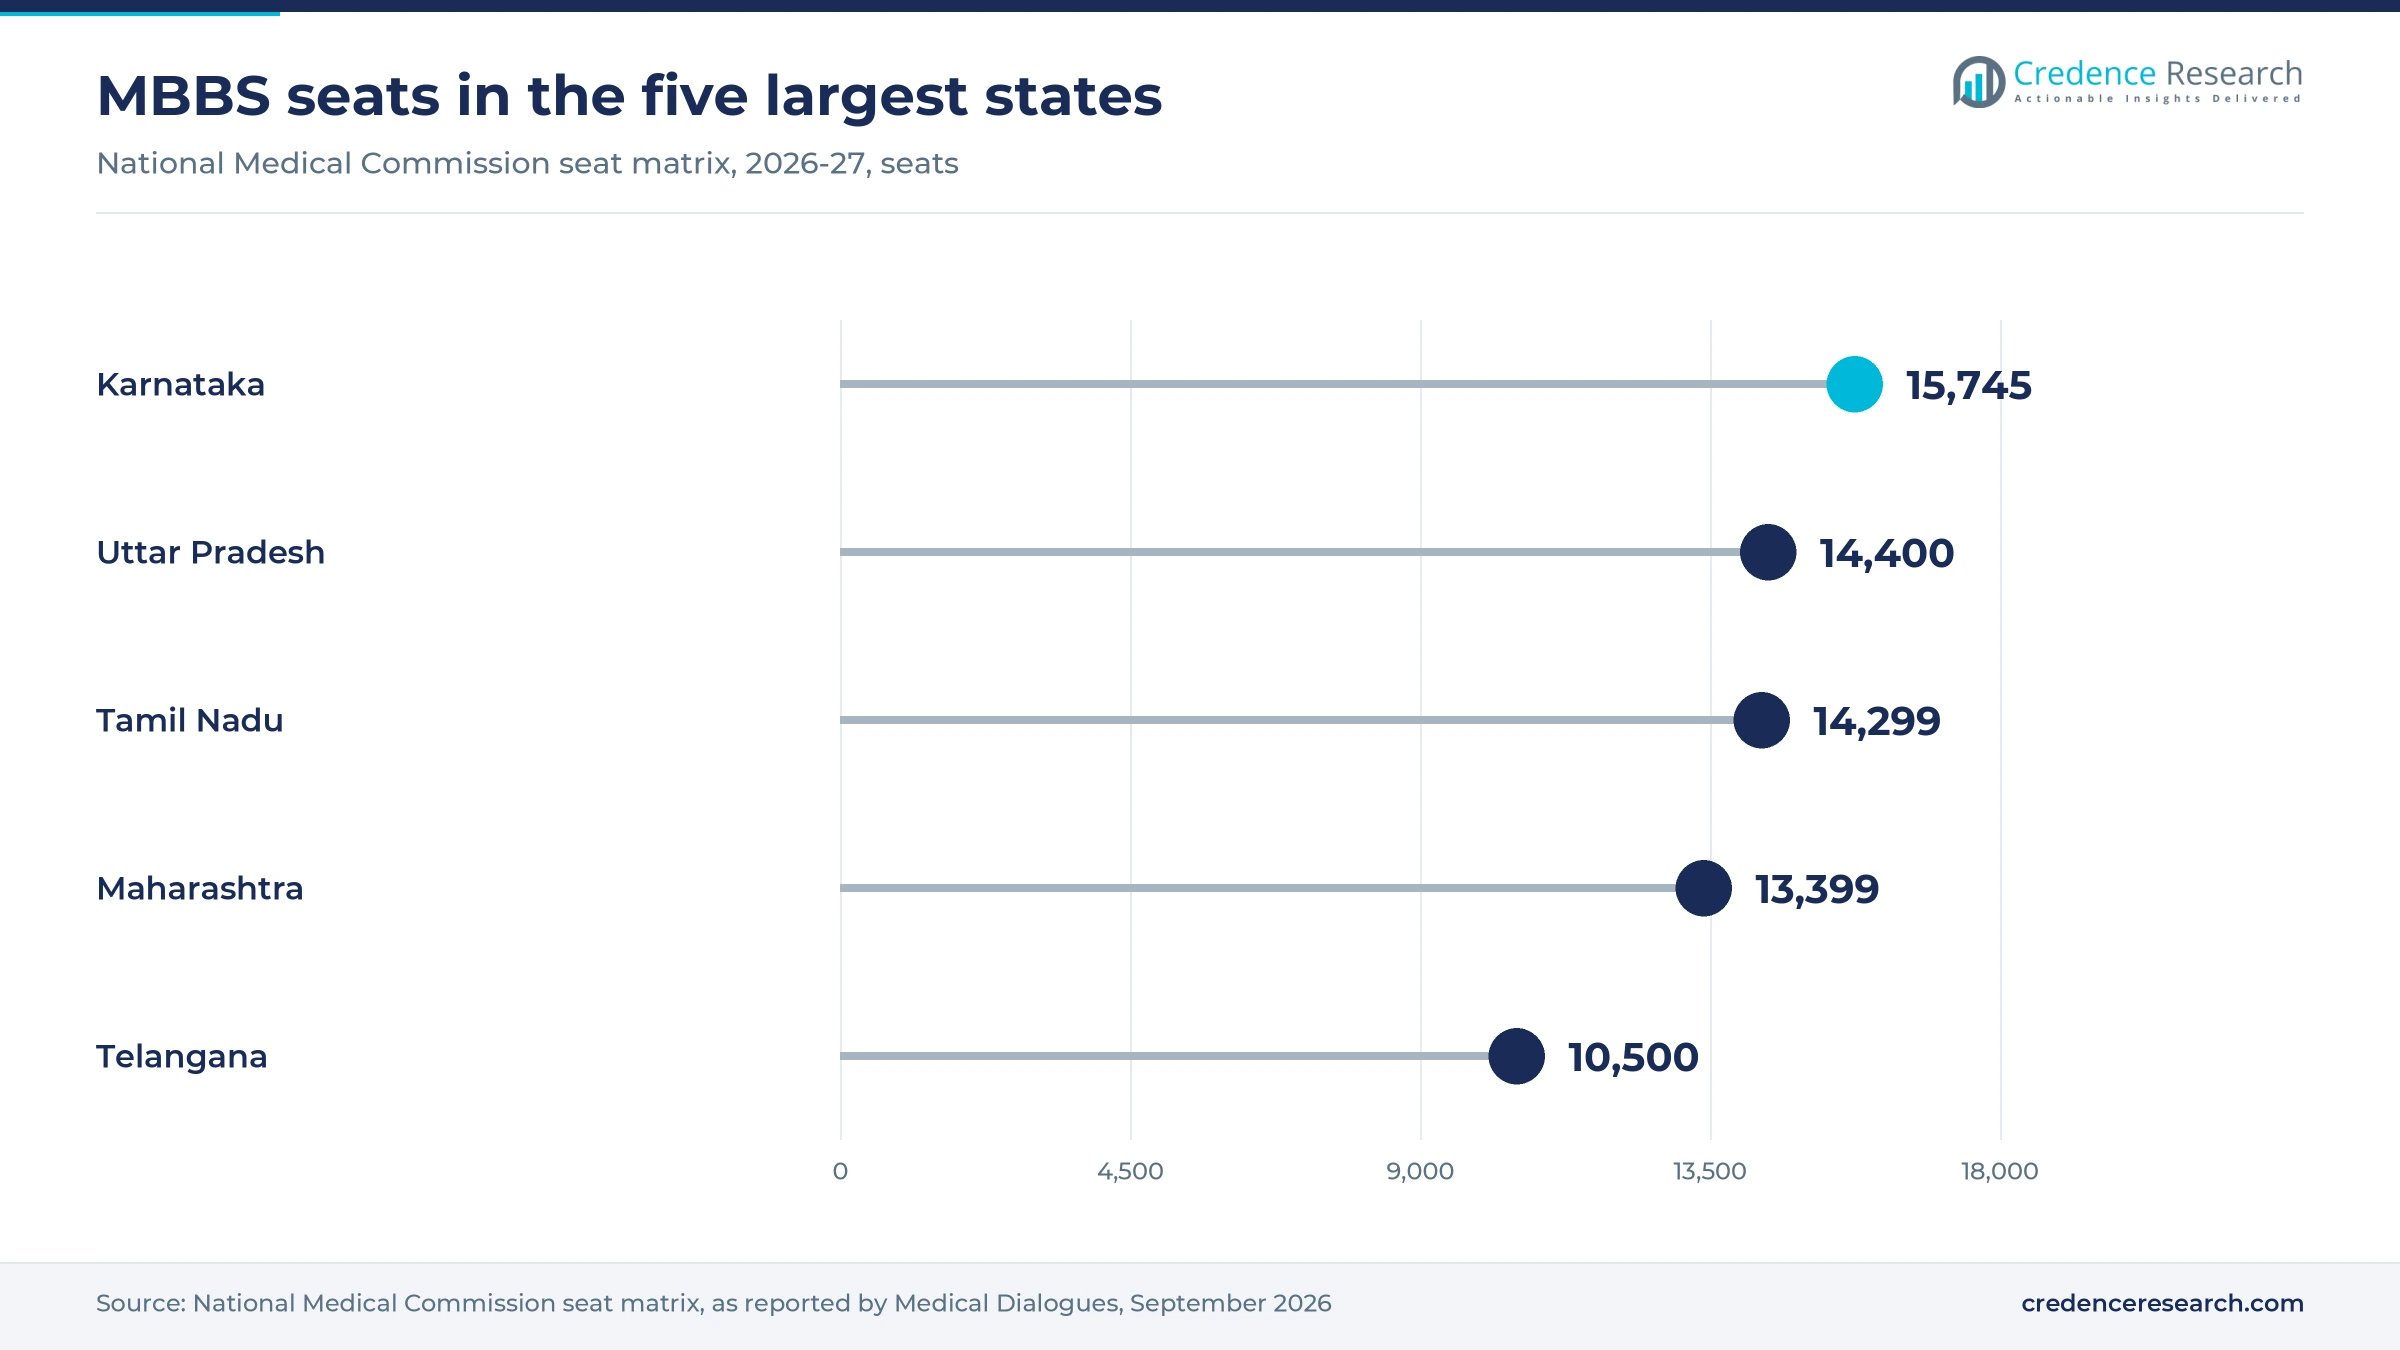
South India held 30.3% of 2025 value and grows at 7.81% a year, the largest share among the five zones. The National Medical Commission matrix lists 15,745 MBBS seats in Karnataka, 14,299 in Tamil Nadu and 10,500 in Telangana, which gives the zone a deep clinical workforce. Business Standard placed about 30% of planned private beds here in April 2025. Rainbow Children's Medicare and Narayana Hrudayalaya are both adding Bengaluru capacity, while Tamil Nadu still records an 85.2% rural specialist shortfall.
North India attracts the largest bed pipeline
North India held 26.6% of 2025 value and grows at 8.71% a year, supported by the largest announced capacity additions. Business Standard reported that about 46% of planned private beds were in the North as of April 2025. Max Healthcare is adding 712 beds in Lucknow by fiscal 2030, and Yatharth Hospital integrated 250 beds in Agra during February 2026. Uttar Pradesh also lists 14,400 MBBS seats, although its rural specialist shortfall stood at 74.4% in March 2023.
West India blends metro care with new greenfield sites
West India held 21.7% of 2025 value and grows at 7.81% a year, anchored by referral hospitals in Maharashtra. Manipal's agreement to buy Sahyadri Hospitals for Rs 6,000 crore in July 2025 shows the price buyers will pay for scale in Maharashtra, which lists 13,399 MBBS seats. Jupiter Lifeline Hospitals plans 1,300 beds across three greenfield sites, according to Business Standard. Gujarat remains the gap in the zone, with an 88.1% rural specialist shortfall in March 2023.
East and Northeast India draws new chain entrants
East & Northeast India held 15.3% of 2025 value and grows at 8.61% a year, as national chains add sites across the zone. Max Healthcare bought control of Kalinga Hospital in Bhubaneswar in May 2026, and Global Health has acquired land for a 400-bed Guwahati hospital. Medanta's 110-bed Ranchi unit is already operational, according to EY India. Bihar, however, recorded an 80.9% rural specialist shortfall, which keeps patients traveling outside their districts for specialist care.
Central India grows fastest from the lowest base
Central India held 6.1% of 2025 value and grows at 9.01% a year, the fastest rate among the five zones. Growth starts from thin supply, since Madhya Pradesh recorded a 94% rural specialist shortfall in March 2023, the highest among the states cited by ThePrint. Private capacity is now arriving, with Medanta adding about 80 beds and an approved 80-bed cancer unit in Indore. Narayana Hrudayalaya also lists Raipur among its expansion projects through fiscal 2030, according to EY India.
Mergers and seat approvals set the 2025–2026 agenda
| Development | Status and market relevance |
|---|---|
| In July 2025, Manipal Health Enterprises agreed to acquire Sahyadri Hospitals for Rs 6,000 crore. | Reported by the India Brand Equity Foundation; adds Maharashtra scale to a national network. |
| In September 2025, the Union Cabinet approved 5,023 MBBS and 5,000 postgraduate seats with Rs 15,035 crore sanctioned. | Government institutions are targeted for completion by 2028-29, according to Deccan Herald. |
| In February 2026, Yatharth Hospital fully integrated the 250-bed Shantived Hospitals in Agra. | Completed; the Rs 260 crore purchase adds 250 beds in Uttar Pradesh, according to EY India. |
| In May 2026, Max Healthcare took a controlling stake in the 250-bed Kalinga Hospital in Bhubaneswar. | Completed; adds 250 beds in Odisha, according to EY India. |
| In September 2026, the National Medical Commission listed 140,664 MBBS seats across 839 colleges for 2026-27. | Current matrix; includes 41 newly established colleges with 3,850 seats. |
Digital rails reach scale while robotics starts small
- Electronic health records are moving onto national registries, as 272,000 facilities had adopted software enabled by the digital mission by July 2026.
- Telemedicine runs at population scale through eSanjeevani, whose network spans more than 142,000 spokes and over 19,000 hubs, with women making up over 57% of use.
- Virtual care platforms are beginning to reach tertiary specialists, since AIIMS Jodhpur, Jammu and Patna have launched specialist teleconsultation sessions on the same public platform.
- Robotic surgery is still at an early stage, though SS Innovations reported more than 100 SSi Mantra systems installed in India and six other countries by July 2025.
Need a Custom Version of This Report?
Tailor the scope, geography, or segments to your exact requirements.
- Custom geography or segment scope
- Direct access to our analyst team
Listed hospital chains compete through beds and deals
Competition centers on bed count, payer contracts and clinical depth, and scale now comes more often through acquisitions than through single greenfield projects. Apollo Hospitals Enterprise commissioned four hospitals in fiscal 2026 and plans about 3,400 further beds, according to EY India. Max Healthcare Institute combines brownfield additions with purchases such as Kalinga Hospital, while Manipal Health Enterprises agreed to buy Sahyadri Hospitals. Aster DM Healthcare is merging with Quality Care India to reach 39 hospitals. Fortis Healthcare has moved into mental health care through its Adayu unit, and Rainbow Children's Medicare and HealthCare Global Enterprises compete on single-specialty protocols in pediatrics and oncology. Narayana Hrudayalaya and Global Health are extending into eastern and central cities, and Yatharth Hospital is building a northern network through acquisitions. Public hospitals remain the largest low-cost alternative, so private pricing is tested against government facilities and scheme rates.
Companies profiled and their roles in this market
| Company | Type | Role in the market |
|---|---|---|
| Manipal Health Enterprises | Hospital network | Agreed to acquire Sahyadri Hospitals in July 2025, adding Maharashtra capacity |
| Apollo Hospitals Enterprise | Hospital network | Commissioned four hospitals in fiscal 2026 and plans about 3,400 more beds |
| Aster DM Healthcare | Hospital network | Shareholders approved the Quality Care merger, forming a 39-hospital group |
| Max Healthcare Institute | Hospital network | Added brownfield beds and bought Kalinga Hospital in May 2026 |
| Fortis Healthcare | Hospital network | Added about 800 brownfield beds in fiscal 2026 and plans about 1,800 more |
| Narayana Hrudayalaya (Narayana Health) | Hospital network | Plans to grow from about 5,750 beds to above 7,600 by fiscal 2030 |
| Global Health (Medanta) | Hospital network | Plans 400-bed hospitals in Varanasi and Guwahati |
| Rainbow Children's Medicare | Pediatric specialty chain | Added about 500 beds in fiscal 2026, with 900 more under execution |
| Healthcare Global Enterprises (HCG) | Oncology chain | Plans more than 200 beds across five cities over 24 months |
| Yatharth Hospital & Trauma Care Services | Regional hospital chain | Completed three acquisitions in fiscal 2026 and passed 3,200 beds |
Volume is secure, but affordability decides the gains
Credence Research's view is that India healthcare volume growth is well supported, since public cover, trained clinicians and private beds are all expanding together. The harder question is who captures the value, because private bills remain several times higher than public ones and the payer mix is moving toward institutions that negotiate prices. Providers that keep occupancy high in new Tier-2 sites should outperform those that simply add beds. Digital rails offer lower administration costs, but those gains will reach providers only if claims and records connect cleanly with hospital systems.
How Credence Research built the estimates
The report uses 2025 as the base year and forecasts values through 2035. Market values come from the Credence Research model across services, medicines, diagnostics, devices and digital health, and they are not derived from National Health Accounts data. Regional shares and segment shares and growth rates are Credence Research estimates. Supporting facts come from government statistical releases, ministry and regulator data, parliamentary replies reported by named news outlets, a sector newsletter from EY India and named trade press. No interviews or surveys were conducted for this India healthcare report.
Tier-2 capacity and insured demand shape the path to 2035
The India healthcare market is projected to reach USD 1,412.44 billion by 2035, with Tier-2 capacity and insured demand setting the pace. The next few years depend on whether the 34,000-bed private pipeline fills without eroding returns, and on whether new medical seats translate into rural specialists. Hospital groups that link with inpatient and multispecialty networks across zones will have stronger payer leverage. Public platforms should meanwhile keep extending remote consultations into primary care, widening referral channels for both public and private providers through the forecast period.
Frequently Asked Questions
How big is the India healthcare market?
Which region leads the market in India?
Which region grows fastest?
Which product type is largest?
How does PM-JAY affect hospital demand?
How far has digital health infrastructure reached?
What is the main challenge for the market?
Which companies are active in the market?
Table of Content
Chapter 1 Market Segmentation
- 1.1 Segmentation Framework
- 1.1.1 Product and Service Classification
- 1.1.2 Application and End-Use Classification
- 1.1.3 Technology and Solution Classification
- 1.1.4 Customer and Distribution Channel Classification
- 1.1.5 Geographic Segmentation
- 1.1.6 Market Segment Definitions and Boundaries
- 1.2 By Product Type
- 1.2.1 Healthcare Services
- 1.2.2 Pharmaceuticals & Therapeutics
- 1.2.3 Diagnostics & Laboratory Services
- 1.2.4 Medical Devices & Equipment
- 1.2.5 Digital Health Solutions
- 1.3 By Care Setting
- 1.3.1 Acute-Care Hospitals
- 1.3.2 Ambulatory & Day-Care Centers
- 1.3.3 Primary & Community Care
- 1.3.4 Home Healthcare
- 1.3.5 Diagnostic Centers
- 1.4 By End User
- 1.4.1 Individual Patients
- 1.4.2 Government Health Programs
- 1.4.3 Private Insurers & TPAs
- 1.4.4 Employers & Corporate Health Programs
- 1.4.5 International Patients
- 1.5 By Disease Area
- 1.5.1 Cardiovascular & Metabolic Care
- 1.5.2 Oncology
- 1.5.3 Maternal & Child Health
- 1.5.4 Infectious Disease Care
- 1.5.5 Orthopedics & Neurology
Chapter 2 Introduction
- 2.1 Report Objectives and Scope
- 2.2 Product Definition and Industry Terminology
- 2.3 Market Inclusions and Exclusions
- 2.4 Research Process
- 2.4.1 Primary Research and Expert Interviews
- 2.4.2 Secondary Research and Source Review
- 2.4.3 Top-Down and Bottom-Up Estimation
- 2.4.4 Data Triangulation and Verification
- 2.5 Market Size Measurement Basis
- 2.5.1 2025: USD 637.99 billion → 2035: USD 1,412.44 billion
- 2.6 Historical and Forecast Reference Periods
- 2.6.1 Historical Period: 2018-2025
- 2.6.2 Base Year: 2025
- 2.6.3 Forecast Period: 2025-2035
- 2.7 Research Assumptions and Limitations
Chapter 3 Executive Summary
- 3.1 Market Snapshot and Key Findings
- 3.2 Base-Year Market Size, 2025
- 3.3 Forecast Market Size, 2035
- 3.4 Revenue and Volume Growth Outlook
- 3.5 Key Demand and Supply Indicators
- 3.6 Leading Market Segments
- 3.7 Fastest-Growing Market Opportunities
- 3.8 Regional Performance Highlights
- 3.9 Technology and Industry Transformation
- 3.10 Competitive Landscape Summary
- 3.11 Analyst View and Strategic Implications
Chapter 4 India Healthcare Market Trends and Developments
- 4.1 Historical Industry Development, 2018-2025
- 4.2 Recent Market Trends and Developments
- 4.3 Demand and Customer Behavior Trends
- 4.4 Technology and Product Innovation
- 4.5 Artificial Intelligence, Automation and Digitalization
- 4.6 Local Manufacturing and Supply Chain Realignment
- 4.7 Industry Partnerships, Mergers and Acquisitions
- 4.8 Sustainability and Circular Economy Developments
- 4.9 Government and Private Sector Investment Trends
- 4.10 Emerging Business Models and Commercialization
- 4.11 Industry Developments and Announcements
Chapter 5 India Healthcare Market Production, Supply and Demand Analysis
- 5.1 Demand Trend and Consumption Analysis, 2018-2025
- 5.2 Demand Forecast, 2025-2035
- 5.3 Production and Output Trend, 2018-2025
- 5.4 Production and Output Forecast, 2025-2035
- 5.5 Installed Capacity and Capacity Utilization
- 5.6 Company-Wise Production Plants and Statistics
- 5.6.1 Installed Production Capacity
- 5.6.2 Actual Production
- 5.6.3 Planned Capacity and Expansion Targets
- 5.7 Supply Chain Structure and Procurement Trends
- 5.8 Supply-Demand Gap and Bottlenecks
- 5.9 Import Dependence and Sourcing Structure
- 5.10 Contract Manufacturing and Outsourcing
- 5.11 Regional Supply and Demand Concentration
Chapter 6 India Healthcare Market Pricing Analysis
- 6.1 Pricing Structure and Measurement
- 6.2 Historical Pricing Trends, 2018-2025
- 6.3 Pricing Outlook, 2025-2035
- 6.4 Average Selling Price and Unit Economics
- 6.5 Pricing by Product and Market Segment
- 6.6 Geographic Pricing Differences
- 6.7 Key Input, Energy, Labor and Logistics Costs
- 6.8 Contract Pricing and Purchasing Models
- 6.9 Pricing Sensitivity and Competitive Positioning
- 6.10 Price, Margin and Profitability Implications
Chapter 7 India Healthcare Market Dynamics
- 7.1 Market Growth Drivers
- 7.1.1 Demand-Side Drivers
- 7.1.2 Technology and Innovation Drivers
- 7.1.3 Infrastructure and Investment Drivers
- 7.1.4 Regulatory and Policy Drivers
- 7.2 Market Restraints
- 7.2.1 Cost and Affordability Constraints
- 7.2.2 Technology and Adoption Barriers
- 7.2.3 Supply Chain and Operational Constraints
- 7.3 Market Challenges
- 7.3.1 Competitive Pressure and Margin Erosion
- 7.3.2 Skills, Infrastructure and Implementation Gaps
- 7.4 Emerging Market Opportunities
- 7.5 Market Dynamics Impact and Time-Horizon Assessment
Chapter 8 India Healthcare Value Chain Analysis
- 8.1 Industry Value Chain Overview
- 8.2 Upstream Suppliers and Critical Inputs
- 8.3 Technology and Component Providers
- 8.4 Manufacturing or Service Delivery
- 8.5 Distribution, Channel Partners and Integrators
- 8.6 Downstream Applications and End Users
- 8.7 Value Addition and Profit Pools
- 8.8 Vertical Integration and Outsourcing
- 8.9 Supplier Concentration and Risk
- 8.10 Supply Chain Localization and Resilience
Chapter 9 India Healthcare Market Regulations and Policies
- 9.1 Relevant Laws, Standards and Compliance Frameworks
- 9.2 Product, Service, Safety and Quality Requirements
- 9.3 Government Policies, Incentives and Subsidies
- 9.4 Imports, Exports and Trade Barriers
- 9.5 Public Procurement and Local Content Requirements
- 9.6 Environmental and Sustainability Compliance
- 9.7 Upcoming Policy Changes and Market Implications
Chapter 10 India Healthcare Market Hotspots and Opportunities
- 10.1 Market Opportunity Mapping and Growth Hotspots
- 10.2 High-Growth Applications and Customer Groups
- 10.3 Underserved Markets and White-Space Opportunities
- 10.4 Emerging Technology and Product Opportunities
- 10.5 New Capacity and Investment Hotspots
- 10.6 Market Entry and Expansion Opportunities
- 10.7 Distribution and Partnership Opportunities
- 10.8 Near-Term and Long-Term Commercial Potential
- 10.9 Opportunity Attractiveness and Execution Risks
Chapter 11 India Healthcare Market Outlook, 2025-2035
- 11.1 Market Size and Analysis
- 11.1.1 Revenue (Market Measurement: 2025: USD 637.99 billion → 2035: USD 1,412.44 billion)
- 11.1.2 Market Volume and Quantity Sold
- 11.1.3 Historical Market Size, 2018-2025
- 11.1.4 Base-Year Market Size, 2025
- 11.2 Market Forecast, 2025-2035
- 11.2.1 Revenue Forecast to 2035
- 11.2.2 Volume Forecast to 2035
- 11.2.3 CAGR and Year-on-Year Growth
- 11.2.4 Incremental Revenue Opportunity
- 11.3 Forecast Assumptions and Scenario Analysis
- 11.3.1 Base-Case Forecast
- 11.3.2 Optimistic and Conservative Scenarios
- 11.3.3 Technology, Pricing and Policy Sensitivities
- 11.4 Market Attractiveness and Growth Outlook
Chapter 12 India Healthcare Market Segmentation and Outlook
- 12.1 Segmentation Summary and Market Shares, 2025
- 12.2 Largest and Fastest-Growing Segments
- 12.3 By Product Type - Market Size and Forecast, 2025-2035
- 12.3.1 Segment Definition and Scope
- 12.3.2 Historical Market Size, 2018-2025
- 12.3.3 Revenue Forecast, 2025-2035
- 12.3.4 Volume Forecast, 2025-2035
- 12.3.5 Base-Year Market Share, 2025
- 12.3.6 Segment CAGR and Growth Drivers
- 12.3.7 Subsegment Market Size and Forecast
- 12.3.7.1 Healthcare Services
- 12.3.7.2 Pharmaceuticals & Therapeutics
- 12.3.7.3 Diagnostics & Laboratory Services
- 12.3.7.4 Medical Devices & Equipment
- 12.3.7.5 Digital Health Solutions
- 12.3.8 Subsegment Pricing and Adoption Trends
- 12.3.9 Leading Suppliers and Competition
- 12.3.10 Regional Demand and Opportunities
- 12.4 By Care Setting - Market Size and Forecast, 2025-2035
- 12.4.1 Segment Definition and Scope
- 12.4.2 Historical Market Size, 2018-2025
- 12.4.3 Revenue Forecast, 2025-2035
- 12.4.4 Volume Forecast, 2025-2035
- 12.4.5 Base-Year Market Share, 2025
- 12.4.6 Segment CAGR and Growth Drivers
- 12.4.7 Subsegment Market Size and Forecast
- 12.4.7.1 Acute-Care Hospitals
- 12.4.7.2 Ambulatory & Day-Care Centers
- 12.4.7.3 Primary & Community Care
- 12.4.7.4 Home Healthcare
- 12.4.7.5 Diagnostic Centers
- 12.4.8 Subsegment Pricing and Adoption Trends
- 12.4.9 Leading Suppliers and Competition
- 12.4.10 Regional Demand and Opportunities
- 12.5 By End User - Market Size and Forecast, 2025-2035
- 12.5.1 Segment Definition and Scope
- 12.5.2 Historical Market Size, 2018-2025
- 12.5.3 Revenue Forecast, 2025-2035
- 12.5.4 Volume Forecast, 2025-2035
- 12.5.5 Base-Year Market Share, 2025
- 12.5.6 Segment CAGR and Growth Drivers
- 12.5.7 Subsegment Market Size and Forecast
- 12.5.7.1 Individual Patients
- 12.5.7.2 Government Health Programs
- 12.5.7.3 Private Insurers & TPAs
- 12.5.7.4 Employers & Corporate Health Programs
- 12.5.7.5 International Patients
- 12.5.8 Subsegment Pricing and Adoption Trends
- 12.5.9 Leading Suppliers and Competition
- 12.5.10 Regional Demand and Opportunities
- 12.6 By Disease Area - Market Size and Forecast, 2025-2035
- 12.6.1 Segment Definition and Scope
- 12.6.2 Historical Market Size, 2018-2025
- 12.6.3 Revenue Forecast, 2025-2035
- 12.6.4 Volume Forecast, 2025-2035
- 12.6.5 Base-Year Market Share, 2025
- 12.6.6 Segment CAGR and Growth Drivers
- 12.6.7 Subsegment Market Size and Forecast
- 12.6.7.1 Cardiovascular & Metabolic Care
- 12.6.7.2 Oncology
- 12.6.7.3 Maternal & Child Health
- 12.6.7.4 Infectious Disease Care
- 12.6.7.5 Orthopedics & Neurology
- 12.6.8 Subsegment Pricing and Adoption Trends
- 12.6.9 Leading Suppliers and Competition
- 12.6.10 Regional Demand and Opportunities
- 12.7 Segment Growth Comparison
- 12.8 Segment Attractiveness and Priority Matrix
Chapter 13 India Healthcare End-Use and Application Market Outlook
- 13.1 End-Use Industry and Customer Demand Structure
- 13.2 Leading Applications and Customer Groups
- 13.3 End-Use Market Size, Share and Forecast
- 13.4 Major End-Use Industry Deep Dives
- 13.4.1 Customer Requirements and Use Cases
- 13.4.2 Demand and Replacement Cycles
- 13.4.3 Technical and Regulatory Considerations
- 13.4.4 Purchasing and Procurement Models
- 13.4.5 Leading Vendors and Distribution Channels
- 13.4.6 Forecast and Commercial Opportunities
- 13.5 Emerging Applications and Cross-Segment Demand
- 13.6 End-Use Industry Investment Priorities
Chapter 14 India Healthcare Geographic Market Outlook, 2025-2035
- 14.1 Domestic Market Distribution and Demand Clusters
- 14.2 State- or Province-Wise Market Size and Forecast, 2025-2035
- 14.3 City and Metropolitan Market Outlook
- 14.4 Industrial, Manufacturing and Commercial Clusters
- 14.5 Geographic Concentration of Key End Users
- 14.6 Local Pricing and Purchasing Differences
- 14.7 Domestic Production Facilities and Capacity Map
- 14.8 Local Infrastructure and Project Pipeline
- 14.9 State-Level Policy and Incentive Differences
- 14.10 Subnational Investment Hotspots and Opportunities
- 14.11 Distribution and Logistics Networks
- 14.12 Domestic Competitive Footprint
Chapter 15 India Healthcare Technology, Innovation and Sustainability Outlook
- 15.1 Technology Landscape and Maturity
- 15.2 Product, Process and Service Innovation
- 15.3 AI, Automation and Digital Tools in the Industry
- 15.4 Technology Adoption and Performance Benchmarking
- 15.5 Innovation Pipeline and R&D Investment
- 15.6 Patent and Intellectual Property Trends
- 15.7 Energy Efficiency and Resource Management
- 15.8 Sustainability, Recycling and Circularity
- 15.9 Technology Roadmap, 2025-2035
- 15.10 Risks of Obsolescence and Technology Substitution
Chapter 16 India Healthcare Market Key Strategic Imperatives
- 16.1 Growth and Market Entry Priorities
- 16.2 High-Return Products and Segments
- 16.3 Pricing, Profitability and Cost Optimization
- 16.4 Technology Investment and Product Differentiation
- 16.5 Supply Chain Localization and Resilience
- 16.6 Distribution and Customer Acquisition
- 16.7 Partnership, Acquisition and Capacity Strategy
- 16.8 Regional Expansion Priorities
- 16.9 Short-, Medium- and Long-Term Actions
Chapter 17 Competition Outlook
- 17.1 Industry Competition Characteristics
- 17.2 Market Structure and Concentration
- 17.3 Market Share and Competitive Positioning, 2025
- 17.4 Company-Wise Revenue and Product Benchmarking
- 17.5 Production and Service Capacity Benchmarking
- 17.6 Technology, Pricing and Differentiation
- 17.7 Regional Footprint and Distribution Strength
- 17.8 Mergers, Acquisitions and Strategic Alliances
- 17.9 New Entrants and Competitive Threats
- 17.10 Porter's Five Forces and Industry Attractiveness
- 17.11 Competitive Outlook, 2025-2035
Chapter 18 Company Profiles
- 18.1 Company Coverage and Selection Criteria
- 18.2 Manipal Health Enterprises
- 18.2.1 Business Description
- 18.2.2 Company Ownership and Geographic Presence
- 18.2.3 Product and Service Portfolio
- 18.2.4 Manufacturing and Operating Footprint
- 18.2.5 Production Capacity and Expansion Plans
- 18.2.6 Financial Performance and Investment
- 18.2.7 Market Share and Competitive Position
- 18.2.8 Technology and Innovation Capabilities
- 18.2.9 Strategic Alliances or Partnerships
- 18.2.10 Recent Developments
- 18.2.11 Growth Strategy and Outlook
- 18.3 Apollo Hospitals Enterprise
- 18.4 Aster DM Healthcare
- 18.5 Max Healthcare Institute
- 18.6 Fortis Healthcare
- 18.7 Narayana Hrudayalaya (Narayana Health)
- 18.8 Global Health (Medanta)
- 18.9 Rainbow Children's Medicare
- 18.10 Healthcare Global Enterprises (HCG)
- 18.11 Yatharth Hospital & Trauma Care Services
- 18.12 Other Relevant Market Participants
Note: Every listed company is profiled on the structure shown under the first company. The company list is preliminary and may change based on research findings, market developments, data availability and client requirements.
Chapter 19 Disclaimer
- 19.1 Research and Forecast Disclaimer
- 19.2 Data Source and Estimation Limitations
Note: The depth of individual sections depends on data availability for this market. Volume, capacity, trade and other unit-based metrics are included where applicable.

