
Hospital lab and pharmacy traffic anchors regional demand
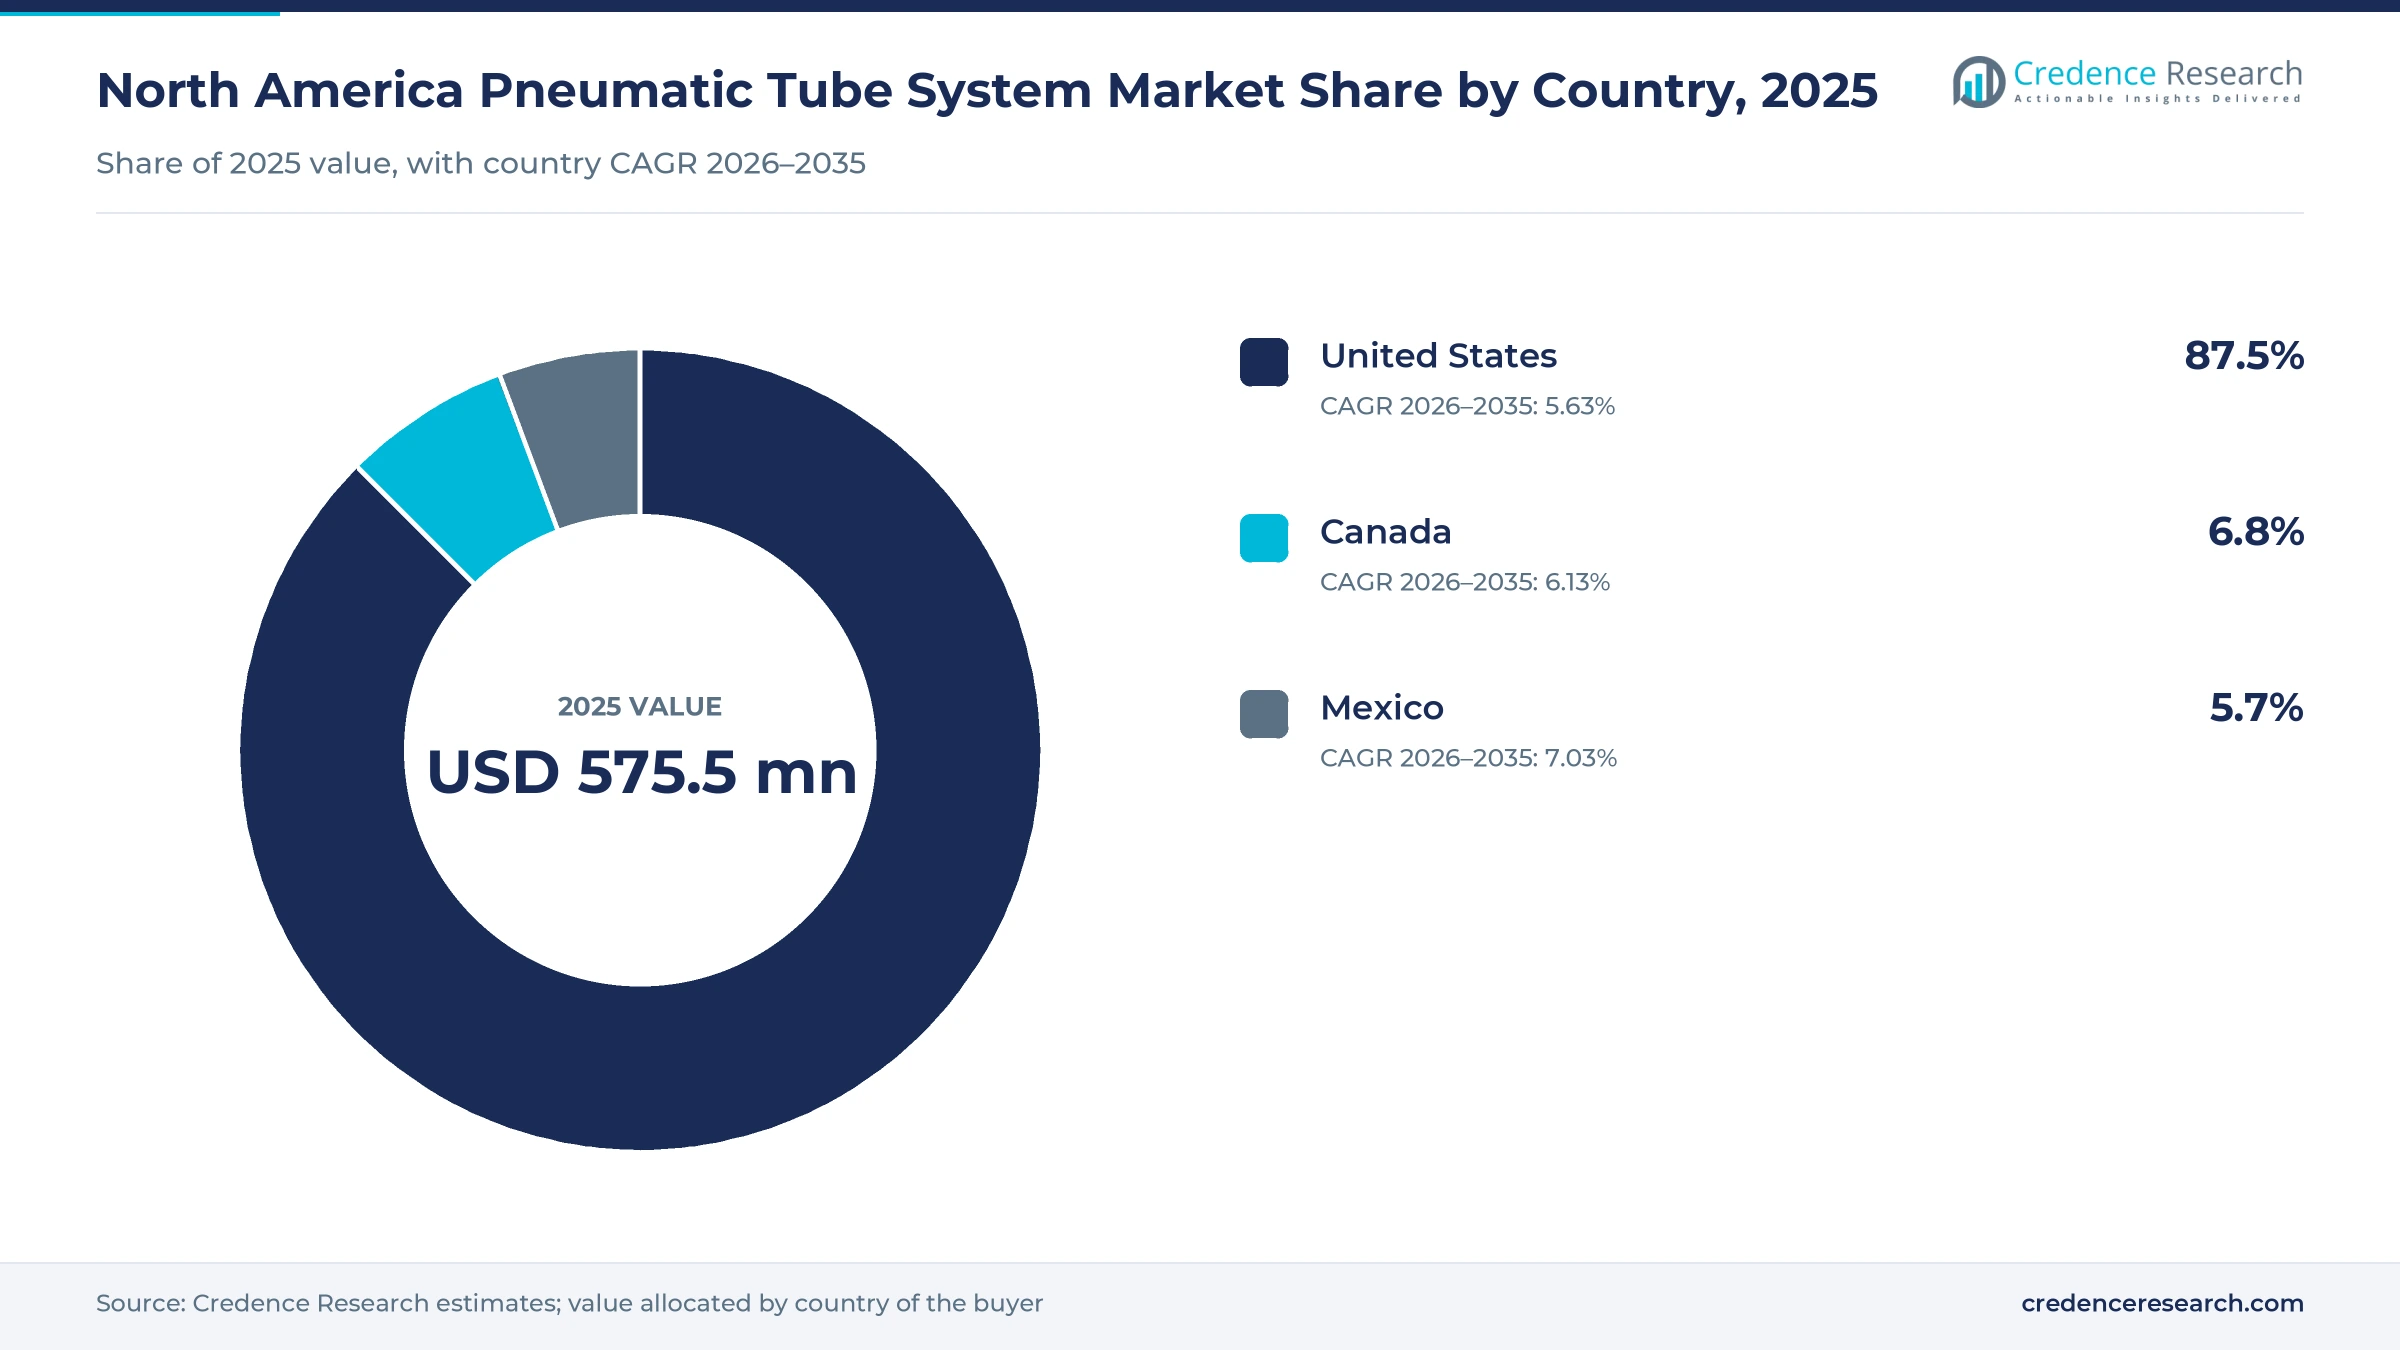
The North America pneumatic tube system market was valued at USD 575.5 million in 2025 and is projected to increase from USD 616.0 million in 2026 to USD 1.02 billion by 2035, registering a CAGR of 5.75% during 2026–2035. Demand comes mainly from hospitals that move lab specimens and medicines between floors, and from owners replacing aging controllers on networks already in service. United States held the largest country share, 87.5% in 2025, because its hospital base reached 6,100 sites in the American Hospital Association count from the 2024 survey. Mexico is the fastest-growing country at 7.03% a year, since the federal government announced 152 hospital projects through 2030 in July 2026. Canada follows at 6.13% a year, supported by Ontario hospital projects announced in June 2025. Purchasing is also changing, because TransLogic promoted a cloud-based monitoring platform and Software Version 9 in July 2026, which moves part of the spending from pipe and stations toward software, security and data.
What does a pneumatic tube system purchase include in North America?
A pneumatic tube system purchase covers the stations, tubing, diverters, blowers, carriers, controls and installation that move sealed carriers by air pressure or vacuum inside a facility or across a campus. Hospitals usually buy through a direct manufacturer contract tied to a construction project, while smaller owners may rely on dealers and independent service firms for later repairs and conversions.
The estimate counts new installations, expansions, service contracts, parts and control software across the United States, Canada and Mexico. It excludes autonomous delivery robots, lift-based carts, trash and linen vacuum lines, and hospital construction cost beyond the tube scope, although buyers often weigh those alternatives inside the same logistics budget.
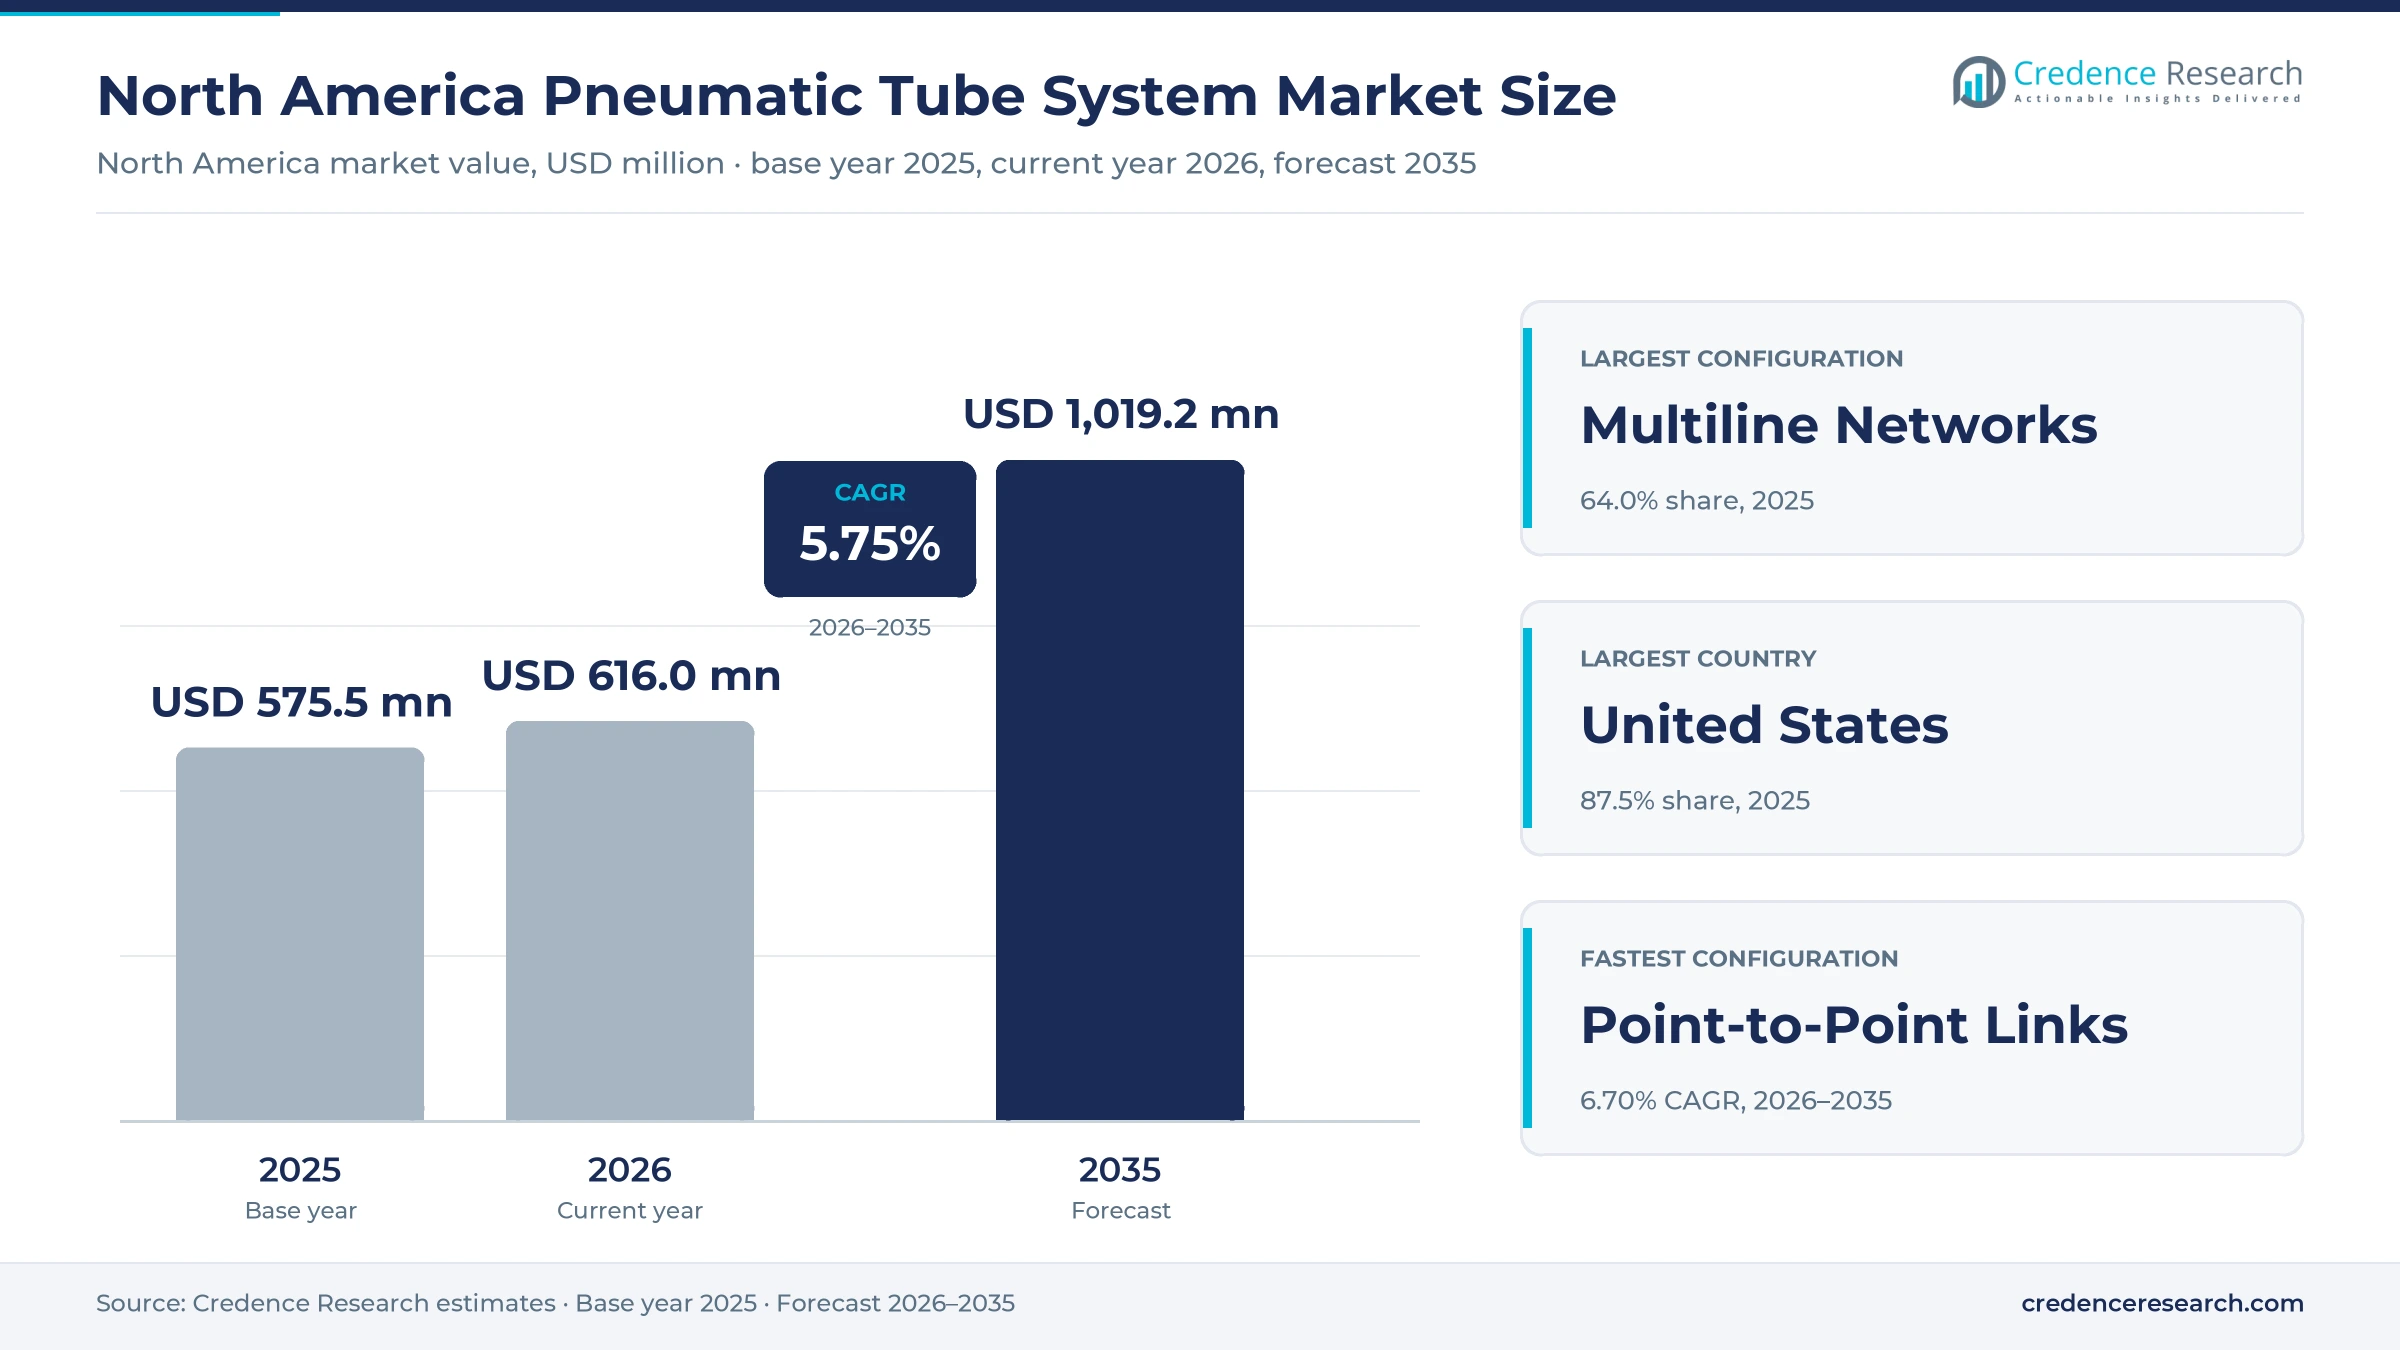
North America Pneumatic Tube System Market Insights
- The market is projected to grow from USD 575.5 million in 2025 to USD 1.02 billion by 2035, a 5.75% CAGR that tracks hospital capital plans and replacement cycles.
- The United States held 87.5% of regional value in 2025, reflecting a base of 6,100 hospitals and 907,216 staffed beds in the 2024 American Hospital Association survey.
- Multiline Networks led configurations with 64.0% in 2025, since large academic hospitals connect many floors and buildings through routed zones.
- Mexico announced 152 hospital projects in July 2026, including 50 new hospitals, which creates a new public tender pipeline for tube suppliers through 2030.
- TransLogic and Diligent Robotics formed an alliance in October 2025, which shows suppliers now pairing tube networks with robots for items too large for carriers.
Multiline hospital networks hold most of the value
Why do multiline networks lead hospital tube spending?
Based on system configuration, the market is categorized into Multiline Networks, Single-Line Networks and Point-to-Point Links. Multiline Networks led with 64.0% of 2025 value because large academic centers route traffic across many zones, and MIT Technology Review reported in June 2024 that the main system at the Penn Medicine pavilion runs over 12 miles of pipe and completes more than 6,000 transactions on an average day. Point-to-Point Links grow fastest at 6.70% a year as hospitals dedicate short routes to urgent material, and the same report noted that the dedicated Michigan Medicine line delivers radioactive materials in under a minute.
How far do hospitals outweigh other tube system buyers?
Based on end-use industry, the market is categorized into Medical and Healthcare, Commercial Facilities, Industrial Facilities and Transport and Campus Facilities. Medical and Healthcare led with 71.0% of 2025 value because the American Hospital Association counted 6,100 U.S. hospitals with 907,216 staffed beds in its 2024 survey. Industrial Facilities grow fastest at 6.42% a year as process plants shorten the path from furnace to lab. Pepperl+Fuchs reported in April 2023 that one steel plant examines up to 2,000 samples a day through such lines, and Georgia-based Aerocom Systems lists test-sample transfer among the manufacturing uses it serves.
Why does installation still outweigh recurring tube revenue?
Based on revenue stream, the market is categorized into New Systems and Installation, Expansions and Major Upgrades, Service and Maintenance, and Parts and Software. New Systems and Installation led with 43.0% of 2025 value because construction remains the largest single purchase event, and the Red Deer Hospital Redevelopment in Alberta issued a separate pneumatic tube bid package on Jan. 22, 2026. Parts and Software grows fastest at 6.72% a year as owners add digital layers to existing networks, and a July 2026 TransLogic release promoted Software Version 9, the MYtranslogic cloud monitoring platform and Delivery Manager chain-of-custody tracking.
Which payloads create the most daily tube traffic?
Based on payload type, the market is categorized into Clinical Specimens and Blood Products, Medicines and Clinical Supplies, Cash and Documents, and Production Samples and Small Parts. Clinical Specimens and Blood Products led with 58.0% of 2025 value because lab traffic dominates hospital lines, and MIT Technology Review reported in June 2024 that lab specimens make up about 60% of hospital tube cargo. Medicines and Clinical Supplies grow fastest at 6.48% a year as pharmacies seek tighter custody, since TransLogic research cited in July 2025 found nurses spend 22% less time searching for missing medications with a well-designed system.
| Segment Group | Leading Sub-segment | Share, 2025 | Fastest-growing Sub-segment | CAGR, 2026–2035 |
|---|---|---|---|---|
| By System Configuration | Multiline Networks | 64.0% | Point-to-Point Links | 6.70% |
| By End-Use Industry | Medical and Healthcare | 71.0% | Industrial Facilities | 6.42% |
| By Revenue Stream | New Systems and Installation | 43.0% | Parts and Software | 6.72% |
| By Payload Type | Clinical Specimens and Blood Products | 58.0% | Medicines and Clinical Supplies | 6.48% |
Request a Free Sample
Fill in your details and we'll send you a free sample report.
- Sample data tables & charts
- Research methodology
New hospitals and aging controls drive tube spending
Hospital network expansion adds new tube routes
Hospital network expansion is the largest source of new tube routes because owners usually specify these lines while buildings are still on the drawing board. U.S. health care construction spending totaled about USD 76.8 billion across the 2025 monthly readings in the Census Bureau series published by FRED, and September 2026 alone reached USD 6.64 billion. In Canada, Ontario said in June 2025 that nearly C$60 billion would go to health infrastructure over 10 years, with more than 50 major projects delivering about 3,000 new hospital beds. As a result, TransLogic has promoted its Design Assist service since March 2025, placing specialists in early design with simulations and 3D models. This project flow explains why New Systems and Installation held a 43.0% share of 2025 value.
Installed-base modernization keeps older networks in service
Installed-base modernization gives suppliers steady work because hospitals rarely remove a working tube network from an occupied building. Security company Armis said in August 2021 that TransLogic systems were used in about 80% of major North American hospitals and installed in more than 3,000 hospitals worldwide, and the CISA advisory of Aug. 3, 2021 cited nine vulnerabilities in the Nexus control panel. Swisslog responded with updated firmware, so upgrades became part of routine service. In July 2026, a TransLogic release cited a U.S. Department of Health and Human Services document saying about 96% of hospitals still run end-of-life operating systems and software. Owners also keep adding lines, since Tenet reported in January 2024 that Saint Vincent Hospital installed 1.25 miles of transport lines serving its blood bank, pathology, ICU and pharmacy.
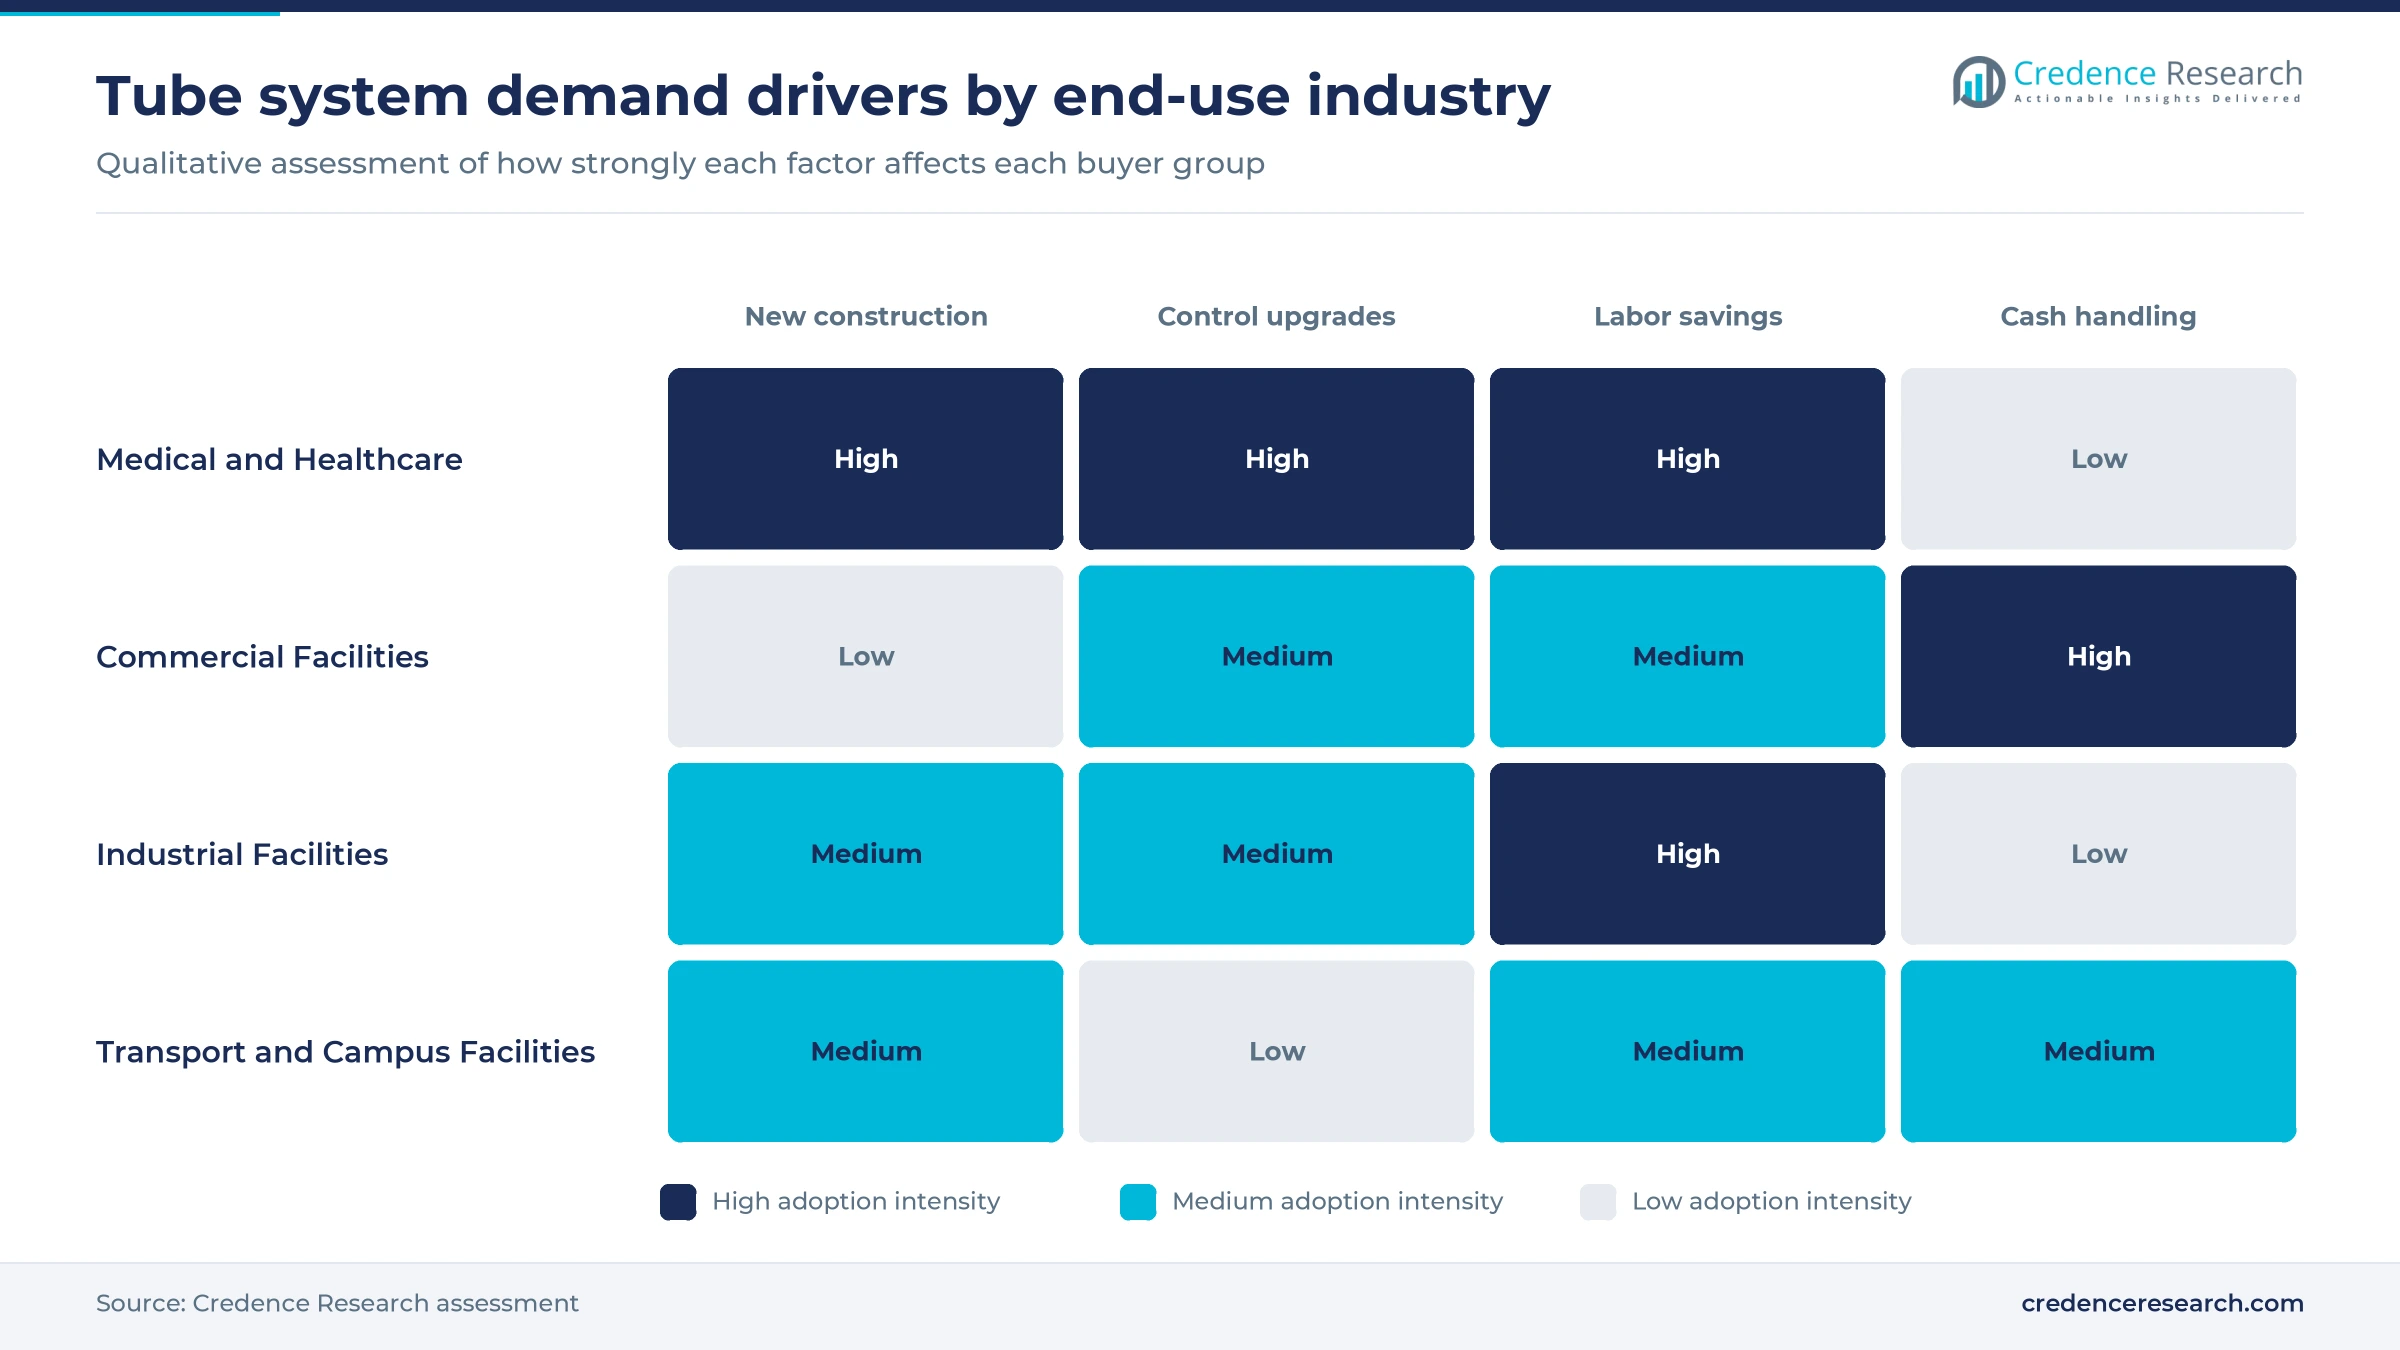
Workflow capacity optimization justifies tube budgets
Workflow capacity optimization gives finance teams a measurable case, because tube lines replace repeated courier trips with a fixed transit time. TransLogic company research cited in July 2025 estimated that a well-designed system in a 300-bed hospital saves about USD 1.3 million a year in courier labor. Field results point the same way, since WTKR reported in January 2026 that Sentara Leigh Hospital cut specimen transport from about 15 minutes to about 1 minute over roughly 1.5 miles of tubing. Similarly, MIT Technology Review reported in June 2024 that the farthest Penn Medicine points sit just under five minutes apart by capsule, against about 20 minutes on foot. These savings matter most on large sites, which is why Multiline Networks held a 64.0% share of 2025 value.
Lab staffing gaps raise the value of faster specimen flow
Laboratory staffing gaps raise the value of faster specimen flow because hospitals cannot easily add couriers or bench staff when volumes climb. The American Society for Clinical Pathology 2024 Vacancy Survey, summarized by AABB in October 2025, found vacancy rates above pre-pandemic levels, with anatomic pathology at 28.5% and cytogenetics at 7.7%. Meanwhile, the American Hospital Association counted 35,658,583 U.S. admissions in its 2024 survey, and the Hospital of the University of Pennsylvania moves nearly 4,000 specimens a day by tube. Steady specimen arrival also helps labs schedule benchtop automation, so tube and lab projects are often judged together. In turn, Clinical Specimens and Blood Products held a 58.0% share of 2025 value.
Software and robots reshape hospital transport plans
Shift toward cloud monitoring and software-led upgrades
Spending is shifting toward software because owners now treat tube controls as connected operational technology rather than plant equipment. TransLogic said in July 2026 that Software Version 9 adds features for secure, scalable hospital IT environments and unlocks MYtranslogic, a cloud-based platform that shows system information on any internet-connected device. The company also showed firmware, software and hardware upgrades at the July 2025 Health Care Facilities Innovation Conference in Columbus, Ohio, where it said more than 3,000 facility professionals gathered. Delivery Manager extends the same logic by tracking chain of custody across manual, automated and tube deliveries. Consequently, Parts and Software is the fastest-growing revenue stream at 6.72% a year, even from a small base of 2025 value.
Rise of combined tube and robot delivery planning
Hospitals are starting to plan tubes and robots together because each mode handles loads the other cannot. Swisslog Healthcare and Diligent Robotics announced an alliance in October 2025 to offer autonomous last-mile delivery in U.S. hospitals, covering items too large for tubes and samples that hospitals prefer not to send by tube. The release said the Moxi robot was deployed in more than 25 U.S. hospitals and had completed over 1 million deliveries, including 300,000 pharmacy runs. Buyers can also weigh these robots against automated guided vehicles for heavier routes. As a result, tube vendors now present robots as an extension of a tube network, not a replacement for it.
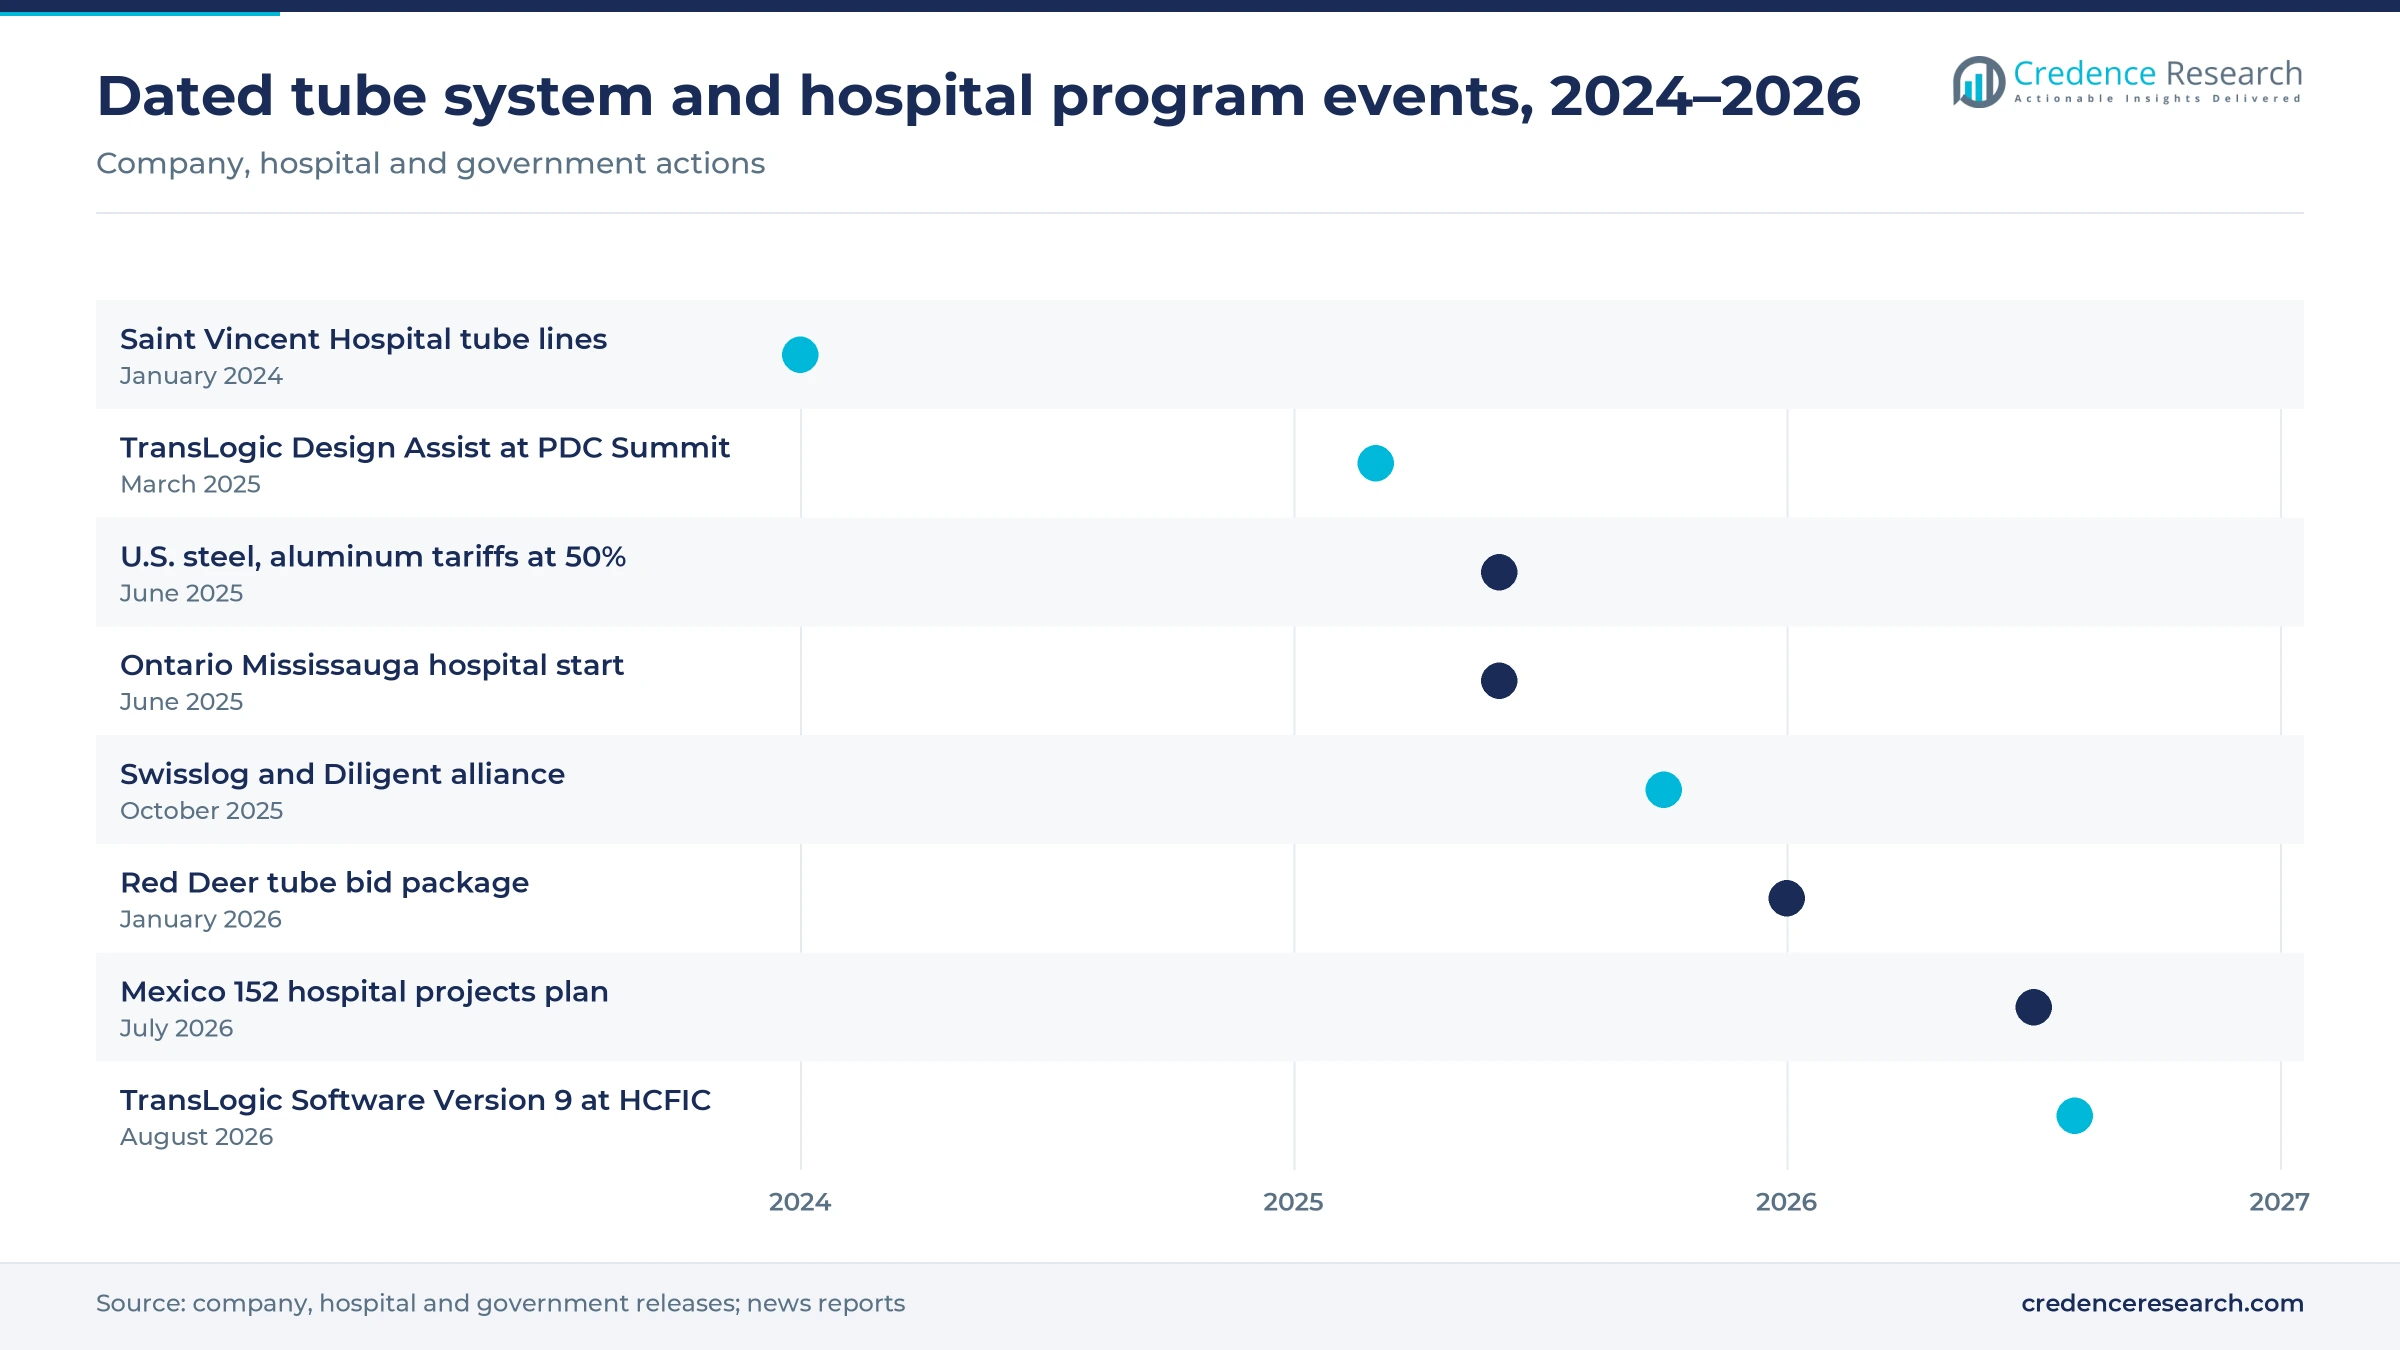
Mexico public hospital program opens a new tender pipeline
Mexico offers the clearest new opening because public hospital building is running at an unusual scale. La Razón reported on July 21, 2026 that the government plans 152 hospital projects worth about 181 billion pesos through 2030, including 50 new hospitals, 47 expansions and 55 replacements or major upgrades. El Financiero reported in September 2025 that 15 hospitals had opened with 16 more due that year. The base is low, since World Bank data show 1.01 hospital beds per 1,000 people in Mexico in 2022, against 2.68 in the United States. Suppliers that can serve IMSS, IMSS-Bienestar and ISSSTE tenders with local service gain an opening, which supports the fastest growth rate among the three countries.
Early design services offer an opening in Canadian rebuilds
Canadian hospital rebuilds offer an opening for suppliers that join projects early, because tube routes are costly to change after structural work begins. Ontario committed C$14 billion in June 2025 to the Peter Gilgan Mississauga Hospital, a 22-story tower with more than 350 new beds and over 950 beds on completion. In Alberta, Clark Builders posted a pneumatic tube bid package for the Red Deer Hospital Redevelopment on Jan. 22, 2026, with bids closing Feb. 12, 2026. Cambridge Memorial Hospital also reported in March 2025 that its tube system was fully operational in Wing B, with Wing A to follow. Design Assist-style services therefore fit Canada well, and the country is forecast to outpace the United States.
Tariffs, cyber risk and lab validation slow some projects
Metal tariffs raise component costs for U.S. projects
Metal tariffs raise cost risk for installers and buyers on fixed hospital budgets. Section 232 duties on steel and aluminum imports rose from 25% to 50% on June 4, 2025, according to law firm Butzel Long. Suppliers that assemble in the United States can still pay more for imported inputs, and long hospital projects often lock prices years before installation. Consequently, contractors face margin pressure and owners may defer expansions. Early design coordination and phased purchasing reduce part of this exposure.
Connected controls expose hospitals to cyber risk
Connected controls bring security duties that many facilities teams did not previously carry. CISA cited nine vulnerabilities in the Nexus control panel on Aug. 3, 2021, and a July 2026 TransLogic release said losses from system outages can reach thousands of dollars per minute. Hospitals therefore must coordinate IT, facilities and clinical staff before each firmware update, which can delay work on occupied floors. Network segmentation, supported software versions and service contracts lower the risk, although they add recurring cost for owners.
Sample quality validation can delay tube acceptance
Laboratory directors must validate each route because air transport can change some test results. MIT Technology Review reported in June 2024 that hospital carriers are held to 18 to 24 feet per second to protect specimen integrity. A Frontiers in Physiology study published Feb. 10, 2026, using a hospital line in China as its test site, found lactate dehydrogenase bias of 3.2% with immediate transport, rising to 10.7% after a 30-minute rest before sending. Consequently, commissioning takes longer and clear rest-time rules are now needed in validation protocols.
Falling cash use narrows commercial tube demand
Falling cash use narrows the commercial side of the market, where tubes move till receipts and documents. The Federal Reserve 2026 Diary of Consumer Payment Choice reported an average of six cash payments a month among about 47 total payments, which leaves cash in third place among payment methods. Retailers and banks handling less currency have less reason to fund new lines, so vendors depend on repairs and conversions in this group. Suppliers can partly offset this by selling document and sample routes to the same owners.
The United States dominates while Mexico grows fastest
| Country | Value, 2025 (USD million) | Share, 2025 | CAGR, 2026–2035 |
|---|---|---|---|
| United States | 503.6 | 87.5% | 5.63% |
| Canada | 39.1 | 6.8% | 6.13% |
| Mexico | 32.8 | 5.7% | 7.03% |
United States holds the largest installed tube base
The United States held an 87.5% share of 2025 value and grows at 5.63% a year. Replacement and upgrade work adds to a large construction pipeline there. The American Hospital Association counted 6,100 hospitals with 907,216 staffed beds in its 2024 survey, and U.S. health care construction reached USD 6.64 billion in September 2026 alone. Domestic manufacturing also shortens service chains, since TransLogic says its systems are made in the United States, and Pevco operates from Baltimore.
Canada grows through provincial hospital rebuilds
Canada held a 6.8% share of 2025 value and grows at 6.13% a year. Provincial governments are funding large hospital replacements across the country. Ontario said in June 2025 that more than 50 major hospital projects were moving forward under a plan of nearly C$60 billion over 10 years. An older benchmark shows the scale involved, since the McGill University Health Centre estimated in February 2013 that its Glen site would handle about 5,000 transactions a day.
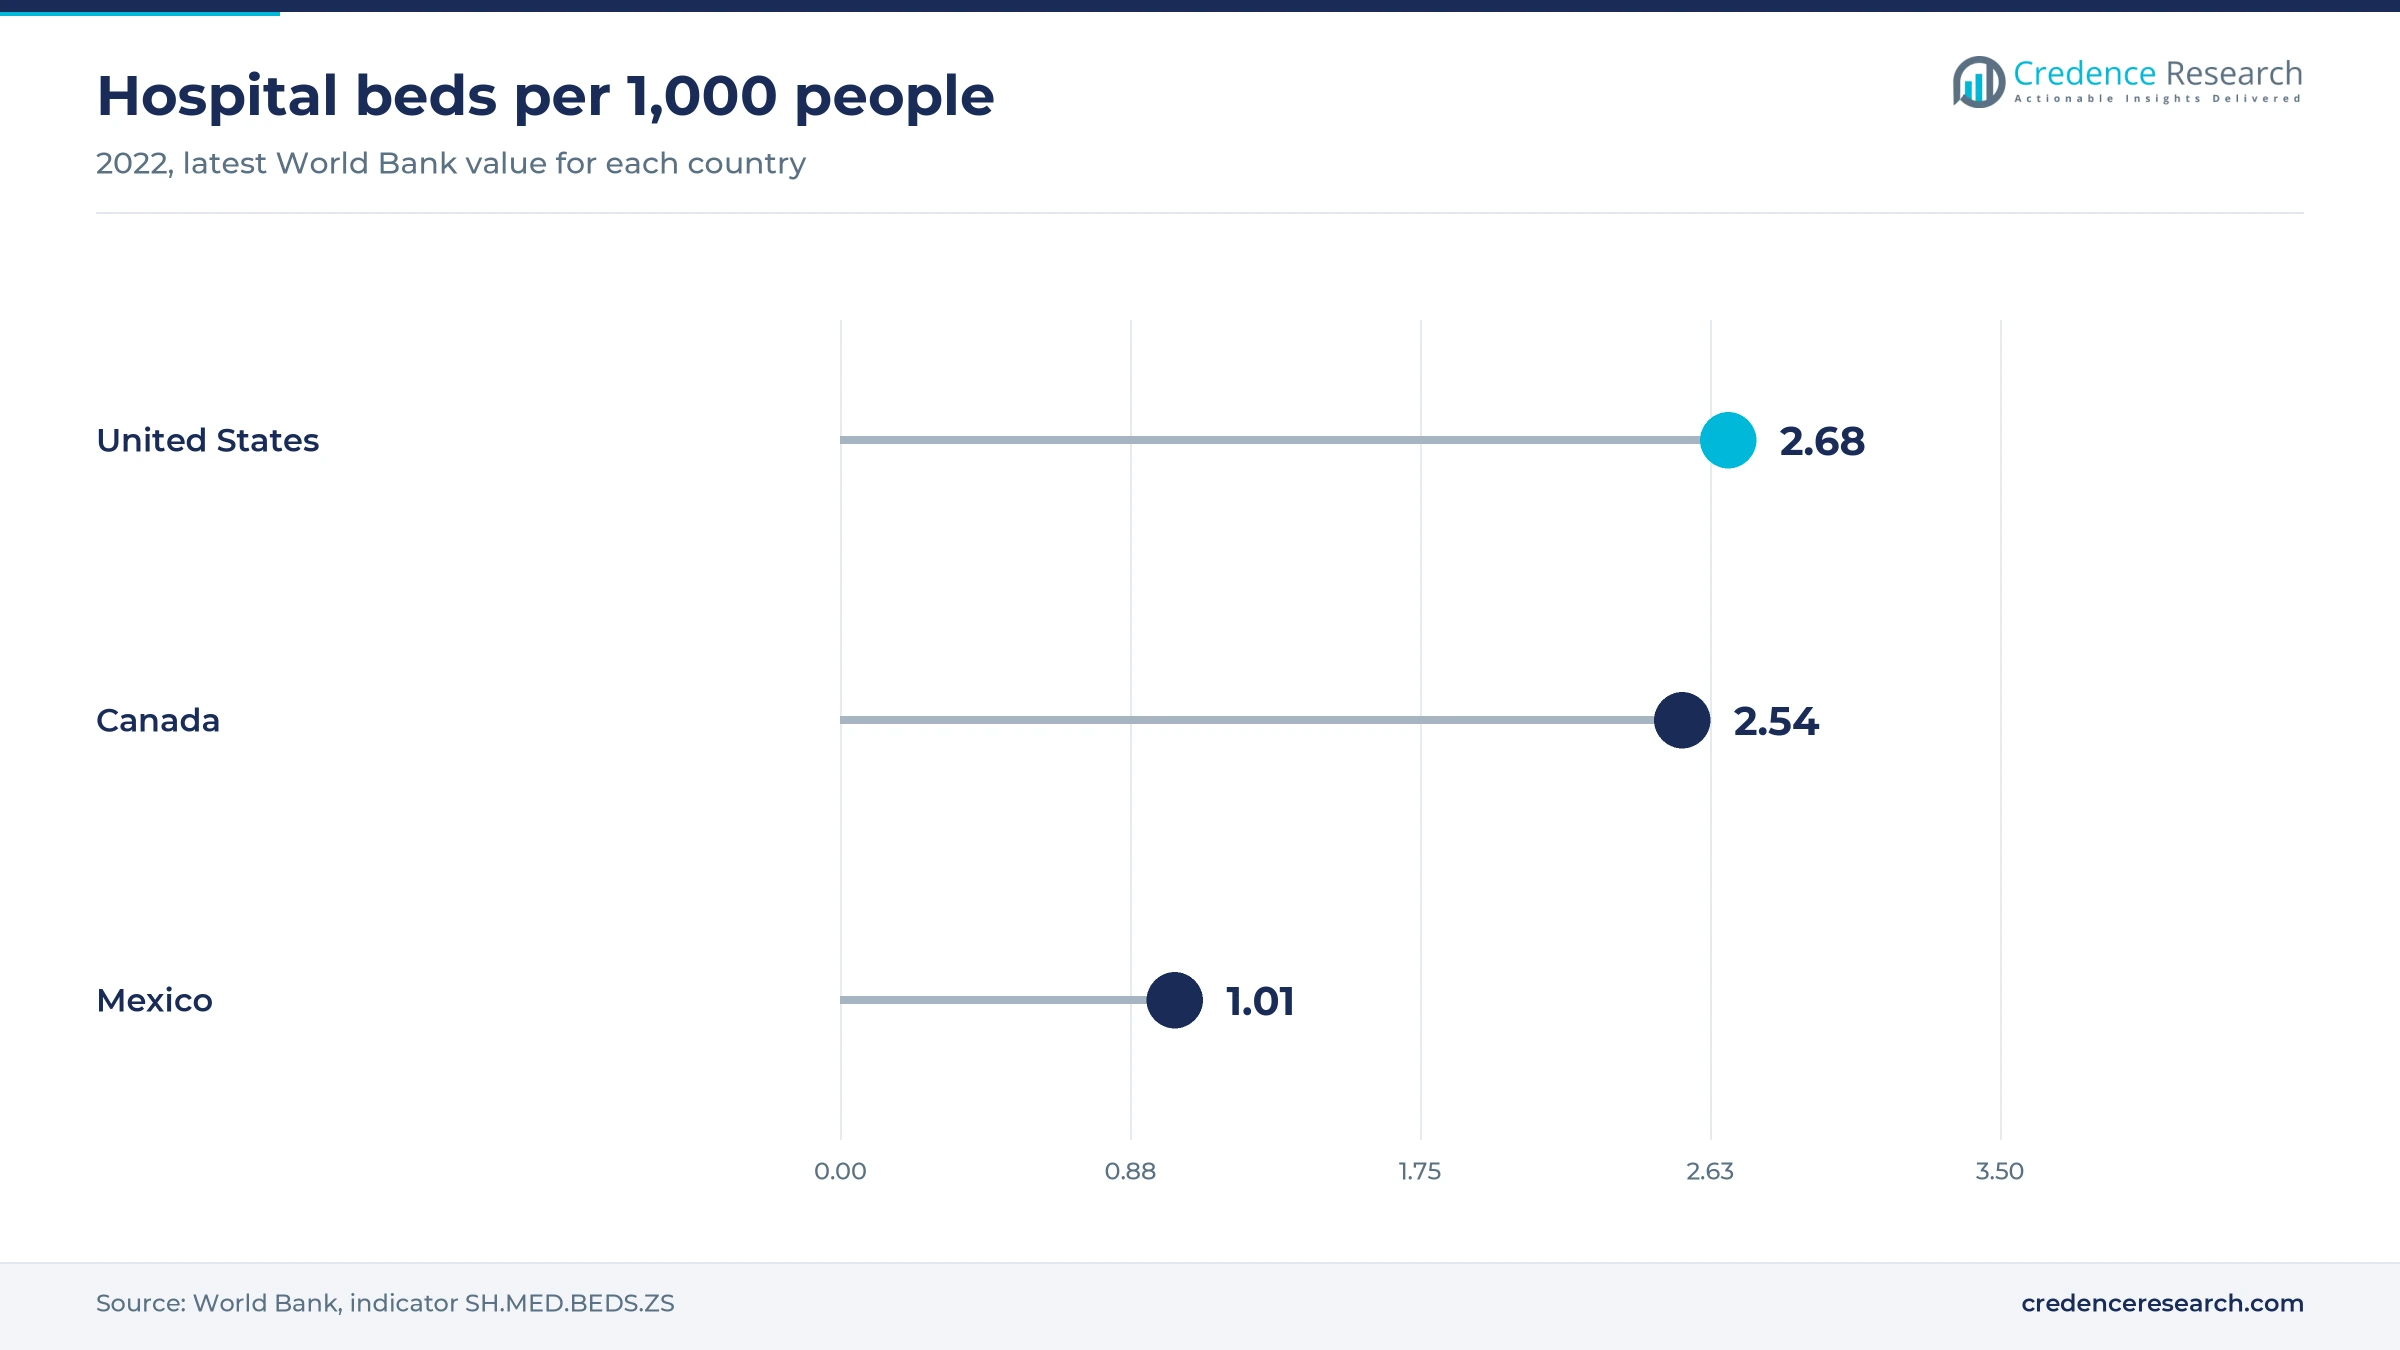
Mexico grows fastest from a small hospital base
Mexico held a 5.7% share of 2025 value and grows at 7.03% a year, the fastest rate in the region. Public hospital building is accelerating there from a low base of capacity. World Bank data show 1.01 hospital beds per 1,000 people in 2022, and the July 2026 federal plan aims to raise public beds from 96,966 to 106,105. The IMSS director general said 47 hospitals would be built and operating by 2030, which gives suppliers a defined target list.
Vendors and governments moved on tube projects in 2025–2026
| Development | Status and market relevance |
|---|---|
| In March 2025, TransLogic promoted its Design Assist preconstruction service at the PDC Summit in Atlanta. | Active service that brings tube planning into early hospital design |
| In June 2025, Ontario broke ground on the Peter Gilgan Mississauga Hospital, with more than 350 new beds in a new tower. | Under construction, part of a plan of nearly C$60 billion |
| In October 2025, Swisslog Healthcare and Diligent Robotics formed an alliance on autonomous last-mile hospital delivery. | Commercial offer that complements tube networks in U.S. hospitals |
| In January 2026, Clark Builders posted a pneumatic tube bid package for the Red Deer Hospital Redevelopment in Alberta. | Bid period closed Feb. 12, 2026, with award not confirmed |
| In July 2026, the Mexican government announced 152 hospital projects worth about 181 billion pesos through 2030. | Announced program covering new hospitals, expansions and replacements |
Controls and tracking now decide tube system upgrades
- Control software now carries the security case, since TransLogic ties Software Version 9 to secure, scalable hospital IT environments.
- Cloud monitoring gives operations teams remote visibility, and MYtranslogic shows system information on any internet-connected device.
- RFID carrier tracking links each load to its route, and the McGill University Health Centre described RFID-tagged capsules as early as February 2013.
- Controlled carrier speed protects specimens, since hospital carriers travel at 18 to 24 feet per second according to MIT Technology Review, against far higher speeds in industrial lines.
Need a Custom Version of This Report?
Tailor the scope, geography, or segments to your exact requirements.
- Custom geography or segment scope
- Direct access to our analyst team
A U.S. incumbent competes with specialist tube makers
Competition centers on design access, service reach and control software rather than on tube hardware alone. TransLogic, part of Swisslog Healthcare, holds the strongest hospital position, and Armis said in 2021 that its systems were used in about 80% of major North American hospitals. Pevco, based in Baltimore, competes as a specialist hospital supplier, while Aerocom Systems of Flowery Branch, Georgia, reaches retail, manufacturing and processing customers. Colombo Pneumatic Tube Systems offers direct delivery, point-to-point and heavy-duty systems, and it also sells conversions of existing networks at a lower cost than new installation. Owners comparing these suppliers also weigh other forms of automated material handling, particularly for heavy carts and linen. Because a network can stay in service for many years, the first design award often shapes later service, parts and software revenue for the incumbent supplier.
Companies profiled and their roles in this market
| Company | Type | Role in the market |
|---|---|---|
| TransLogic (Swisslog Healthcare) | Hospital tube system manufacturer | U.S.-made hospital networks with Design Assist, Software Version 9 and MYtranslogic monitoring |
| Pevco Systems International | Hospital tube system manufacturer | Baltimore-based supplier of hospital tube systems for specimens and pharmacy items |
| Aerocom Systems | Multi-sector tube system supplier | Flowery Branch, Georgia, supplier serving retail cash, manufacturing samples and process plants |
| Colombo Pneumatic Tube Systems | Tube system manufacturer and converter | Direct delivery, point-to-point and extreme duty systems, plus conversions of older networks |
Upgrade work steadies a market tied to hospital building
Credence Research's view is that upgrade work will steady a market otherwise tied to the timing of hospital construction. The strongest evidence is the mix of new builds in Ontario and Mexico alongside security pressure on older U.S. controllers, with TransLogic citing a 96% end-of-life software figure from a federal document in July 2026. Suppliers with a service presence in all three countries should gain most. However, buyers should test vendor savings claims against their own courier data, and they should validate routes for sensitive tests before commissioning new lines.
How Credence Research built this tube system estimate
The report uses 2025 as the base year and 2026–2035 as the forecast period. Market values come from the Credence Research model, and country, segment and growth splits are Credence Research estimates informed by public data. Sources used were government and statistical releases, hospital and company announcements, trade and news publications, and one peer-reviewed study. A bottom-up check used hospital counts and assumed unit values. No interviews or surveys were conducted for this edition, and figures from vendors are attributed to them as company statements.
Hospital capital plans set the pace through 2035
The market is forecast to rise from USD 616.0 million in 2026 to USD 1.02 billion by 2035, a 5.75% CAGR over 2026–2035. Hospital capital plans will set the pace, particularly the Ontario program and the Mexican plan through 2030. In the United States, replacement of older controls should matter as much as new towers, and that keeps Parts and Software ahead of other revenue streams. Robots will take some loads, yet specimens and medicines should stay on tubes, since hospitals value their fixed transit times and existing routes.
Frequently Asked Questions
How big is the North America pneumatic tube system market?
Which country leads the regional market?
Which country grows fastest through 2035?
Which system configuration holds the largest share?
What do hospitals send through tube networks?
Why do hospitals modernize existing tube networks?
What are the main challenges facing buyers?
Which companies are active in this market?
Table of Content
Chapter 1 Market Segmentation
- 1.1 Segmentation Framework
- 1.1.1 Product and Service Classification
- 1.1.2 Application and End-Use Classification
- 1.1.3 Technology and Solution Classification
- 1.1.4 Customer and Distribution Channel Classification
- 1.1.5 Geographic Segmentation
- 1.1.6 Market Segment Definitions and Boundaries
- 1.2 By System Configuration
- 1.2.1 Multiline Networks
- 1.2.2 Single-Line Networks
- 1.2.3 Point-to-Point Links
- 1.3 By End-Use Industry
- 1.3.1 Medical and Healthcare
- 1.3.2 Commercial Facilities
- 1.3.3 Industrial Facilities
- 1.3.4 Transport and Campus Facilities
- 1.4 By Revenue Stream
- 1.4.1 New Systems and Installation
- 1.4.2 Expansions and Major Upgrades
- 1.4.3 Service and Maintenance
- 1.4.4 Parts and Software
- 1.5 By Payload Type
- 1.5.1 Clinical Specimens and Blood Products
- 1.5.2 Medicines and Clinical Supplies
- 1.5.3 Cash and Documents
- 1.5.4 Production Samples and Small Parts
- 1.6 By Country
- 1.6.1 United States
- 1.6.2 Canada
- 1.6.3 Mexico
Chapter 2 Introduction
- 2.1 Report Objectives and Scope
- 2.2 Product Definition and Industry Terminology
- 2.3 Market Inclusions and Exclusions
- 2.4 Research Process
- 2.4.1 Primary Research and Expert Interviews
- 2.4.2 Secondary Research and Source Review
- 2.4.3 Top-Down and Bottom-Up Estimation
- 2.4.4 Data Triangulation and Verification
- 2.5 Market Size Measurement Basis
- 2.5.1 2025: USD 575.5 million → 2035: USD 1.02 billion
- 2.6 Historical and Forecast Reference Periods
- 2.6.1 Historical Period: 2018-2025
- 2.6.2 Base Year: 2025
- 2.6.3 Forecast Period: 2025-2035
- 2.7 Research Assumptions and Limitations
Chapter 3 Executive Summary
- 3.1 Market Snapshot and Key Findings
- 3.2 Base-Year Market Size, 2025
- 3.3 Forecast Market Size, 2035
- 3.4 Revenue and Volume Growth Outlook
- 3.5 Key Demand and Supply Indicators
- 3.6 Leading Market Segments
- 3.7 Fastest-Growing Market Opportunities
- 3.8 Regional Performance Highlights
- 3.9 Technology and Industry Transformation
- 3.10 Competitive Landscape Summary
- 3.11 Analyst View and Strategic Implications
Chapter 4 North America Pneumatic Tube System Market Trends and Developments
- 4.1 Historical Industry Development, 2018-2025
- 4.2 Recent Market Trends and Developments
- 4.3 Demand and Customer Behavior Trends
- 4.4 Technology and Product Innovation
- 4.5 Artificial Intelligence, Automation and Digitalization
- 4.6 Local Manufacturing and Supply Chain Realignment
- 4.7 Industry Partnerships, Mergers and Acquisitions
- 4.8 Sustainability and Circular Economy Developments
- 4.9 Government and Private Sector Investment Trends
- 4.10 Emerging Business Models and Commercialization
- 4.11 Industry Developments and Announcements
Chapter 5 North America Pneumatic Tube System Market Production, Supply and Demand Analysis
- 5.1 Demand Trend and Consumption Analysis, 2018-2025
- 5.2 Demand Forecast, 2025-2035
- 5.3 Production and Output Trend, 2018-2025
- 5.4 Production and Output Forecast, 2025-2035
- 5.5 Installed Capacity and Capacity Utilization
- 5.6 Company-Wise Production Plants and Statistics
- 5.6.1 Installed Production Capacity
- 5.6.2 Actual Production
- 5.6.3 Planned Capacity and Expansion Targets
- 5.7 Supply Chain Structure and Procurement Trends
- 5.8 Supply-Demand Gap and Bottlenecks
- 5.9 Import Dependence and Sourcing Structure
- 5.10 Contract Manufacturing and Outsourcing
- 5.11 Regional Supply and Demand Concentration
Chapter 6 North America Pneumatic Tube System Market Pricing Analysis
- 6.1 Pricing Structure and Measurement
- 6.2 Historical Pricing Trends, 2018-2025
- 6.3 Pricing Outlook, 2025-2035
- 6.4 Average Selling Price and Unit Economics
- 6.5 Pricing by Product and Market Segment
- 6.6 Geographic Pricing Differences
- 6.7 Key Input, Energy, Labor and Logistics Costs
- 6.8 Contract Pricing and Purchasing Models
- 6.9 Pricing Sensitivity and Competitive Positioning
- 6.10 Price, Margin and Profitability Implications
Chapter 7 North America Pneumatic Tube System Market Dynamics
- 7.1 Market Growth Drivers
- 7.1.1 Demand-Side Drivers
- 7.1.2 Technology and Innovation Drivers
- 7.1.3 Infrastructure and Investment Drivers
- 7.1.4 Regulatory and Policy Drivers
- 7.2 Market Restraints
- 7.2.1 Cost and Affordability Constraints
- 7.2.2 Technology and Adoption Barriers
- 7.2.3 Supply Chain and Operational Constraints
- 7.3 Market Challenges
- 7.3.1 Competitive Pressure and Margin Erosion
- 7.3.2 Skills, Infrastructure and Implementation Gaps
- 7.4 Emerging Market Opportunities
- 7.5 Market Dynamics Impact and Time-Horizon Assessment
Chapter 8 North America Pneumatic Tube System Value Chain Analysis
- 8.1 Industry Value Chain Overview
- 8.2 Upstream Suppliers and Critical Inputs
- 8.3 Technology and Component Providers
- 8.4 Manufacturing or Service Delivery
- 8.5 Distribution, Channel Partners and Integrators
- 8.6 Downstream Applications and End Users
- 8.7 Value Addition and Profit Pools
- 8.8 Vertical Integration and Outsourcing
- 8.9 Supplier Concentration and Risk
- 8.10 Supply Chain Localization and Resilience
Chapter 9 North America Pneumatic Tube System Market Regulations and Policies
- 9.1 Relevant Laws, Standards and Compliance Frameworks
- 9.2 Product, Service, Safety and Quality Requirements
- 9.3 Government Policies, Incentives and Subsidies
- 9.4 Imports, Exports and Trade Barriers
- 9.5 Public Procurement and Local Content Requirements
- 9.6 Environmental and Sustainability Compliance
- 9.7 Upcoming Policy Changes and Market Implications
Chapter 10 North America Pneumatic Tube System Market Hotspots and Opportunities
- 10.1 Market Opportunity Mapping and Growth Hotspots
- 10.2 High-Growth Applications and Customer Groups
- 10.3 Underserved Markets and White-Space Opportunities
- 10.4 Emerging Technology and Product Opportunities
- 10.5 New Capacity and Investment Hotspots
- 10.6 Market Entry and Expansion Opportunities
- 10.7 Distribution and Partnership Opportunities
- 10.8 Near-Term and Long-Term Commercial Potential
- 10.9 Opportunity Attractiveness and Execution Risks
Chapter 11 North America Pneumatic Tube System Market Outlook, 2025-2035
- 11.1 Market Size and Analysis
- 11.1.1 Revenue (Market Measurement: 2025: USD 575.5 million → 2035: USD 1.02 billion)
- 11.1.2 Market Volume and Quantity Sold
- 11.1.3 Historical Market Size, 2018-2025
- 11.1.4 Base-Year Market Size, 2025
- 11.2 Market Forecast, 2025-2035
- 11.2.1 Revenue Forecast to 2035
- 11.2.2 Volume Forecast to 2035
- 11.2.3 CAGR and Year-on-Year Growth
- 11.2.4 Incremental Revenue Opportunity
- 11.3 Forecast Assumptions and Scenario Analysis
- 11.3.1 Base-Case Forecast
- 11.3.2 Optimistic and Conservative Scenarios
- 11.3.3 Technology, Pricing and Policy Sensitivities
- 11.4 Market Attractiveness and Growth Outlook
Chapter 12 North America Pneumatic Tube System Market Segmentation and Outlook
- 12.1 Segmentation Summary and Market Shares, 2025
- 12.2 Largest and Fastest-Growing Segments
- 12.3 By System Configuration - Market Size and Forecast, 2025-2035
- 12.3.1 Segment Definition and Scope
- 12.3.2 Historical Market Size, 2018-2025
- 12.3.3 Revenue Forecast, 2025-2035
- 12.3.4 Volume Forecast, 2025-2035
- 12.3.5 Base-Year Market Share, 2025
- 12.3.6 Segment CAGR and Growth Drivers
- 12.3.7 Subsegment Market Size and Forecast
- 12.3.7.1 Multiline Networks
- 12.3.7.2 Single-Line Networks
- 12.3.7.3 Point-to-Point Links
- 12.3.8 Subsegment Pricing and Adoption Trends
- 12.3.9 Leading Suppliers and Competition
- 12.3.10 Regional Demand and Opportunities
- 12.4 By End-Use Industry - Market Size and Forecast, 2025-2035
- 12.4.1 Segment Definition and Scope
- 12.4.2 Historical Market Size, 2018-2025
- 12.4.3 Revenue Forecast, 2025-2035
- 12.4.4 Volume Forecast, 2025-2035
- 12.4.5 Base-Year Market Share, 2025
- 12.4.6 Segment CAGR and Growth Drivers
- 12.4.7 Subsegment Market Size and Forecast
- 12.4.7.1 Medical and Healthcare
- 12.4.7.2 Commercial Facilities
- 12.4.7.3 Industrial Facilities
- 12.4.7.4 Transport and Campus Facilities
- 12.4.8 Subsegment Pricing and Adoption Trends
- 12.4.9 Leading Suppliers and Competition
- 12.4.10 Regional Demand and Opportunities
- 12.5 By Revenue Stream - Market Size and Forecast, 2025-2035
- 12.5.1 Segment Definition and Scope
- 12.5.2 Historical Market Size, 2018-2025
- 12.5.3 Revenue Forecast, 2025-2035
- 12.5.4 Volume Forecast, 2025-2035
- 12.5.5 Base-Year Market Share, 2025
- 12.5.6 Segment CAGR and Growth Drivers
- 12.5.7 Subsegment Market Size and Forecast
- 12.5.7.1 New Systems and Installation
- 12.5.7.2 Expansions and Major Upgrades
- 12.5.7.3 Service and Maintenance
- 12.5.7.4 Parts and Software
- 12.5.8 Subsegment Pricing and Adoption Trends
- 12.5.9 Leading Suppliers and Competition
- 12.5.10 Regional Demand and Opportunities
- 12.6 By Payload Type - Market Size and Forecast, 2025-2035
- 12.6.1 Segment Definition and Scope
- 12.6.2 Historical Market Size, 2018-2025
- 12.6.3 Revenue Forecast, 2025-2035
- 12.6.4 Volume Forecast, 2025-2035
- 12.6.5 Base-Year Market Share, 2025
- 12.6.6 Segment CAGR and Growth Drivers
- 12.6.7 Subsegment Market Size and Forecast
- 12.6.7.1 Clinical Specimens and Blood Products
- 12.6.7.2 Medicines and Clinical Supplies
- 12.6.7.3 Cash and Documents
- 12.6.7.4 Production Samples and Small Parts
- 12.6.8 Subsegment Pricing and Adoption Trends
- 12.6.9 Leading Suppliers and Competition
- 12.6.10 Regional Demand and Opportunities
- 12.7 By Country - Market Size and Forecast, 2025-2035
- 12.7.1 Segment Definition and Scope
- 12.7.2 Historical Market Size, 2018-2025
- 12.7.3 Revenue Forecast, 2025-2035
- 12.7.4 Volume Forecast, 2025-2035
- 12.7.5 Base-Year Market Share, 2025
- 12.7.6 Segment CAGR and Growth Drivers
- 12.7.7 Subsegment Market Size and Forecast
- 12.7.7.1 United States
- 12.7.7.2 Canada
- 12.7.7.3 Mexico
- 12.7.8 Subsegment Pricing and Adoption Trends
- 12.7.9 Leading Suppliers and Competition
- 12.7.10 Regional Demand and Opportunities
- 12.8 Segment Growth Comparison
- 12.9 Segment Attractiveness and Priority Matrix
Chapter 13 North America Pneumatic Tube System End-Use and Application Market Outlook
- 13.1 End-Use Industry and Customer Demand Structure
- 13.2 Leading Applications and Customer Groups
- 13.3 End-Use Market Size, Share and Forecast
- 13.4 Major End-Use Industry Deep Dives
- 13.4.1 Customer Requirements and Use Cases
- 13.4.2 Demand and Replacement Cycles
- 13.4.3 Technical and Regulatory Considerations
- 13.4.4 Purchasing and Procurement Models
- 13.4.5 Leading Vendors and Distribution Channels
- 13.4.6 Forecast and Commercial Opportunities
- 13.5 Emerging Applications and Cross-Segment Demand
- 13.6 End-Use Industry Investment Priorities
Chapter 14 North America Pneumatic Tube System Geographic Market Outlook, 2025-2035
- 14.1 Regional Market Size and Country-Level Shares, 2025
- 14.2 Country Market Size Comparison, 2025
- 14.3 Country Market Forecasts, 2025-2035
- 14.4 Subregional Industrial and Demand Clusters
- 14.5 Intra-Regional Pricing and Cost Differences
- 14.6 Cross-Border Trade and Supply Networks
- 14.7 Regional Supply and Demand Balances
- 14.8 Country Opportunity Comparison and Prioritization
Note: Every listed country is covered on the structure shown under the first country.
Chapter 15 North America Pneumatic Tube System Technology, Innovation and Sustainability Outlook
- 15.1 Technology Landscape and Maturity
- 15.2 Product, Process and Service Innovation
- 15.3 AI, Automation and Digital Tools in the Industry
- 15.4 Technology Adoption and Performance Benchmarking
- 15.5 Innovation Pipeline and R&D Investment
- 15.6 Patent and Intellectual Property Trends
- 15.7 Energy Efficiency and Resource Management
- 15.8 Sustainability, Recycling and Circularity
- 15.9 Technology Roadmap, 2025-2035
- 15.10 Risks of Obsolescence and Technology Substitution
Chapter 16 North America Pneumatic Tube System Market Key Strategic Imperatives
- 16.1 Growth and Market Entry Priorities
- 16.2 High-Return Products and Segments
- 16.3 Pricing, Profitability and Cost Optimization
- 16.4 Technology Investment and Product Differentiation
- 16.5 Supply Chain Localization and Resilience
- 16.6 Distribution and Customer Acquisition
- 16.7 Partnership, Acquisition and Capacity Strategy
- 16.8 Regional Expansion Priorities
- 16.9 Short-, Medium- and Long-Term Actions
Chapter 17 Competition Outlook
- 17.1 Industry Competition Characteristics
- 17.2 Market Structure and Concentration
- 17.3 Market Share and Competitive Positioning, 2025
- 17.4 Company-Wise Revenue and Product Benchmarking
- 17.5 Production and Service Capacity Benchmarking
- 17.6 Technology, Pricing and Differentiation
- 17.7 Regional Footprint and Distribution Strength
- 17.8 Mergers, Acquisitions and Strategic Alliances
- 17.9 New Entrants and Competitive Threats
- 17.10 Porter's Five Forces and Industry Attractiveness
- 17.11 Competitive Outlook, 2025-2035
Chapter 18 Company Profiles
- 18.1 Company Coverage and Selection Criteria
- 18.2 TransLogic (Swisslog Healthcare)
- 18.2.1 Business Description
- 18.2.2 Company Ownership and Geographic Presence
- 18.2.3 Product and Service Portfolio
- 18.2.4 Manufacturing and Operating Footprint
- 18.2.5 Production Capacity and Expansion Plans
- 18.2.6 Financial Performance and Investment
- 18.2.7 Market Share and Competitive Position
- 18.2.8 Technology and Innovation Capabilities
- 18.2.9 Strategic Alliances or Partnerships
- 18.2.10 Recent Developments
- 18.2.11 Growth Strategy and Outlook
- 18.3 Pevco Systems International
- 18.4 Aerocom Systems
- 18.5 Colombo Pneumatic Tube Systems
- 18.6 Other Relevant Market Participants
Note: Every listed company is profiled on the structure shown under the first company. The company list is preliminary and may change based on research findings, market developments, data availability and client requirements.
Chapter 19 Disclaimer
- 19.1 Research and Forecast Disclaimer
- 19.2 Data Source and Estimation Limitations
Note: The depth of individual sections depends on data availability for this market. Volume, capacity, trade and other unit-based metrics are included where applicable.

