
Parcel hubs and export plants anchor automation spending
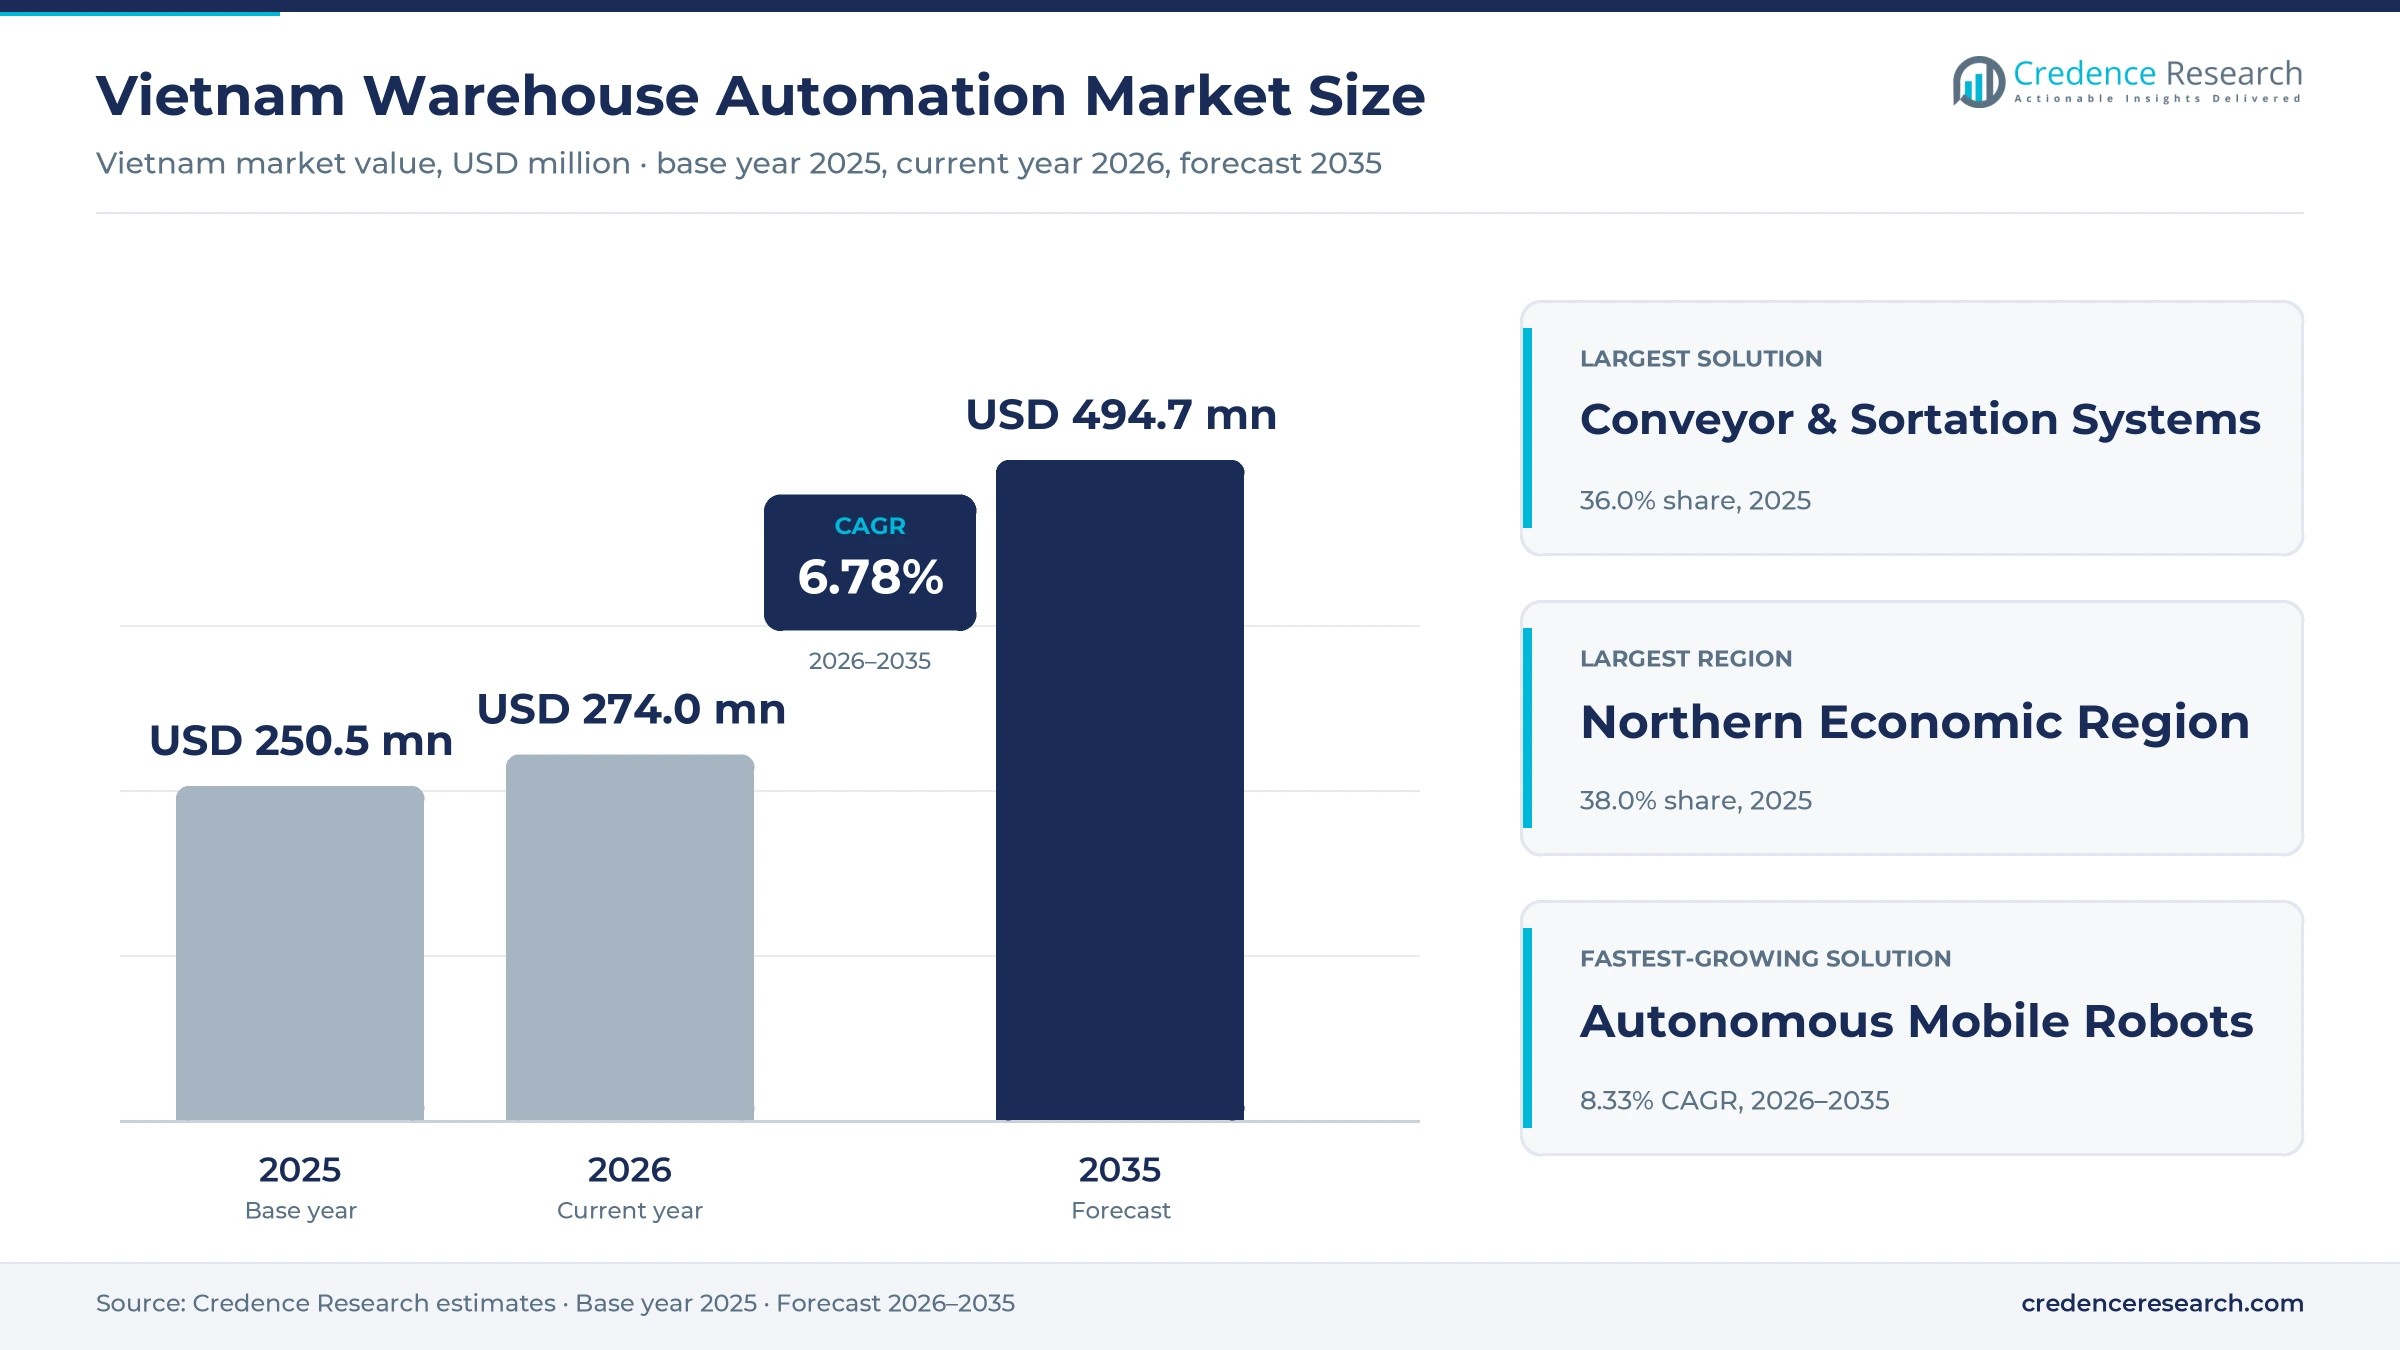
The Vietnam warehouse automation market was valued at USD 250.5 million in 2025 and is projected to increase from USD 274.0 million in 2026 to USD 494.7 million by 2035, registering a CAGR of 6.78% during 2026–2035. Demand comes from parcel carriers, online marketplaces, third-party logistics operators, export electronics plants and cold chain operators that replace manual sorting, racking and forklift moves with conveyors, stacker cranes, shuttles, mobile robots and control software. The Northern Economic Region held the largest regional share, 38.0% in 2025, because Hanoi, Bac Ninh, Thai Nguyen and Hai Phong host the densest cluster of electronics plants and national sort hubs. The same northern region is also the fastest-growing one at 7.17% a year, as port-linked industrial parks keep adding capacity. Large carriers now run robot-based sorting at national scale, which has turned automation from a pilot into a standard requirement in new hub tenders. Vietnamese integrators have also begun to make shuttles and storage systems locally, which lowers entry costs for mid-sized operators.
Which systems and services fall inside this estimate?
Spending on automated equipment and software installed in Vietnamese warehouses, distribution centers, parcel hubs and factory stores is counted here. The scope covers AS/RS systems, conveyor and sortation systems, autonomous mobile robots and warehouse software and control systems, together with design, installation and integration fees paid to suppliers.
The estimate excludes manual racking, forklifts, warehouse property, labor and freight transport outside the building. The value chain runs from global system makers and robot suppliers through Vietnamese integrators and racking makers to carriers, marketplaces, contract logistics firms, export manufacturers and cold chain operators.
Vietnam Warehouse Automation Market Insights
- The Vietnam warehouse automation market was valued at USD 250.5 million in 2025 and is projected to reach USD 494.7 million by 2035, registering a CAGR of 6.78% during 2026–2035.
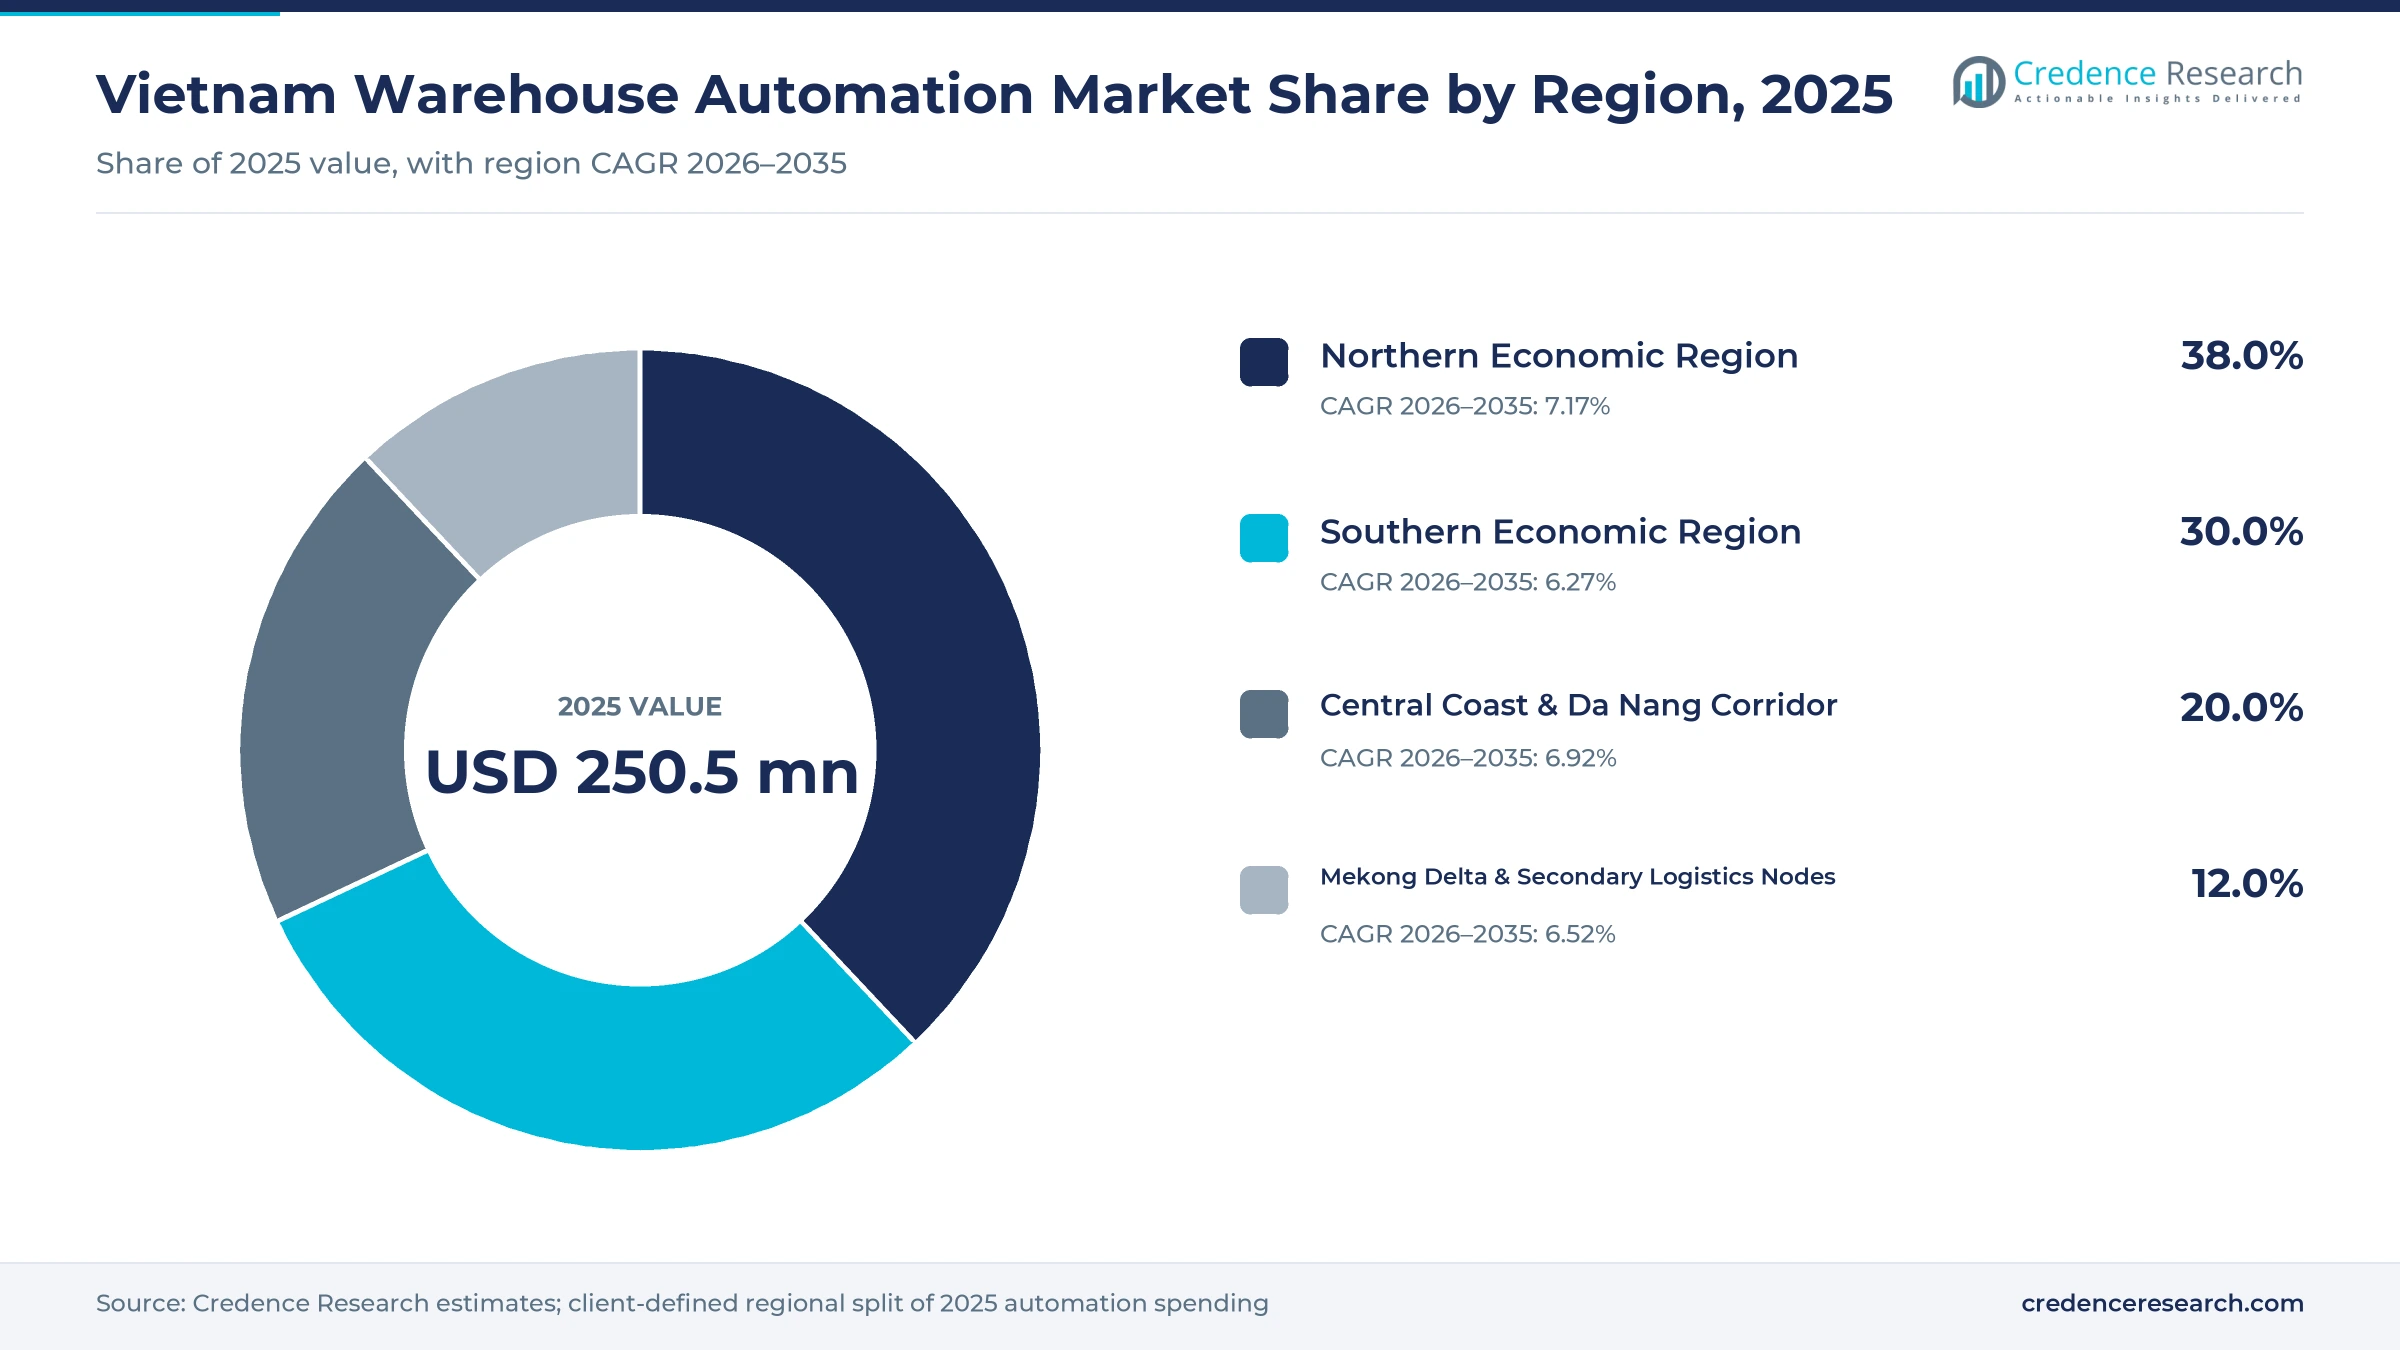
- The Northern Economic Region held a 38.0% share of 2025 value, because its electronics plants and national sort hubs buy the most automated systems.
- Conveyor and sortation systems led solution demand with a 36.0% share of 2025 value, because parcel carriers automated their hubs first.
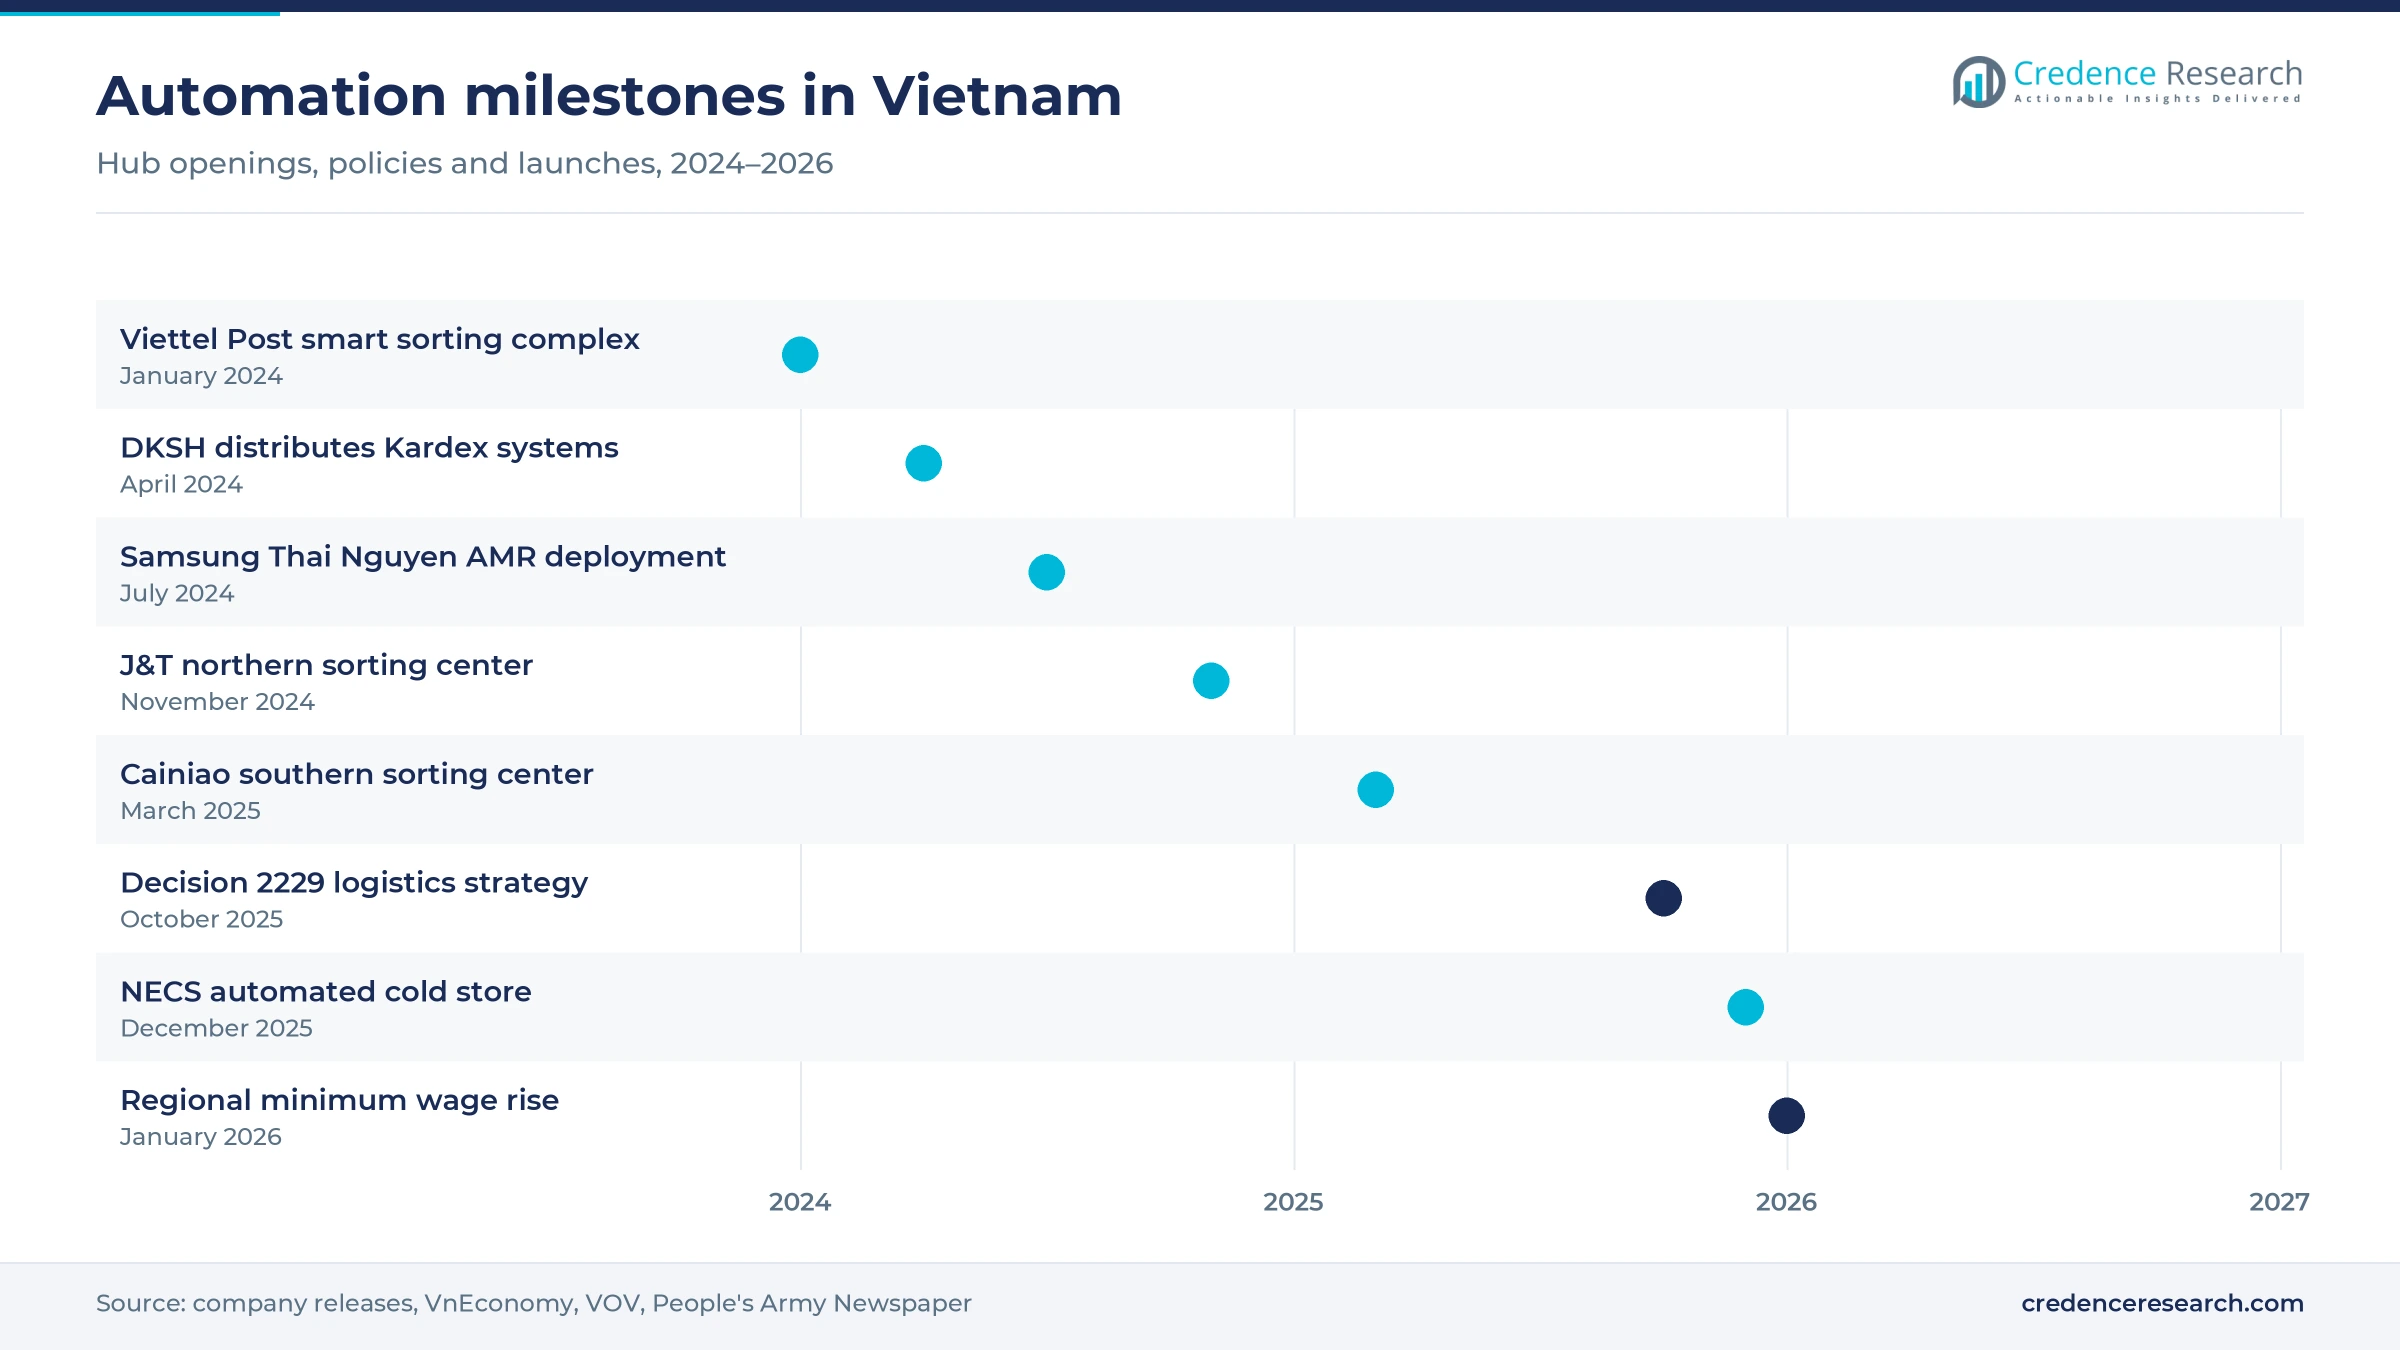
- Viettel Post opened a smart sorting complex on Jan. 17, 2024, with nearly 1,200 sorting ports and capacity for 1.4 million parcels a day.
- Decision 2229/QD-TTg of Oct. 9, 2025, targets logistics services growth of 12% to 15% a year, which supports new automated capacity.
Sortation leads while mobile robots grow fastest
Why do sortation lines take the largest budget share?
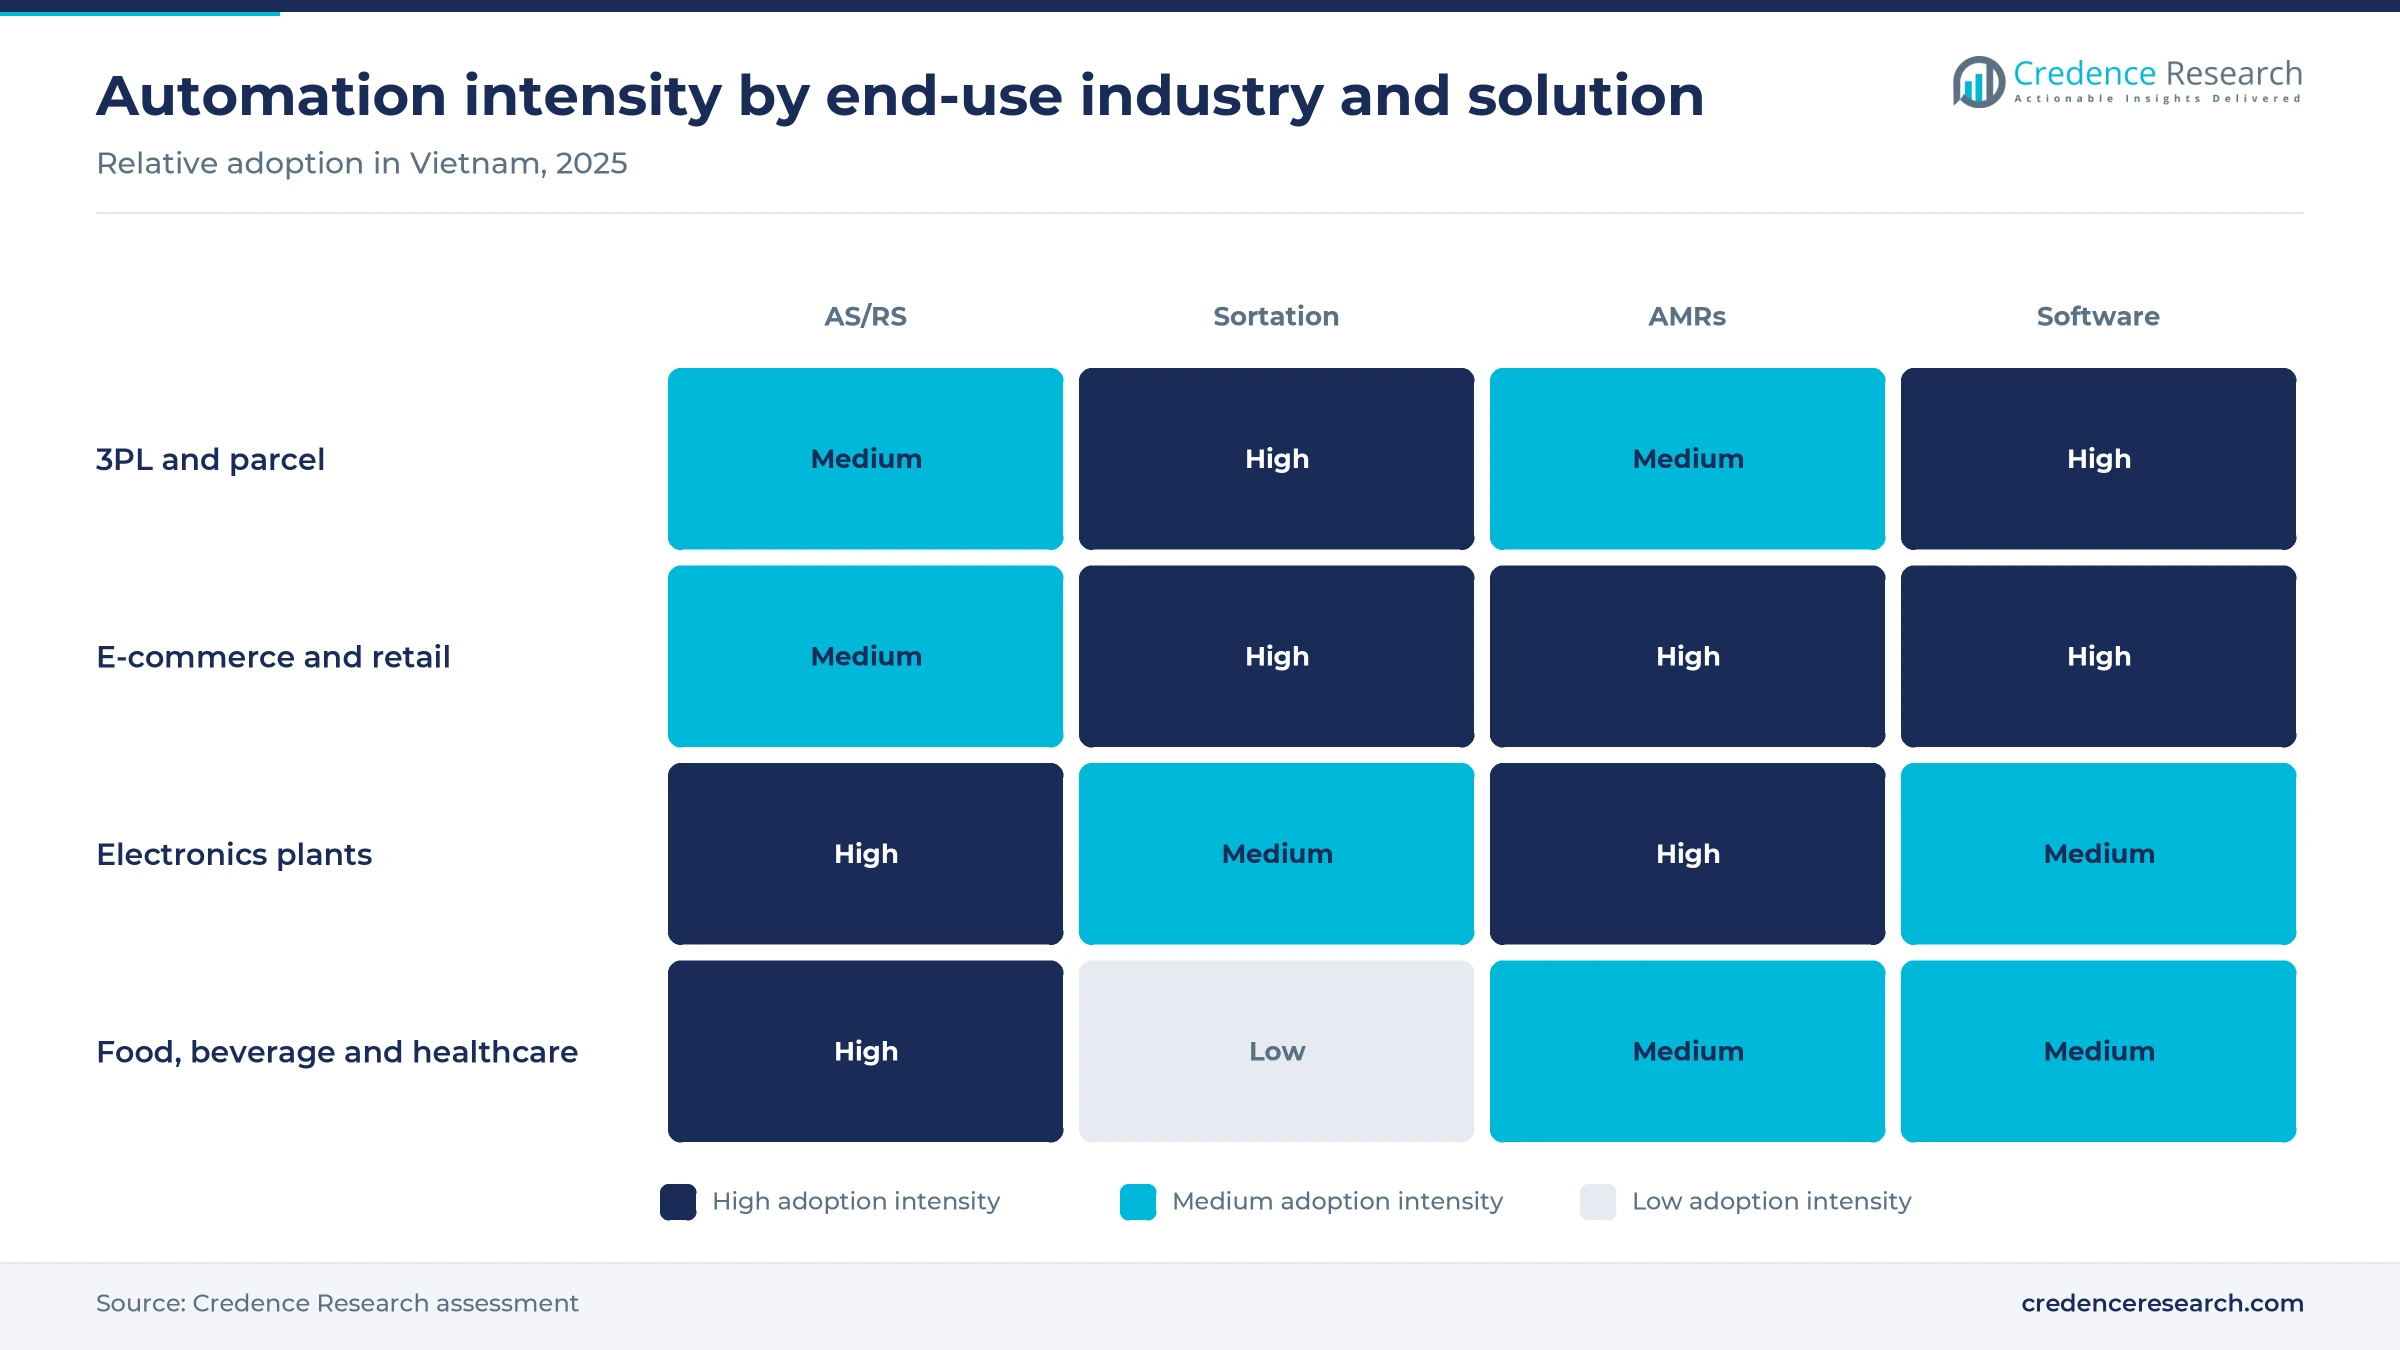
Based on solution type, the market is categorized into AS/RS systems, conveyor and sortation systems, autonomous mobile robots and warehouse software and control systems. Conveyor & Sortation Systems led with a 36.0% share of 2025 value, because carriers built cross-belt and wheel sorter hubs to handle online parcel peaks. Autonomous Mobile Robots grow fastest at 8.33% a year, as plants and contract sites add robot fleets without rebuilding racking.
How do parcel carriers and online retailers shape demand?
Based on end-use industry, the market is categorized into e-commerce and omnichannel retail, third-party logistics and parcel, electronics and advanced manufacturing, and food, beverage and healthcare logistics. Third-Party Logistics & Parcel led with a 32.0% share of 2025 value, because national carriers run the largest automated hubs. E-Commerce & Omnichannel Retail grows fastest at 7.29% a year, as marketplaces and brands build their own fulfillment sites.
Why are phased projects gaining on full greenfield builds?
Based on deployment model, the market is categorized into greenfield integrated deployment, brownfield retrofit, modular phased automation and robotics-as-a-service. Greenfield Integrated Deployment led with a 44.0% share of 2025 value, because new hubs and cold stores are designed around automation from the start. Robotics-as-a-Service grows fastest at 8.72% a year, as mid-sized operators rent robots instead of committing capital up front.
| Segment Group | Leading Sub-segment | Share, 2025 | Fastest-growing Sub-segment | CAGR, 2026–2035 |
|---|---|---|---|---|
| By Solution Type | Conveyor & Sortation Systems | 36.0% | Autonomous Mobile Robots | 8.33% |
| By End-Use Industry | Third-Party Logistics & Parcel | 32.0% | E-Commerce & Omnichannel Retail | 7.29% |
| By Deployment Model | Greenfield Integrated Deployment | 44.0% | Robotics-as-a-Service | 8.72% |
Request a Free Sample
Fill in your details and we'll send you a free sample report.
- Sample data tables & charts
- Research methodology
Online orders, export plants and policy lift demand
How does e-commerce fulfillment intensity raise parcel volumes?
Online orders arrive as many small parcels, which pushes carriers and marketplaces to replace manual sorting with automated lines. E-commerce sales reached USD 32 billion in 2025, nearly 12% of retail sales and up more than 20% from 2024, according to a Ministry of Industry and Trade market report summarized by VietNamNet. The same report expects online sales to reach USD 50 billion by 2030, which keeps hub capacity under pressure. Viettel Post said its automated network handles 4 million parcels a day, about half of national e-commerce capacity. As a result, e-commerce and omnichannel retail grows at 7.29% a year, the fastest end-use rate, while sortation keeps 36.0% of value.
Why do export plants need more complex inventory handling?
Export manufacturers hold thousands of components and finished goods, which makes manual storage too slow and error-prone for global customers. Vietnam exported USD 475.04 billion of goods in 2025, up 17%, and the foreign-invested sector supplied 77.3% of that value, according to the National Statistics Office. Registered foreign investment exceeded USD 38.4 billion in 2025, and manufacturing took 56.5% of newly registered capital, the statistics office reported. Samsung Electronics' Thai Nguyen plant began using Phenikaa-X pallet-moving robots with a 1,000-kilogram payload in 2024. In turn, electronics and advanced manufacturing holds a large part of demand, and northern plant clusters buy the most AS/RS and robot systems.
How do digital logistics returns improve technology readiness?
Operators now see clear labor and accuracy gains from automation, which makes boards more willing to approve large projects. Viettel Post said its smart sorting complex, opened on Jan. 17, 2024, optimized personnel costs by 60% and raised output 3.5 times, according to the People's Army Newspaper. The complex has more than 40 import and export ports, nearly 1,200 sorting ports and AGV sorting robots. J&T Express also opened its largest northern sorting center in November 2024, reporting 99.99% parcel handling accuracy during the Double 11 peak. As a result, warehouse software and control systems gain budget alongside hardware, and carriers now expect measurable payback in every new hub tender.
Why does national logistics policy support automated capacity?
Government targets for faster and cheaper logistics push operators to build modern hubs rather than extend old sheds. Decision 2229/QD-TTg, signed on Oct. 9, 2025, sets logistics services growth of 12% to 15% a year and a contribution of 5% to 7% of GDP, according to VnEconomy. The strategy also targets an outsourcing rate of 70% to 80% and a place among the top 40 countries in the World Bank logistics index. Vietnam's GDP reached about USD 514.7 billion in 2025, according to World Bank data, which widens the freight base these hubs serve. In turn, greenfield integrated deployment leads with 44.0% of value.
Robot fleets, cold stores and local makers reshape supply
How is the shift to mobile robot fleets changing site design?
Operators are adding mobile robots to existing buildings, which shifts spending away from fixed conveyors in brownfield sites. Viettel showed AGV picking robots with a 1-ton load capacity and robotic arms with computer vision as part of its logistics automation chain, according to the People's Army Newspaper. Samsung Electronics' Thai Nguyen plant was the first Samsung factory to use Phenikaa-X robots in production, and the robots follow the VDA 5050 interface standard. THACO also showed a 350-kilogram indoor warehouse robot using LiDAR and SLAM navigation in late 2023. As a result, autonomous mobile robots grow at 8.33% a year, because buyers can scale a fleet by adding units.
Why is the rise of automated cold storage emerging now?
Seafood, fruit and pharmaceutical exporters need deep-freeze capacity close to ports, which favors fully automated high-bay cold stores. New Era Cold Storage began operating an automated cold store in Tay Ninh province with up to 110,000 pallet positions, according to VOV in December 2025. The site runs 15 robots on a 19-tier racking system across temperatures from minus 22 to plus 25 degrees Celsius. It was also the first digital cold bonded warehouse approved by Vietnam Customs, which links storage with export clearance. As a result, food, beverage and healthcare logistics grows at a steady pace, and new cold stores are designed around automation from the first drawing.
Can locally made shuttles and AS/RS open the mid-market?
Vietnamese racking makers now build shuttles and storage systems at home, which opens an opportunity among mid-sized operators that found imported systems too costly. Vinatech Group showed its AutoS AS/RS, four-way and two-way pallet shuttles and WMS at VILOG 2026 in Ho Chi Minh City from July 30 to Aug. 1, 2026. The group runs two Vietnamese factories with more than 50,000 square meters and exports racking to Australia, Thailand and the United States. PNC TECH also offers stacker cranes, mini-load systems and AMRs from its Soc Son factory near Hanoi. As a result, modular phased automation grows at 8.72% a year, the fastest deployment rate.
Is there an opening in multi-client sortation for regional carriers?
Large sort hubs are expensive, which creates an opening for operators that sell automated sorting capacity to several carriers and marketplaces. Cainiao handed over what it called southern Vietnam's largest automated sorting center in March 2025, using multi-layer cross-belt sorters and robots with accuracy above 99%. Viettel Post runs automated centers in Hanoi's Quang Minh Industrial Park and in Lang Son near the Chinese border. Its network capacity of 4 million parcels a day shows how quickly volumes concentrate in a few hubs. As a result, third-party logistics and parcel keeps 32.0% of value, and suppliers of automated sortation systems compete for new hub tenders.
Thin margins, skills gaps and capital costs slow adoption
How do thin logistics margins delay large projects?
Many Vietnamese logistics firms are small, so they struggle to finance automated systems that pay back over several years. As a result, large projects remain concentrated among national carriers, marketplaces and foreign-invested manufacturers. Smaller firms keep manual racking and forklifts until customers demand faster service. Suppliers respond with phased projects, equipment leasing and robots rented by the month. This approach lets smaller operators automate one process first and expand once volumes justify the next step.
Why do skills gaps raise integration risk?
Automated sites need engineers who can run control software, maintain robots and tune sorting logic, and such staff remain scarce outside Hanoi and Ho Chi Minh City. In turn, projects in secondary provinces often depend on supplier engineers flown in for maintenance. This raises downtime risk and service costs for operators in every province. Integrators respond by opening regional offices, as Intech Group has done in Hanoi, Da Nang and Ho Chi Minh City. Some also train customer technicians during commissioning, which shortens response times after handover.
How does capital cost slow brownfield upgrades?
Older warehouses often have low ceilings, weak floors and narrow aisles, which limits the systems they can host without costly rebuilds. As a result, brownfield retrofit grows more slowly than other models. Operators must choose between expensive structural work and a move to new industrial parks. Many respond with mobile robots, vertical lift modules and modular conveyor systems that fit existing buildings. These options cost less up front and can move with the operator when a lease ends.
Why do rising wages create cost pressure before payback?
Regional minimum wages rose by an average of 7.2% from Jan. 1, 2026, under Decree 293/2025/ND-CP, which lifts manual operating costs. However, operators must commit capital before labor savings appear in their accounts. In turn, firms on short customer contracts hesitate to invest in fixed systems. Suppliers respond with rental models and payback guarantees tied to throughput. Because wages will keep rising each year, the business case for automation strengthens even for operators that delay investment today.
The north leads and grows fastest on electronics output
| Region | Value, 2025 (USD million) | Share, 2025 | CAGR, 2026–2035 |
|---|---|---|---|
| Northern Economic Region | 95.2 | 38.0% | 7.17% |
| Southern Economic Region | 75.2 | 30.0% | 6.27% |
| Central Coast & Da Nang Corridor | 50.1 | 20.0% | 6.92% |
| Mekong Delta & Secondary Logistics Nodes | 30.1 | 12.0% | 6.52% |
Why does the northern electronics belt lead spending?
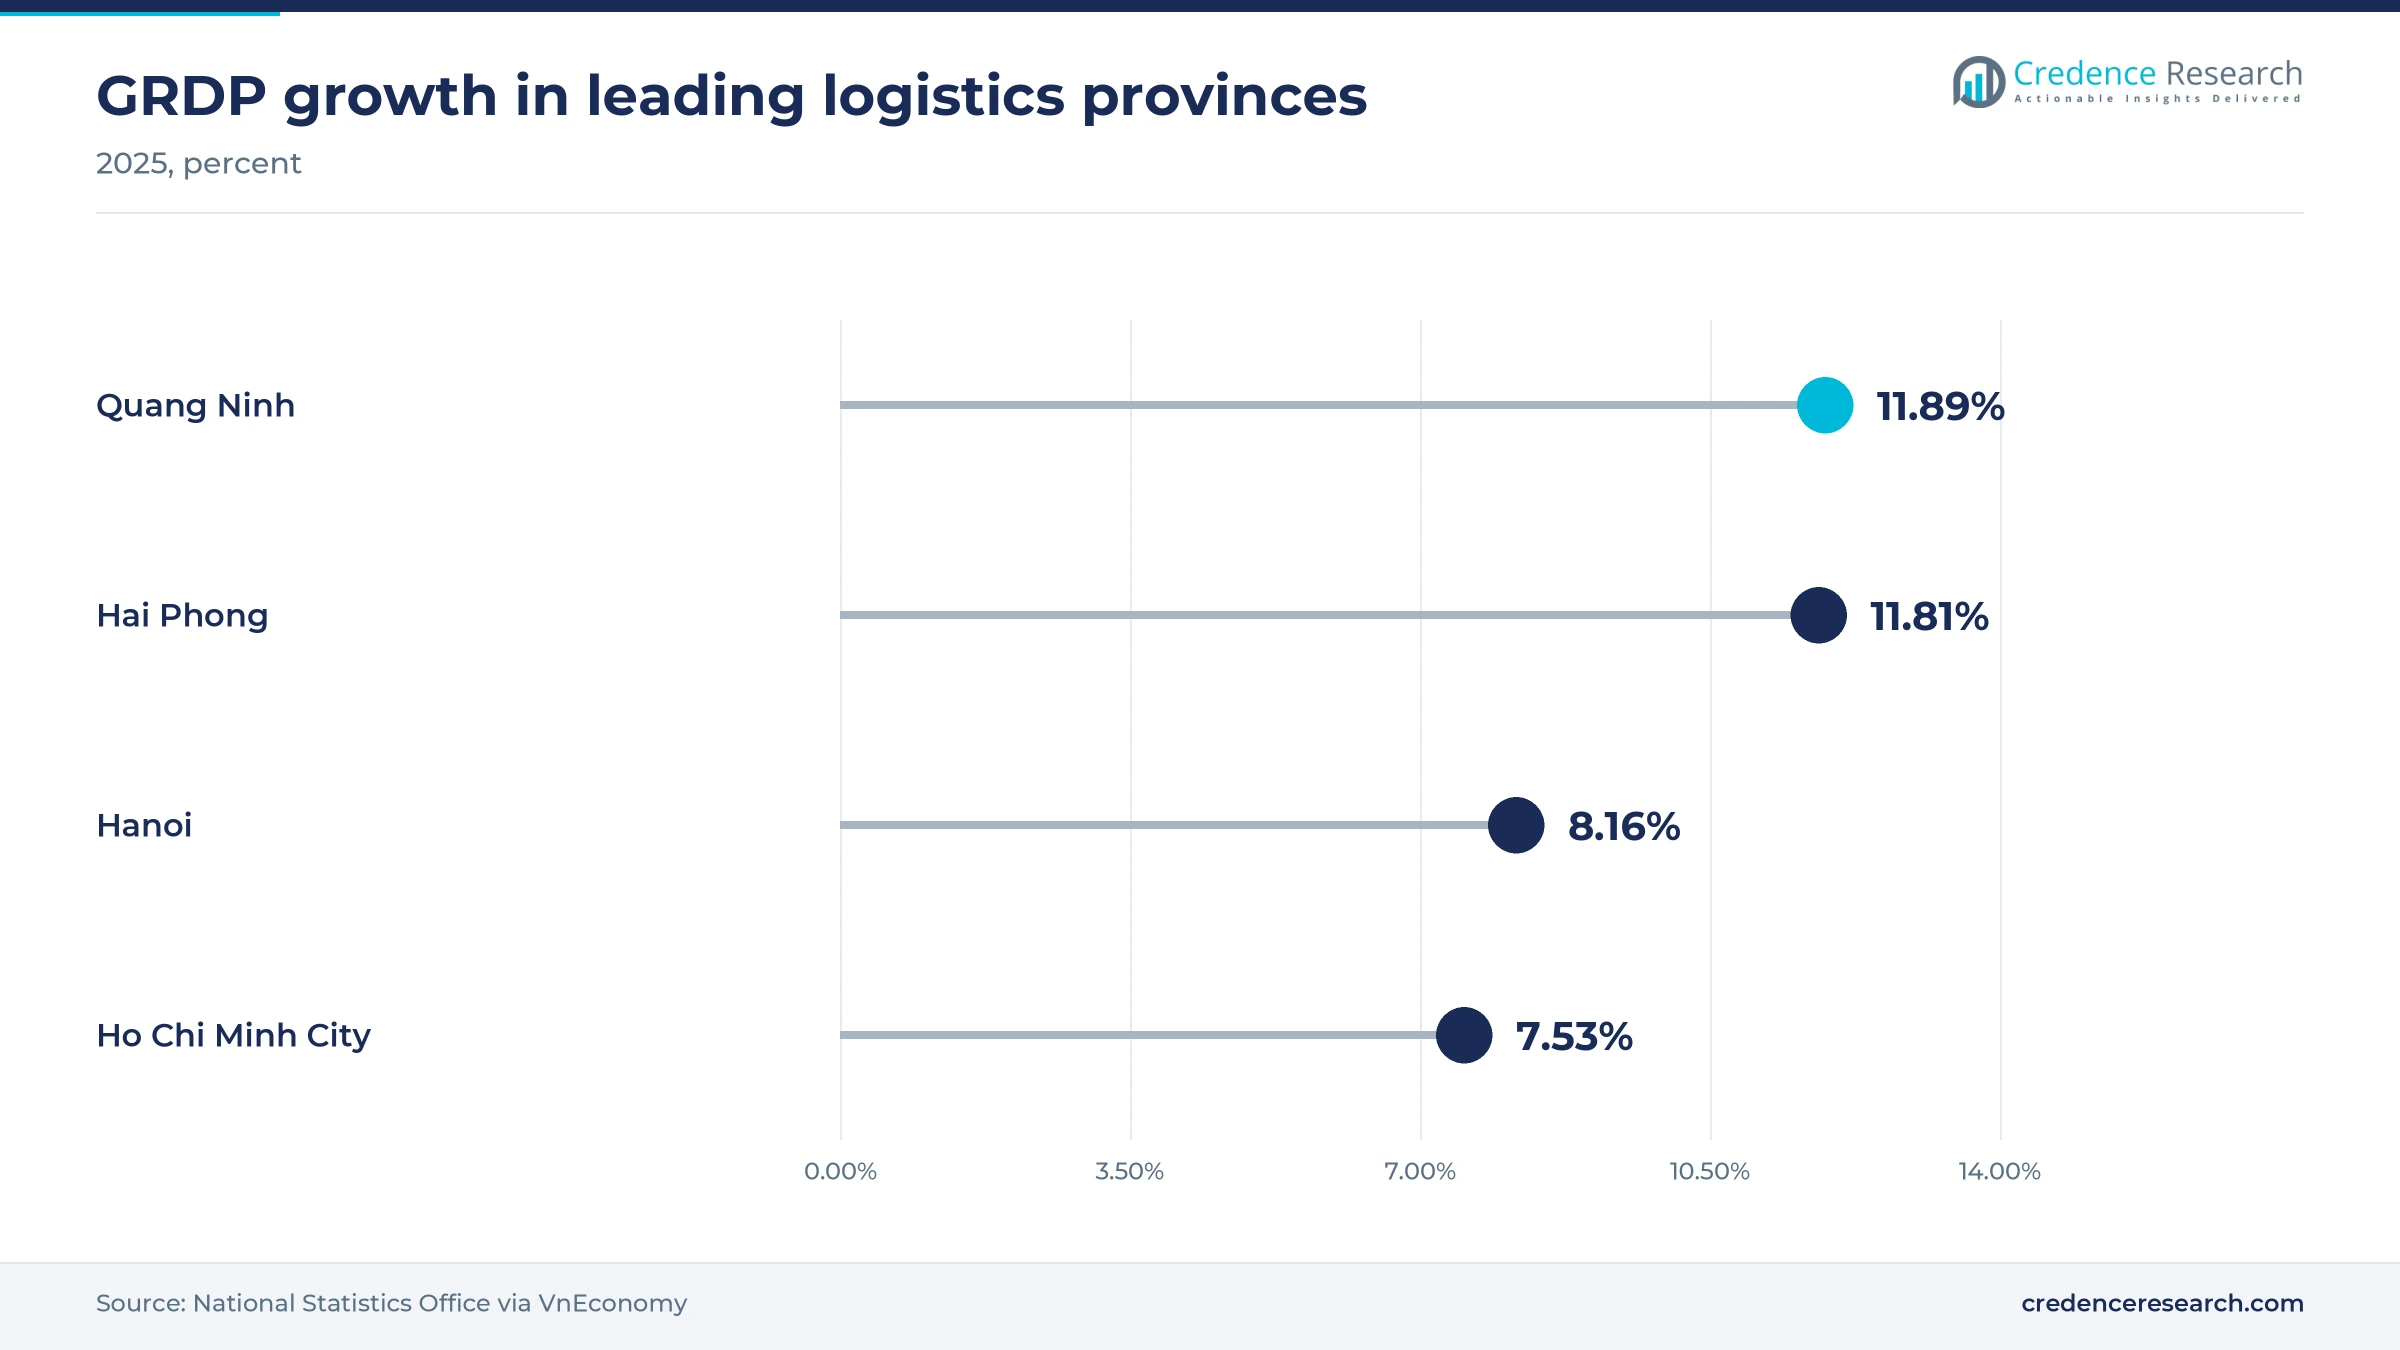
The Northern Economic Region held a 38.0% share of 2025 value and grows fastest at 7.17% a year, because Hanoi, Bac Ninh, Thai Nguyen and Hai Phong host major electronics plants. Hai Phong's GRDP grew 11.81% and Quang Ninh's 11.89% in 2025, the two fastest provincial rates, according to VnEconomy. Viettel Post's largest sorting complex sits in Hanoi's Quang Minh Industrial Park. J&T Express also opened its largest northern sorting center in November 2024.
How does the southern hub support parcel and consumer goods sites?
The Southern Economic Region held a 30.0% share of 2025 value and grows at 6.27% a year, because Ho Chi Minh City and its neighboring provinces hold the largest consumer market. Ho Chi Minh City's GRDP grew 7.53% in 2025, slower than the leading northern provinces. Cainiao handed over southern Vietnam's largest automated sorting center in March 2025. Trade shows such as VILOG 2026 in Ho Chi Minh City also draw buyers from logistics, food and consumer goods firms.
Why is the central corridor attracting new automated sites?
The Central Coast & Da Nang Corridor held a 20.0% share of 2025 value and grows at 6.92% a year, because Da Nang links north-south road freight with seaports. Intech Group keeps an office in Da Nang to serve plants along the coast. The corridor also serves seafood processors and beverage plants that need faster pallet handling and cold storage. However, lower parcel density than in Hanoi or Ho Chi Minh City means most central projects remain smaller and phased.
How do Mekong nodes link farm exports with cold stores?
The Mekong Delta & Secondary Logistics Nodes held a 12.0% share of 2025 value and grow at 6.52% a year, because farm and seafood exporters need cold storage near southern ports. New Era Cold Storage's automated site in Tay Ninh links the delta with Ho Chi Minh City. However, many delta warehouses remain small and manual, which slows automation outside the main corridors.
Sort hubs, cold stores and robot pilots marked 2024 to 2026
| Development | Status and market relevance |
|---|---|
| In January 2024, Viettel Post opened a smart sorting complex with capacity for 1.4 million parcels a day. | Set a national benchmark for robot-based parcel sorting |
| In April 2024, DKSH became distributor for Kardex automated storage systems in Vietnam and six other markets. | Widened local access to vertical lift modules and carousels |
| In March 2025, Cainiao handed over southern Vietnam's largest automated sorting center to a courier. | Added multi-layer cross-belt sorting in the south |
| In October 2025, the Prime Minister approved Decision 2229/QD-TTg on logistics services to 2035. | Set growth and outsourcing targets for logistics services |
| In December 2025, New Era Cold Storage began operating an automated cold store in Tay Ninh province. | Added up to 110,000 automated pallet positions |
Cross-belt sorters, shuttles and AMRs raise throughput
- Cross-belt and wheel sorters route parcels to hundreds of outlets, which lets national carriers absorb online sales peaks.
- Pallet shuttles and stacker cranes store pallets in dense high-bay racks, which suits cold stores and export plants with limited land.
- Autonomous mobile robots move pallets and totes without fixed tracks, which lets plants add capacity in existing buildings.
- Warehouse control software coordinates robots, conveyors and stock records, which links automated sites with customer order systems.
Need a Custom Version of This Report?
Tailor the scope, geography, or segments to your exact requirements.
- Custom geography or segment scope
- Direct access to our analyst team
Global system makers compete with fast local integrators
Competition combines global system makers with Vietnamese integrators that offer lower prices and faster service. Daifuku set up Daifuku Intralogistics Vietnam, a Japanese-owned subsidiary that supplies conveying, storage, sorting and picking systems. SSI SCHAEFER showed its LOGIMAT vertical lift module at the Vietnam Warehousing and Automation Show in Binh Duong in May 2025 and sells through a local distribution partner. Kardex reaches Vietnamese buyers through DKSH under an April 2024 agreement. Vinatech Group and PNC TECH make shuttles, racking and stacker cranes locally, while Intech Group integrates AS/RS, AGVs and software from three city offices. Suppliers compete on throughput, local engineering support, software and financing rather than on equipment price alone.
Companies profiled and their roles in this market
| Company | Type | Role in the market |
|---|---|---|
| Daifuku Co., Ltd. | Global system maker | Supplies conveying, storage, sorting and picking systems through a Vietnamese subsidiary |
| SSI SCHAEFER | Global system maker | Offers vertical lift modules and cold storage automation through a local partner |
| Kardex | Global storage maker | Sells vertical lift and carousel modules in Vietnam through DKSH |
| Vinatech Group | Vietnamese racking and AS/RS maker | Makes AutoS AS/RS and pallet shuttles in two Vietnamese factories |
| PNC TECH | Vietnamese integrator | Supplies stacker cranes, conveyors and AMRs from a Hanoi-area factory |
| Intech Group | Vietnamese integrator | Integrates AS/RS, pallet shuttles, AGVs and WMS from three city offices |
Credence Research view on automated Vietnamese warehouses
Credence Research's view is that Vietnamese demand for warehouse automation will grow steadily because parcel volumes and export plants have outgrown manual handling. Sortation remains the largest budget, while mobile robots and software grow fastest as operators upgrade existing sites. Cold stores near southern ports add high-value AS/RS projects for exporters. However, thin margins, scarce engineers and wage-driven cost pressure will keep smaller firms cautious. Suppliers that combine local manufacturing, rental models and strong service teams should gain share fastest.
How the estimate for Vietnamese warehouses was built
The warehouse automation report uses 2025 as the base year on a calendar basis, and market values come from the Credence Research model. That model combines national output, trade and investment statistics, online retail data and company information on hub openings, automated cold stores and robot deployments. Segment splits, regional shares and regional growth rates are Credence Research estimates. Sources used are official statistics, government and news websites and company releases, and no interviews or surveys were used.
Parcel growth and export plants carry demand to 2035
Warehouse automation value in Vietnam is expected to reach USD 494.7 million by 2035, a 6.78% CAGR during 2026–2035, as parcel volumes, export plants and cold chain sites keep demand rising. Growth should be strongest in the northern provinces, where electronics plants and port-linked parks keep expanding. After 2028, software and robot fleets will matter more than new conveyor lines for winning projects. Faster online sales growth would raise this outlook, while weaker export orders would lower it. Suppliers with local factories and rental options are expected to gain the most.
Frequently Asked Questions
How big is the Vietnam warehouse automation market?
Which solution type leads automation spending in Vietnam?
Which region leads Vietnamese automation spending?
Which end-use industry buys the most automated systems?
How large were Vietnamese online sales in 2025?
What did Viettel Post automate in 2024?
What policy supports logistics automation in Vietnam?
Which deployment model grows fastest?
Table of Content
Chapter 1 Market Segmentation
- 1.1 Segmentation Framework
- 1.1.1 Product and Service Classification
- 1.1.2 Application and End-Use Classification
- 1.1.3 Technology and Solution Classification
- 1.1.4 Customer and Distribution Channel Classification
- 1.1.5 Geographic Segmentation
- 1.1.6 Market Segment Definitions and Boundaries
- 1.2 By Solution Type
- 1.2.1 Conveyor & Sortation Systems
- 1.2.2 AS/RS Systems
- 1.2.3 Warehouse Software & Control Systems
- 1.2.4 Autonomous Mobile Robots
- 1.3 By End-Use Industry
- 1.3.1 Third-Party Logistics & Parcel
- 1.3.2 E-Commerce & Omnichannel Retail
- 1.3.3 Electronics & Advanced Manufacturing
- 1.3.4 Food, Beverage & Healthcare Logistics
- 1.4 By Deployment Model
- 1.4.1 Greenfield Integrated Deployment
- 1.4.2 Brownfield Retrofit
- 1.4.3 Modular Phased Automation
- 1.4.4 Robotics-as-a-Service
Chapter 2 Introduction
- 2.1 Report Objectives and Scope
- 2.2 Product Definition and Industry Terminology
- 2.3 Market Inclusions and Exclusions
- 2.4 Research Process
- 2.4.1 Primary Research and Expert Interviews
- 2.4.2 Secondary Research and Source Review
- 2.4.3 Top-Down and Bottom-Up Estimation
- 2.4.4 Data Triangulation and Verification
- 2.5 Market Size Measurement Basis
- 2.5.1 2025: USD 250.5 million → 2035: USD 494.7 million
- 2.6 Historical and Forecast Reference Periods
- 2.6.1 Historical Period: 2018-2025
- 2.6.2 Base Year: 2025
- 2.6.3 Forecast Period: 2025-2035
- 2.7 Research Assumptions and Limitations
Chapter 3 Executive Summary
- 3.1 Market Snapshot and Key Findings
- 3.2 Base-Year Market Size, 2025
- 3.3 Forecast Market Size, 2035
- 3.4 Revenue and Volume Growth Outlook
- 3.5 Key Demand and Supply Indicators
- 3.6 Leading Market Segments
- 3.7 Fastest-Growing Market Opportunities
- 3.8 Regional Performance Highlights
- 3.9 Technology and Industry Transformation
- 3.10 Competitive Landscape Summary
- 3.11 Analyst View and Strategic Implications
Chapter 4 Vietnam Warehouse Automation Market Trends and Developments
- 4.1 Historical Industry Development, 2018-2025
- 4.2 Recent Market Trends and Developments
- 4.3 Demand and Customer Behavior Trends
- 4.4 Technology and Product Innovation
- 4.5 Artificial Intelligence, Automation and Digitalization
- 4.6 Local Manufacturing and Supply Chain Realignment
- 4.7 Industry Partnerships, Mergers and Acquisitions
- 4.8 Sustainability and Circular Economy Developments
- 4.9 Government and Private Sector Investment Trends
- 4.10 Emerging Business Models and Commercialization
- 4.11 Industry Developments and Announcements
Chapter 5 Vietnam Warehouse Automation Market Production, Supply and Demand Analysis
- 5.1 Demand Trend and Consumption Analysis, 2018-2025
- 5.2 Demand Forecast, 2025-2035
- 5.3 Production and Output Trend, 2018-2025
- 5.4 Production and Output Forecast, 2025-2035
- 5.5 Installed Capacity and Capacity Utilization
- 5.6 Company-Wise Production Plants and Statistics
- 5.6.1 Installed Production Capacity
- 5.6.2 Actual Production
- 5.6.3 Planned Capacity and Expansion Targets
- 5.7 Supply Chain Structure and Procurement Trends
- 5.8 Supply-Demand Gap and Bottlenecks
- 5.9 Import Dependence and Sourcing Structure
- 5.10 Contract Manufacturing and Outsourcing
- 5.11 Regional Supply and Demand Concentration
Chapter 6 Vietnam Warehouse Automation Market Pricing Analysis
- 6.1 Pricing Structure and Measurement
- 6.2 Historical Pricing Trends, 2018-2025
- 6.3 Pricing Outlook, 2025-2035
- 6.4 Average Selling Price and Unit Economics
- 6.5 Pricing by Product and Market Segment
- 6.6 Geographic Pricing Differences
- 6.7 Key Input, Energy, Labor and Logistics Costs
- 6.8 Contract Pricing and Purchasing Models
- 6.9 Pricing Sensitivity and Competitive Positioning
- 6.10 Price, Margin and Profitability Implications
Chapter 7 Vietnam Warehouse Automation Market Dynamics
- 7.1 Market Growth Drivers
- 7.1.1 Demand-Side Drivers
- 7.1.2 Technology and Innovation Drivers
- 7.1.3 Infrastructure and Investment Drivers
- 7.1.4 Regulatory and Policy Drivers
- 7.2 Market Restraints
- 7.2.1 Cost and Affordability Constraints
- 7.2.2 Technology and Adoption Barriers
- 7.2.3 Supply Chain and Operational Constraints
- 7.3 Market Challenges
- 7.3.1 Competitive Pressure and Margin Erosion
- 7.3.2 Skills, Infrastructure and Implementation Gaps
- 7.4 Emerging Market Opportunities
- 7.5 Market Dynamics Impact and Time-Horizon Assessment
Chapter 8 Vietnam Warehouse Automation Value Chain Analysis
- 8.1 Industry Value Chain Overview
- 8.2 Upstream Suppliers and Critical Inputs
- 8.3 Technology and Component Providers
- 8.4 Manufacturing or Service Delivery
- 8.5 Distribution, Channel Partners and Integrators
- 8.6 Downstream Applications and End Users
- 8.7 Value Addition and Profit Pools
- 8.8 Vertical Integration and Outsourcing
- 8.9 Supplier Concentration and Risk
- 8.10 Supply Chain Localization and Resilience
Chapter 9 Vietnam Warehouse Automation Market Regulations and Policies
- 9.1 Relevant Laws, Standards and Compliance Frameworks
- 9.2 Product, Service, Safety and Quality Requirements
- 9.3 Government Policies, Incentives and Subsidies
- 9.4 Imports, Exports and Trade Barriers
- 9.5 Public Procurement and Local Content Requirements
- 9.6 Environmental and Sustainability Compliance
- 9.7 Upcoming Policy Changes and Market Implications
Chapter 10 Vietnam Warehouse Automation Market Hotspots and Opportunities
- 10.1 Market Opportunity Mapping and Growth Hotspots
- 10.2 High-Growth Applications and Customer Groups
- 10.3 Underserved Markets and White-Space Opportunities
- 10.4 Emerging Technology and Product Opportunities
- 10.5 New Capacity and Investment Hotspots
- 10.6 Market Entry and Expansion Opportunities
- 10.7 Distribution and Partnership Opportunities
- 10.8 Near-Term and Long-Term Commercial Potential
- 10.9 Opportunity Attractiveness and Execution Risks
Chapter 11 Vietnam Warehouse Automation Market Outlook, 2025-2035
- 11.1 Market Size and Analysis
- 11.1.1 Revenue (Market Measurement: 2025: USD 250.5 million → 2035: USD 494.7 million)
- 11.1.2 Market Volume and Quantity Sold
- 11.1.3 Historical Market Size, 2018-2025
- 11.1.4 Base-Year Market Size, 2025
- 11.2 Market Forecast, 2025-2035
- 11.2.1 Revenue Forecast to 2035
- 11.2.2 Volume Forecast to 2035
- 11.2.3 CAGR and Year-on-Year Growth
- 11.2.4 Incremental Revenue Opportunity
- 11.3 Forecast Assumptions and Scenario Analysis
- 11.3.1 Base-Case Forecast
- 11.3.2 Optimistic and Conservative Scenarios
- 11.3.3 Technology, Pricing and Policy Sensitivities
- 11.4 Market Attractiveness and Growth Outlook
Chapter 12 Vietnam Warehouse Automation Market Segmentation and Outlook
- 12.1 Segmentation Summary and Market Shares, 2025
- 12.2 Largest and Fastest-Growing Segments
- 12.3 By Solution Type - Market Size and Forecast, 2025-2035
- 12.3.1 Segment Definition and Scope
- 12.3.2 Historical Market Size, 2018-2025
- 12.3.3 Revenue Forecast, 2025-2035
- 12.3.4 Volume Forecast, 2025-2035
- 12.3.5 Base-Year Market Share, 2025
- 12.3.6 Segment CAGR and Growth Drivers
- 12.3.7 Subsegment Market Size and Forecast
- 12.3.7.1 Conveyor & Sortation Systems
- 12.3.7.2 AS/RS Systems
- 12.3.7.3 Warehouse Software & Control Systems
- 12.3.7.4 Autonomous Mobile Robots
- 12.3.8 Subsegment Pricing and Adoption Trends
- 12.3.9 Leading Suppliers and Competition
- 12.3.10 Regional Demand and Opportunities
- 12.4 By End-Use Industry - Market Size and Forecast, 2025-2035
- 12.4.1 Segment Definition and Scope
- 12.4.2 Historical Market Size, 2018-2025
- 12.4.3 Revenue Forecast, 2025-2035
- 12.4.4 Volume Forecast, 2025-2035
- 12.4.5 Base-Year Market Share, 2025
- 12.4.6 Segment CAGR and Growth Drivers
- 12.4.7 Subsegment Market Size and Forecast
- 12.4.7.1 Third-Party Logistics & Parcel
- 12.4.7.2 E-Commerce & Omnichannel Retail
- 12.4.7.3 Electronics & Advanced Manufacturing
- 12.4.7.4 Food, Beverage & Healthcare Logistics
- 12.4.8 Subsegment Pricing and Adoption Trends
- 12.4.9 Leading Suppliers and Competition
- 12.4.10 Regional Demand and Opportunities
- 12.5 By Deployment Model - Market Size and Forecast, 2025-2035
- 12.5.1 Segment Definition and Scope
- 12.5.2 Historical Market Size, 2018-2025
- 12.5.3 Revenue Forecast, 2025-2035
- 12.5.4 Volume Forecast, 2025-2035
- 12.5.5 Base-Year Market Share, 2025
- 12.5.6 Segment CAGR and Growth Drivers
- 12.5.7 Subsegment Market Size and Forecast
- 12.5.7.1 Greenfield Integrated Deployment
- 12.5.7.2 Brownfield Retrofit
- 12.5.7.3 Modular Phased Automation
- 12.5.7.4 Robotics-as-a-Service
- 12.5.8 Subsegment Pricing and Adoption Trends
- 12.5.9 Leading Suppliers and Competition
- 12.5.10 Regional Demand and Opportunities
- 12.6 Segment Growth Comparison
- 12.7 Segment Attractiveness and Priority Matrix
Chapter 13 Vietnam Warehouse Automation End-Use and Application Market Outlook
- 13.1 End-Use Industry and Customer Demand Structure
- 13.2 Leading Applications and Customer Groups
- 13.3 End-Use Market Size, Share and Forecast
- 13.4 Major End-Use Industry Deep Dives
- 13.4.1 Customer Requirements and Use Cases
- 13.4.2 Demand and Replacement Cycles
- 13.4.3 Technical and Regulatory Considerations
- 13.4.4 Purchasing and Procurement Models
- 13.4.5 Leading Vendors and Distribution Channels
- 13.4.6 Forecast and Commercial Opportunities
- 13.5 Emerging Applications and Cross-Segment Demand
- 13.6 End-Use Industry Investment Priorities
Chapter 14 Vietnam Warehouse Automation Geographic Market Outlook, 2025-2035
- 14.1 Domestic Market Distribution and Demand Clusters
- 14.2 State- or Province-Wise Market Size and Forecast, 2025-2035
- 14.3 City and Metropolitan Market Outlook
- 14.4 Industrial, Manufacturing and Commercial Clusters
- 14.5 Geographic Concentration of Key End Users
- 14.6 Local Pricing and Purchasing Differences
- 14.7 Domestic Production Facilities and Capacity Map
- 14.8 Local Infrastructure and Project Pipeline
- 14.9 State-Level Policy and Incentive Differences
- 14.10 Subnational Investment Hotspots and Opportunities
- 14.11 Distribution and Logistics Networks
- 14.12 Domestic Competitive Footprint
Chapter 15 Vietnam Warehouse Automation Technology, Innovation and Sustainability Outlook
- 15.1 Technology Landscape and Maturity
- 15.2 Product, Process and Service Innovation
- 15.3 AI, Automation and Digital Tools in the Industry
- 15.4 Technology Adoption and Performance Benchmarking
- 15.5 Innovation Pipeline and R&D Investment
- 15.6 Patent and Intellectual Property Trends
- 15.7 Energy Efficiency and Resource Management
- 15.8 Sustainability, Recycling and Circularity
- 15.9 Technology Roadmap, 2025-2035
- 15.10 Risks of Obsolescence and Technology Substitution
Chapter 16 Vietnam Warehouse Automation Market Key Strategic Imperatives
- 16.1 Growth and Market Entry Priorities
- 16.2 High-Return Products and Segments
- 16.3 Pricing, Profitability and Cost Optimization
- 16.4 Technology Investment and Product Differentiation
- 16.5 Supply Chain Localization and Resilience
- 16.6 Distribution and Customer Acquisition
- 16.7 Partnership, Acquisition and Capacity Strategy
- 16.8 Regional Expansion Priorities
- 16.9 Short-, Medium- and Long-Term Actions
Chapter 17 Competition Outlook
- 17.1 Industry Competition Characteristics
- 17.2 Market Structure and Concentration
- 17.3 Market Share and Competitive Positioning, 2025
- 17.4 Company-Wise Revenue and Product Benchmarking
- 17.5 Production and Service Capacity Benchmarking
- 17.6 Technology, Pricing and Differentiation
- 17.7 Regional Footprint and Distribution Strength
- 17.8 Mergers, Acquisitions and Strategic Alliances
- 17.9 New Entrants and Competitive Threats
- 17.10 Porter's Five Forces and Industry Attractiveness
- 17.11 Competitive Outlook, 2025-2035
Chapter 18 Company Profiles
- 18.1 Company Coverage and Selection Criteria
- 18.2 Daifuku Co., Ltd.
- 18.2.1 Business Description
- 18.2.2 Company Ownership and Geographic Presence
- 18.2.3 Product and Service Portfolio
- 18.2.4 Manufacturing and Operating Footprint
- 18.2.5 Production Capacity and Expansion Plans
- 18.2.6 Financial Performance and Investment
- 18.2.7 Market Share and Competitive Position
- 18.2.8 Technology and Innovation Capabilities
- 18.2.9 Strategic Alliances or Partnerships
- 18.2.10 Recent Developments
- 18.2.11 Growth Strategy and Outlook
- 18.3 SSI SCHAEFER
- 18.4 Geek+
- 18.5 HIKROBOT
- 18.6 Intech Group
- 18.7 Vinatech Group
- 18.8 PNC TECH
- 18.9 New Century International (NCI)
- 18.10 Beetsoft Logistics DX
- 18.11 Kardex
- 18.12 Other Relevant Market Participants
Note: Every listed company is profiled on the structure shown under the first company. The company list is preliminary and may change based on research findings, market developments, data availability and client requirements.
Chapter 19 Disclaimer
- 19.1 Research and Forecast Disclaimer
- 19.2 Data Source and Estimation Limitations
Note: The depth of individual sections depends on data availability for this market. Volume, capacity, trade and other unit-based metrics are included where applicable.

