
Asia Pacific logistics automation shifts toward software
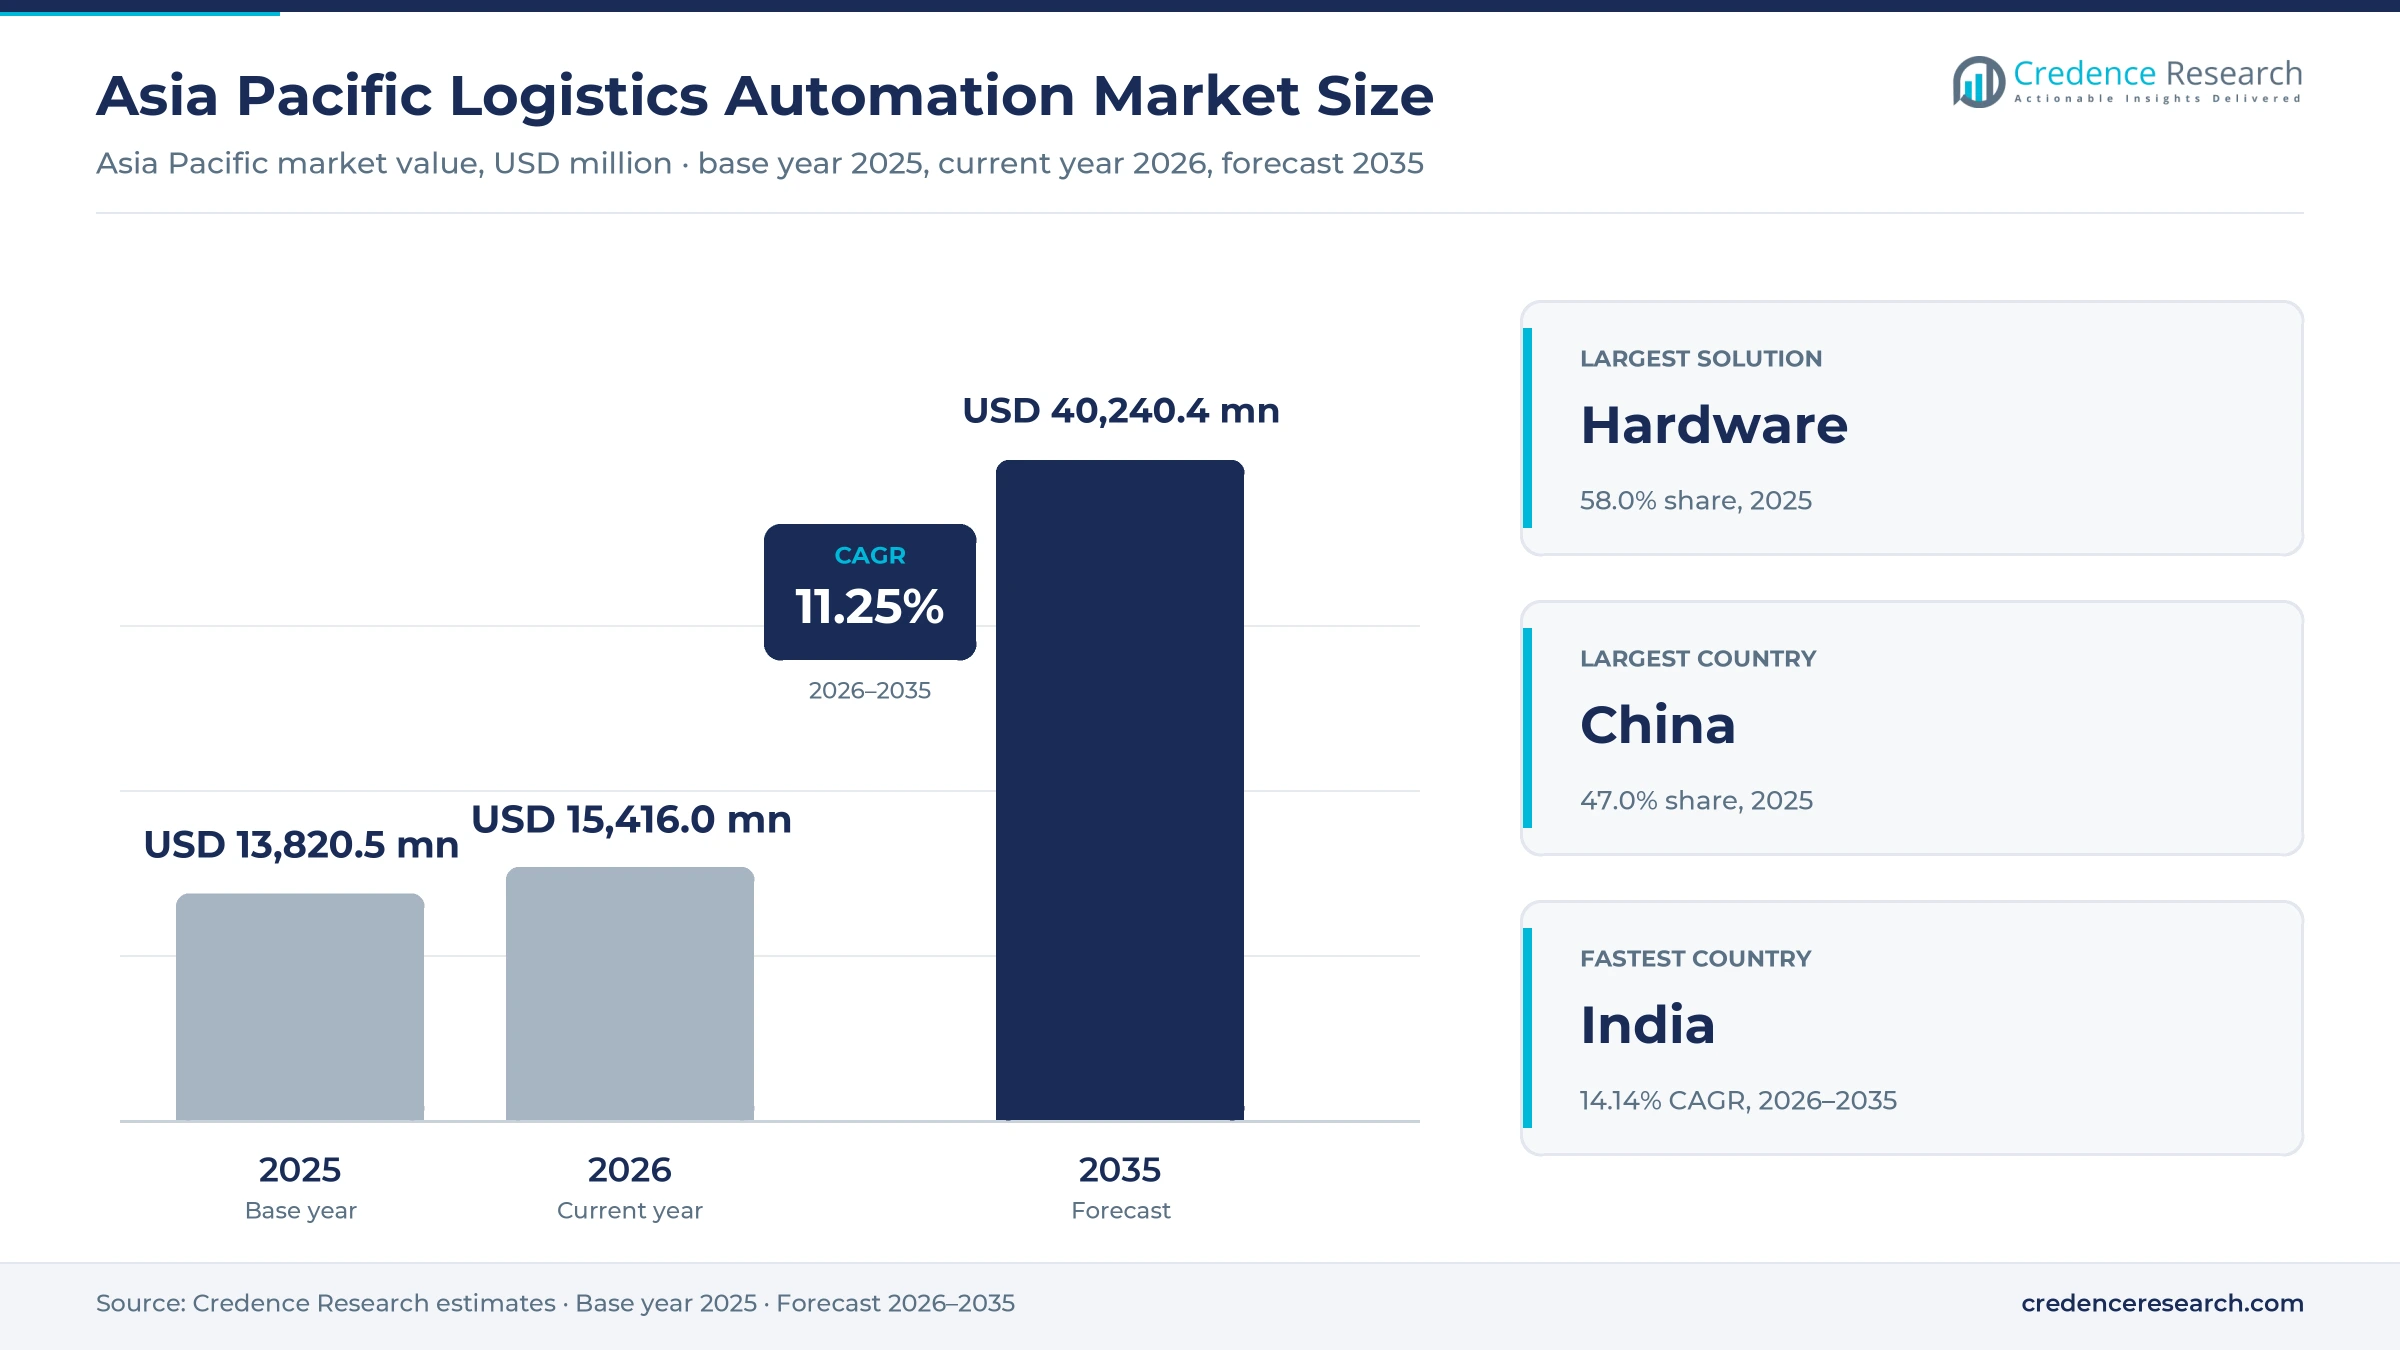
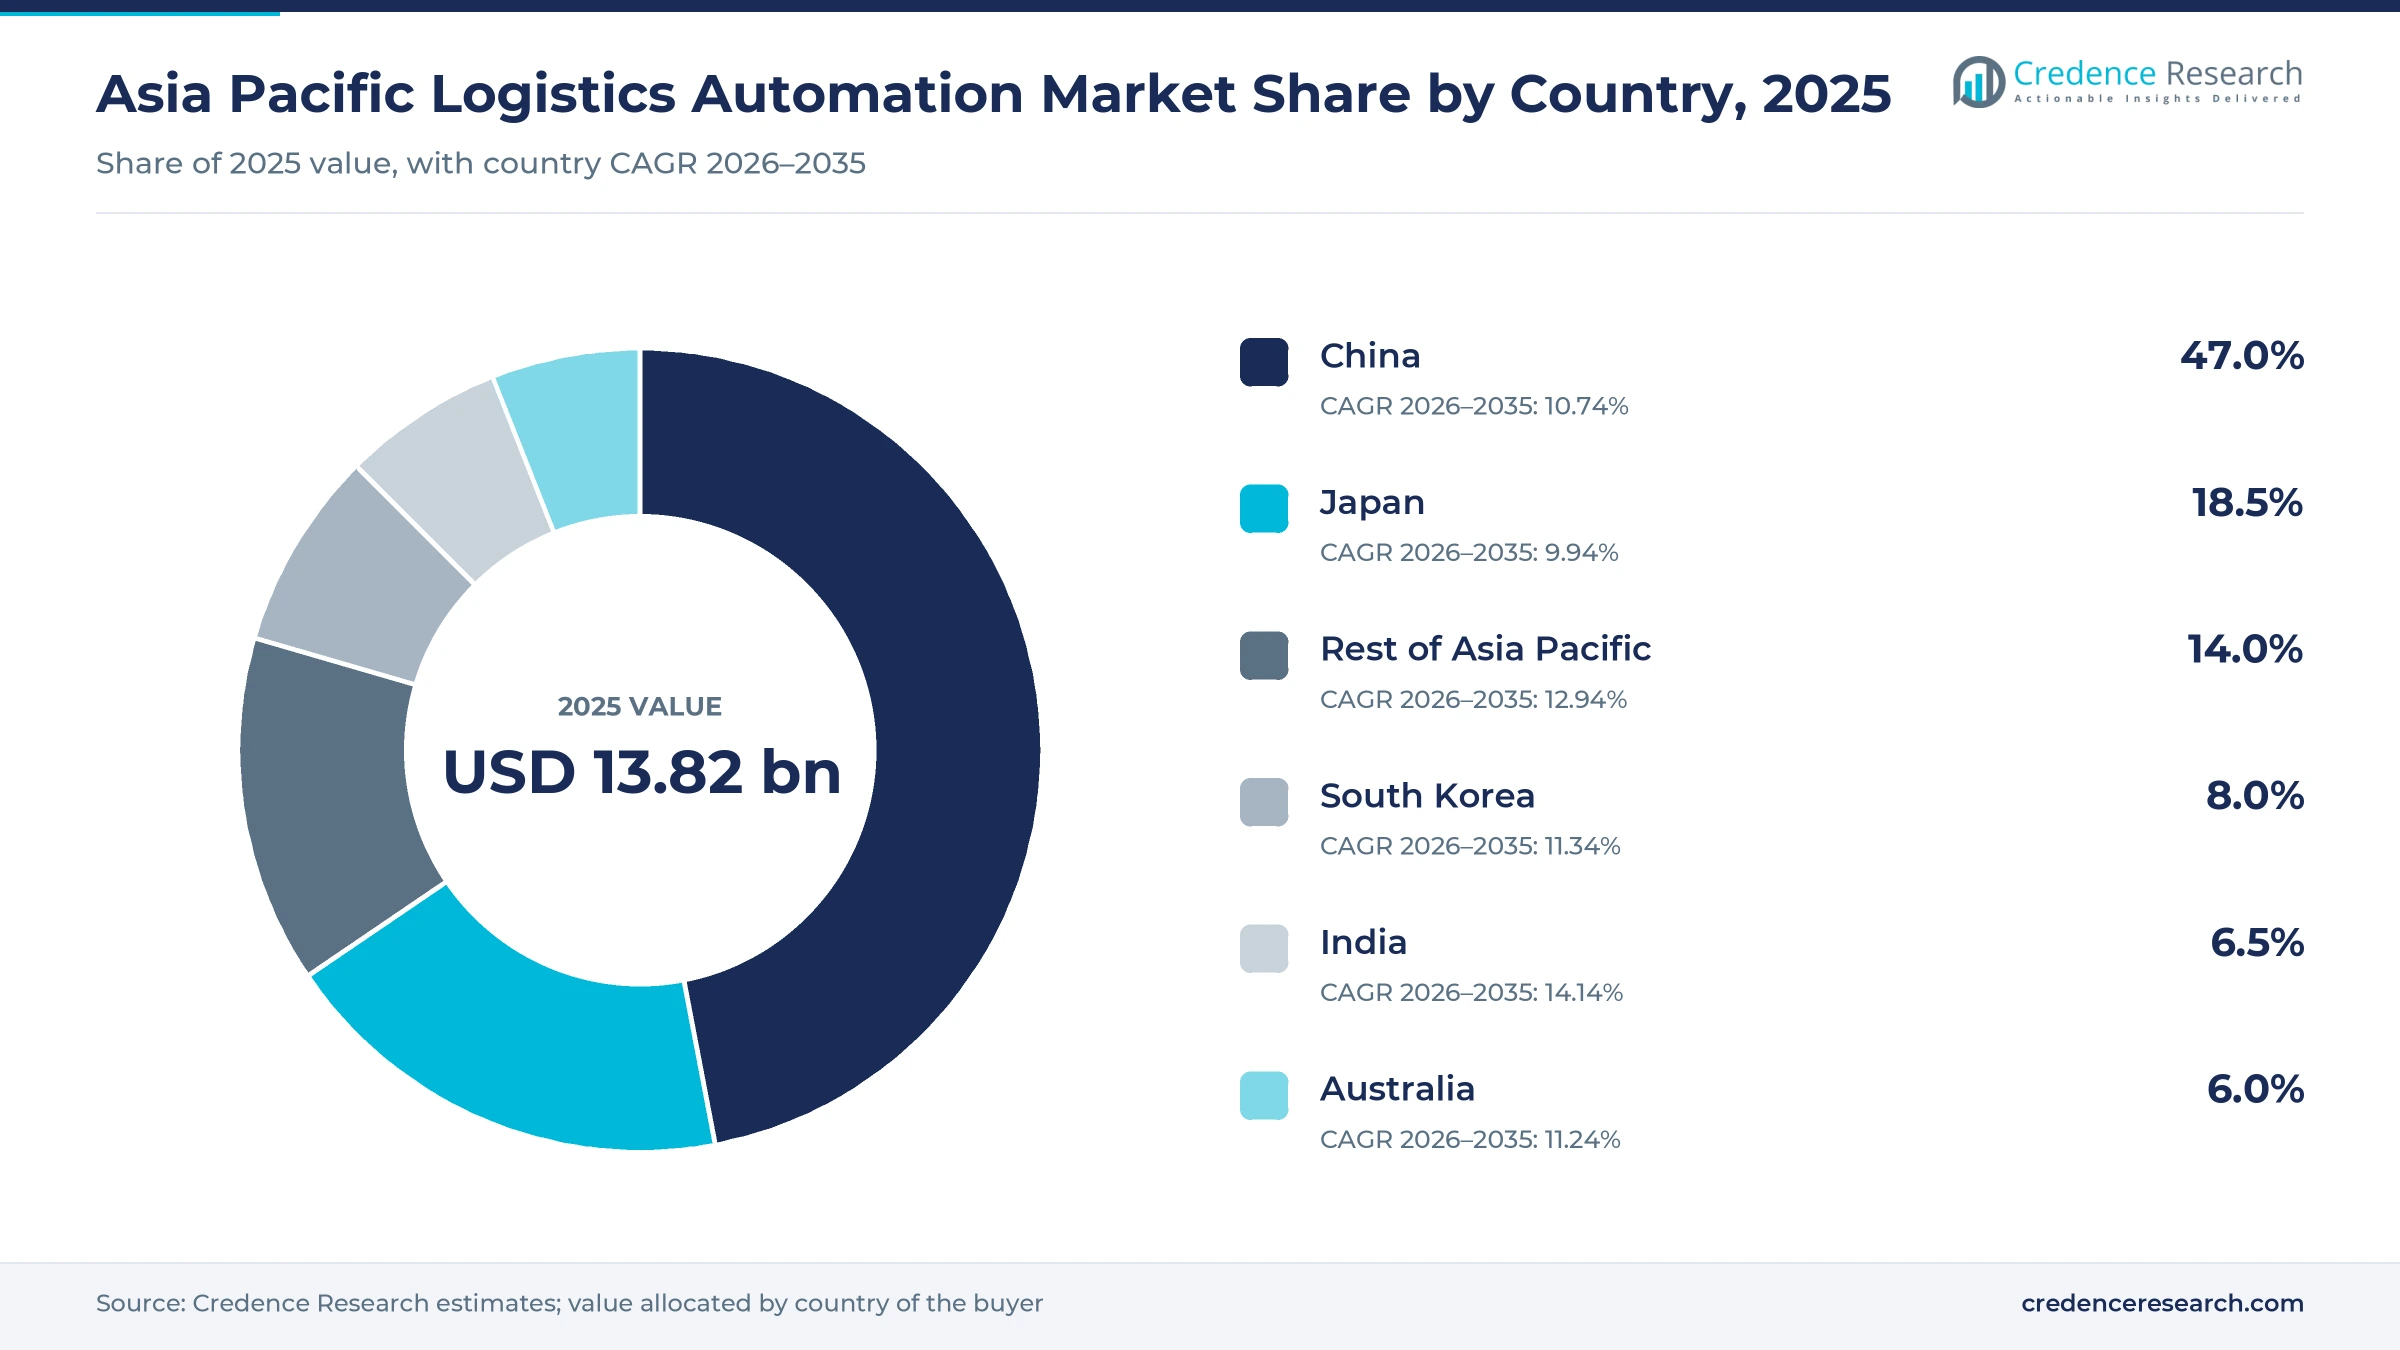
The Asia Pacific logistics automation market was valued at USD 13.82 billion in 2025 and is projected to increase from USD 15.42 billion in 2026 to USD 40.24 billion by 2035, registering a CAGR of 11.25% during 2026–2035. Demand comes from parcel networks, grocery and general merchandise retailers, contract warehouse operators and manufacturers that need higher dispatch rates with fewer workers. China held the largest country share, 47.0% in 2025, because its express network handled nearly 200 billion parcels that year. India is the fastest-growing country at 14.14% a year, helped by locally built storage cranes and a new official measure of logistics costs. Japan adds a regulatory push, since its amended logistics law made large shippers appoint chief logistics officers from April 2026. Purchasing is also moving from single machines to linked systems, with control software, autonomous vans and service contracts taking a larger part of each project budget across the region.
What does logistics automation cover across Asia Pacific?
Logistics automation covers the equipment, software and services that move, store, pick, sort and dispatch goods with limited manual handling. The category includes automated storage and retrieval systems, conveyors, sorters, mobile robots, warehouse control software, installation, maintenance and managed contracts. Buyers usually purchase through an integrator tender, a direct robot vendor agreement or a recurring service arrangement that bundles hardware with support.
The scope excludes conventional forklifts without automation, general enterprise planning software, freight charges and warehouse rent. Value is counted at the point where automation vendors and integrators recognize sales to operators in the region. Upstream component makers supply drives, sensors and controls, while integrators and software firms convert those parts into working sites for retailers, contract operators and factories.
Asia Pacific Logistics Automation Market Insights
- The market rises from USD 13.82 billion in 2025 to USD 40.24 billion by 2035, an 11.25% CAGR over 2026–2035, as parcel flows outgrow manual sortation capacity.
- China led with 47.0% of 2025 value, supported by an express network whose daily peak reached hundreds of millions of parcels during 2025.
- Hardware accounted for 58.0% of 2025 value because storage cranes, shuttles, sorters and robots still dominate the cost of most new sites.
- Japan moved logistics planning into the boardroom in April 2026, when large shippers had to name chief logistics officers under the amended efficiency law.
- Chinese robot vendors now compete with established integrators, and Geekplus strengthened its position through a Hong Kong Main Board listing on July 9, 2025.
Hardware and outbound systems hold the largest value
Why does hardware still take most project budgets?
Based on solution type, the market is categorized into hardware, software and services. Hardware led with 58.0% of 2025 value because large sites remain equipment-heavy, as SSI Schaefer showed at the Brisbane warehouse of Coca-Cola Europacific Partners, described in July 2025, with 12 cranes serving more than 30,000 pallets. Software grows fastest at 12.94% a year as sites link more machines under one control layer. Dematic, for example, placed its iQ software between the warehouse management system of Wurth Australia and new automation, according to IT Brief in September 2026.
Why does outbound work attract the largest share?
Based on application, the market is categorized into inbound and inventory handling, outbound fulfillment and yard and delivery automation. Outbound Fulfillment led with 48.0% of 2025 value because dispatch peaks create the tightest constraint, with Xinhua reporting that Chinese networks processed over 6,200 parcels per second in the first 11 months of 2025. Yard and Delivery Automation grows fastest at 13.69% a year as vehicles leave pilot status. Neolix, according to The Robot Report in October 2025, had deployed more than 10,000 RoboVans across 300 cities before raising over USD 600 million.
Which buyers are spending, and which are catching up?
Based on end-use industry, the market is categorized into retail and e-commerce, third-party logistics, manufacturing and regulated and specialized distribution. Retail and E-Commerce led with 44.0% of 2025 value because retailers fund the largest single sites, including the 100,000-square-meter Kmart Group facility at Moorebank that Vanderlande will equip, according to Forkliftaction in June 2025. Third-Party Logistics grows fastest at 12.50% a year as contract operators automate for several clients at once. Maersk opened a Singapore fulfillment center with Hai Robotics in February 2026, according to a company release.
Do new sites or upgrades drive the next wave?
Based on project type, the market is categorized into greenfield installations, brownfield retrofits and capacity expansions. Greenfield Installations led with 46.0% of 2025 value because automation is easiest to design into a new building, as CoolDrive Auto Parts chose when consolidating three Australian locations into one Dematic-equipped site due by August 2026, according to Forkliftaction. Brownfield Retrofits grows fastest at 12.35% a year as operators add technology to working sites. CJ Logistics placed two humanoid robots in the Olive Young center at Yongin in September 2026, according to The Korea Times.
| Segment Group | Leading Sub-segment | Share, 2025 | Fastest-growing Sub-segment | CAGR, 2026–2035 |
|---|---|---|---|---|
| By Solution Type | Hardware | 58.0% | Software | 12.94% |
| By Application | Outbound Fulfillment | 48.0% | Yard and Delivery Automation | 13.69% |
| By End-Use Industry | Retail and E-Commerce | 44.0% | Third-Party Logistics | 12.50% |
| By Project Type | Greenfield Installations | 46.0% | Brownfield Retrofits | 12.35% |
Request a Free Sample
Fill in your details and we'll send you a free sample report.
- Sample data tables & charts
- Research methodology
Parcel peaks and driver gaps force the investment case
E-commerce fulfillment complexity outgrows manual sortation
E-commerce order profiles push operators toward automation because parcel counts are rising faster than manual sortation can absorb them. China handled 199 billion parcels in 2025, up 13.7%, according to State Post Bureau data reported in January 2026. Its busiest day reached 777 million items, according to Xinhua data published by the State Council. In Southeast Asia, e-commerce gross merchandise value was projected at USD 185 billion for 2025, with video commerce near 25% of total value, according to the e-Conomy SEA 2025 report. These short-notice spikes favor goods-to-person picking and robotic sortation over added shifts. As a result, Outbound Fulfillment represented 48.0% of 2025 regional spending.
Labor availability and dispatch productivity tighten budgets
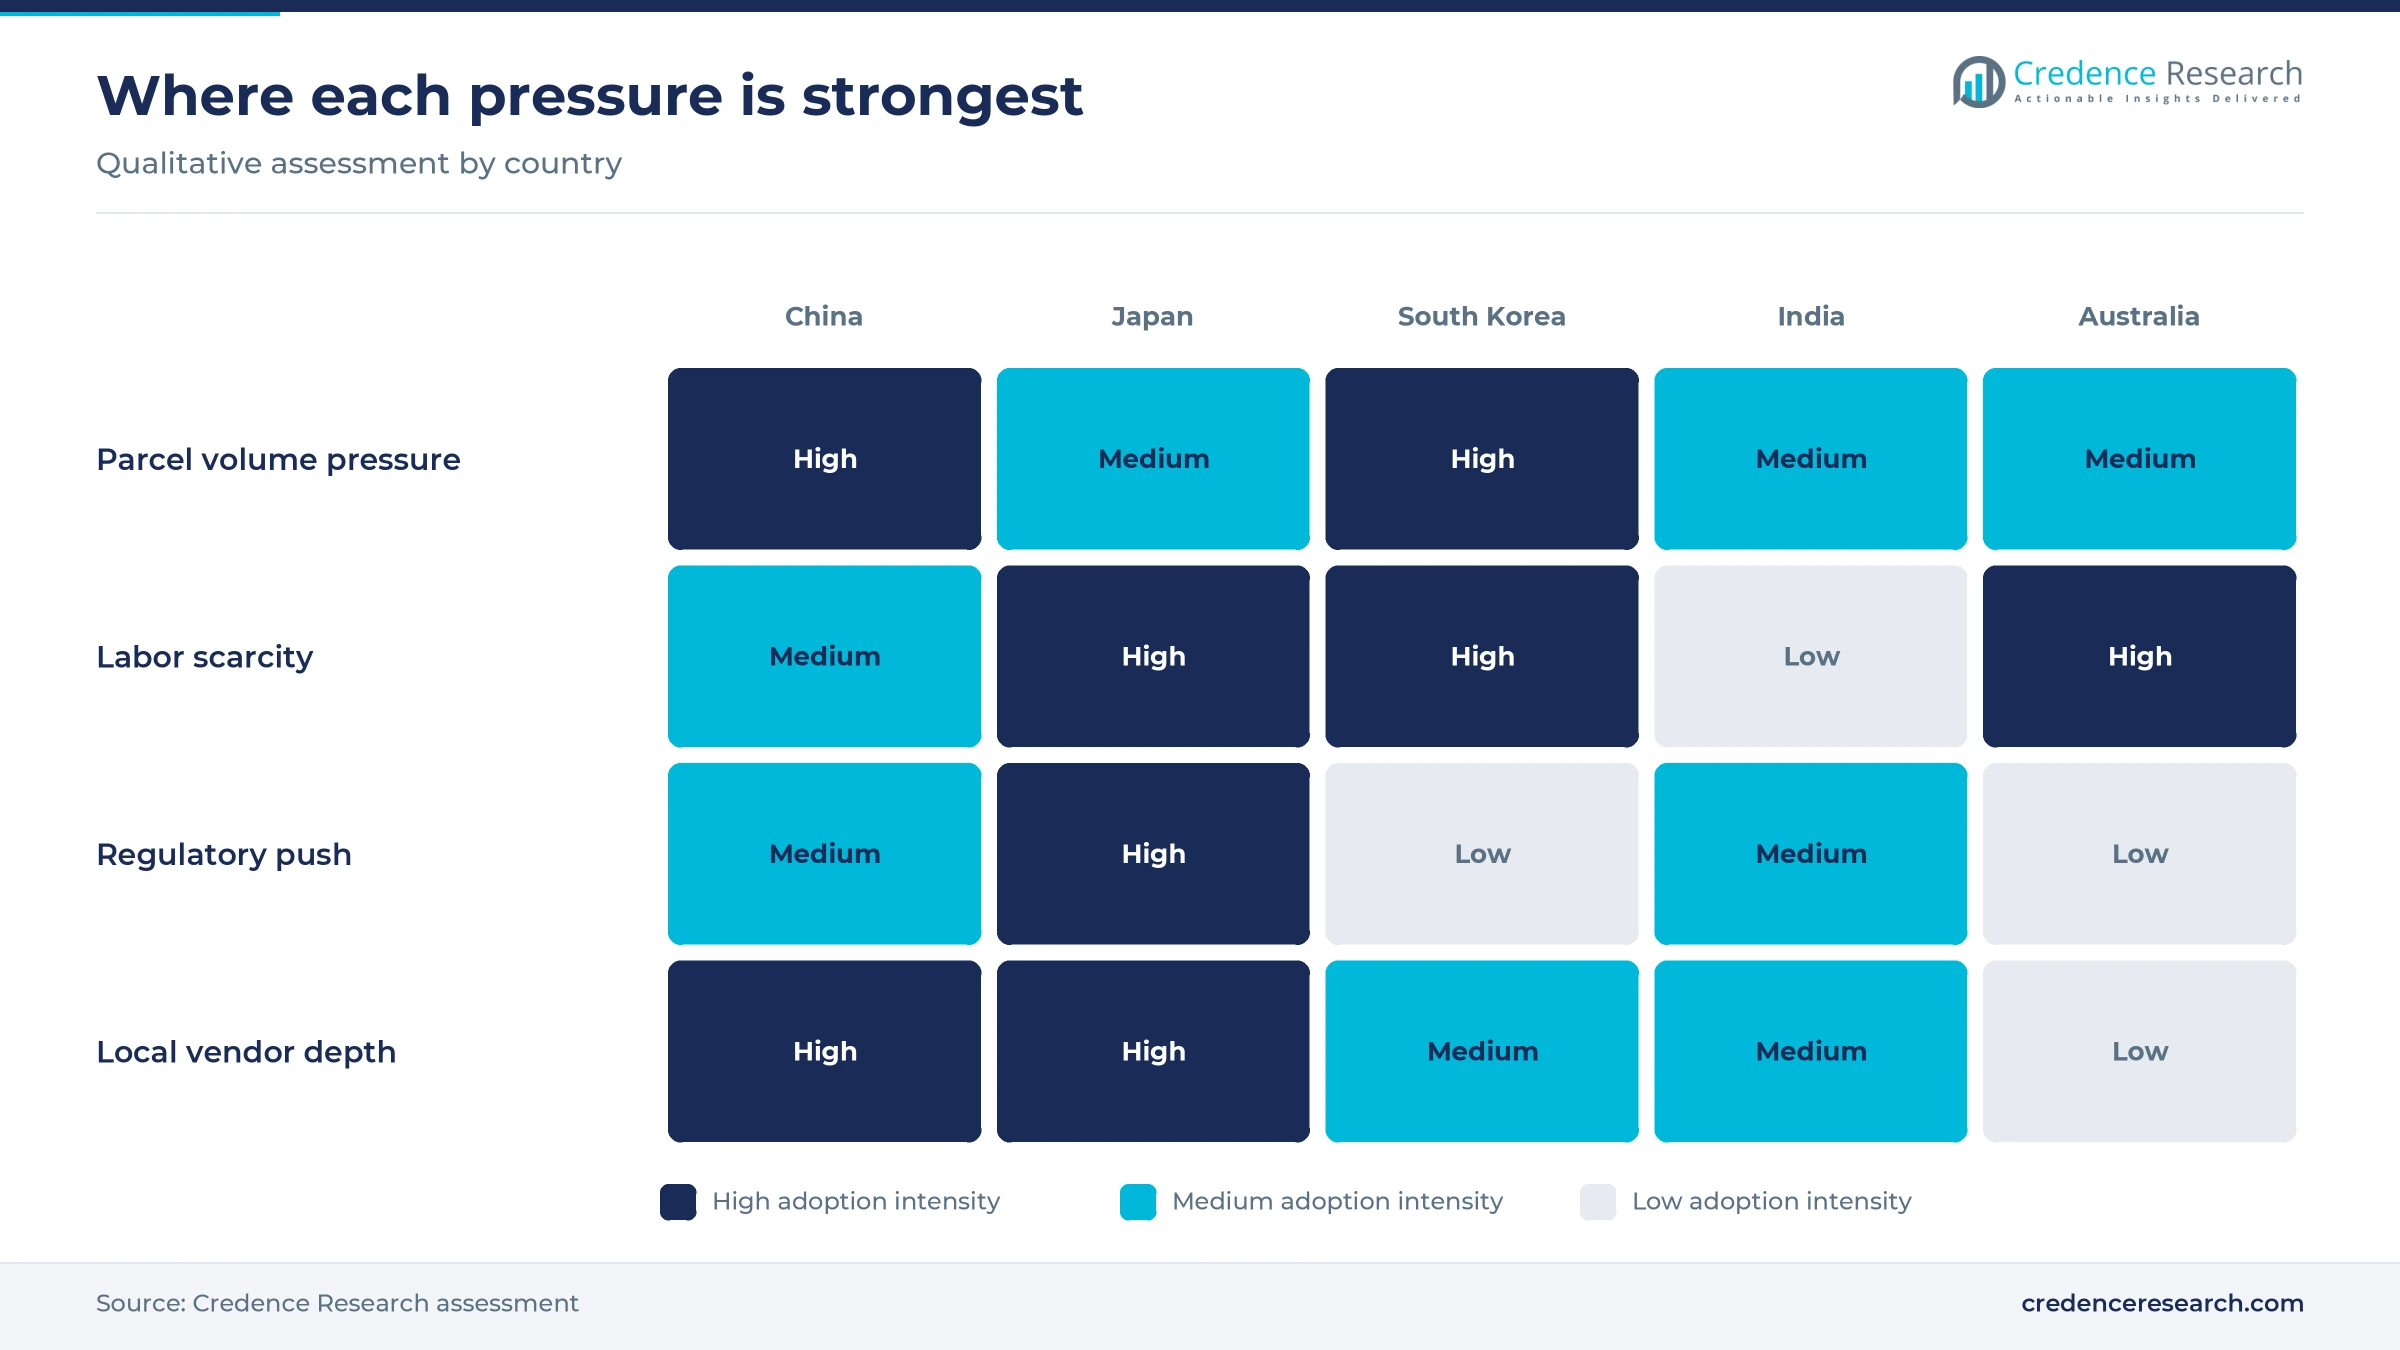
Worker scarcity turns automation from a cost project into a continuity decision, especially in the older economies of Northeast Asia. The World Economic Forum reported in November 2024 that Japanese truck driver numbers peaked at 980,000 in 1995 and could fall to about 520,000 by 2030, leaving a 34% logistics gap after working-hour limits began in April 2024. South Korea shows the response, since Bloomberg reported in February 2023 that Coupang had invested about USD 260 million in a 12-story Daegu operation that cut human workload by about 65%. Global sales of transport and logistics service robots reached 117,500 units in 2025, up 21%, according to the International Federation of Robotics. Those numbers explain why dispatch productivity now anchors regional approvals.
Digital logistics coordination links fleets and shippers
Coordination across machines, sites and trading partners is becoming a purchasing criterion because isolated equipment cannot meet tighter service and reporting demands. Japan now requires shippers handling at least 90,000 tons a year and warehouse operators storing 700,000 tons to file medium-term efficiency plans, with the first submissions due by the end of October 2026, according to Zeroboard guidance on the amended law. Geekplus says its scheduling system can coordinate more than 5,000 devices within one warehouse, and SSI Schaefer connected its WAMAS control system to SAP EWM at Brisbane. Consequently, control and reporting software is gaining budget share, because operators need auditable data as well as physical throughput.
Official logistics cost targets raise productivity pressure
Governments now measure logistics costs closely, which places warehouse and delivery productivity on the policy agenda and gives operators a benchmark for investment. China reported that social logistics costs fell to 13.9% of gross domestic product in 2025, according to the National Development and Reform Commission, after totaling 14.2 trillion yuan in the first three quarters, according to Xinhua. India released its first official estimate on Sept. 20, 2025, when the National Council of Applied Economic Research placed the ratio at 7.97% for the Department for Promotion of Industry and Internal Trade. Together those benchmarks encourage buyers to justify projects on cost per order.
Taller storage, robovans and managed robot contracts
Shift toward taller, denser storage on constrained land
Land cost and labor limits are pushing storage upward, so vendors increasingly sell cubic density rather than floor coverage. Hai Robotics and Maersk opened a Singapore fulfillment center in February 2026 with racks above 10 meters and a design rate of more than 1,000 totes per hour, according to a company release. In Pyeongtaek, Bowoo System runs HaiPick units reaching 8.7 meters for an outdoor fashion brand, according to Korea Newswire in March 2025. India shows the same direction at a larger scale, since Daifuku built a 30-meter stacker crane at Hyderabad, according to The Machine Maker in November 2025. Logistik Express reported in August 2023 about 30% more storage per square meter from seven-deep pallets at Jaycar in Sydney.
Emerging autonomous vans and drones reach the final mile
Automation is moving beyond the warehouse wall, because the final delivery leg still absorbs scarce drivers and has seen few productivity gains. China Daily reported in January 2026 that more than 450 drones carried nearly 4 million parcels during 2025, while JD unmanned vehicles at Pingshan handled about 15,000 parcels a day. Neolix extended that model commercially, and investors backed its plan with over USD 600 million in October 2025, a record private round for Chinese autonomous driving according to The Robot Report. Japan is testing a parallel route through its Autoflow Road plan, with trials planned by fiscal 2027, according to the World Economic Forum. Consequently, Yard and Delivery Automation is forecast to grow at 13.69% a year.
Opening for locally built systems in India
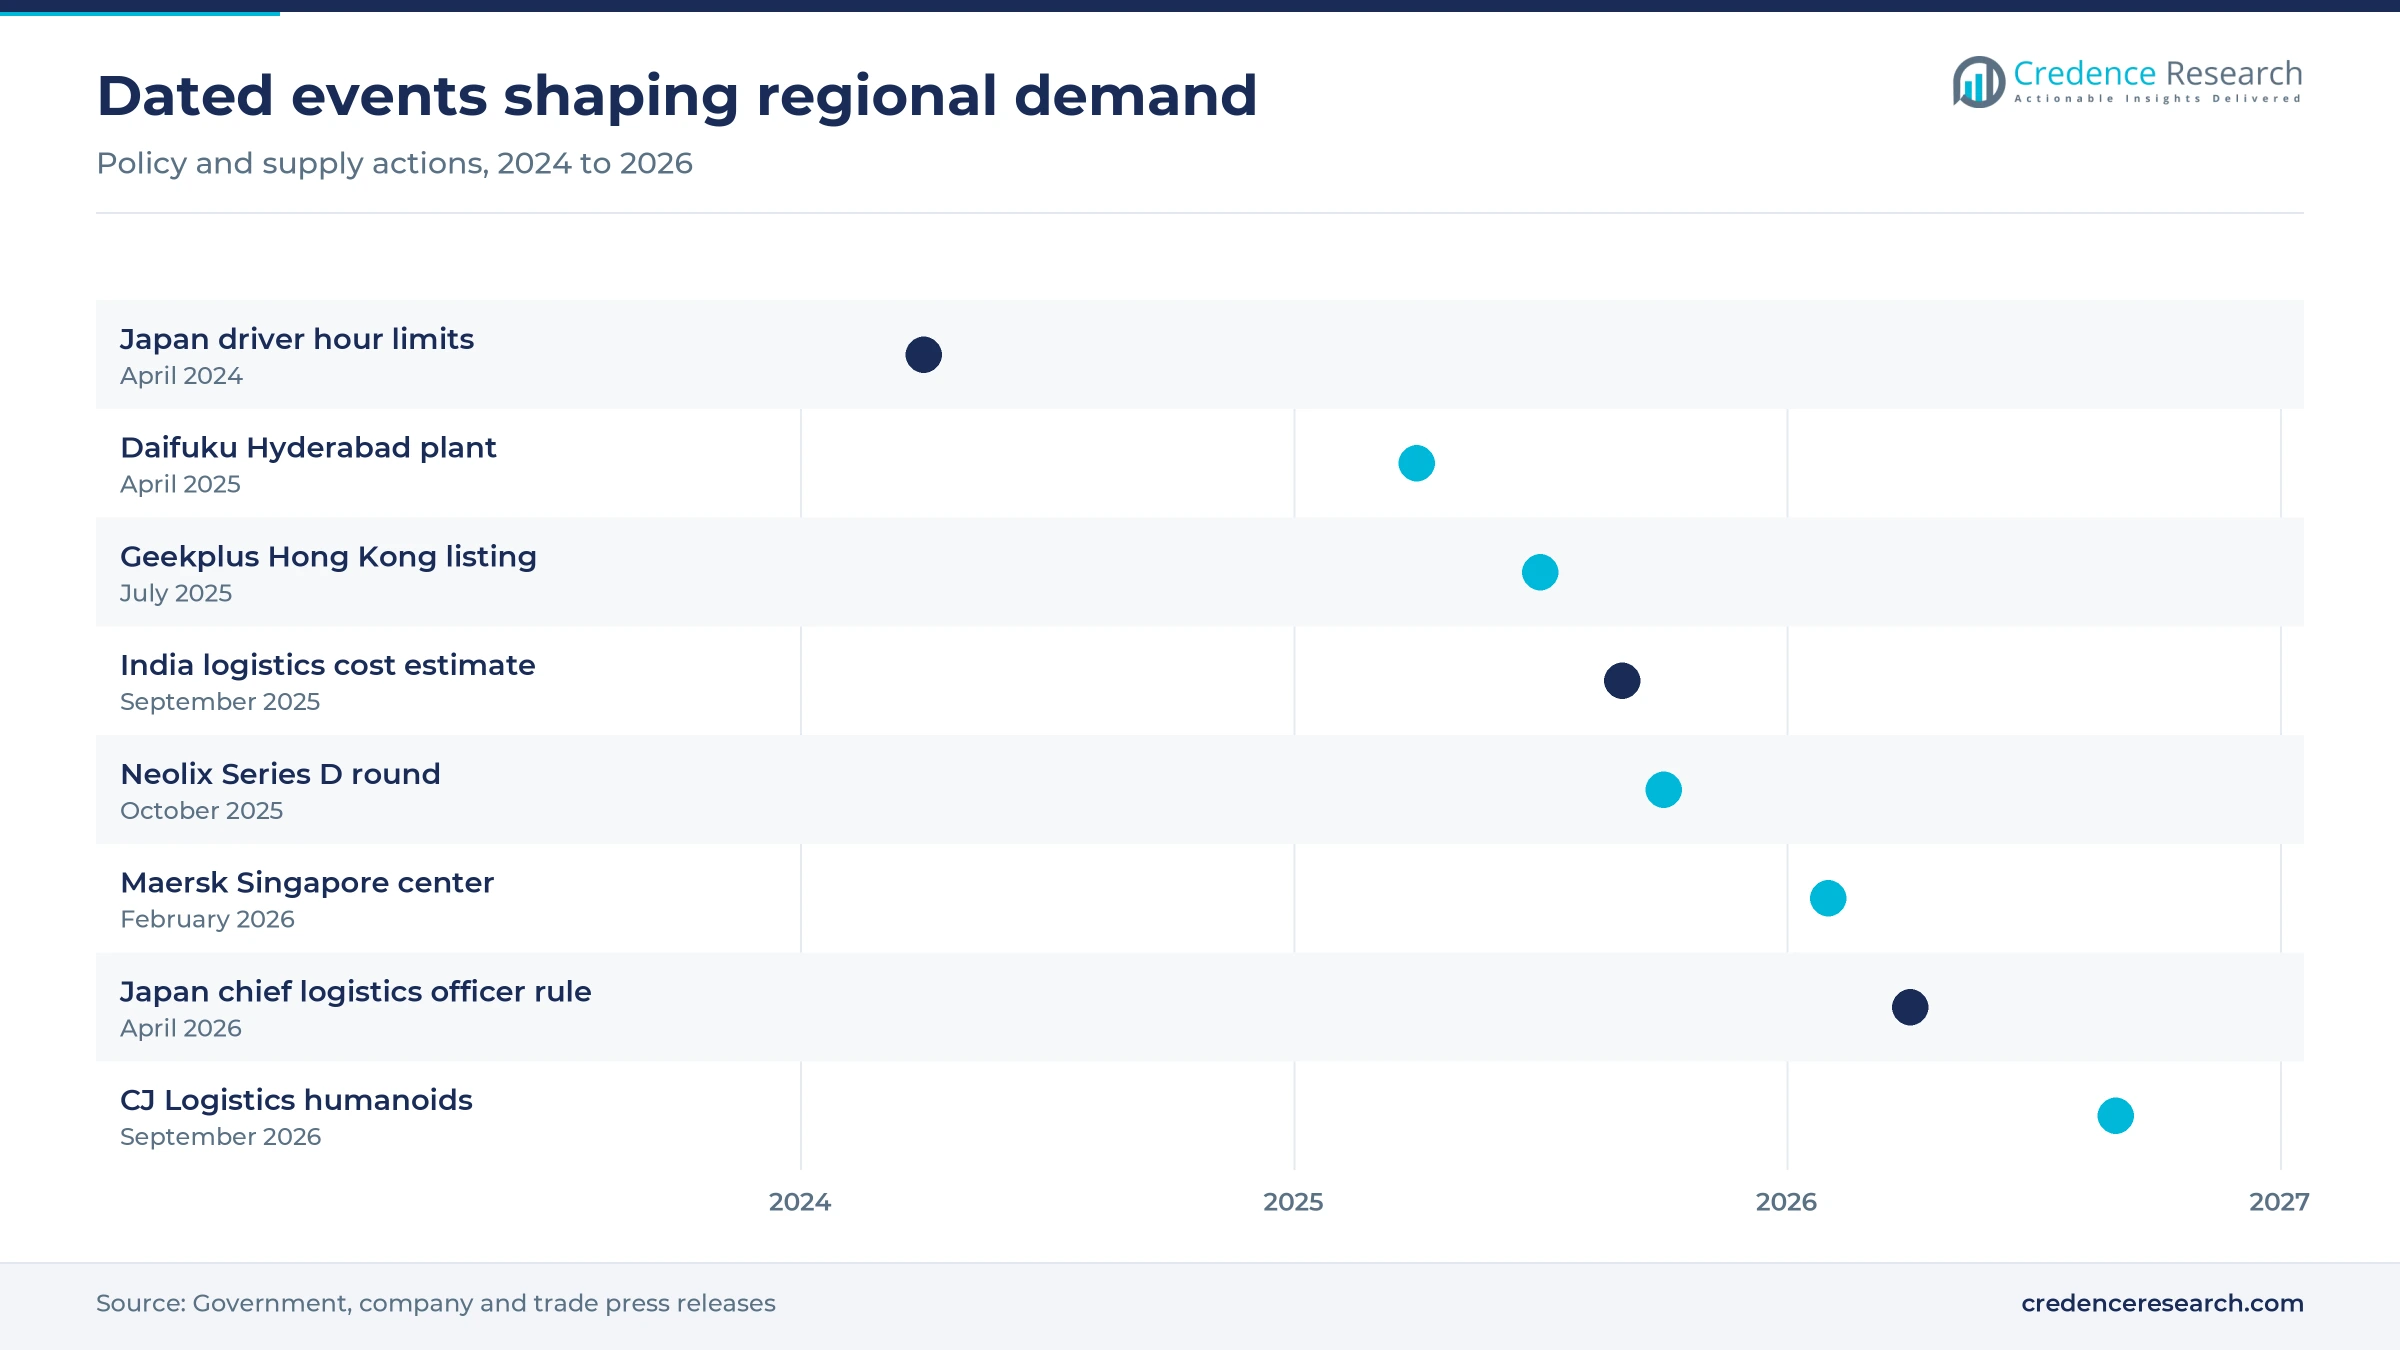
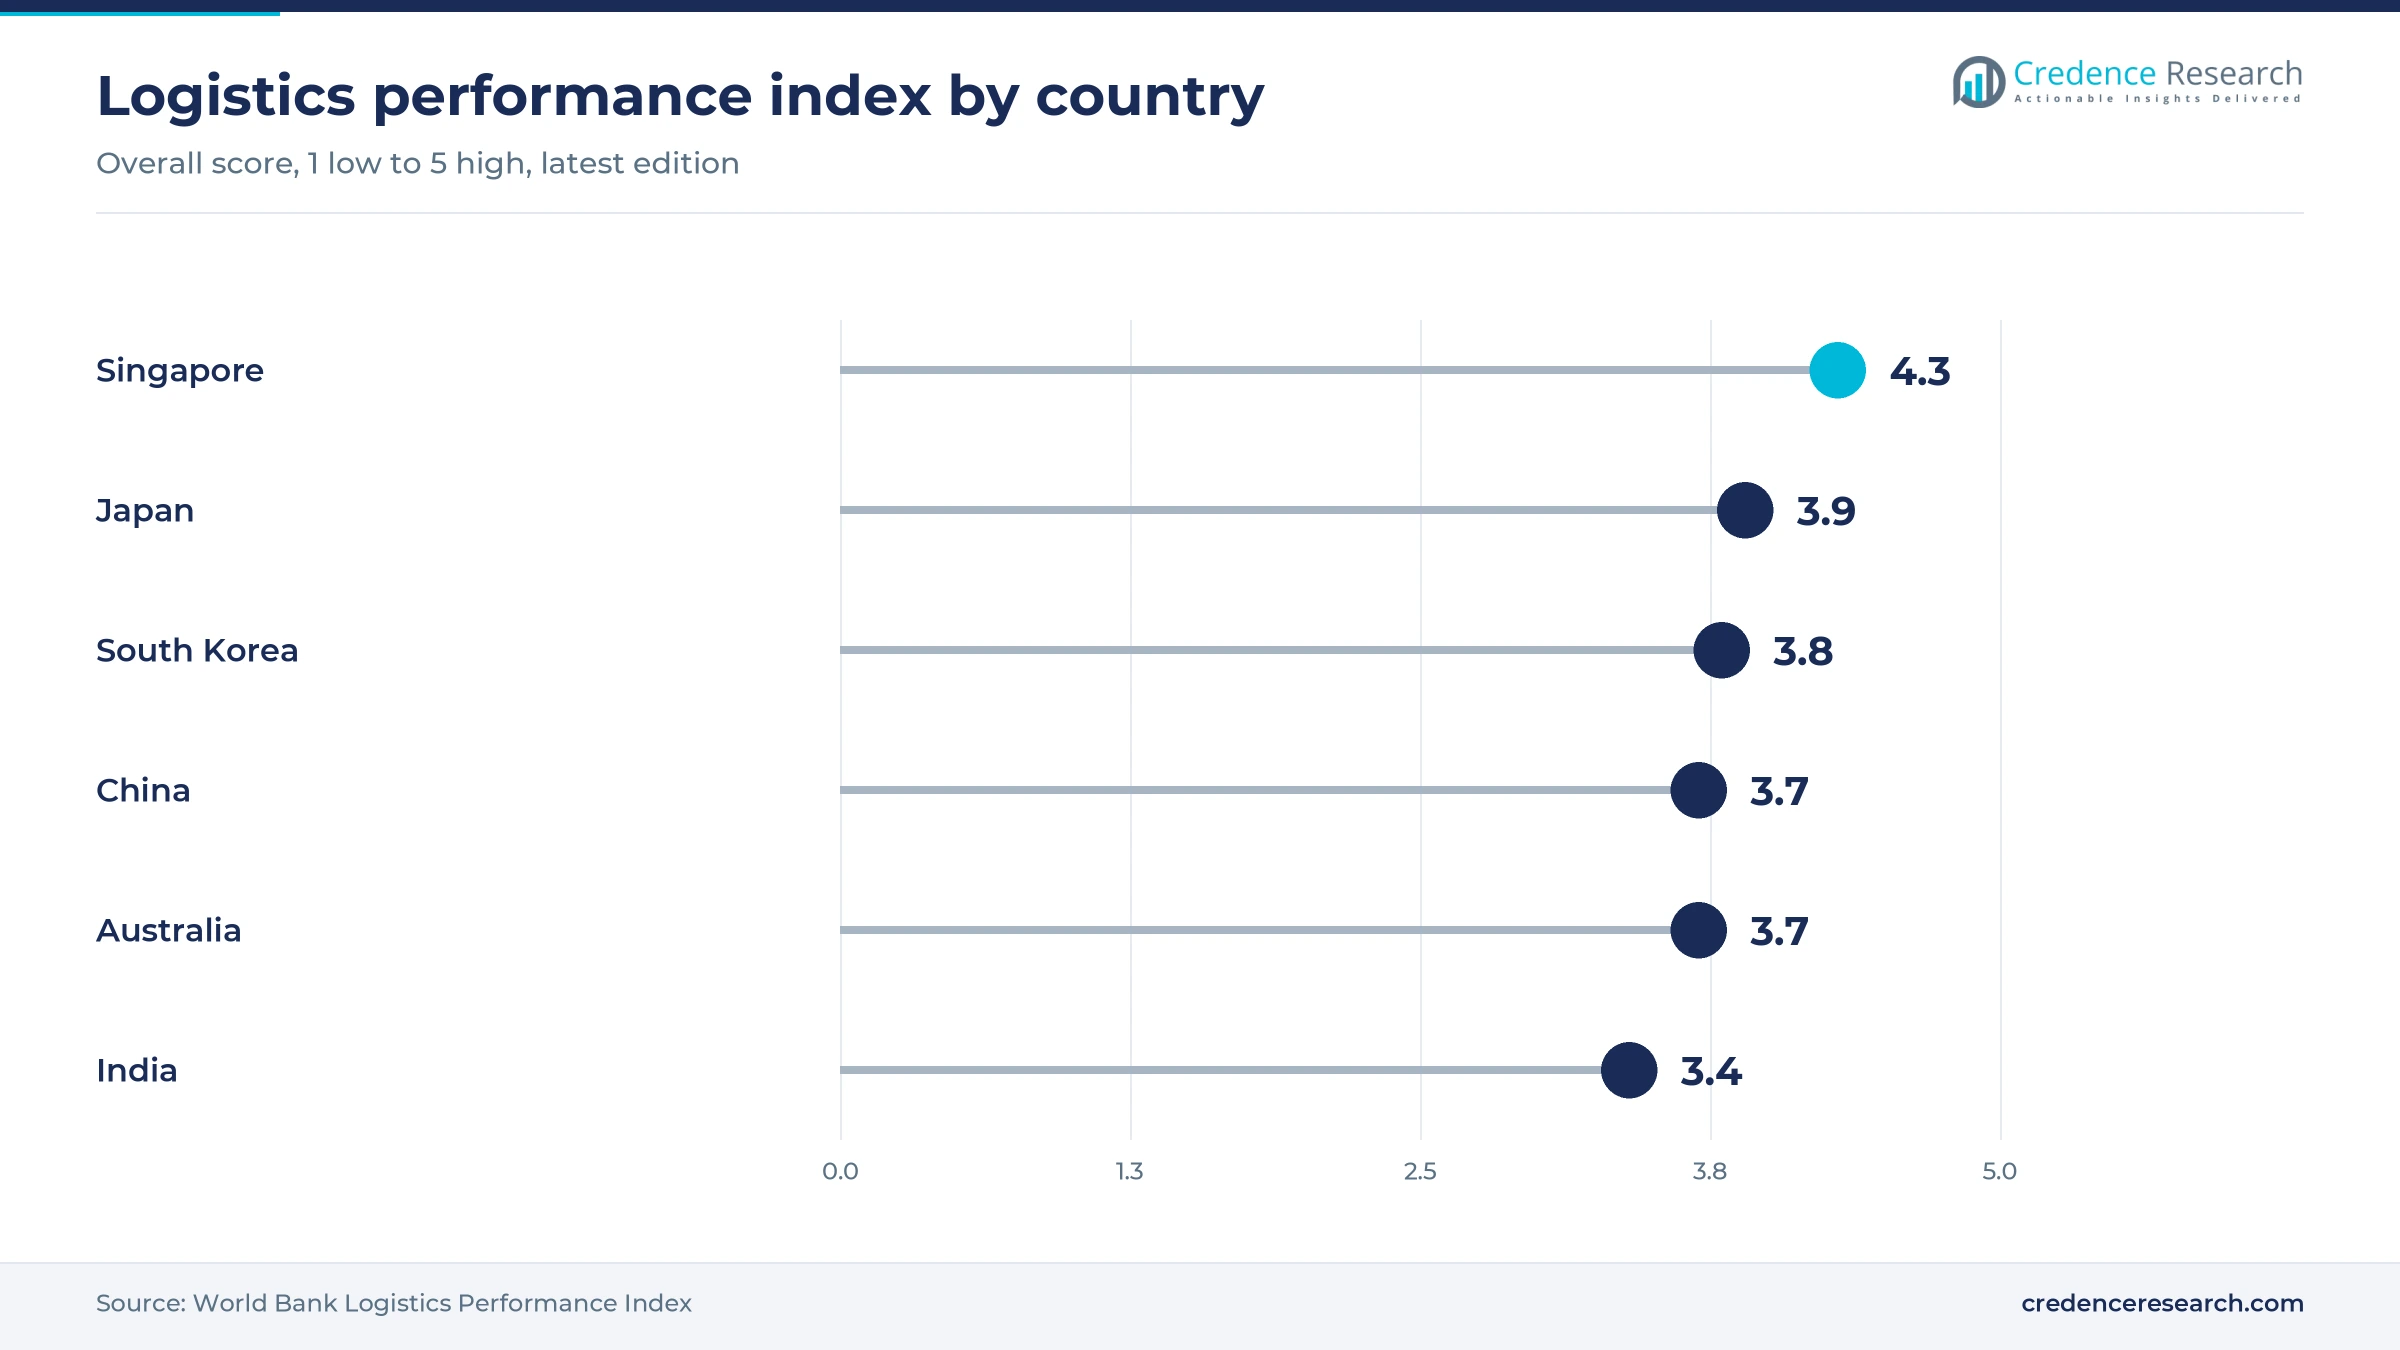
India offers vendors an opening because local production can reduce import dependence and bring system prices closer to domestic buyers. Daifuku opened a 34,000-square-meter plant in Hyderabad in April 2025 after investing ₹227 crore, according to The Machine Maker, and it plans more India-made systems over the next three years. The company already counts more than 300 stacker cranes and more than 400 sorting transfer vehicles installed nationally. Room for improvement remains, since India scored 3.4 against 4.3 for Singapore in the World Bank logistics performance index data dated 2022. Automotive, pharmaceutical and consumer goods plants already figure among Daifuku customers there. These conditions favor suppliers that can localize engineering, assembly and service support before larger tenders open.
Opening for managed robot contracts with contract operators
Contract operators offer an opening for recurring revenue because their client lists change faster than a conventional capital plan can follow. DHL Supply Chain planned to deploy 1,000 robots across Asia-Pacific sectors by 2025, according to Logistics Manager in August 2023. In Hong Kong, Geekplus supplied Janco Global Logistics with 24 picking robots under a monthly adjustable service arrangement, according to a May 2021 company release. The regional contract warehousing base therefore suits subscription offers from robot vendors. The International Federation of Robotics said in September 2026 that robots as a service keep gaining popularity, though traditional sales remained the main monetization channel in transport and logistics. Third-Party Logistics is expected to grow at 12.50% a year as these models spread.
Thin parcel pricing and long lead times slow projects
Parcel price compression weakens express network paybacks
Express carriers fund automation from thinner unit income, which lengthens payback on sortation investment. Chinese parcel volume rose 13.7% in 2025 while sector revenue rose only 6.5%, to 1.5 trillion yuan, according to State Post Bureau figures reported in January 2026. Revenue per parcel therefore fell during the year, which affects carriers buying large hub systems first. Vendors can respond with phased installations and performance-linked pricing, although those structures shift more financing risk onto the supplier and may slow its own cash collection.
Long delivery timelines delay high-end system benefits
High-end systems take long enough to deliver that buyers can miss the demand window they were meant to serve. Japanese capacity is tight, since the Daiwa Institute of Research reported record machinery backlogs in May 2026 and warned that makers could struggle to accept new orders. Retailers and contract operators face the delay most directly, which favors modular robots and earlier ordering.
Robot maker funding strain raises continuity concerns
Intense price competition among robot makers creates a continuity risk for buyers that need decade-long support. Yicai reported in July 2025 that private funding for Chinese robotics firms was drying up amid continuing losses, which was pushing them toward Hong Kong listings. Listings such as the Geekplus debut in Hong Kong on July 9, 2025, show that capital now favors larger suppliers. Operators therefore need escrow arrangements for software, spare-parts commitments and open interfaces before signing long contracts with younger vendors.
Compliance deadlines arrive before systems can be installed
Japan set compliance dates that move faster than complex automation projects can usually be completed on site. Specified businesses had to file their first medium-term plans by the end of October 2026, and the policy goal cuts 125 annual working hours per truck driver, according to Zeroboard guidance. Large shippers and warehouses above the 90,000-ton and 700,000-ton thresholds must therefore show progress before major systems arrive. Many will start with berth scheduling software and semi-automated handling, then fund deeper automation in later budgets.
China sets the scale while India sets the pace
| Country | Value, 2025 (USD billion) | Share, 2025 | CAGR, 2026–2035 |
|---|---|---|---|
| China | 6.50 | 47.0% | 10.74% |
| Japan | 2.56 | 18.5% | 9.94% |
| Rest of Asia Pacific | 1.93 | 14.0% | 12.94% |
| South Korea | 1.11 | 8.0% | 11.34% |
| India | 0.90 | 6.5% | 14.14% |
| Australia | 0.83 | 6.0% | 11.24% |
China combines unmatched volume with the most robot vendors
China held 47.0% of 2025 value and grows at 10.74% a year, slightly below the regional pace because its base is already large. Per capita parcel use climbed from 59 in 2020 to 141 in 2025, according to State Post Bureau data reported by China Daily, and officials project about 214 billion parcels for 2026. Domestic vendors such as Geekplus and Hai Robotics also compete hard on price, which limits value growth even as installed units rise quickly.
Japan buys for continuity as its driver pool shrinks
Japan accounted for 18.5% of 2025 value and grows at 9.94% a year, the slowest rate here because the installed base is mature and domestic vendors serve it deeply. Spending now centers on continuity, since the amended logistics law required chief logistics officers at large shippers from April 2026. Replacement and retrofit demand therefore carries the market, with Japan scoring 3.9 in the World Bank logistics performance index data dated 2022, already among the region's higher results.
South Korea leans on e-commerce operators and robot trials
South Korea represented 8.0% of 2025 value and expands at 11.34% a year, supported by operators that build automation into their own networks. Bloomberg reported that Coupang runs more than 100 fulfillment and logistics centers nationally. CJ Logistics followed with humanoid trials at Gunpo before moving two units into its Yongin site in September 2026, according to The Korea Times. Those pilots should support software and integration work more than heavy equipment in the near term.
India grows fastest from a small but rising base
India held 6.5% of 2025 value and is the fastest-growing country at 14.14% a year, since modern warehouses are still replacing conventional sheds. The Hyderabad plant of Daifuku created more than 100 skilled jobs initially, according to NBM&CW in April 2025, which shortens supply lines for automotive, pharmaceutical and retail buyers. Lower labor costs still limit full automation in smaller sites, so semi-automated storage and sortation are likely to lead early purchasing across the country.
Australia funds large retail and healthcare distribution sites
Australia accounted for 6.0% of 2025 value and grows at 11.24% a year, with a small number of large buyers setting demand. Dematic reported in May 2026 that it employs more than 850 people across Australia and New Zealand and named Woolworths, BIG W and Sigma Healthcare as automation customers. Local project work also continues at Wurth Australia, where Yatala goes live before the larger Keysborough site, showing steady mid-sized demand beyond the grocery majors.
The rest of Asia Pacific follows Southeast Asian commerce
The rest of Asia Pacific held 14.0% of 2025 value and grows at 12.94% a year, led by Singapore and the larger ASEAN economies. Singapore scored 4.3 in the World Bank index data dated 2022, and vendors are organizing around the wider opportunity. Swisslog created an Asia Pacific excluding China structure in March 2026, with its managing director based in Malaysia. Thin margins among regional retailers may still favor modular robots over fixed systems at many sites.
Listings, plants and go-lives that reset the field
| Development | Status and market relevance |
|---|---|
| In April 2025, Daifuku opened its ₹227 crore intralogistics plant at Hyderabad, India. | Operating; it built a locally made 30-meter stacker crane by November 2025 |
| In July 2025, Geekplus listed on the Main Board of the Hong Kong Stock Exchange. | Completed; the public tranche was oversubscribed 133.62 times |
| In October 2025, Neolix raised more than USD 600 million in Series D funding. | Completed; capital supports RoboVan deployment across express and urban freight |
| In February 2026, Maersk opened a Singapore fulfillment center using Hai Robotics systems. | Operating; racks exceed 10 meters for a fashion client |
| In September 2026, CJ Logistics deployed two humanoid robots at Yongin, South Korea. | Live for packing support; picking and sorting tasks are planned next |
Control software now decides system performance
- Goods-to-person storage brings totes to pickers through shuttles, cube systems or case-handling robots, as Dematic is doing with AutoStore at Wurth Australia and CoolDrive.
- High-bay cranes remain the standard for dense pallet storage, and the Lift&Run units at Brisbane serve seven levels within a 30,000-square-meter distribution center.
- Mobile robot fleets move goods without fixed conveyors, and buyers can extend them through autonomous mobile robots or warehouse robotics programs as volumes change.
- Control and management software coordinates each device and order, often connecting to a warehouse management system such as Swisslog SynQ, which Jaycar uses in Sydney.
Need a Custom Version of This Report?
Tailor the scope, geography, or segments to your exact requirements.
- Custom geography or segment scope
- Direct access to our analyst team
Global integrators meet fast Chinese robot vendors
Competition across the region divides between established integrators and faster robot specialists. Daifuku, Dematic, Vanderlande, SSI Schaefer and Swisslog win large multi-year sites through engineering depth, local service teams and proven automated storage and retrieval equipment. Geekplus and Hai Robotics compete on deployment speed, modular fleets and flexible commercial terms, which suits contract operators and retailers with changing order profiles. Swisslog reorganized its Asia Pacific business in March 2026, while Dematic relies on a long Australian presence dating from 1966. Service-heavy markets such as Australia, with 6.0% of 2025 regional demand, already show how local support teams influence vendor selection. Daifuku has responded to local demand by producing cranes in India rather than importing every unit. The next contest centers on software, since customers increasingly compare orchestration quality and lifetime support as well as machine specifications when they award contracts across several sites.
Companies profiled and their roles in this market
| Company | Type | Role in the market |
|---|---|---|
| Daifuku | Integrator and manufacturer | Runs a Hyderabad plant and counts more than 300 stacker cranes installed in India |
| Dematic | Integrator | Installs AutoStore systems and iQ software for Australian distributors |
| Vanderlande | Integrator | Automating the Kmart Group facility at Moorebank in Sydney |
| SSI Schaefer | Integrator and manufacturer | Built the Coca-Cola Europacific Partners high-bay warehouse at Brisbane |
| Swisslog | Integrator | Runs Jaycar systems in Sydney and reorganized its regional leadership in March 2026 |
| Geekplus | Robot vendor | Hong Kong-listed mobile robot provider offering rental models to contract operators |
| Hai Robotics | Robot vendor | Supplies high-density case-handling robots in Singapore and South Korea |
Why orchestration software matters more than machines
Credence Research's view is that the buying decision is moving from the machine to the orchestration layer. Hardware remains the largest budget line, yet Japanese reporting duties, multi-site retailers and mixed robot fleets all reward operators that can see and direct every device from one system. Vendors with strong control software and service teams should therefore hold pricing better than vendors selling units alone. The most assumption-heavy estimates in this report are the country shares, because no agency publishes automation spending by country, so readers should treat them as directional.
How the estimates were built and what they rely on
The report uses 2025 as the base year and forecasts values through 2035. Market values come from the Credence Research model, and segment and country splits are Credence Research estimates. Inputs include national statistics, government publications, company releases, trade press and World Bank logistics indicators. A top-down check compared regional logistics cost pools with a plausible automation spending ratio. No interviews or surveys were conducted for this edition, and company figures appear only where a named public source states them.
Regional spending nearly triples by the 2035 horizon
Spending should keep compounding through 2035 as parcel flows, labor limits and reporting duties persist together. China remains the largest country on scale, although value growth depends on vendors defending prices. India and Southeast Asia should gain share as local production, modern warehouses and commerce volumes expand. Delivery vehicles and software will grow faster than fixed equipment. Japan, with 18.5% of 2025 regional demand, should move steadily through replacement cycles during the decade. The main risks are parcel price compression, long delivery timelines and supplier consolidation, any of which could shift individual project budgets later without removing underlying demand.
Frequently Asked Questions
How big is the Asia Pacific logistics automation market?
What is driving logistics automation spending in Asia Pacific?
Which country leads the regional market?
Which country is growing fastest?
Which solution type takes the largest share?
Who are the main companies in this market?
What are the main risks to growth?
How does Japanese regulation affect automation demand?
Table of Content
Chapter 1 Market Segmentation
- 1.1 Segmentation Framework
- 1.1.1 Product and Service Classification
- 1.1.2 Application and End-Use Classification
- 1.1.3 Technology and Solution Classification
- 1.1.4 Customer and Distribution Channel Classification
- 1.1.5 Geographic Segmentation
- 1.1.6 Market Segment Definitions and Boundaries
- 1.2 By Solution Type
- 1.2.1 Hardware
- 1.2.2 Software
- 1.2.3 Services
- 1.3 By Application
- 1.3.1 Inbound and Inventory Handling
- 1.3.2 Outbound Fulfillment
- 1.3.3 Yard and Delivery Automation
- 1.4 By End-Use Industry
- 1.4.1 Retail and E-Commerce
- 1.4.2 Third-Party Logistics
- 1.4.3 Manufacturing
- 1.4.4 Regulated and Specialized Distribution
- 1.5 By Project Type
- 1.5.1 Greenfield Installations
- 1.5.2 Brownfield Retrofits
- 1.5.3 Capacity Expansions
- 1.6 By Country
- 1.6.1 China
- 1.6.2 Japan
- 1.6.3 South Korea
- 1.6.4 India
- 1.6.5 Australia
- 1.6.6 Rest of Asia Pacific
Chapter 2 Introduction
- 2.1 Report Objectives and Scope
- 2.2 Product Definition and Industry Terminology
- 2.3 Market Inclusions and Exclusions
- 2.4 Research Process
- 2.4.1 Primary Research and Expert Interviews
- 2.4.2 Secondary Research and Source Review
- 2.4.3 Top-Down and Bottom-Up Estimation
- 2.4.4 Data Triangulation and Verification
- 2.5 Market Size Measurement Basis
- 2.5.1 2025: USD 13.82 billion → 2035: USD 40.24 billion
- 2.6 Historical and Forecast Reference Periods
- 2.6.1 Historical Period: 2018-2025
- 2.6.2 Base Year: 2025
- 2.6.3 Forecast Period: 2025-2035
- 2.7 Research Assumptions and Limitations
Chapter 3 Executive Summary
- 3.1 Market Snapshot and Key Findings
- 3.2 Base-Year Market Size, 2025
- 3.3 Forecast Market Size, 2035
- 3.4 Revenue and Volume Growth Outlook
- 3.5 Key Demand and Supply Indicators
- 3.6 Leading Market Segments
- 3.7 Fastest-Growing Market Opportunities
- 3.8 Regional Performance Highlights
- 3.9 Technology and Industry Transformation
- 3.10 Competitive Landscape Summary
- 3.11 Analyst View and Strategic Implications
Chapter 4 Asia Pacific Logistics Automation Market Trends and Developments
- 4.1 Historical Industry Development, 2018-2025
- 4.2 Recent Market Trends and Developments
- 4.3 Demand and Customer Behavior Trends
- 4.4 Technology and Product Innovation
- 4.5 Artificial Intelligence, Automation and Digitalization
- 4.6 Local Manufacturing and Supply Chain Realignment
- 4.7 Industry Partnerships, Mergers and Acquisitions
- 4.8 Sustainability and Circular Economy Developments
- 4.9 Government and Private Sector Investment Trends
- 4.10 Emerging Business Models and Commercialization
- 4.11 Industry Developments and Announcements
Chapter 5 Asia Pacific Logistics Automation Market Production, Supply and Demand Analysis
- 5.1 Demand Trend and Consumption Analysis, 2018-2025
- 5.2 Demand Forecast, 2025-2035
- 5.3 Production and Output Trend, 2018-2025
- 5.4 Production and Output Forecast, 2025-2035
- 5.5 Installed Capacity and Capacity Utilization
- 5.6 Company-Wise Production Plants and Statistics
- 5.6.1 Installed Production Capacity
- 5.6.2 Actual Production
- 5.6.3 Planned Capacity and Expansion Targets
- 5.7 Supply Chain Structure and Procurement Trends
- 5.8 Supply-Demand Gap and Bottlenecks
- 5.9 Import Dependence and Sourcing Structure
- 5.10 Contract Manufacturing and Outsourcing
- 5.11 Regional Supply and Demand Concentration
Chapter 6 Asia Pacific Logistics Automation Market Pricing Analysis
- 6.1 Pricing Structure and Measurement
- 6.2 Historical Pricing Trends, 2018-2025
- 6.3 Pricing Outlook, 2025-2035
- 6.4 Average Selling Price and Unit Economics
- 6.5 Pricing by Product and Market Segment
- 6.6 Geographic Pricing Differences
- 6.7 Key Input, Energy, Labor and Logistics Costs
- 6.8 Contract Pricing and Purchasing Models
- 6.9 Pricing Sensitivity and Competitive Positioning
- 6.10 Price, Margin and Profitability Implications
Chapter 7 Asia Pacific Logistics Automation Market Dynamics
- 7.1 Market Growth Drivers
- 7.1.1 Demand-Side Drivers
- 7.1.2 Technology and Innovation Drivers
- 7.1.3 Infrastructure and Investment Drivers
- 7.1.4 Regulatory and Policy Drivers
- 7.2 Market Restraints
- 7.2.1 Cost and Affordability Constraints
- 7.2.2 Technology and Adoption Barriers
- 7.2.3 Supply Chain and Operational Constraints
- 7.3 Market Challenges
- 7.3.1 Competitive Pressure and Margin Erosion
- 7.3.2 Skills, Infrastructure and Implementation Gaps
- 7.4 Emerging Market Opportunities
- 7.5 Market Dynamics Impact and Time-Horizon Assessment
Chapter 8 Asia Pacific Logistics Automation Value Chain Analysis
- 8.1 Industry Value Chain Overview
- 8.2 Upstream Suppliers and Critical Inputs
- 8.3 Technology and Component Providers
- 8.4 Manufacturing or Service Delivery
- 8.5 Distribution, Channel Partners and Integrators
- 8.6 Downstream Applications and End Users
- 8.7 Value Addition and Profit Pools
- 8.8 Vertical Integration and Outsourcing
- 8.9 Supplier Concentration and Risk
- 8.10 Supply Chain Localization and Resilience
Chapter 9 Asia Pacific Logistics Automation Market Regulations and Policies
- 9.1 Relevant Laws, Standards and Compliance Frameworks
- 9.2 Product, Service, Safety and Quality Requirements
- 9.3 Government Policies, Incentives and Subsidies
- 9.4 Imports, Exports and Trade Barriers
- 9.5 Public Procurement and Local Content Requirements
- 9.6 Environmental and Sustainability Compliance
- 9.7 Upcoming Policy Changes and Market Implications
Chapter 10 Asia Pacific Logistics Automation Market Hotspots and Opportunities
- 10.1 Market Opportunity Mapping and Growth Hotspots
- 10.2 High-Growth Applications and Customer Groups
- 10.3 Underserved Markets and White-Space Opportunities
- 10.4 Emerging Technology and Product Opportunities
- 10.5 New Capacity and Investment Hotspots
- 10.6 Market Entry and Expansion Opportunities
- 10.7 Distribution and Partnership Opportunities
- 10.8 Near-Term and Long-Term Commercial Potential
- 10.9 Opportunity Attractiveness and Execution Risks
Chapter 11 Asia Pacific Logistics Automation Market Outlook, 2025-2035
- 11.1 Market Size and Analysis
- 11.1.1 Revenue (Market Measurement: 2025: USD 13.82 billion → 2035: USD 40.24 billion)
- 11.1.2 Market Volume and Quantity Sold
- 11.1.3 Historical Market Size, 2018-2025
- 11.1.4 Base-Year Market Size, 2025
- 11.2 Market Forecast, 2025-2035
- 11.2.1 Revenue Forecast to 2035
- 11.2.2 Volume Forecast to 2035
- 11.2.3 CAGR and Year-on-Year Growth
- 11.2.4 Incremental Revenue Opportunity
- 11.3 Forecast Assumptions and Scenario Analysis
- 11.3.1 Base-Case Forecast
- 11.3.2 Optimistic and Conservative Scenarios
- 11.3.3 Technology, Pricing and Policy Sensitivities
- 11.4 Market Attractiveness and Growth Outlook
Chapter 12 Asia Pacific Logistics Automation Market Segmentation and Outlook
- 12.1 Segmentation Summary and Market Shares, 2025
- 12.2 Largest and Fastest-Growing Segments
- 12.3 By Solution Type - Market Size and Forecast, 2025-2035
- 12.3.1 Segment Definition and Scope
- 12.3.2 Historical Market Size, 2018-2025
- 12.3.3 Revenue Forecast, 2025-2035
- 12.3.4 Volume Forecast, 2025-2035
- 12.3.5 Base-Year Market Share, 2025
- 12.3.6 Segment CAGR and Growth Drivers
- 12.3.7 Subsegment Market Size and Forecast
- 12.3.7.1 Hardware
- 12.3.7.2 Software
- 12.3.7.3 Services
- 12.3.8 Subsegment Pricing and Adoption Trends
- 12.3.9 Leading Suppliers and Competition
- 12.3.10 Regional Demand and Opportunities
- 12.4 By Application - Market Size and Forecast, 2025-2035
- 12.4.1 Segment Definition and Scope
- 12.4.2 Historical Market Size, 2018-2025
- 12.4.3 Revenue Forecast, 2025-2035
- 12.4.4 Volume Forecast, 2025-2035
- 12.4.5 Base-Year Market Share, 2025
- 12.4.6 Segment CAGR and Growth Drivers
- 12.4.7 Subsegment Market Size and Forecast
- 12.4.7.1 Inbound and Inventory Handling
- 12.4.7.2 Outbound Fulfillment
- 12.4.7.3 Yard and Delivery Automation
- 12.4.8 Subsegment Pricing and Adoption Trends
- 12.4.9 Leading Suppliers and Competition
- 12.4.10 Regional Demand and Opportunities
- 12.5 By End-Use Industry - Market Size and Forecast, 2025-2035
- 12.5.1 Segment Definition and Scope
- 12.5.2 Historical Market Size, 2018-2025
- 12.5.3 Revenue Forecast, 2025-2035
- 12.5.4 Volume Forecast, 2025-2035
- 12.5.5 Base-Year Market Share, 2025
- 12.5.6 Segment CAGR and Growth Drivers
- 12.5.7 Subsegment Market Size and Forecast
- 12.5.7.1 Retail and E-Commerce
- 12.5.7.2 Third-Party Logistics
- 12.5.7.3 Manufacturing
- 12.5.7.4 Regulated and Specialized Distribution
- 12.5.8 Subsegment Pricing and Adoption Trends
- 12.5.9 Leading Suppliers and Competition
- 12.5.10 Regional Demand and Opportunities
- 12.6 By Project Type - Market Size and Forecast, 2025-2035
- 12.6.1 Segment Definition and Scope
- 12.6.2 Historical Market Size, 2018-2025
- 12.6.3 Revenue Forecast, 2025-2035
- 12.6.4 Volume Forecast, 2025-2035
- 12.6.5 Base-Year Market Share, 2025
- 12.6.6 Segment CAGR and Growth Drivers
- 12.6.7 Subsegment Market Size and Forecast
- 12.6.7.1 Greenfield Installations
- 12.6.7.2 Brownfield Retrofits
- 12.6.7.3 Capacity Expansions
- 12.6.8 Subsegment Pricing and Adoption Trends
- 12.6.9 Leading Suppliers and Competition
- 12.6.10 Regional Demand and Opportunities
- 12.7 By Country - Market Size and Forecast, 2025-2035
- 12.7.1 Segment Definition and Scope
- 12.7.2 Historical Market Size, 2018-2025
- 12.7.3 Revenue Forecast, 2025-2035
- 12.7.4 Volume Forecast, 2025-2035
- 12.7.5 Base-Year Market Share, 2025
- 12.7.6 Segment CAGR and Growth Drivers
- 12.7.7 Subsegment Market Size and Forecast
- 12.7.7.1 China
- 12.7.7.2 Japan
- 12.7.7.3 South Korea
- 12.7.7.4 India
- 12.7.7.5 Australia
- 12.7.7.6 Rest of Asia Pacific
- 12.7.8 Subsegment Pricing and Adoption Trends
- 12.7.9 Leading Suppliers and Competition
- 12.7.10 Regional Demand and Opportunities
- 12.8 Segment Growth Comparison
- 12.9 Segment Attractiveness and Priority Matrix
Chapter 13 Asia Pacific Logistics Automation End-Use and Application Market Outlook
- 13.1 End-Use Industry and Customer Demand Structure
- 13.2 Leading Applications and Customer Groups
- 13.3 End-Use Market Size, Share and Forecast
- 13.4 Major End-Use Industry Deep Dives
- 13.4.1 Customer Requirements and Use Cases
- 13.4.2 Demand and Replacement Cycles
- 13.4.3 Technical and Regulatory Considerations
- 13.4.4 Purchasing and Procurement Models
- 13.4.5 Leading Vendors and Distribution Channels
- 13.4.6 Forecast and Commercial Opportunities
- 13.5 Emerging Applications and Cross-Segment Demand
- 13.6 End-Use Industry Investment Priorities
Chapter 14 Asia Pacific Logistics Automation Geographic Market Outlook, 2025-2035
- 14.1 Regional Market Size and Country-Level Shares, 2025
- 14.2 Country Market Size Comparison, 2025
- 14.3 Country Market Forecasts, 2025-2035
- 14.4 Subregional Industrial and Demand Clusters
- 14.5 Intra-Regional Pricing and Cost Differences
- 14.6 Cross-Border Trade and Supply Networks
- 14.7 Regional Supply and Demand Balances
- 14.8 Country Opportunity Comparison and Prioritization
Note: Every listed country is covered on the structure shown under the first country.
Chapter 15 Asia Pacific Logistics Automation Technology, Innovation and Sustainability Outlook
- 15.1 Technology Landscape and Maturity
- 15.2 Product, Process and Service Innovation
- 15.3 AI, Automation and Digital Tools in the Industry
- 15.4 Technology Adoption and Performance Benchmarking
- 15.5 Innovation Pipeline and R&D Investment
- 15.6 Patent and Intellectual Property Trends
- 15.7 Energy Efficiency and Resource Management
- 15.8 Sustainability, Recycling and Circularity
- 15.9 Technology Roadmap, 2025-2035
- 15.10 Risks of Obsolescence and Technology Substitution
Chapter 16 Asia Pacific Logistics Automation Market Key Strategic Imperatives
- 16.1 Growth and Market Entry Priorities
- 16.2 High-Return Products and Segments
- 16.3 Pricing, Profitability and Cost Optimization
- 16.4 Technology Investment and Product Differentiation
- 16.5 Supply Chain Localization and Resilience
- 16.6 Distribution and Customer Acquisition
- 16.7 Partnership, Acquisition and Capacity Strategy
- 16.8 Regional Expansion Priorities
- 16.9 Short-, Medium- and Long-Term Actions
Chapter 17 Competition Outlook
- 17.1 Industry Competition Characteristics
- 17.2 Market Structure and Concentration
- 17.3 Market Share and Competitive Positioning, 2025
- 17.4 Company-Wise Revenue and Product Benchmarking
- 17.5 Production and Service Capacity Benchmarking
- 17.6 Technology, Pricing and Differentiation
- 17.7 Regional Footprint and Distribution Strength
- 17.8 Mergers, Acquisitions and Strategic Alliances
- 17.9 New Entrants and Competitive Threats
- 17.10 Porter's Five Forces and Industry Attractiveness
- 17.11 Competitive Outlook, 2025-2035
Chapter 18 Company Profiles
- 18.1 Company Coverage and Selection Criteria
- 18.2 Daifuku
- 18.2.1 Business Description
- 18.2.2 Company Ownership and Geographic Presence
- 18.2.3 Product and Service Portfolio
- 18.2.4 Manufacturing and Operating Footprint
- 18.2.5 Production Capacity and Expansion Plans
- 18.2.6 Financial Performance and Investment
- 18.2.7 Market Share and Competitive Position
- 18.2.8 Technology and Innovation Capabilities
- 18.2.9 Strategic Alliances or Partnerships
- 18.2.10 Recent Developments
- 18.2.11 Growth Strategy and Outlook
- 18.3 Dematic
- 18.4 Murata Machinery
- 18.5 Vanderlande
- 18.6 SSI SCHAEFER
- 18.7 Intelligrated
- 18.8 Geekplus
- 18.9 Hai Robotics
- 18.10 KNAPP
- 18.11 Swisslog
- 18.12 Other Relevant Market Participants
Note: Every listed company is profiled on the structure shown under the first company. The company list is preliminary and may change based on research findings, market developments, data availability and client requirements.
Chapter 19 Disclaimer
- 19.1 Research and Forecast Disclaimer
- 19.2 Data Source and Estimation Limitations
Note: The depth of individual sections depends on data availability for this market. Volume, capacity, trade and other unit-based metrics are included where applicable.

