
Parcel volumes and labor limits reshape warehouse spending
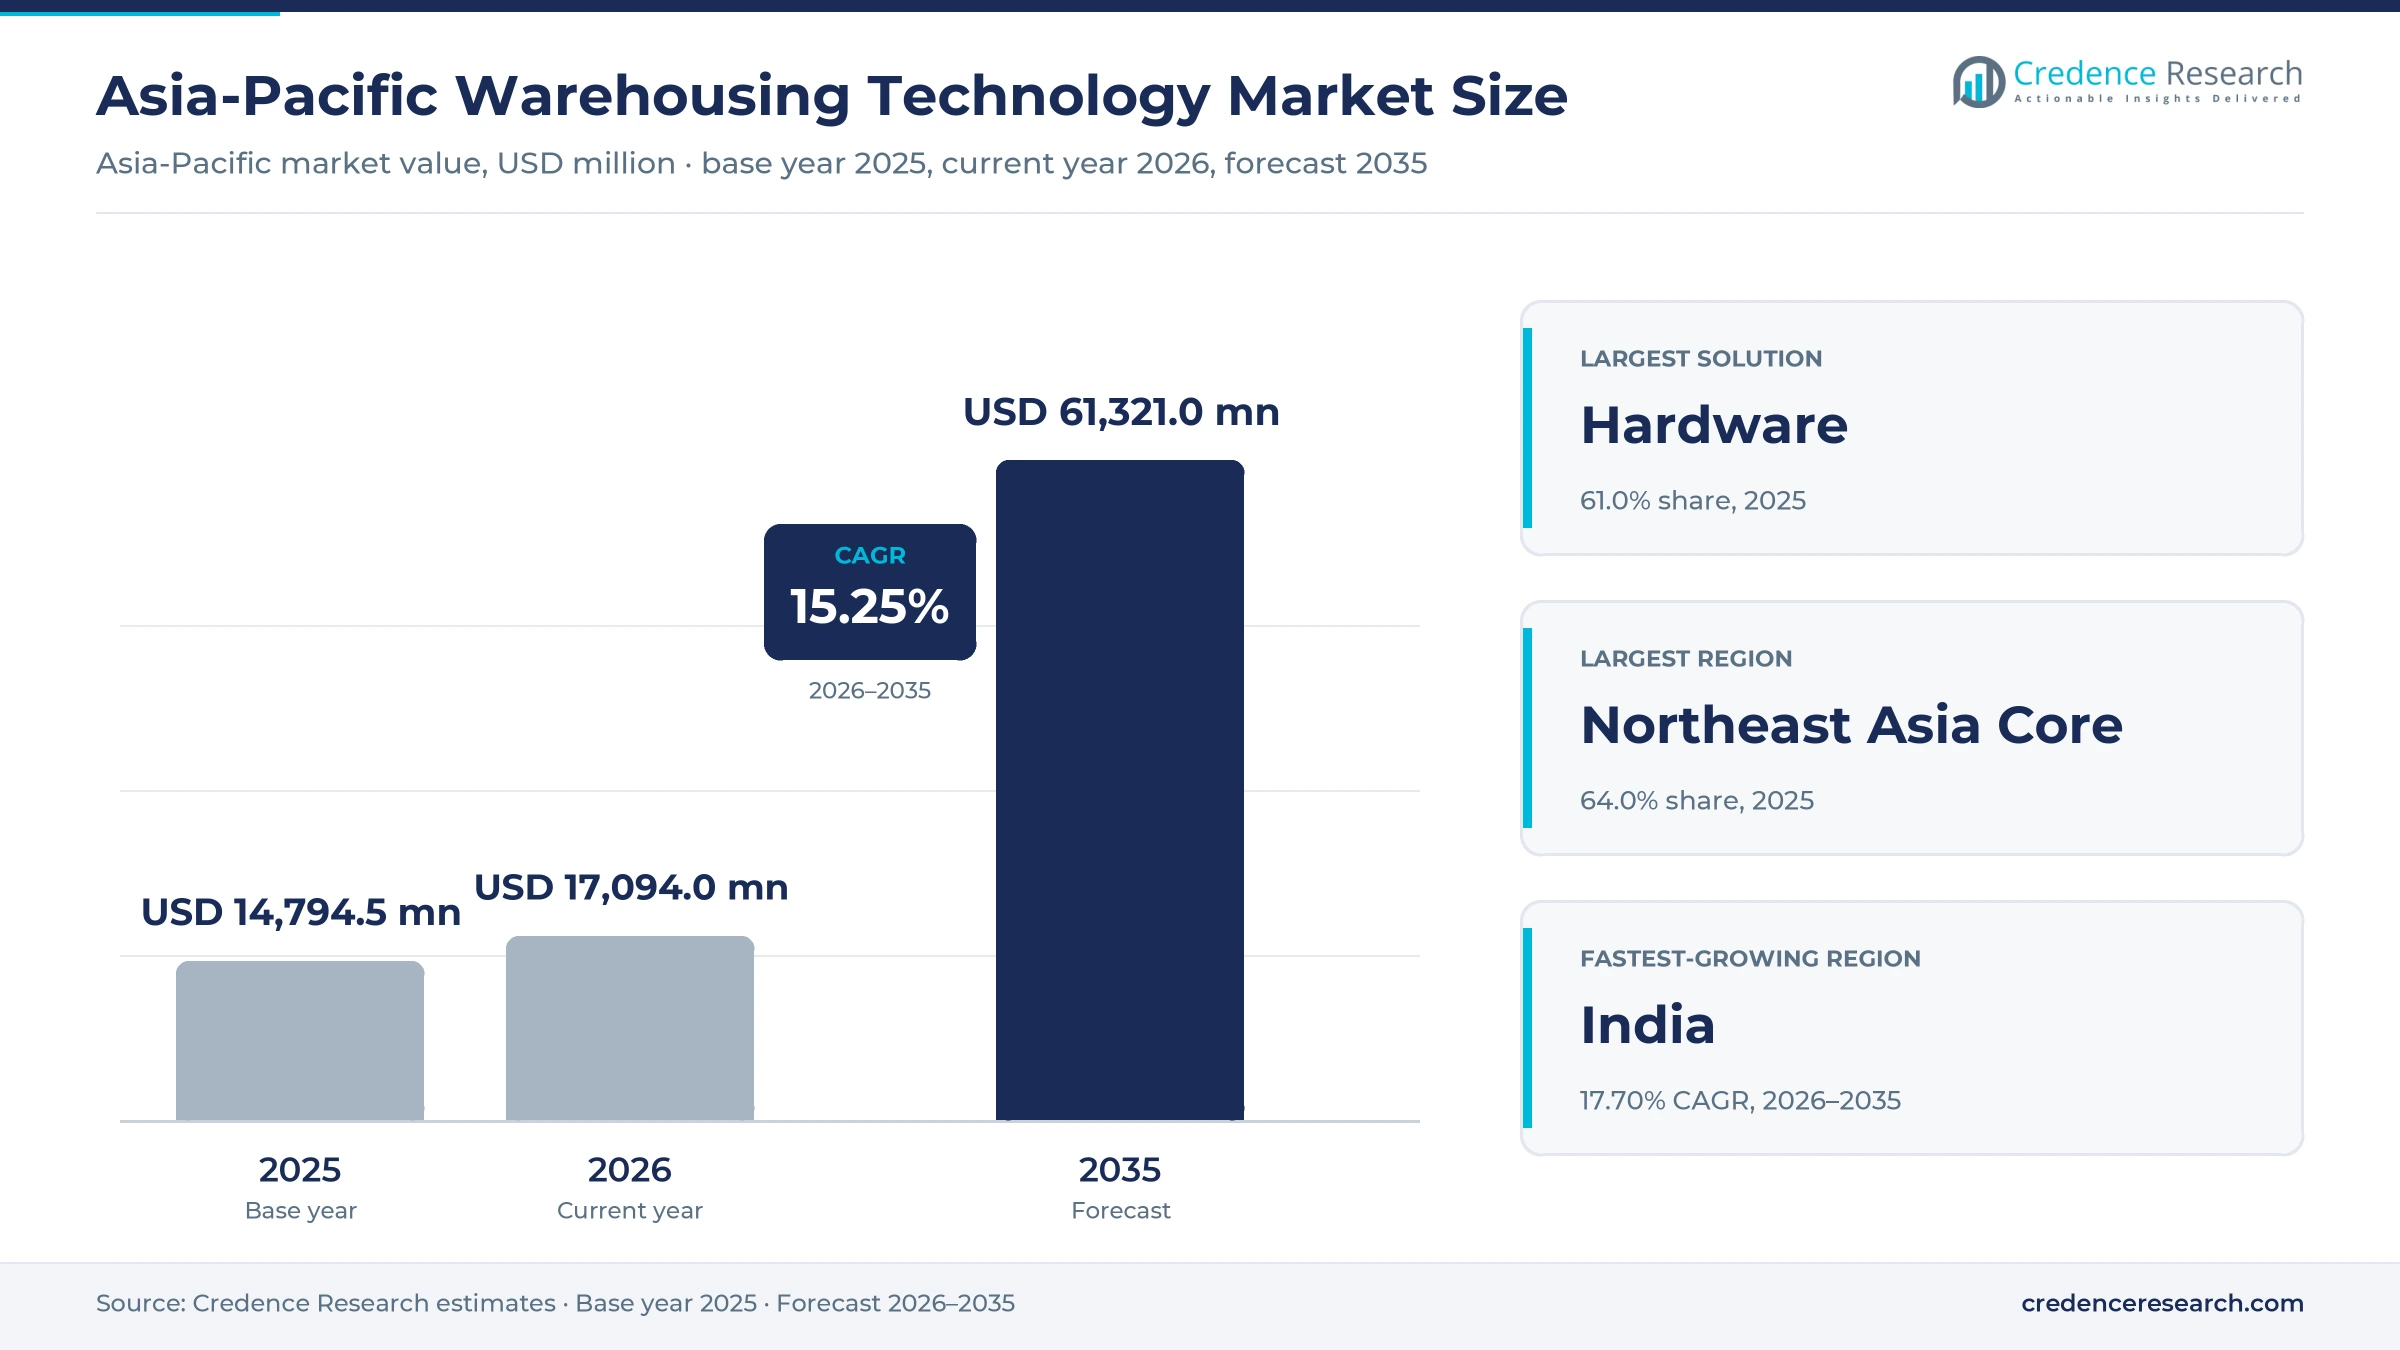
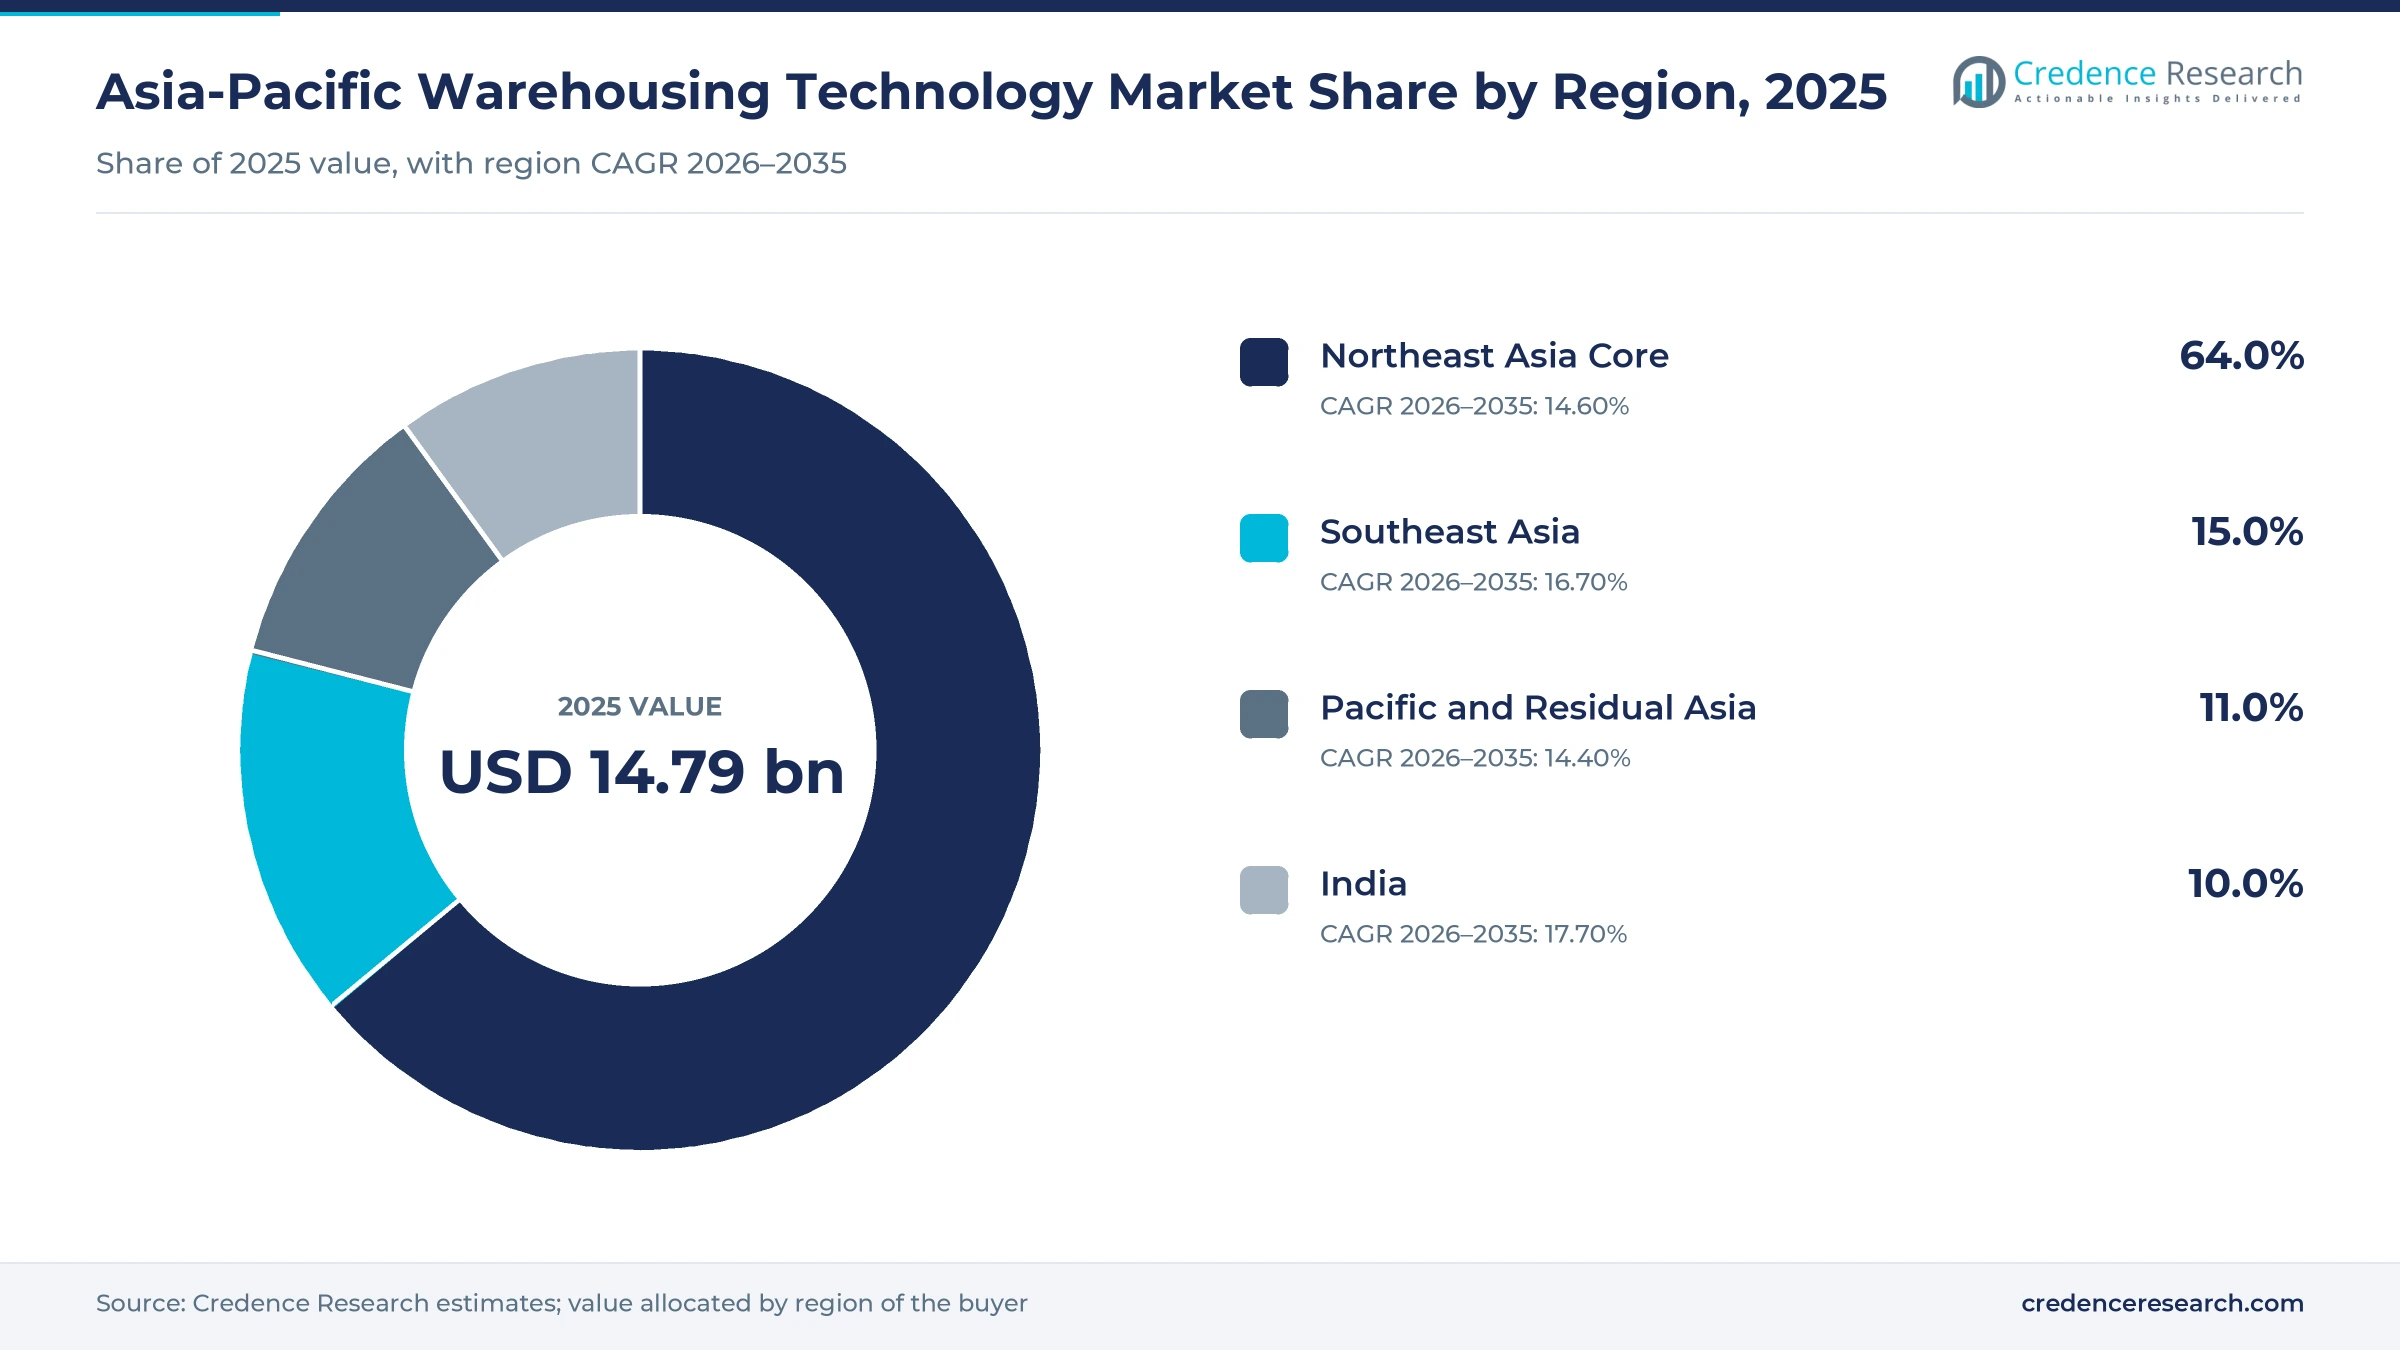
The Asia-Pacific warehousing technology market was valued at USD 14.79 billion in 2025 and is projected to increase from USD 17.09 billion in 2026 to USD 61.32 billion by 2035, registering a CAGR of 15.25% during 2026–2035. Demand comes from parcel networks, grocery chains, electronics plants and contract logistics operators that need denser storage and faster order handling with fewer workers. Northeast Asia Core held the largest regional share, 64.0% in 2025, because China, Japan and South Korea combine heavy parcel flows with deep equipment supply. India is the fastest-growing region at 17.70% a year, helped by new domestic production of stacker cranes and large multi-client warehouse programs. Commercial terms are changing as well, because software suppliers now sell warehouse control on recurring subscriptions rather than one-time licenses. As a result, buyers can phase spending by site and by process, which brings mid-sized operators into a market once dominated by large single-site projects.
What does warehousing technology cover across Asia-Pacific?
The market counts automation hardware, warehouse software and related services bought for storage, picking, sortation, dispatch and inventory control. Buyers usually purchase through integrators on project contracts, although software and mobile robots are increasingly sold on recurring terms.
The estimate excludes warehouse land, buildings, forklifts sold without automation and freight charges. The value chain runs from equipment makers and software developers through integrators to retailers, manufacturers and contract logistics operators that run the sites.
Asia-Pacific Warehousing Technology Market Insights
- The market was valued at USD 14.79 billion in 2025 and is projected to reach USD 61.32 billion by 2035, a 15.25% CAGR as fulfillment load and labor limits favor automated handling.
- Northeast Asia Core held 64.0% of 2025 value because China, Japan and South Korea pair the heaviest parcel flows with established equipment suppliers.
- Hardware led solution spending with 61.0% in 2025, because cranes, shuttles, sorters and robots remain the largest items in most warehouse budgets.
- Daifuku built its first stacker crane in India in November 2025 at its Hyderabad plant, which marks a shift toward local supply of core storage equipment in the region.
- Software subscriptions are widening competition, as Tokyo-based Mujin moved its MujinOS product to a recurring model on April 7, 2026 and targeted both end users and integrators.
Hardware and retail buyers still set the spending mix
Why does hardware still lead solution spending?
Based on solution type, the market is categorized into hardware, software and services. Hardware led with 61.0% of 2025 value because physical capacity absorbs the largest checks, as Woolworths showed with two automated distribution centers of 75,000 square meters in its A$1.3 billion Moorebank precinct, according to Food & Drink Business in November 2025. Software grows fastest at 17.20% a year because control logic is moving to recurring code, and Tokyo-based Mujin replaced one-time licensing with a MujinOS subscription on April 7, 2026, according to Robotics Tomorrow.
Why do on-premises controls keep the largest share?
Based on deployment model, the market is categorized into on-premises-controlled systems, cloud-controlled systems and hybrid-controlled systems. On-Premises-Controlled Systems led with 52.0% in 2025 because crane and shuttle lines need site-level control, such as the 15 cranes SSI Schaefer installed for Tee Yih Jia in Singapore, reported by PortCalls in November 2021. Cloud-Controlled Systems grows fastest at 18.00% a year as hosting costs fall away, and Honeywell sold its warehouse software as a service in Southeast Asia from April 2021, according to Mobility Outlook.
Why do retail and e-commerce buyers dominate?
Based on end-use industry, the market is categorized into retail and e-commerce, food and healthcare, manufacturing and electronics, and contract logistics. Retail and E-Commerce led with 44.0% of 2025 value because China alone handled 199 billion parcels that year, according to the State Post Bureau. Food and Healthcare grows fastest at 16.48% a year because temperature-controlled capacity is expanding, and Rabobank put China cold storage at 267 million cubic meters in 2025 in research reported by FreshPlaza in October 2026. Those sites suit high-density storage and retrieval systems that limit worker exposure to frozen aisles.
Why is outright purchase still the default contract?
Based on pricing model, the market is categorized into outright purchase, recurring subscription and project and service fees. Outright Purchase led with 58.0% in 2025 because fixed installations are funded as owned assets, as with the rack-clad warehouse inside Tee Yih Jia’s $450 million Singapore food hub, according to PortCalls in November 2021. Recurring Subscription grows fastest at 18.27% a year as buyers test lower entry costs, and Rapyuta Robotics published an August 2024 example of 13 mobile robots with a $75,000 setup fee and $1,000 monthly subscription fees.
| Segment Group | Leading Sub-segment | Share, 2025 | Fastest-growing Sub-segment | CAGR, 2026–2035 |
|---|---|---|---|---|
| By Solution Type | Hardware | 61.0% | Software | 17.20% |
| By Deployment Model | On-Premises-Controlled Systems | 52.0% | Cloud-Controlled Systems | 18.00% |
| By End-Use Industry | Retail and E-Commerce | 44.0% | Food and Healthcare | 16.48% |
| By Pricing Model | Outright Purchase | 58.0% | Recurring Subscription | 18.27% |
Request a Free Sample
Fill in your details and we'll send you a free sample report.
- Sample data tables & charts
- Research methodology
Fulfillment load and local engineering lift regional demand
Digital retail fulfillment complexity raises throughput needs
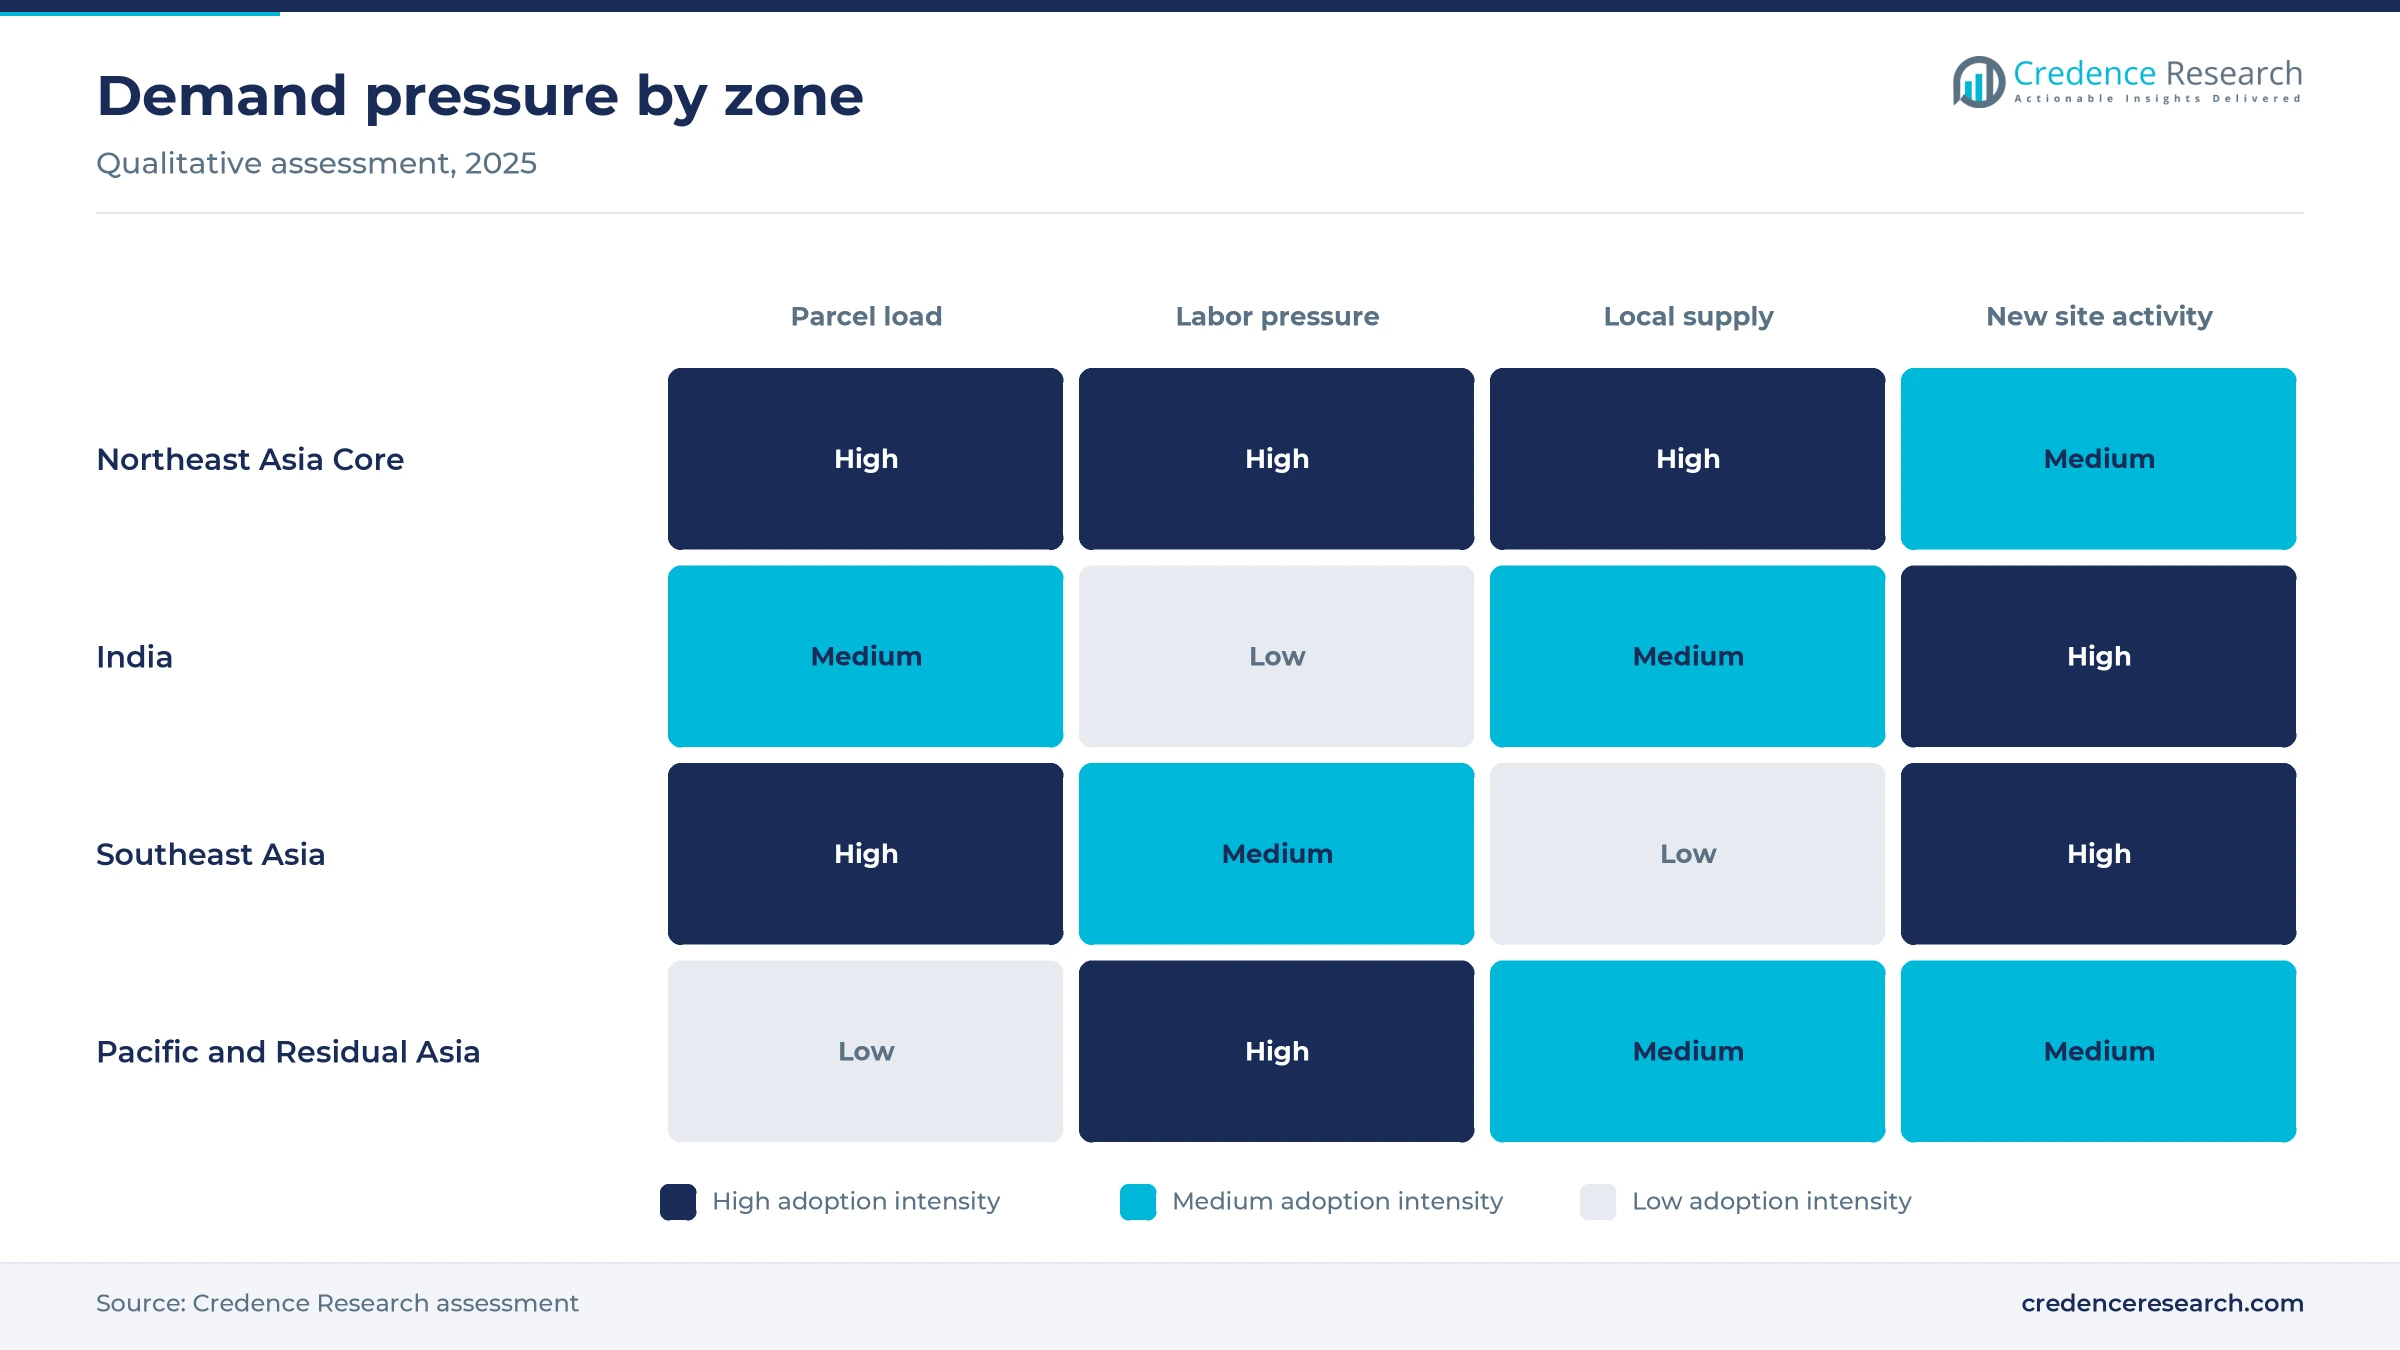
Digital retail is the strongest demand source because small, frequent orders punish manual picking and sorting. China handled 199 billion parcels in 2025, up 13.7%, and the State Post Bureau projected about 214 billion for 2026 at its January 2026 conference. Japan shows the same pressure at a smaller scale, since e-commerce reached 9.78% of consumer goods sales in 2024 on METI figures released Aug. 26, 2025. Southeast Asia adds a further pool of orders, with Google and Temasek projecting $185 billion of e-commerce merchandise value for 2025 in their November 2025 e-Conomy SEA report. As a result, Retail and E-Commerce buyers held 44.0% of 2025 spending, and they increasingly specify conveyor lines and sorters sized for peak days rather than average days.
Infrastructure coordination drives warehouse consolidation
Large operators are replacing scattered buildings with fewer connected sites, and that consolidation creates the region’s biggest single technology contracts. Woolworths opened its Moorebank regional center in November 2025, and its two automated centers now ship more than five million cartons a week with links to Port Botany and interstate rail, according to Big Rigs. India is following a similar path, because DPIIT put national logistics cost at 7.97% of GDP for 2023-24 in its September 2025 assessment, which gives states and shippers a measured baseline to improve. DHL Supply Chain also committed €500 million in September 2022 to about 1.1 million square meters of Indian multi-client space with robotic picking aids. Consolidated sites therefore favor integrated control software over isolated machines on each floor.
Local manufacturing and engineering depth shorten delivery
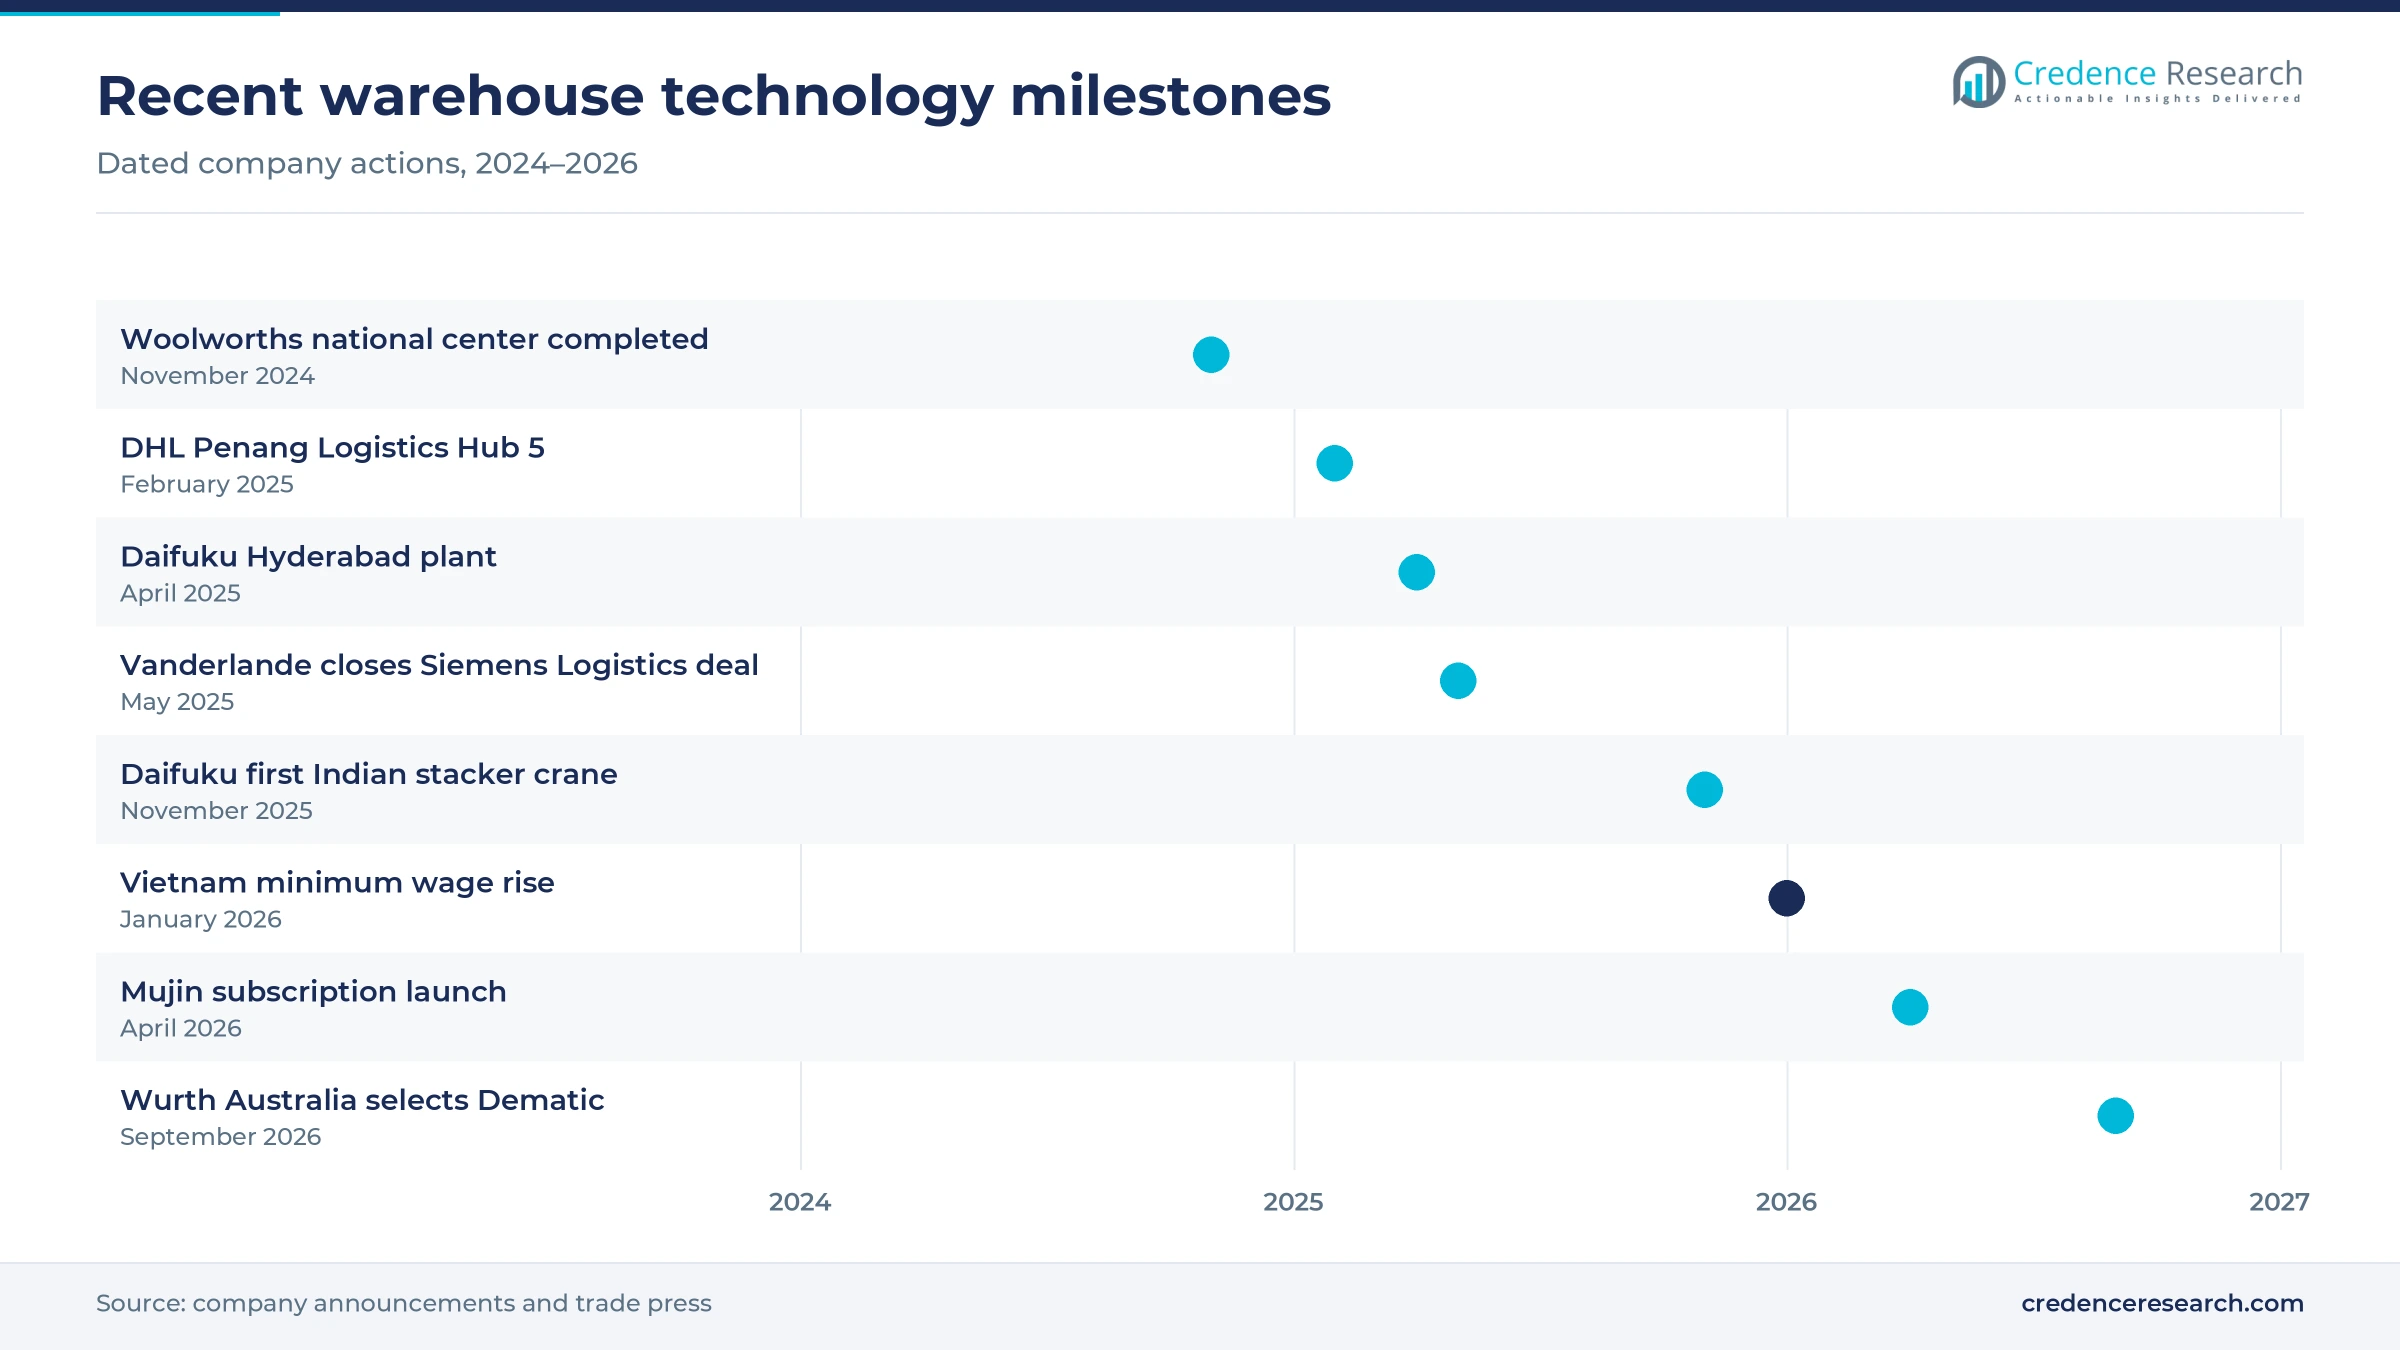
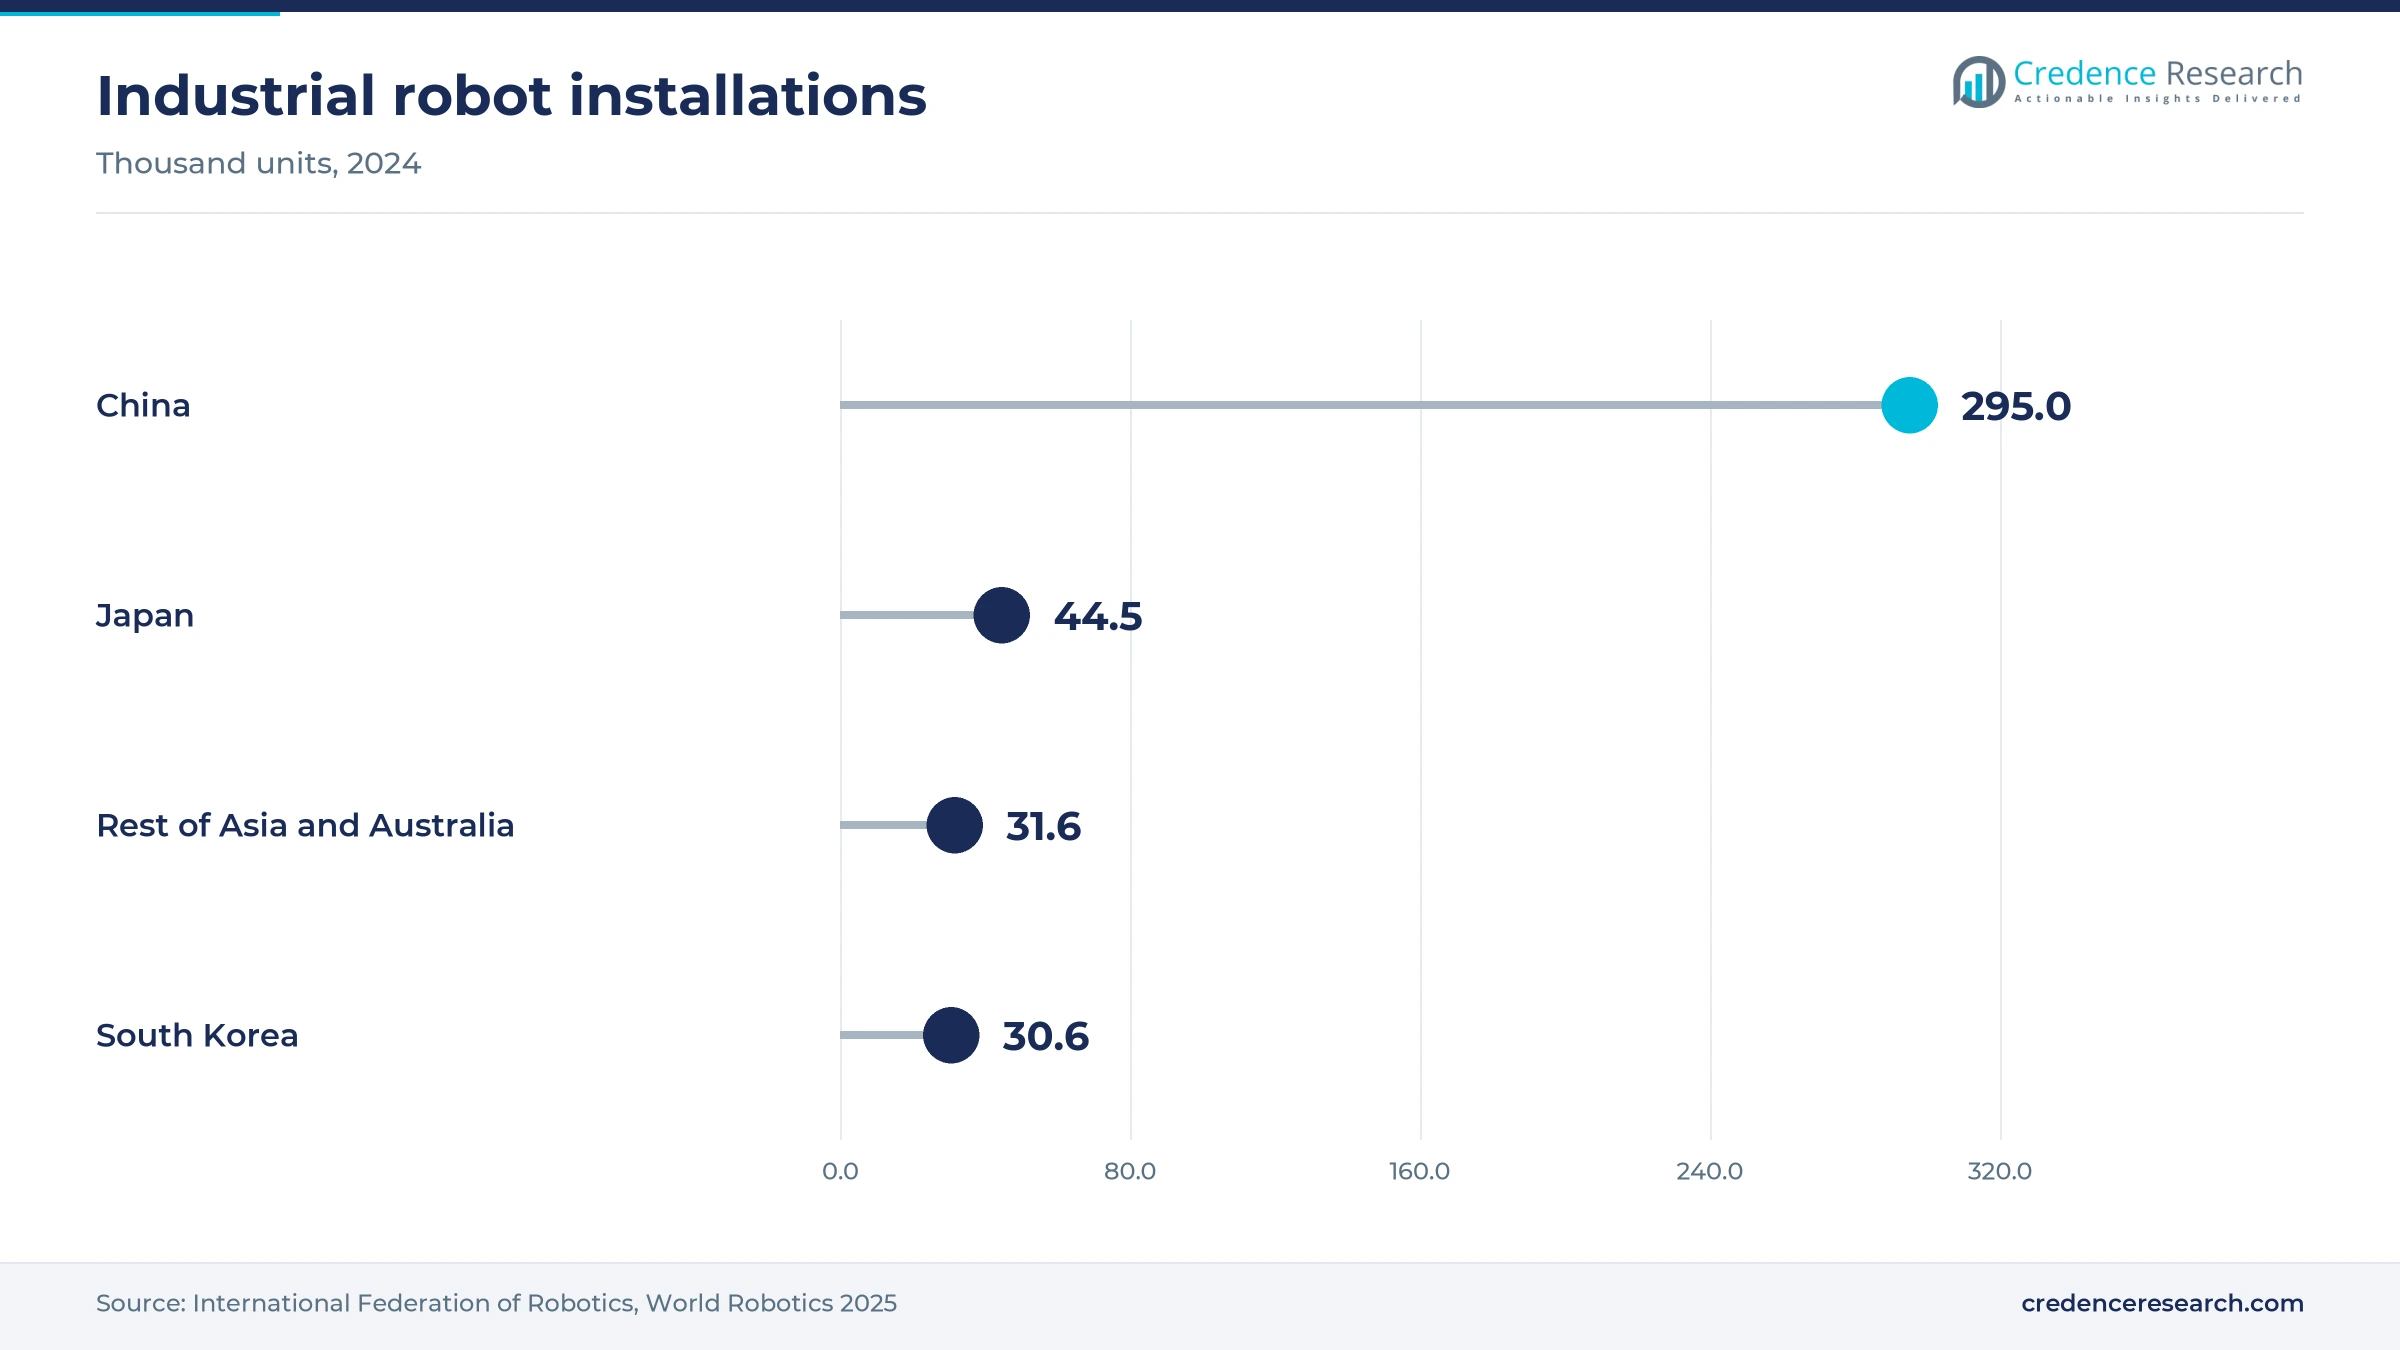
Regional production lowers lead times and gives buyers service teams close to their sites, which makes automation easier to approve. Daifuku Intralogistics India opened a Rs 227 crore Hyderabad facility in April 2025, creating more than 100 skilled jobs at the outset, according to Siasat. The same site produced its first made-in-India stacker crane, a 30-meter system, by November 2025, according to The Machine Maker. In China, robot installations reached 295,045 units in 2024, up 7%, according to the International Federation of Robotics. Dematic adds depth in the Pacific, with more than 850 staff across Australia and New Zealand and continuing Sydney manufacturing, according to IT Brief in May 2026.
Labor limits push operators toward automated handling
Labor availability has become a planning constraint, especially where new working-time rules shorten the hours available for dispatch. Japan capped truck driver overtime at 960 hours a year in April 2024, and a study often cited by the government warned that up to 34% of domestic cargo could go unmoved by 2030, according to The Japan Times in October 2024. Shorter driving windows force warehouses to load faster and more predictably, which supports automated dispatch. Wage costs are also moving in lower-cost markets, because Vietnam Decree 293/2025 raised regional minimum pay by an average 7.2% from Jan. 1, 2026, according to Vietnam Law Magazine. Operators in these markets therefore compare logistics robots with multi-year wage paths rather than today’s payroll alone.
Subscriptions and mobile robots open new buyer groups
Shift from one-time licenses to recurring control software
Suppliers are moving warehouse control from one-time licenses toward recurring contracts, which changes how buyers budget upgrades. Mujin launched its MujinOS subscription on April 7, 2026, with Standard and Premium tiers, and framed the purchase as an operating expense, according to Robotics Tomorrow. Rapyuta Robotics promotes reduced subscription fees if productivity falls short, in a pricing note dated August 2024. Dematic is also selling its iQ control layer between the customer warehouse management system and the equipment, as its Wurth Australia contract shows. In turn, Software grows at 17.20% a year on Credence Research estimates, and Recurring Subscription grows at 18.27% a year as finance teams accept the model.
Rise of mobile robots inside multi-client warehouses
Mobile robots are moving from pilots into standard warehouse design because they can be added without rebuilding a site. The International Federation of Robotics reported in October 2025 that transportation and logistics service robot sales reached 102,900 units in 2024, up 14%. DHL Supply Chain set a target of 1,000 robots in Asia-Pacific by 2025 in an August 2023 plan reported by Logistics Manager. Its Penang Logistics Hub 5 added €12 million of robotic automation, including goods-to-person units and case-handling robots, according to MIDA in February 2025. Buyers comparing autonomous fleets now weigh them against fixed shuttles aisle by aisle, and contract operators favor equipment that can move between client programs.
Opening in cold chain and healthcare automation
Temperature-controlled storage offers a clear opening because labor is hard to retain in frozen aisles and space is expensive to chill. Rabobank research reported by FreshPlaza in October 2026 put China cold storage at 267 million cubic meters and expects automation to play a greater role over the next five to ten years. Singapore already has a reference site, because Tee Yih Jia’s Senoko hub holds more than 100,000 frozen pallet positions with throughput of up to 300 pallets an hour, according to PortCalls. Healthcare adds a second route, since Dematic names Sigma Healthcare among its Australian customers, according to IT Brief. Accordingly, Food and Healthcare grows at 16.48% a year on Credence Research estimates.
Opening among mid-sized distributors and grocers
Mid-sized distributors represent an underserved opening because modular systems now fit sites that could not justify a full high-bay build. Wurth Australia chose Dematic in September 2026 for AutoStore goods-to-person systems at Yatala and Keysborough, serving more than 56,000 active customers. Geek+ added more than 60 customers in the first half of 2025, with progress in grocery retail and food and beverage, according to Automated Warehouse. Cost pressure is also reaching automation in Vietnam decisions, since average regional minimum pay rose 7.2% in January 2026. Suppliers that package pricing and support for these buyers can win sites that large integrators once ignored.
Capital cost and integration slow smaller warehouse projects
High entry costs limit smaller warehouse operators
Entry costs remain the first barrier for smaller operators, even under subscription offers. Rapyuta Robotics’ own August 2024 example includes a $75,000 setup fee for 13 mobile robots, although the offer is promoted as having no upfront purchase. Small enterprises with thin cash reserves may struggle to fund that step, and the consequence is slower adoption outside large chains. Suppliers can reduce the barrier through phased rollouts and productivity-linked fees, which spread the risk across the contract term.
Low warehouse rents weaken the case in India
Low warehouse rents can weaken the payback case for dense automated storage in India. DPIIT’s September 2025 logistics assessment described warehousing costs averaging ₹30 per square foot a month, according to The Policy Edge, a level at which extra floor space can look cheaper than high-bay equipment. Developers and tenants on short leases are most affected, because they may not stay long enough to recover high-bay costs. Suppliers respond with movable robots that a tenant can carry to its next building.
Integration work slows retrofits of existing sites
Integration remains difficult because new equipment must work with software that older sites already run. Wurth Australia’s September 2026 project needs Dematic iQ as a separate layer between its warehouse management system and the machines, according to IT Brief, and Keysborough follows Yatala rather than going live together. Retrofit buyers therefore face phased cutovers and longer disruption during peak periods. Standard interfaces and staged commissioning reduce this risk, although they raise engineering hours early in the project.
Stronger Chinese suppliers pressure foreign integrators
Foreign integrators face stronger domestic rivals in the region’s largest national market. The International Federation of Robotics counted 295,045 robot installations in China in 2024, up 7%, and said the share of domestically produced robots there will continue to increase. Foreign suppliers selling premium systems in China are most exposed, and pricing on standard equipment comes under strain. Many therefore lean on software, service coverage and projects outside China to protect their position.
Northeast Asia Core leads while India grows fastest
| Region | Value, 2025 (USD billion) | Share, 2025 | CAGR, 2026–2035 |
|---|---|---|---|
| Northeast Asia Core | 9.47 | 64.0% | 14.60% |
| Southeast Asia | 2.22 | 15.0% | 16.70% |
| Pacific and Residual Asia | 1.63 | 11.0% | 14.40% |
| India | 1.48 | 10.0% | 17.70% |
Northeast Asia Core holds the deepest installed base
Northeast Asia Core held 64.0% of 2025 value and grows at 14.60% a year, slightly below the regional rate because its installed base is already large. The International Federation of Robotics counted 295,045 robot installations in China, 44,453 in Japan and 30,596 in South Korea during 2024. Those three countries supply much of the region’s equipment as well as buying it. Replacement work and software upgrades therefore carry more of the spending here than in other zones.
Southeast Asia gains from e-commerce and electronics
Southeast Asia held 15.0% of 2025 value and grows at 16.70% a year as online retail and electronics supply chains expand. Google and Temasek projected $185 billion of e-commerce merchandise value for 2025 in their November 2025 report. DHL Supply Chain’s 22,000-square-meter Penang hub, built for a multinational technology firm with a €30 million warehouse investment, shows the electronics route. Singapore’s Tee Yih Jia site adds a cold-chain reference for buyers elsewhere in the zone.
Pacific and Residual Asia is led by Australian grocers
Pacific and Residual Asia held 11.0% of 2025 value and grows at 14.40% a year, the slowest pace because Australia’s large projects are lumpy. Woolworths’ A$1.3 billion Moorebank precinct, its largest single investment, dominates recent activity in the zone. Wurth Australia’s two-site AutoStore project, announced in September 2026, shows that distributors are following the grocers. Local service capacity is strong, with Dematic marking 60 years of Australian and New Zealand operations in May 2026.
India grows fastest from a smaller base
India held 10.0% of 2025 value and grows at 17.70% a year, the fastest pace in the region, because new multi-client space is being built with automation specified from the start. DHL Supply Chain’s €500 million program covers sites in Bangalore, Chennai, Mumbai, Pune and smaller cities including Jaipur and Coimbatore. Daifuku’s 34,000-square-meter Hyderabad plant also reduces reliance on imported cranes for these sites. Automotive, pharmaceutical and retail buyers are named among the plant’s target customers.
Plant openings and software models mark recent activity
| Development | Status and market relevance |
|---|---|
| In February 2025, DHL Supply Chain was reported to have opened Penang Logistics Hub 5 with €12 million of robotic automation. | Operating; first global DHL use of its case-handling and goods-to-person robots |
| In April 2025, Daifuku Intralogistics India opened its Rs 227 crore Hyderabad facility, according to Siasat. | Operating; regional hub for Daifuku with more than 100 initial skilled jobs |
| In May 2025, Vanderlande completed its €300 million purchase of Siemens Logistics operations outside the United States. | Closed May 2; adds airport automation service capability, with U.S. clearance then pending |
| In November 2025, Woolworths opened its Moorebank regional distribution center in Western Sydney, according to Big Rigs. | Operating; completes a two-center automated precinct of 75,000 square meters |
| In April 2026, Mujin launched its MujinOS subscription, starting with single SKU palletizing. | Available; more applications expected later in 2026 |
Control software links cranes, shuttles and mobile robots
- Stacker cranes serve high-bay pallet storage, and Daifuku now builds a 30-meter model in Hyderabad for Indian projects.
- Goods-to-person cube storage brings bins to pickers, and Dematic is installing AutoStore at both Wurth Australia sites.
- Mobile robots move totes and cases without fixed conveyors, and DHL Supply Chain runs case-handling robots at its Penang hub.
- Warehouse control software sits between management software and equipment, as Dematic iQ does in the Wurth Australia design.
Need a Custom Version of This Report?
Tailor the scope, geography, or segments to your exact requirements.
- Custom geography or segment scope
- Direct access to our analyst team
Global integrators face stronger Chinese robot suppliers
Warehousing technology competition splits between global integrators, established Japanese equipment makers and fast-growing Chinese robot suppliers. Daifuku is pressing local production in India through its Hyderabad plant, where it built a 30-meter stacker crane in 2025. Dematic, part of KION, relies on a long Australian presence, manufacturing in Sydney and customers such as Woolworths, BIG W and Sigma Healthcare. SSI Schaefer has built its regional reference through frozen high-bay storage at Tee Yih Jia in Singapore. Vanderlande is strongest in airport and parcel handling, and its 2015 Changi Terminal 1 contract was its largest baggage award in Asia at that time. Geek+, based in Beijing, reports more than 850 end customers and competes on mobile robots. Mujin, based in Tokyo, sells control software by subscription to end users and integrators.
Companies profiled and their roles in this market
| Company | Type | Role in the market |
|---|---|---|
| Daifuku | Japanese equipment maker and integrator | Builds storage systems locally in Hyderabad, including its first made-in-India stacker crane |
| Dematic | Integrator, part of KION | Supplies Australian retailers and healthcare groups, with Sydney manufacturing and iQ control software |
| SSI Schaefer | Storage systems supplier | Delivered the automated frozen high-bay warehouse at Tee Yih Jia’s Singapore food hub |
| Vanderlande | Airport and parcel automation integrator | Holds Changi Terminal 1 baggage work and bought Siemens Logistics operations outside the United States in 2025 |
| Geek+ | Beijing-based mobile robot maker | Sells goods-to-person robots and reported new grocery and food customers in 2025 |
| Mujin | Tokyo-based robot software company | Sells MujinOS on a recurring subscription with Standard and Premium tiers |
Credence Research view on where spending shifts next
Credence Research’s view is that warehousing technology spending’s center of gravity is moving from single large installations toward repeatable, smaller purchases. Woolworths’ Moorebank precinct shows that giant projects will continue, yet Wurth Australia’s two-site AutoStore order is the more telling pattern for the next decade. Buyers want capacity they can phase, software they can renew and service teams nearby. Suppliers with local production and clear subscription terms therefore look better placed than those relying on imported equipment alone. India is the region to watch, although its low warehouse rents will keep payback arguments difficult for some time.
How Credence Research built the regional estimates
The report uses 2025 as the base year and forecasts to 2035. Market values come from the Credence Research model, and segment splits and the regional shares, which follow the Credence Research regional model, are estimates informed by public data. Sources used include national statistics, government and regulator releases, trade body statistics, company announcements and trade press. The report did not rely on interviews or surveys, and estimates carry uncertainty where public data on private project values is limited.
Software and subscriptions gain share through 2035
The market is expected to expand from USD 17.09 billion in 2026 to USD 61.32 billion by 2035 as parcel growth, labor constraints and local engineering capacity reinforce one another. Hardware will remain the largest warehousing technology purchase, although software and subscriptions should take a growing share of new contracts over the period. India and Southeast Asia will contribute a rising portion of new projects, while Northeast Asia Core shifts toward upgrades of existing sites. Competition should intensify as Chinese suppliers expand abroad and global integrators build more locally, which will favor buyers seeking phased, serviceable systems.
Frequently Asked Questions
How big is the Asia-Pacific warehousing technology market?
Which zone leads the market?
Which zone is growing fastest?
Which solution type holds the largest share?
Which end-use industry leads spending?
How are pricing models changing?
What is the main barrier to adoption?
Which companies are active in this market?
Table of Content
Chapter 1 Market Segmentation
- 1.1 Segmentation Framework
- 1.1.1 Product and Service Classification
- 1.1.2 Application and End-Use Classification
- 1.1.3 Technology and Solution Classification
- 1.1.4 Customer and Distribution Channel Classification
- 1.1.5 Geographic Segmentation
- 1.1.6 Market Segment Definitions and Boundaries
- 1.2 By Solution Type
- 1.2.1 Hardware
- 1.2.2 Software
- 1.2.3 Services
- 1.3 By Deployment Model
- 1.3.1 On-Premises-Controlled Systems
- 1.3.2 Cloud-Controlled Systems
- 1.3.3 Hybrid-Controlled Systems
- 1.4 By End-Use Industry
- 1.4.1 Retail and E-Commerce
- 1.4.2 Food and Healthcare
- 1.4.3 Manufacturing and Electronics
- 1.4.4 Contract Logistics
- 1.5 By Pricing Model
- 1.5.1 Outright Purchase
- 1.5.2 Recurring Subscription
- 1.5.3 Project and Service Fees
Chapter 2 Introduction
- 2.1 Report Objectives and Scope
- 2.2 Product Definition and Industry Terminology
- 2.3 Market Inclusions and Exclusions
- 2.4 Research Process
- 2.4.1 Primary Research and Expert Interviews
- 2.4.2 Secondary Research and Source Review
- 2.4.3 Top-Down and Bottom-Up Estimation
- 2.4.4 Data Triangulation and Verification
- 2.5 Market Size Measurement Basis
- 2.5.1 2025: USD 14.79 billion → 2035: USD 61.32 billion
- 2.6 Historical and Forecast Reference Periods
- 2.6.1 Historical Period: 2018-2025
- 2.6.2 Base Year: 2025
- 2.6.3 Forecast Period: 2025-2035
- 2.7 Research Assumptions and Limitations
Chapter 3 Executive Summary
- 3.1 Market Snapshot and Key Findings
- 3.2 Base-Year Market Size, 2025
- 3.3 Forecast Market Size, 2035
- 3.4 Revenue and Volume Growth Outlook
- 3.5 Key Demand and Supply Indicators
- 3.6 Leading Market Segments
- 3.7 Fastest-Growing Market Opportunities
- 3.8 Regional Performance Highlights
- 3.9 Technology and Industry Transformation
- 3.10 Competitive Landscape Summary
- 3.11 Analyst View and Strategic Implications
Chapter 4 Asia-Pacific Warehousing Technology Market Trends and Developments
- 4.1 Historical Industry Development, 2018-2025
- 4.2 Recent Market Trends and Developments
- 4.3 Demand and Customer Behavior Trends
- 4.4 Technology and Product Innovation
- 4.5 Artificial Intelligence, Automation and Digitalization
- 4.6 Local Manufacturing and Supply Chain Realignment
- 4.7 Industry Partnerships, Mergers and Acquisitions
- 4.8 Sustainability and Circular Economy Developments
- 4.9 Government and Private Sector Investment Trends
- 4.10 Emerging Business Models and Commercialization
- 4.11 Industry Developments and Announcements
Chapter 5 Asia-Pacific Warehousing Technology Market Production, Supply and Demand Analysis
- 5.1 Demand Trend and Consumption Analysis, 2018-2025
- 5.2 Demand Forecast, 2025-2035
- 5.3 Production and Output Trend, 2018-2025
- 5.4 Production and Output Forecast, 2025-2035
- 5.5 Installed Capacity and Capacity Utilization
- 5.6 Company-Wise Production Plants and Statistics
- 5.6.1 Installed Production Capacity
- 5.6.2 Actual Production
- 5.6.3 Planned Capacity and Expansion Targets
- 5.7 Supply Chain Structure and Procurement Trends
- 5.8 Supply-Demand Gap and Bottlenecks
- 5.9 Import Dependence and Sourcing Structure
- 5.10 Contract Manufacturing and Outsourcing
- 5.11 Regional Supply and Demand Concentration
Chapter 6 Asia-Pacific Warehousing Technology Market Pricing Analysis
- 6.1 Pricing Structure and Measurement
- 6.2 Historical Pricing Trends, 2018-2025
- 6.3 Pricing Outlook, 2025-2035
- 6.4 Average Selling Price and Unit Economics
- 6.5 Pricing by Product and Market Segment
- 6.6 Geographic Pricing Differences
- 6.7 Key Input, Energy, Labor and Logistics Costs
- 6.8 Contract Pricing and Purchasing Models
- 6.9 Pricing Sensitivity and Competitive Positioning
- 6.10 Price, Margin and Profitability Implications
Chapter 7 Asia-Pacific Warehousing Technology Market Dynamics
- 7.1 Market Growth Drivers
- 7.1.1 Demand-Side Drivers
- 7.1.2 Technology and Innovation Drivers
- 7.1.3 Infrastructure and Investment Drivers
- 7.1.4 Regulatory and Policy Drivers
- 7.2 Market Restraints
- 7.2.1 Cost and Affordability Constraints
- 7.2.2 Technology and Adoption Barriers
- 7.2.3 Supply Chain and Operational Constraints
- 7.3 Market Challenges
- 7.3.1 Competitive Pressure and Margin Erosion
- 7.3.2 Skills, Infrastructure and Implementation Gaps
- 7.4 Emerging Market Opportunities
- 7.5 Market Dynamics Impact and Time-Horizon Assessment
Chapter 8 Asia-Pacific Warehousing Technology Value Chain Analysis
- 8.1 Industry Value Chain Overview
- 8.2 Upstream Suppliers and Critical Inputs
- 8.3 Technology and Component Providers
- 8.4 Manufacturing or Service Delivery
- 8.5 Distribution, Channel Partners and Integrators
- 8.6 Downstream Applications and End Users
- 8.7 Value Addition and Profit Pools
- 8.8 Vertical Integration and Outsourcing
- 8.9 Supplier Concentration and Risk
- 8.10 Supply Chain Localization and Resilience
Chapter 9 Asia-Pacific Warehousing Technology Market Regulations and Policies
- 9.1 Relevant Laws, Standards and Compliance Frameworks
- 9.2 Product, Service, Safety and Quality Requirements
- 9.3 Government Policies, Incentives and Subsidies
- 9.4 Imports, Exports and Trade Barriers
- 9.5 Public Procurement and Local Content Requirements
- 9.6 Environmental and Sustainability Compliance
- 9.7 Upcoming Policy Changes and Market Implications
Chapter 10 Asia-Pacific Warehousing Technology Market Hotspots and Opportunities
- 10.1 Market Opportunity Mapping and Growth Hotspots
- 10.2 High-Growth Applications and Customer Groups
- 10.3 Underserved Markets and White-Space Opportunities
- 10.4 Emerging Technology and Product Opportunities
- 10.5 New Capacity and Investment Hotspots
- 10.6 Market Entry and Expansion Opportunities
- 10.7 Distribution and Partnership Opportunities
- 10.8 Near-Term and Long-Term Commercial Potential
- 10.9 Opportunity Attractiveness and Execution Risks
Chapter 11 Asia-Pacific Warehousing Technology Market Outlook, 2025-2035
- 11.1 Market Size and Analysis
- 11.1.1 Revenue (Market Measurement: 2025: USD 14.79 billion → 2035: USD 61.32 billion)
- 11.1.2 Market Volume and Quantity Sold
- 11.1.3 Historical Market Size, 2018-2025
- 11.1.4 Base-Year Market Size, 2025
- 11.2 Market Forecast, 2025-2035
- 11.2.1 Revenue Forecast to 2035
- 11.2.2 Volume Forecast to 2035
- 11.2.3 CAGR and Year-on-Year Growth
- 11.2.4 Incremental Revenue Opportunity
- 11.3 Forecast Assumptions and Scenario Analysis
- 11.3.1 Base-Case Forecast
- 11.3.2 Optimistic and Conservative Scenarios
- 11.3.3 Technology, Pricing and Policy Sensitivities
- 11.4 Market Attractiveness and Growth Outlook
Chapter 12 Asia-Pacific Warehousing Technology Market Segmentation and Outlook
- 12.1 Segmentation Summary and Market Shares, 2025
- 12.2 Largest and Fastest-Growing Segments
- 12.3 By Solution Type - Market Size and Forecast, 2025-2035
- 12.3.1 Segment Definition and Scope
- 12.3.2 Historical Market Size, 2018-2025
- 12.3.3 Revenue Forecast, 2025-2035
- 12.3.4 Volume Forecast, 2025-2035
- 12.3.5 Base-Year Market Share, 2025
- 12.3.6 Segment CAGR and Growth Drivers
- 12.3.7 Subsegment Market Size and Forecast
- 12.3.7.1 Hardware
- 12.3.7.2 Software
- 12.3.7.3 Services
- 12.3.8 Subsegment Pricing and Adoption Trends
- 12.3.9 Leading Suppliers and Competition
- 12.3.10 Regional Demand and Opportunities
- 12.4 By Deployment Model - Market Size and Forecast, 2025-2035
- 12.4.1 Segment Definition and Scope
- 12.4.2 Historical Market Size, 2018-2025
- 12.4.3 Revenue Forecast, 2025-2035
- 12.4.4 Volume Forecast, 2025-2035
- 12.4.5 Base-Year Market Share, 2025
- 12.4.6 Segment CAGR and Growth Drivers
- 12.4.7 Subsegment Market Size and Forecast
- 12.4.7.1 On-Premises-Controlled Systems
- 12.4.7.2 Cloud-Controlled Systems
- 12.4.7.3 Hybrid-Controlled Systems
- 12.4.8 Subsegment Pricing and Adoption Trends
- 12.4.9 Leading Suppliers and Competition
- 12.4.10 Regional Demand and Opportunities
- 12.5 By End-Use Industry - Market Size and Forecast, 2025-2035
- 12.5.1 Segment Definition and Scope
- 12.5.2 Historical Market Size, 2018-2025
- 12.5.3 Revenue Forecast, 2025-2035
- 12.5.4 Volume Forecast, 2025-2035
- 12.5.5 Base-Year Market Share, 2025
- 12.5.6 Segment CAGR and Growth Drivers
- 12.5.7 Subsegment Market Size and Forecast
- 12.5.7.1 Retail and E-Commerce
- 12.5.7.2 Food and Healthcare
- 12.5.7.3 Manufacturing and Electronics
- 12.5.7.4 Contract Logistics
- 12.5.8 Subsegment Pricing and Adoption Trends
- 12.5.9 Leading Suppliers and Competition
- 12.5.10 Regional Demand and Opportunities
- 12.6 By Pricing Model - Market Size and Forecast, 2025-2035
- 12.6.1 Segment Definition and Scope
- 12.6.2 Historical Market Size, 2018-2025
- 12.6.3 Revenue Forecast, 2025-2035
- 12.6.4 Volume Forecast, 2025-2035
- 12.6.5 Base-Year Market Share, 2025
- 12.6.6 Segment CAGR and Growth Drivers
- 12.6.7 Subsegment Market Size and Forecast
- 12.6.7.1 Outright Purchase
- 12.6.7.2 Recurring Subscription
- 12.6.7.3 Project and Service Fees
- 12.6.8 Subsegment Pricing and Adoption Trends
- 12.6.9 Leading Suppliers and Competition
- 12.6.10 Regional Demand and Opportunities
- 12.7 Segment Growth Comparison
- 12.8 Segment Attractiveness and Priority Matrix
Chapter 13 Asia-Pacific Warehousing Technology End-Use and Application Market Outlook
- 13.1 End-Use Industry and Customer Demand Structure
- 13.2 Leading Applications and Customer Groups
- 13.3 End-Use Market Size, Share and Forecast
- 13.4 Major End-Use Industry Deep Dives
- 13.4.1 Customer Requirements and Use Cases
- 13.4.2 Demand and Replacement Cycles
- 13.4.3 Technical and Regulatory Considerations
- 13.4.4 Purchasing and Procurement Models
- 13.4.5 Leading Vendors and Distribution Channels
- 13.4.6 Forecast and Commercial Opportunities
- 13.5 Emerging Applications and Cross-Segment Demand
- 13.6 End-Use Industry Investment Priorities
Chapter 14 Asia-Pacific Warehousing Technology Geographic Market Outlook, 2025-2035
- 14.1 Regional Market Size and Country-Level Shares, 2025
- 14.2 Country Market Size Comparison, 2025
- 14.3 Country Market Forecasts, 2025-2035
- 14.4 Subregional Industrial and Demand Clusters
- 14.5 Intra-Regional Pricing and Cost Differences
- 14.6 Cross-Border Trade and Supply Networks
- 14.7 Regional Supply and Demand Balances
- 14.8 Country Opportunity Comparison and Prioritization
Note: Every listed country is covered on the structure shown under the first country.
Chapter 15 Asia-Pacific Warehousing Technology Technology, Innovation and Sustainability Outlook
- 15.1 Technology Landscape and Maturity
- 15.2 Product, Process and Service Innovation
- 15.3 AI, Automation and Digital Tools in the Industry
- 15.4 Technology Adoption and Performance Benchmarking
- 15.5 Innovation Pipeline and R&D Investment
- 15.6 Patent and Intellectual Property Trends
- 15.7 Energy Efficiency and Resource Management
- 15.8 Sustainability, Recycling and Circularity
- 15.9 Technology Roadmap, 2025-2035
- 15.10 Risks of Obsolescence and Technology Substitution
Chapter 16 Asia-Pacific Warehousing Technology Market Key Strategic Imperatives
- 16.1 Growth and Market Entry Priorities
- 16.2 High-Return Products and Segments
- 16.3 Pricing, Profitability and Cost Optimization
- 16.4 Technology Investment and Product Differentiation
- 16.5 Supply Chain Localization and Resilience
- 16.6 Distribution and Customer Acquisition
- 16.7 Partnership, Acquisition and Capacity Strategy
- 16.8 Regional Expansion Priorities
- 16.9 Short-, Medium- and Long-Term Actions
Chapter 17 Competition Outlook
- 17.1 Industry Competition Characteristics
- 17.2 Market Structure and Concentration
- 17.3 Market Share and Competitive Positioning, 2025
- 17.4 Company-Wise Revenue and Product Benchmarking
- 17.5 Production and Service Capacity Benchmarking
- 17.6 Technology, Pricing and Differentiation
- 17.7 Regional Footprint and Distribution Strength
- 17.8 Mergers, Acquisitions and Strategic Alliances
- 17.9 New Entrants and Competitive Threats
- 17.10 Porter's Five Forces and Industry Attractiveness
- 17.11 Competitive Outlook, 2025-2035
Chapter 18 Company Profiles
- 18.1 Company Coverage and Selection Criteria
- 18.2 Daifuku
- 18.2.1 Business Description
- 18.2.2 Company Ownership and Geographic Presence
- 18.2.3 Product and Service Portfolio
- 18.2.4 Manufacturing and Operating Footprint
- 18.2.5 Production Capacity and Expansion Plans
- 18.2.6 Financial Performance and Investment
- 18.2.7 Market Share and Competitive Position
- 18.2.8 Technology and Innovation Capabilities
- 18.2.9 Strategic Alliances or Partnerships
- 18.2.10 Recent Developments
- 18.2.11 Growth Strategy and Outlook
- 18.3 Murata Machinery
- 18.4 Dematic
- 18.5 SSI Schaefer
- 18.6 Vanderlande
- 18.7 Other Relevant Market Participants
Note: Every listed company is profiled on the structure shown under the first company. The company list is preliminary and may change based on research findings, market developments, data availability and client requirements.
Chapter 19 Disclaimer
- 19.1 Research and Forecast Disclaimer
- 19.2 Data Source and Estimation Limitations
Note: The depth of individual sections depends on data availability for this market. Volume, capacity, trade and other unit-based metrics are included where applicable.

