
Freezer robots move from pilot sites to core networks
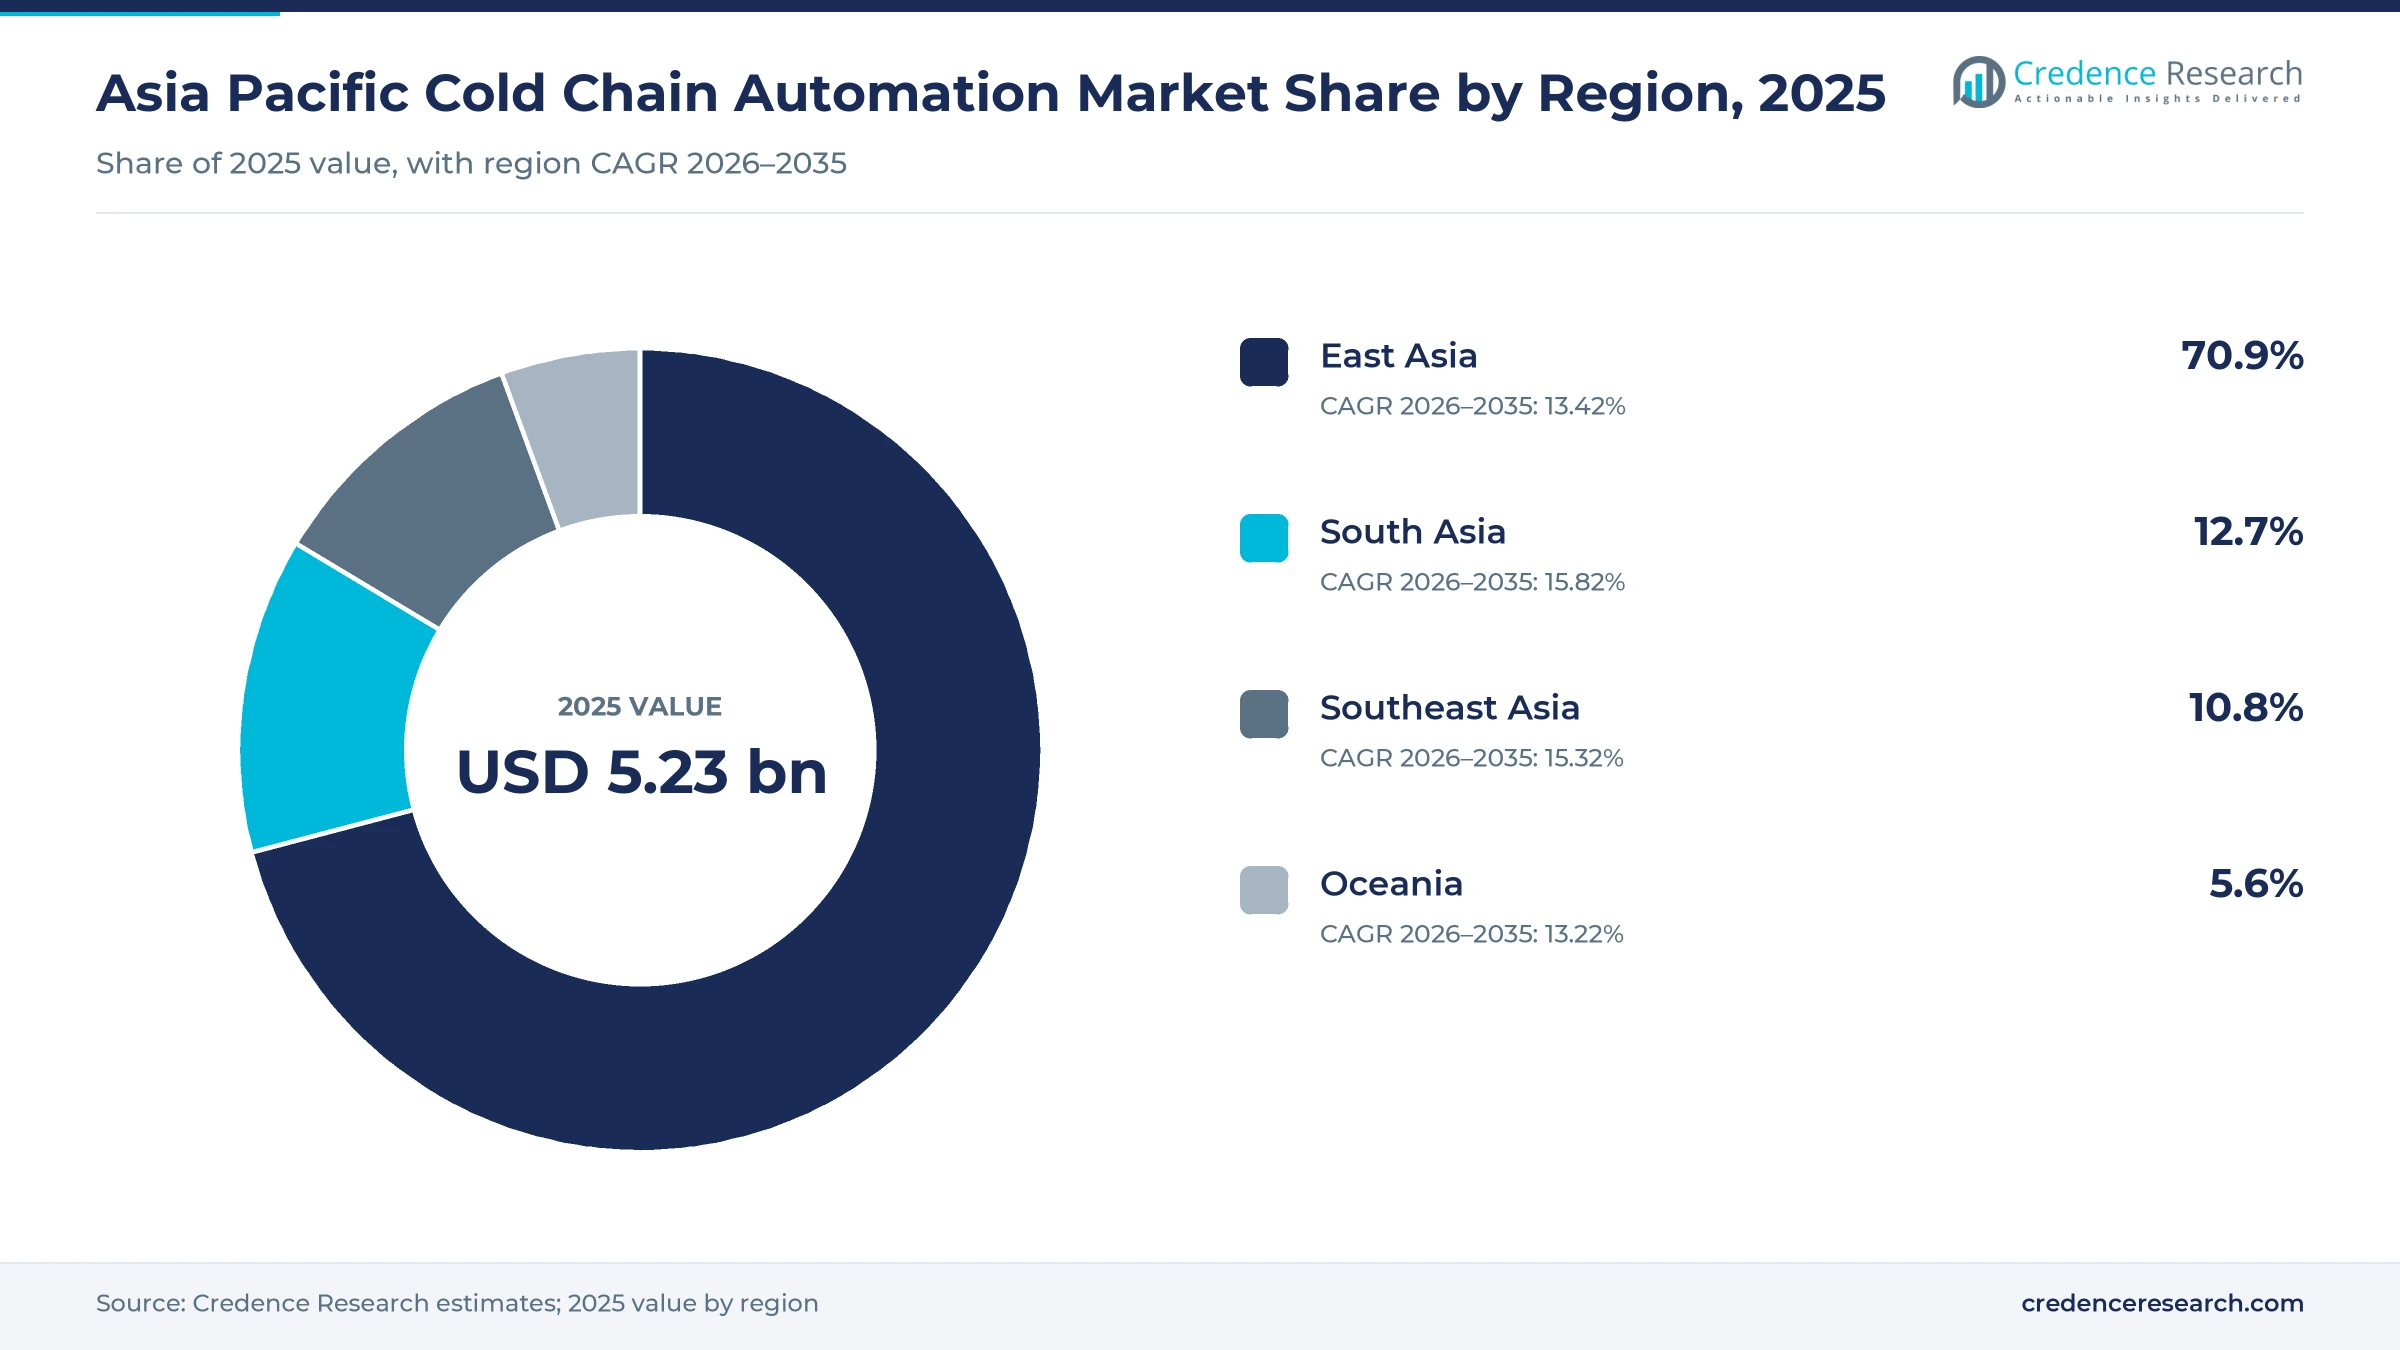
The Asia Pacific cold chain automation market was valued at USD 5.23 billion in 2025 and is projected to increase from USD 5.98 billion in 2026 to USD 19.35 billion by 2035, registering a CAGR of 13.95% during 2026–2035. Demand comes from logistics providers, food processors, drug makers and grocery chains that need to store and pick goods at minus 18 to minus 30 degrees Celsius with fewer workers. East Asia held the largest share, 70.9% in 2025, because China and Japan operate the largest refrigerated warehouse networks and face tight labor markets. South Asia is the fastest-growing region at 15.82% a year, as India adds food processing cold stores and local equipment makers expand output. Technology also shifted in May 2025, when a Shanghai cold store began moving pallets automatically between frozen and chilled zones. As a result, buyers now plan robots for the freezer itself rather than only for ambient dispatch areas.
Which temperature-controlled equipment and software sales are counted?
The estimate measures spending on hardware automation systems, software and control systems and connected monitoring and telematics used in refrigerated and frozen warehouses across East Asia, South Asia, Southeast Asia and Oceania. It counts stacker cranes, pallet shuttles, grid storage, mobile robots, conveyors, warehouse control software and condition sensors bought for storage, picking and dispatch.
The estimate excludes refrigeration plant, insulated building shells, reefer trucks and containers, packaging and the rental value of storage space. The value chain runs from equipment makers and software vendors through system integrators to logistics providers, manufacturers and retailers that operate the sites.
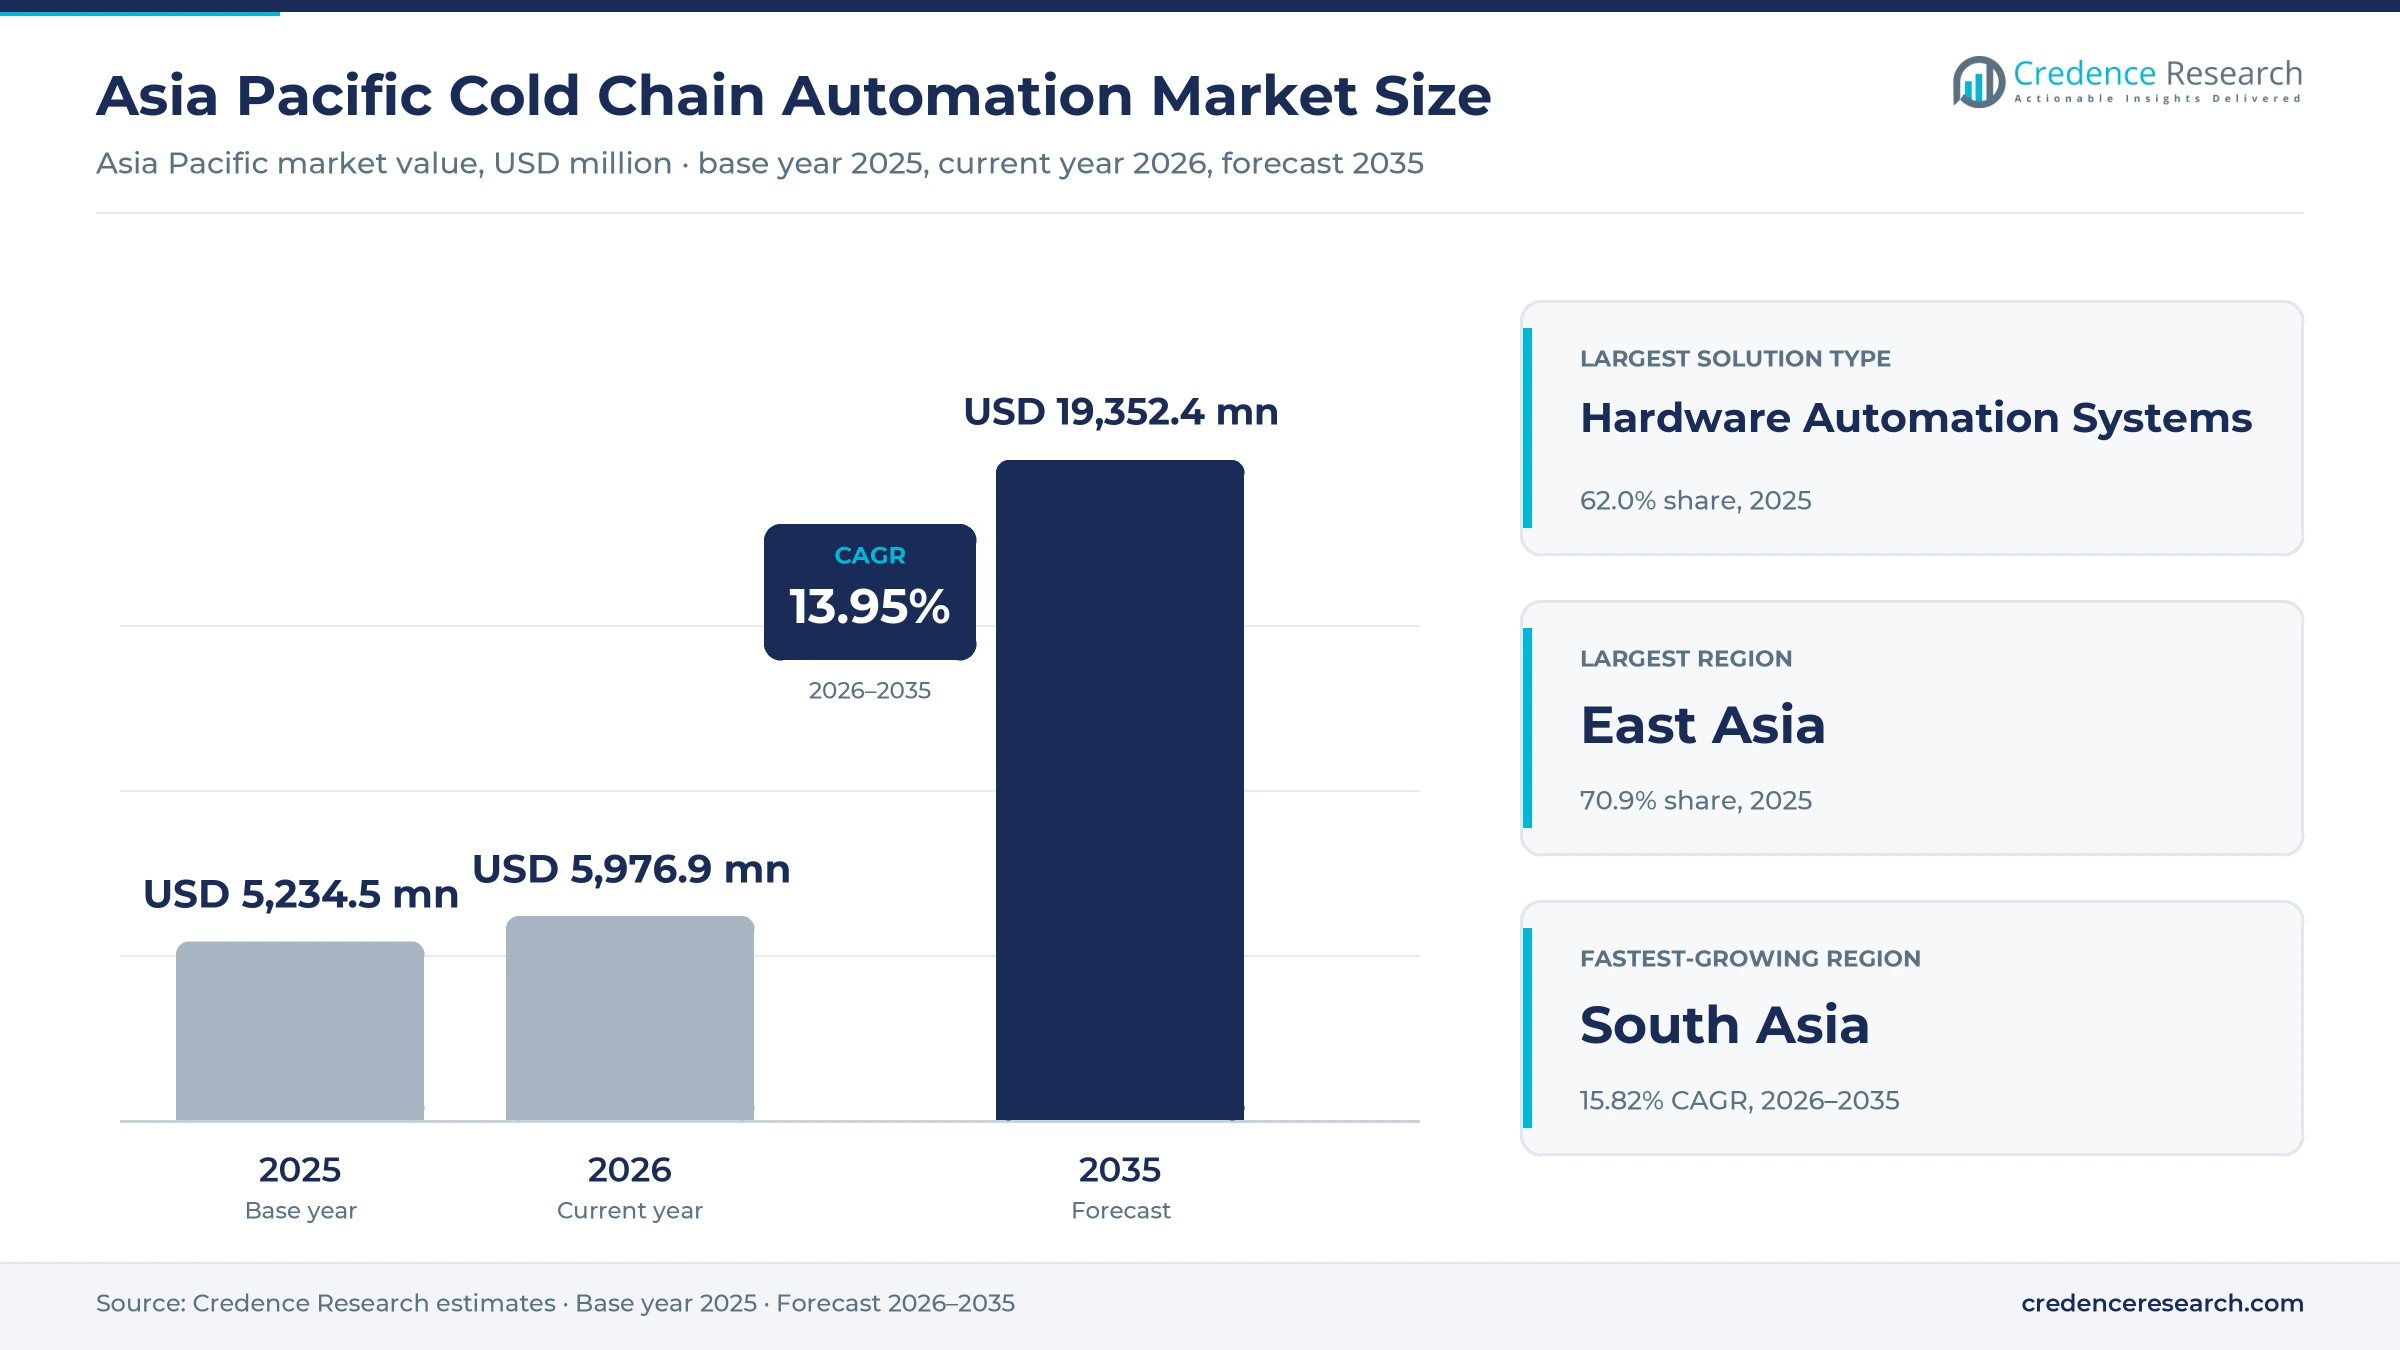
Asia Pacific Cold Chain Automation Market Insights
- The market was valued at USD 5.23 billion in 2025 and is projected to reach USD 19.35 billion by 2035, registering a CAGR of 13.95% during 2026–2035.
- East Asia held 70.9% of regional value in 2025, while China alone reached 277 million cubic meters of cold storage capacity that year.
- Hardware automation systems led with 62.0% of 2025 value, because cranes, shuttles and robots make up most project budgets.
- Geekplus put frozen and chilled pallet handling into production at a Shanghai cold store in May 2025, with pallets moving between minus 18 and plus 5 degrees.
- NewCold plans a Sydney store with 100,000 frozen pallet positions for October 2026, while its Melbourne site adds 80,000 frozen positions.
Storage hardware, food buyers and 3PLs anchor value
Why does storage hardware dominate project budgets?
Based on solution type, the market is categorized into hardware automation systems, software and control systems and connected monitoring and telematics. Hardware Automation Systems led with 62.0% of 2025 value, because freezer-rated cranes, shuttles and racking carry the largest share of each project. Connected Monitoring and Telematics grows fastest at 15.35% a year, as operators add sensors that report temperature and equipment health in real time.
Where in the warehouse is equipment installed first?
Based on application, the market is categorized into storage and retrieval, order fulfilment and transport orchestration. Storage and Retrieval led with 52.0% of 2025 value, because operators first install stacker crane and shuttle storage systems to keep people out of the freezer. Transport Orchestration grows fastest at 14.53% a year, as dock and route planning tools reduce the time loads wait outside cold rooms.
Which industries buy the most freezer equipment?
Based on end-use industry, the market is categorized into food and beverage, pharmaceuticals and temperature-sensitive chemicals. Food and Beverage led with 64.0% of 2025 value, because frozen meat, seafood, dairy and ice cream fill most refrigerated pallet positions in the region. Pharmaceuticals grows fastest at 14.74% a year, as drug makers need traceable storage with fewer manual touches.
Which customer groups sign the largest contracts?
Based on customer type, the market is categorized into third-party logistics providers, manufacturers and grocery retailers. Third-Party Logistics Providers led with 46.0% of 2025 value, because large cold store operators serve many food brands from shared automated sites. Grocery Retailers grows fastest at 14.71% a year, as supermarket chains add online orders that mix frozen, chilled and ambient items.
| Segment Group | Leading Sub-segment | Share, 2025 | Fastest-growing Sub-segment | CAGR, 2026–2035 |
|---|---|---|---|---|
| By Solution Type | Hardware Automation Systems | 62.0% | Connected Monitoring and Telematics | 15.35% |
| By Application | Storage and Retrieval | 52.0% | Transport Orchestration | 14.53% |
| By End-Use Industry | Food and Beverage | 64.0% | Pharmaceuticals | 14.74% |
| By Customer Type | Third-Party Logistics Providers | 46.0% | Grocery Retailers | 14.71% |
Request a Free Sample
Fill in your details and we'll send you a free sample report.
- Sample data tables & charts
- Research methodology
Network digitization and scarce labor drive demand
How does network digitization lift equipment demand?
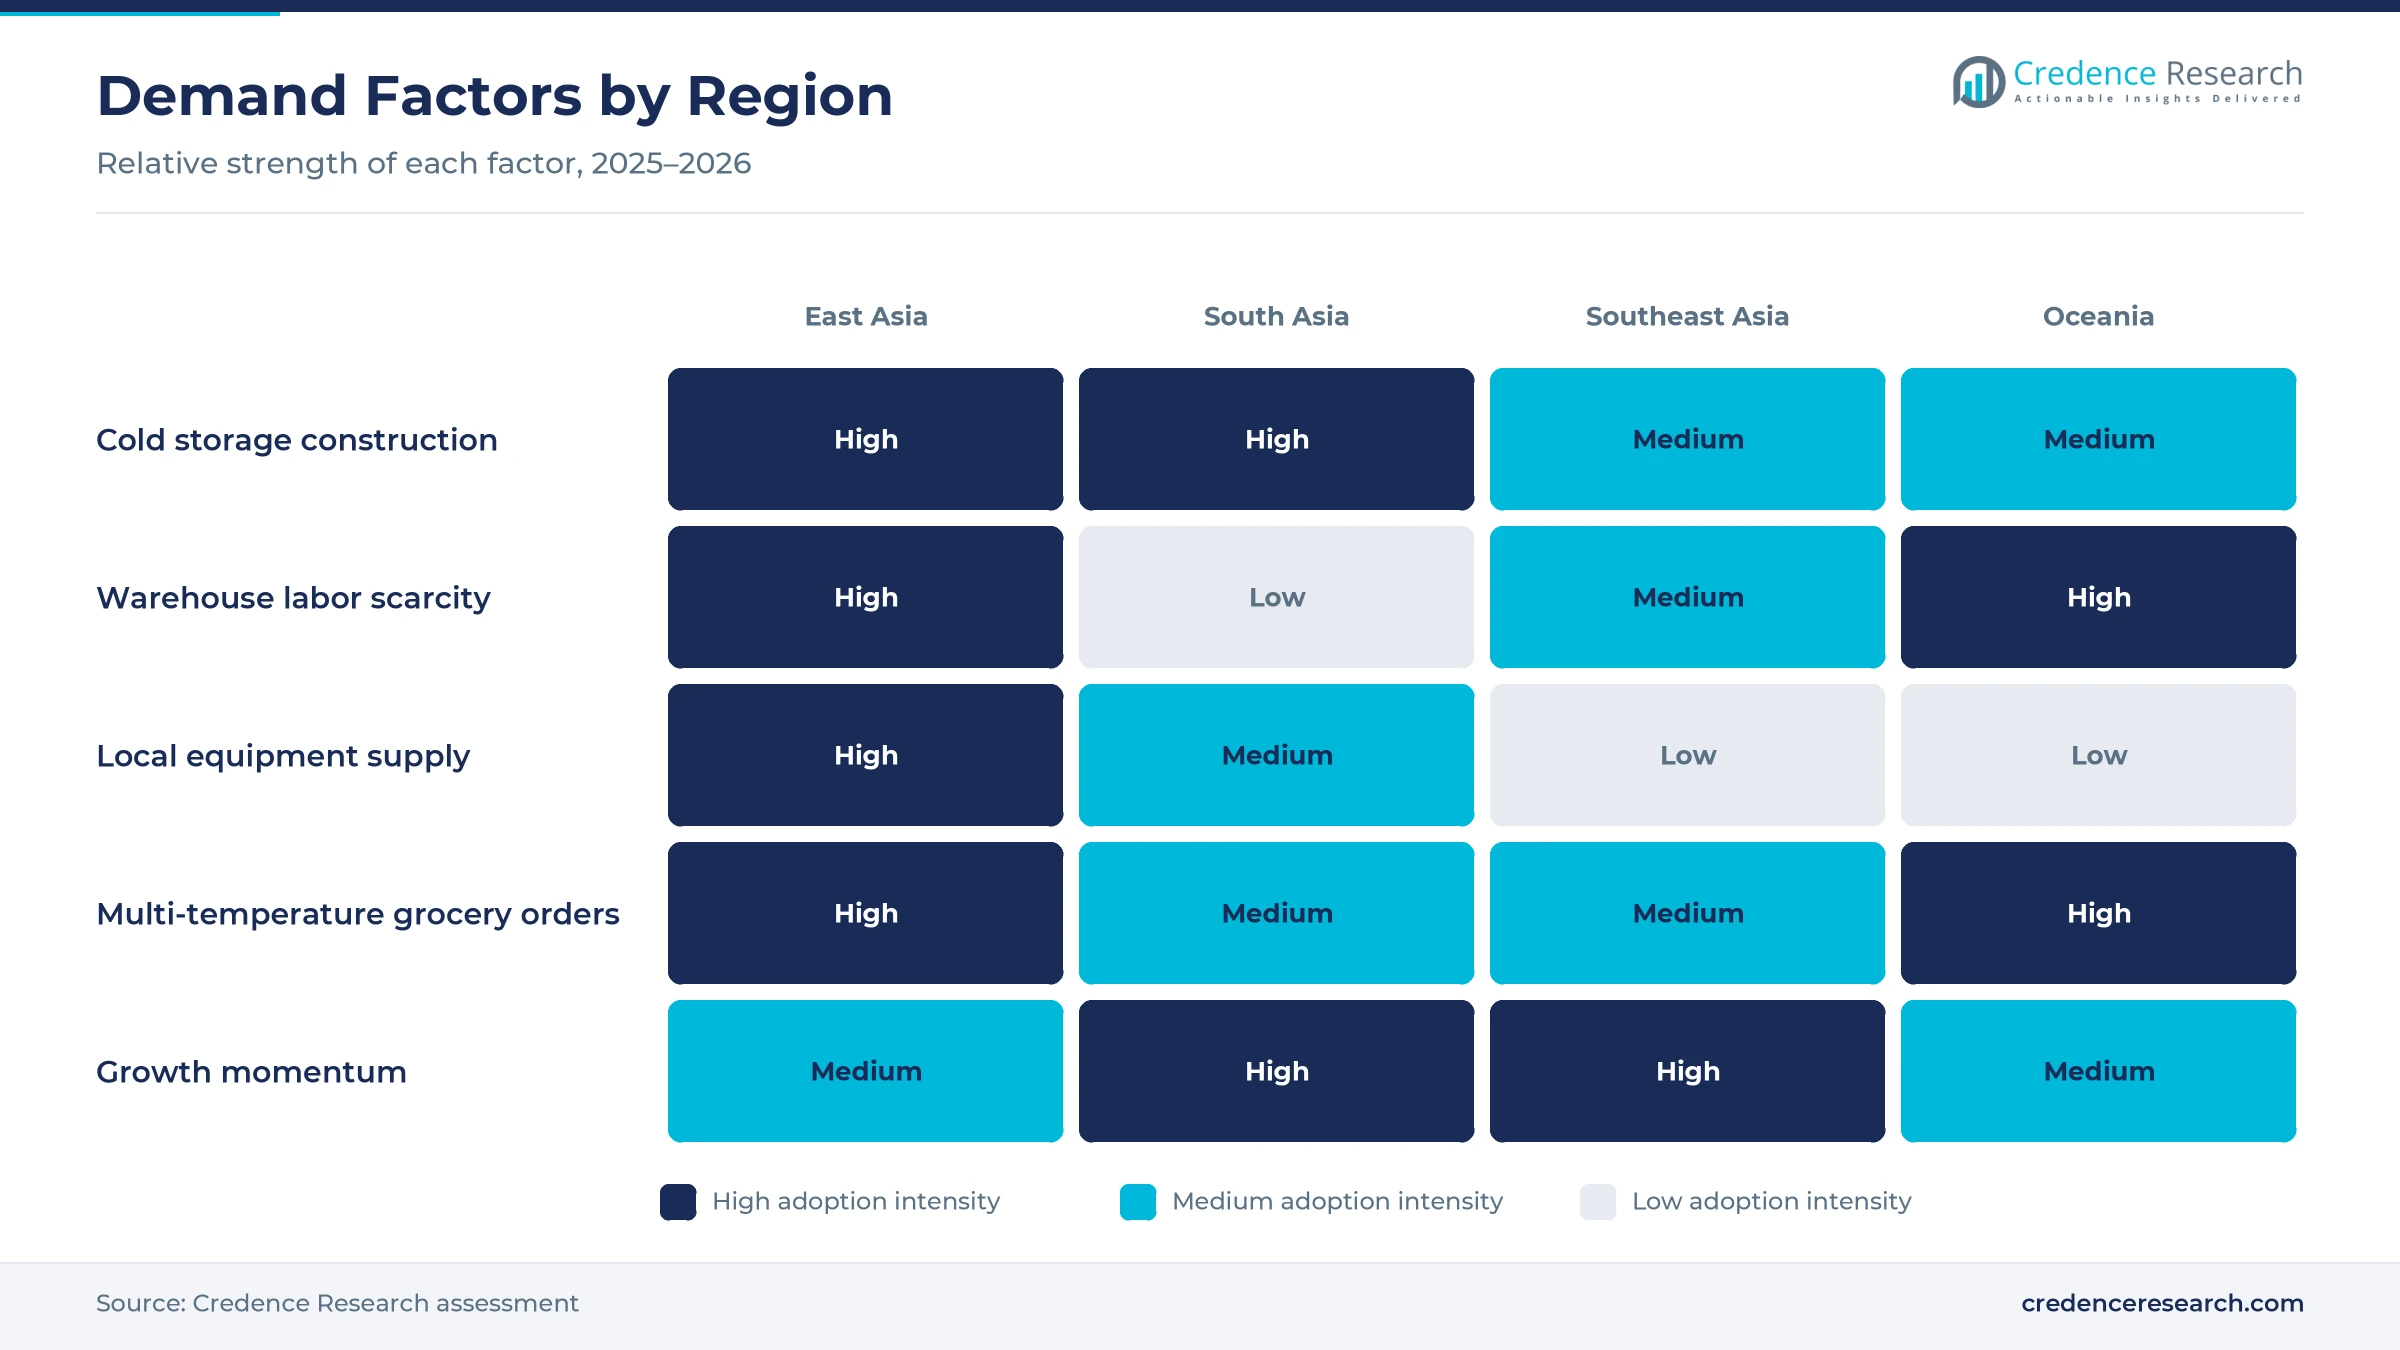
Governments in China and India are funding new cold stores, and each new site is a chance to install automation from the first day. China's total cold storage capacity reached 277 million cubic meters in 2025, a 5.53% increase, and its refrigerated truck fleet rose about 19% to 587,900 units, according to the International Institute of Refrigeration, citing CFLP data. India had approved 395 integrated cold chain projects by June 2025, with 291 operational and 25.52 lakh metric tons of yearly preservation capacity, according to the Press Information Bureau. China also issued low-carbon cold chain measures in October 2025. As a result, storage and retrieval holds 52.0% of 2025 application value.
Why do labor limits push robots into freezers?
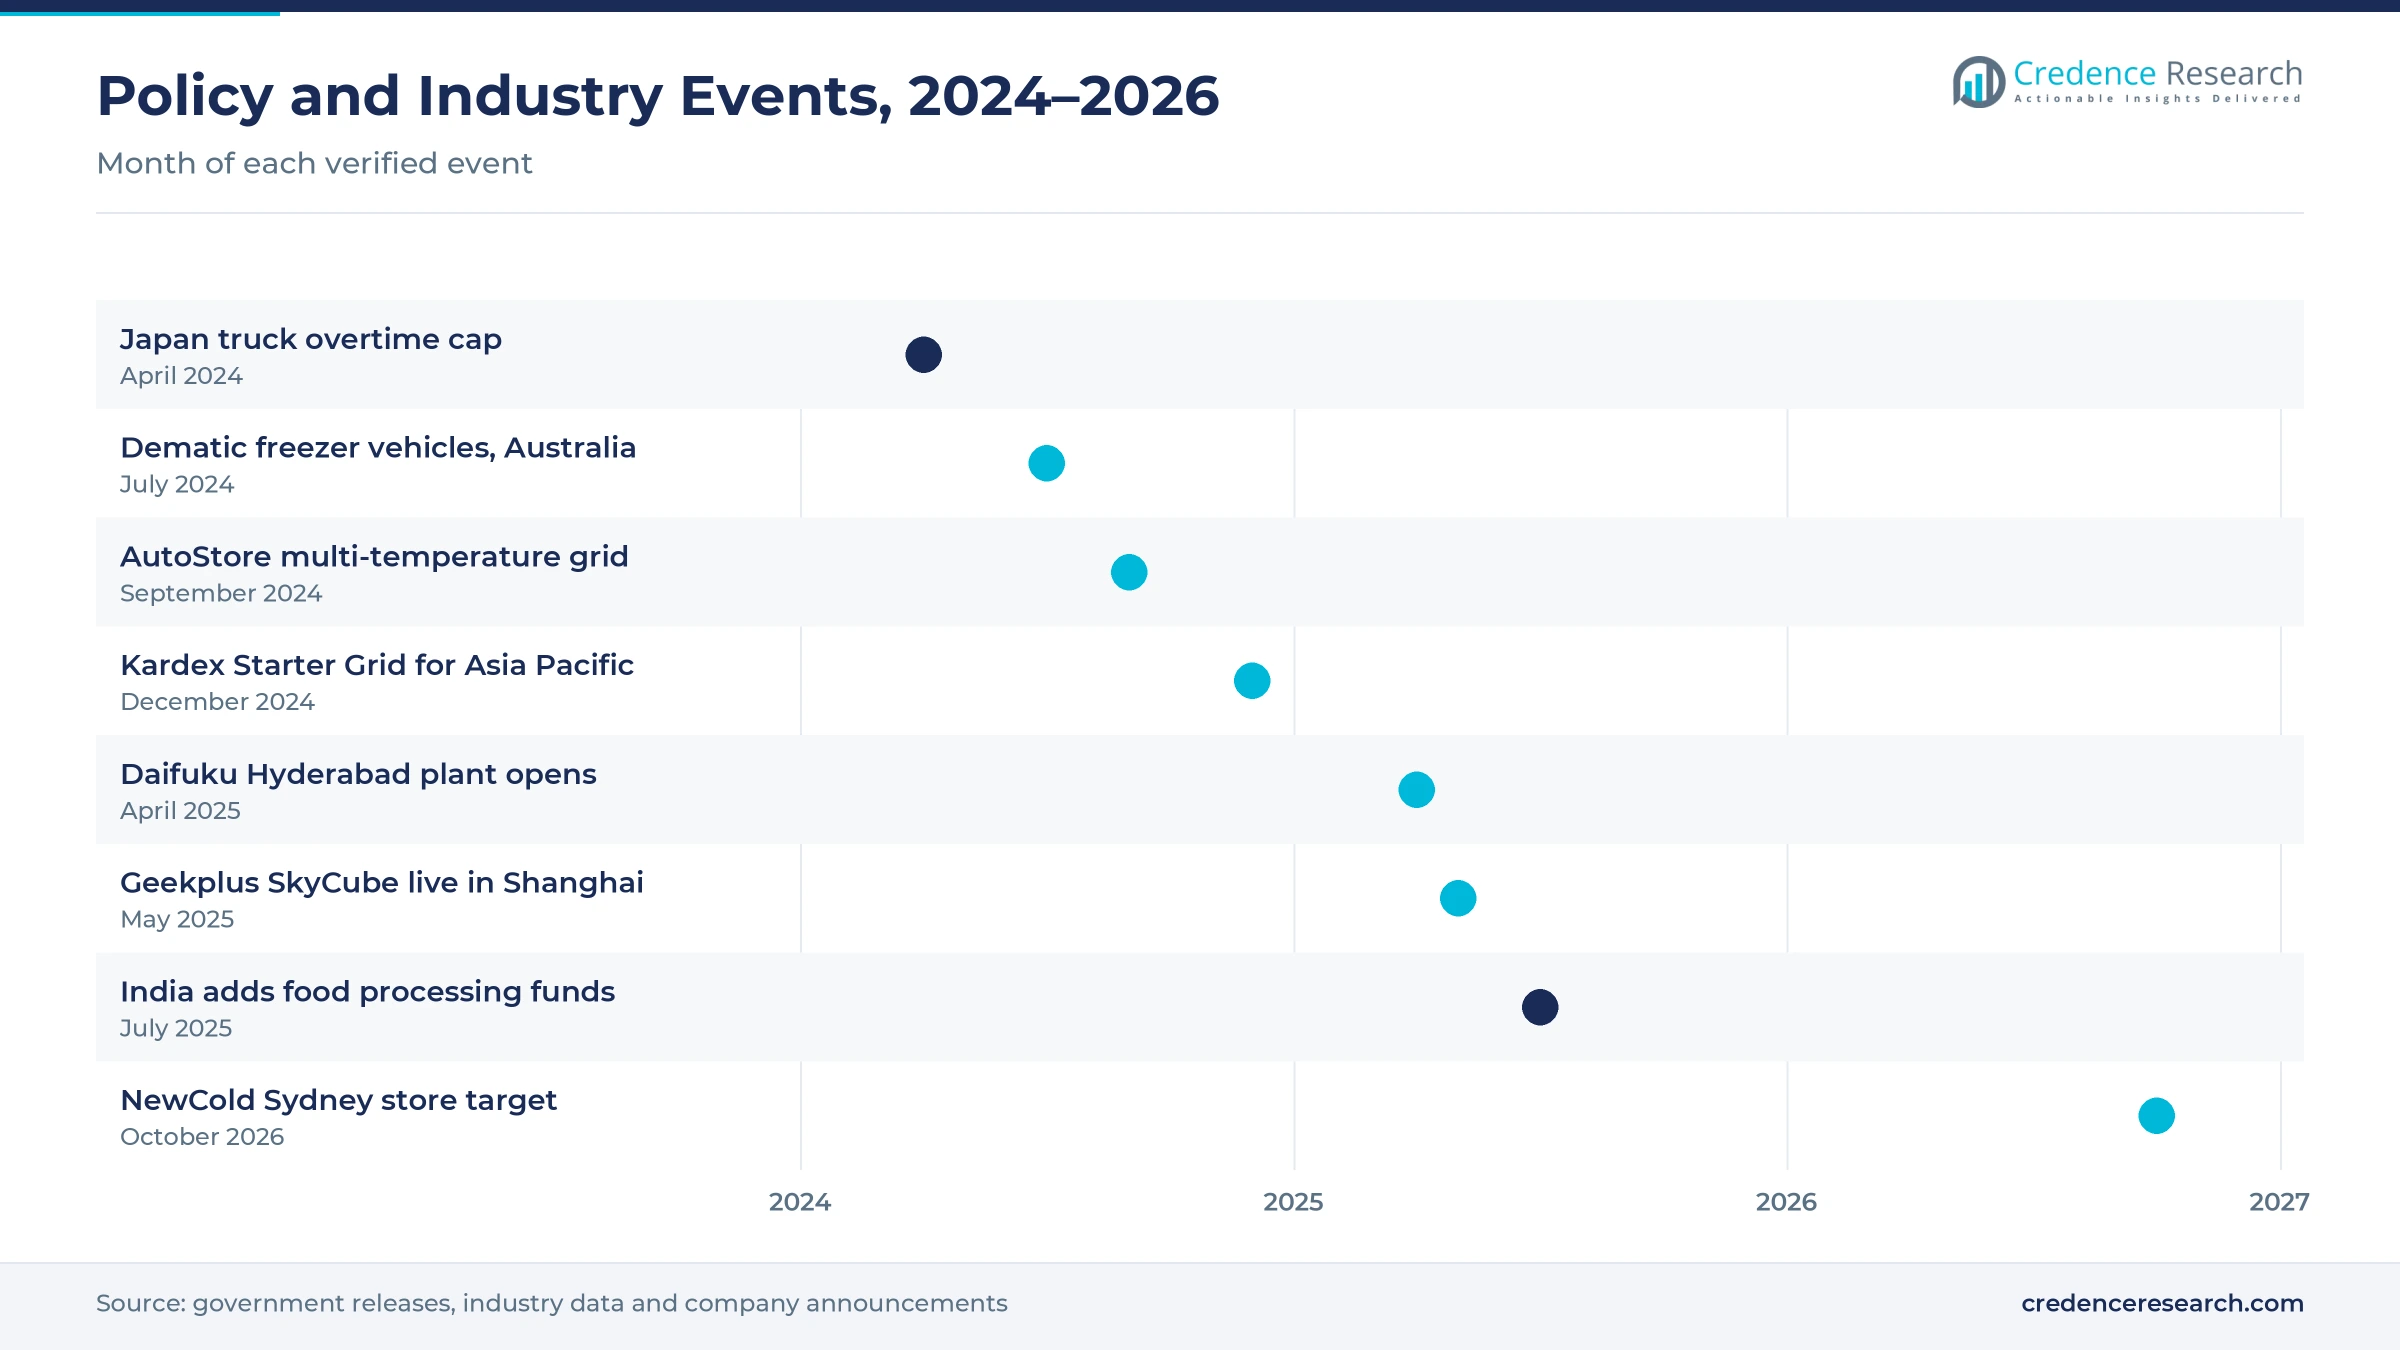
Freezer work at minus 25 degrees is hard to staff, and shrinking workforces in East Asia make the problem worse each year. Japan capped truck driver overtime at 960 hours a year from April 2024, and the government warned that transport capacity could fall short by 34% by 2030 without action, according to the World Economic Forum. That pressure forces warehouses to load and dispatch trucks faster with fewer people. Geekplus reported a 60% cut in manual labor at the Hong Kong cold store of TAHUHU after installing freezer robots in April 2025. Therefore, hardware automation systems hold 62.0% of 2025 value in the regional model.
How does multi-temperature grocery picking lift demand?
Grocery and food service orders now mix frozen, chilled and ambient items, which pushes operators to automate several temperature zones under one roof. Geekplus put its SkyCube system into production at a 2,700 square meter Jinjiang Cold Logistics site in Shanghai, moving pallets between minus 18 and plus 5 degrees, according to Geekplus. The company reported storage capacity up 70% and picking efficiency up 90% at the site. AutoStore introduced a multi-temperature grid in September 2024 covering minus 25 to plus 6 degrees, with orders open from early 2025. In turn, grocery retailers grow fastest among customer groups at 14.71% a year.
Why does food loss reduction favor tracked storage?
Food that spoils between farm and shop is lost value, so governments and food firms are investing in storage that records every temperature change. More than 13% of food is lost after harvest and before retail, according to the Food and Agriculture Organization, which calls for better storage systems to reduce these losses. India added 1,920 crore rupees to its food processing program in July 2025, including funds for 50 food irradiation units, according to IANS. Automated storage logs each pallet location and temperature without manual entry. As a result, food and beverage holds 64.0% of 2025 value in the regional model.
Multi-zone robots and grid storage reshape sites
How is the shift to frost-rated mobile robots changing sites?
Operators increasingly use mobile robots inside freezers, because robots can be added in stages while fixed cranes need a full building design. Dematic completed a deployment for an Australian meat processor in July 2024 that uses freezer-rated high-reach guided vehicles working down to minus 25 degrees, according to iTWire. Dematic said those vehicles were designed and built in Australia and are sold only in Asia Pacific. Geekplus also runs low-temperature four-way shuttle robots at a Hong Kong cold store with a minus 25 degree zone. Wider use of warehouse robotics lowers entry costs for mid-sized cold stores. As a result, mid-sized cold stores can automate freezer zones in stages rather than through a full rebuild.
Why is the rise of high-density grid storage notable?
Land near large cities is expensive, so cold store operators want more pallets and totes in the same building volume. Swisslog Australia and New Zealand said in June 2025 that an automated high-bay chilled warehouse can hold up to four times more storage in the same footprint and cut energy load by up to 20%. Swisslog also cites more than 250 deep-freeze automation projects worldwide. Kardex launched an AutoStore Starter Grid for Asia Pacific in December 2024 that can be running within six months. As a result, third-party logistics providers, which hold 46.0% of 2025 value, are the main buyers of these grids.
Can South Asian equipment makers open a new buyer base?
Local manufacturing in India is lowering the cost and lead time of storage equipment, which opens automation to mid-sized food and drug firms. Daifuku Intralogistics India opened a 227 crore rupee plant in Hyderabad in April 2025 and built its first India-made 30-meter stacker crane there in November 2025, according to The Machine Maker. Daifuku has installed more than 300 stacker cranes in India. Addverb runs a 15-acre robot plant in Greater Noida that can produce about 100,000 robots a year, according to India Seatrade News. Therefore, South Asia is the fastest-growing of the four regions in the model.
Can pharmaceutical storage become a premium opening?
Drug makers in the region need storage that proves temperature control for every pallet, which favors automated sites with full electronic records. Drug storage differs from food storage, because every pallet movement and temperature reading must be recorded before quality teams release stock. SSI SCHAEFER built a Singapore freezer store with more than 100,000 pallet positions and machines rated to minus 30 degrees, which shows the scale now possible in Southeast Asia. Murata Machinery offers camera and sensor monitoring that lets operators check refrigerated warehouses without entering them. As a result, pharmaceuticals grow at 14.74% a year, faster than food.
Sub-zero engineering and capital costs slow uptake
How do sub-zero conditions raise engineering risk?
Batteries, lubricants, sensors and steel parts behave differently at minus 25 degrees, so freezer equipment must be specially rated and tested. Condensation at door openings can freeze on rails and sensors and stop a system. As a result, maintenance costs are higher than in ambient warehouses, and downtime can spoil stock. Vendors respond with frost-rated robots, heated components and remote monitoring that reduce the number of service visits inside the freezer.
Why do high upfront costs delay smaller projects?
A freezer high-bay store needs racking, cranes, insulation and control software paid for before the first pallet arrives. Many cold store operators in South and Southeast Asia are family firms with limited access to long-term finance. This means that automation often stays limited to the largest logistics providers and food groups. Modular grids, robots added in phases and government grants in Singapore and Malaysia help lower the first investment.
How do earthquakes and building codes shape designs?
Japan, Taiwan and parts of Indonesia and New Zealand face strong earthquakes, which limit rack heights and raise structural costs. Tall rack-clad freezer buildings need seismic design that adds steel and engineering hours. In turn, the same storage density costs more in these markets than in calmer areas. Lower and deeper rack layouts and isolation systems help operators balance safety with storage capacity.
Why does integration with older systems slow rollouts?
Robots and cranes must connect with warehouse management, enterprise resource planning and transport systems before orders flow smoothly. Many cold stores run older software that lacks open interfaces, so data on temperature, stock and dispatch stays in separate tools. As a result, start-up periods run longer and early throughput is lower than planned. Standard interfaces and phased commissioning reduce this risk for buyers.
East Asia leads while South Asia grows fastest
| Region | Value, 2025 (USD billion) | Share, 2025 | CAGR, 2026–2035 |
|---|---|---|---|
| East Asia | 3.71 | 70.9% | 13.42% |
| South Asia | 0.66 | 12.7% | 15.82% |
| Southeast Asia | 0.57 | 10.8% | 15.32% |
| Oceania | 0.29 | 5.6% | 13.22% |
Why does East Asia hold the largest share?
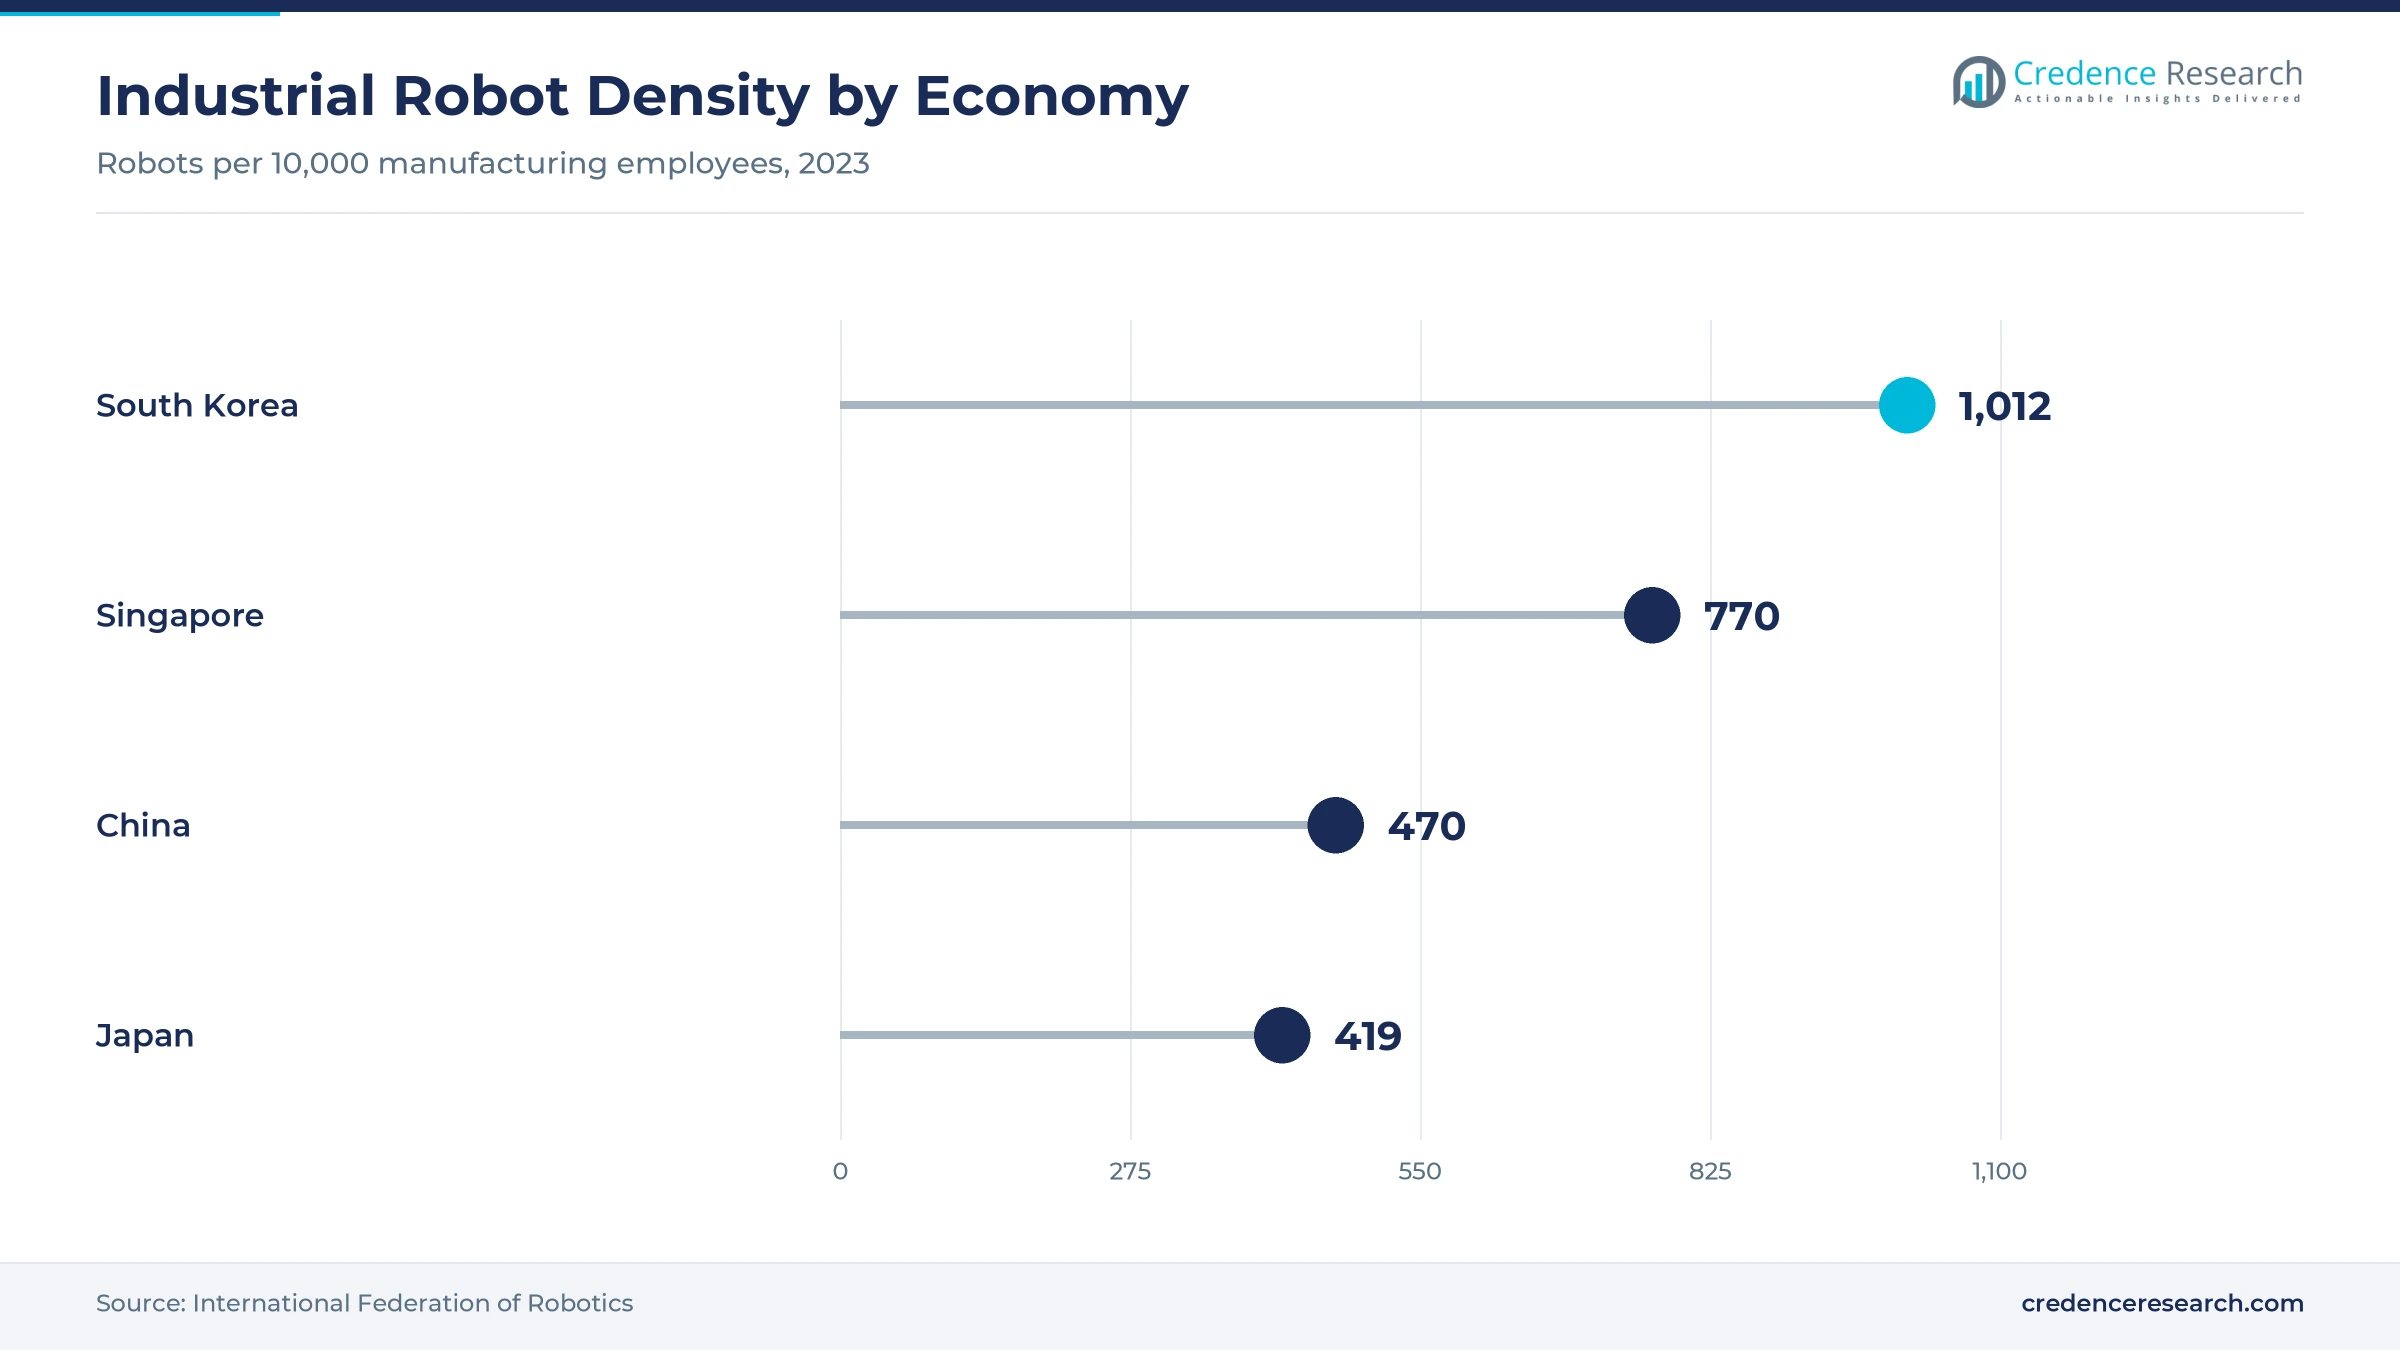
East Asia held 70.9% of 2025 value and grows at 13.42% a year in the regional demand model. China added 3.5 million cubic meters of cold storage in the fourth quarter of 2025 alone, and Japan's 2024 overtime cap tightened warehouse and transport labor. China, Japan and South Korea also have some of the highest industrial robot densities in the world, so cold store operators already have skilled suppliers nearby.
Why is South Asia growing fastest?
South Asia held 12.7% of 2025 value and grows fastest at 15.82% a year in the regional demand model. India's integrated cold chain program, extra food processing funds approved in July 2025 and new local equipment plants drive this growth. Daifuku and Addverb now build storage equipment and robots in India, which shortens lead times for local food and drug buyers.
What lifts Southeast Asia?
Southeast Asia held 10.8% of 2025 value and grows at 15.32% a year in the regional demand model. Singapore leads with large automated freezer stores and grants that support warehouse automation, while Malaysia, Thailand, Vietnam and the Philippines add first-time buyers. Growth in Philippine refrigerated warehousing and Malaysian food logistics adds new sites that can be automated from the start.
How does Oceania automate a mature network?
Oceania held 5.6% of 2025 value and grows at 13.22% a year in the regional demand model. NewCold targets October 2026 for a new Sydney store with 100,000 frozen pallet positions, according to NewCold. Its Melbourne expansion adds 80,000 frozen positions, and growing Australian frozen food demand supports further high-bay projects.
Freezer robot launches and new stores, 2024 to 2026
| Development | Status and market relevance |
|---|---|
| In July 2024, Dematic completed an automated meat buffer with freezer-rated guided vehicles for an Australian meat processor. | Vehicles work down to minus 25 degrees and are sold only in Asia Pacific |
| In December 2024, Kardex launched the AutoStore Starter Grid for Asia Pacific customers. | Pre-configured grid that can be running within six months |
| In April 2025, Geekplus deployed freezer robots and shuttles at the TAHUHU cold store in Hong Kong. | Three zones at 0 to 4, minus 18 and minus 25 degrees |
| In May 2025, Geekplus put its SkyCube system into production at Jinjiang Cold Logistics in Shanghai. | Moves pallets between frozen and chilled zones automatically |
| In June 2025, NewCold announced a new Sydney frozen store and a Melbourne expansion. | Sydney adds 100,000 frozen pallet positions, targeted for October 2026 |
Frost-rated robots and live data change cold sites
- Frost-rated mobile robots carry pallets and totes at minus 18 to minus 25 degrees, so operators can automate freezers in stages instead of rebuilding a site.
- Multi-zone grid storage holds frozen, chilled and ambient bins in one structure, which suits grocery orders that mix temperature classes.
- Condition telematics link sensors in stores and on refrigerated containers with dashboards that alert staff before a temperature limit is breached.
- Control software coordinates cranes, robots and docks, and it shares data with temperature-tracking software used by quality teams.
Need a Custom Version of This Report?
Tailor the scope, geography, or segments to your exact requirements.
- Custom geography or segment scope
- Direct access to our analyst team
Crane makers and robot specialists compete on density
Competition combines Japanese and European crane and shuttle makers with Chinese and Indian robot specialists. Daifuku opened an India plant in April 2025 and built its first India-made stacker crane there. Murata Machinery offers freezer storage systems and camera monitoring for refrigerated warehouses. Dematic sells freezer-rated guided vehicles designed in Australia, while SSI SCHAEFER built a large Singapore freezer store. Swisslog promotes pallet shuttles and grid storage for deep-freeze sites in Australia and New Zealand. Geekplus runs frozen robots in Shanghai and Hong Kong, and Kardex sells AutoStore grids across Asia Pacific. Addverb builds warehouse robots at its own plants in India. Rivals compete on storage density, energy use, frost-rated reliability, local service and software that links equipment with warehouse management.
Companies profiled and their roles in this market
| Company | Type | Role in the market |
|---|---|---|
| Daifuku Co., Ltd. | Storage systems maker | Opened a Hyderabad plant in April 2025 and built its first India-made stacker crane |
| Murata Machinery, Ltd. | Storage systems maker | Offers freezer storage systems and camera monitoring for refrigerated warehouses |
| Dematic | Systems integrator | Completed a freezer-rated meat buffer for an Australian processor in July 2024 |
| SSI SCHAEFER | Systems integrator | Built a Singapore freezer store with more than 100,000 pallet positions |
| Swisslog | Systems integrator | Showed pallet shuttles and grid storage for deep-freeze sites at CeMAT 2025 in Sydney |
| Geekplus | Robot maker | Put frozen and chilled pallet robots into production in Shanghai in May 2025 |
| AutoStore | Grid storage maker | Introduced a multi-temperature grid from minus 25 to plus 6 degrees in September 2024 |
| Kardex | Systems integrator | Launched an AutoStore Starter Grid for Asia Pacific in December 2024 |
| Addverb | Robot maker | Runs a 15-acre robot plant in Greater Noida with capacity for about 100,000 robots a year |
Credence Research view on labor-led investment
Credence Research's view is that Asia Pacific cold chain automation spending will grow on labor scarcity and new cold store construction rather than on cost savings alone. East Asia stays the anchor because of its scale and its supplier base, although South Asia adds demand fastest as India builds cold stores and local equipment plants. Mobile robots and modular grids let smaller operators automate in stages. Vendors that combine frost-rated equipment with local service teams and connected monitoring are best placed to win.
How the regional estimate was built
The report uses 2025 as the base year and presents market values in USD billion through 2035. Market values come from the Credence Research model, and region, solution type, application, end-use industry and customer type splits are Credence Research estimates. Inputs include United Nations agency data, government releases, refrigeration association data, industry association robot statistics and company announcements. Regional shares follow the Credence Research regional split, and growth tilts reflect cold storage construction, labor supply and local equipment manufacturing. No interviews or surveys were used in preparing these estimates.
South Asia, pharma and data tools lead to 2035
The Asia Pacific cold chain automation market is expected to reach USD 19.35 billion by 2035, a 13.95% CAGR during 2026–2035, as operators move freezer work from people to cranes, shuttles and robots. South Asia should gain the most share, while East Asia remains the largest region. Connected monitoring and telematics and pharmaceuticals are expected to grow faster than the regional average. High upfront costs or weak food demand would lower this outlook, while stricter food safety and drug storage rules would raise it.
Frequently Asked Questions
How big is the Asia Pacific cold chain automation market?
Which region leads demand?
Which region grows fastest?
Which solution type holds the largest share?
Which application leads the market?
Why is pharmaceutical demand rising?
Who are the main companies in the market?
Which customer type grows fastest?
Table of Content
Chapter 1 Market Segmentation
- 1.1 Segmentation Framework
- 1.1.1 Product and Service Classification
- 1.1.2 Application and End-Use Classification
- 1.1.3 Technology and Solution Classification
- 1.1.4 Customer and Distribution Channel Classification
- 1.1.5 Geographic Segmentation
- 1.1.6 Market Segment Definitions and Boundaries
- 1.2 By Solution Type
- 1.2.1 Hardware Automation Systems
- 1.2.2 Software and Control Systems
- 1.2.3 Connected Monitoring and Telematics
- 1.3 By Application
- 1.3.1 Storage and Retrieval
- 1.3.2 Order Fulfilment
- 1.3.3 Transport Orchestration
- 1.4 By End-Use Industry
- 1.4.1 Food and Beverage
- 1.4.2 Pharmaceuticals
- 1.4.3 Temperature-Sensitive Chemicals
- 1.5 By Customer Type
- 1.5.1 Third-Party Logistics Providers
- 1.5.2 Manufacturers
- 1.5.3 Grocery Retailers
Chapter 2 Introduction
- 2.1 Report Objectives and Scope
- 2.2 Product Definition and Industry Terminology
- 2.3 Market Inclusions and Exclusions
- 2.4 Research Process
- 2.4.1 Primary Research and Expert Interviews
- 2.4.2 Secondary Research and Source Review
- 2.4.3 Top-Down and Bottom-Up Estimation
- 2.4.4 Data Triangulation and Verification
- 2.5 Market Size Measurement Basis
- 2.5.1 2025: USD 5.23 billion → 2035: USD 19.35 billion
- 2.6 Historical and Forecast Reference Periods
- 2.6.1 Historical Period: 2018-2025
- 2.6.2 Base Year: 2025
- 2.6.3 Forecast Period: 2025-2035
- 2.7 Research Assumptions and Limitations
Chapter 3 Executive Summary
- 3.1 Market Snapshot and Key Findings
- 3.2 Base-Year Market Size, 2025
- 3.3 Forecast Market Size, 2035
- 3.4 Revenue and Volume Growth Outlook
- 3.5 Key Demand and Supply Indicators
- 3.6 Leading Market Segments
- 3.7 Fastest-Growing Market Opportunities
- 3.8 Regional Performance Highlights
- 3.9 Technology and Industry Transformation
- 3.10 Competitive Landscape Summary
- 3.11 Analyst View and Strategic Implications
Chapter 4 Asia Pacific Cold Chain Automation Market Trends and Developments
- 4.1 Historical Industry Development, 2018-2025
- 4.2 Recent Market Trends and Developments
- 4.3 Demand and Customer Behavior Trends
- 4.4 Technology and Product Innovation
- 4.5 Artificial Intelligence, Automation and Digitalization
- 4.6 Local Manufacturing and Supply Chain Realignment
- 4.7 Industry Partnerships, Mergers and Acquisitions
- 4.8 Sustainability and Circular Economy Developments
- 4.9 Government and Private Sector Investment Trends
- 4.10 Emerging Business Models and Commercialization
- 4.11 Industry Developments and Announcements
Chapter 5 Asia Pacific Cold Chain Automation Market Production, Supply and Demand Analysis
- 5.1 Demand Trend and Consumption Analysis, 2018-2025
- 5.2 Demand Forecast, 2025-2035
- 5.3 Production and Output Trend, 2018-2025
- 5.4 Production and Output Forecast, 2025-2035
- 5.5 Installed Capacity and Capacity Utilization
- 5.6 Company-Wise Production Plants and Statistics
- 5.6.1 Installed Production Capacity
- 5.6.2 Actual Production
- 5.6.3 Planned Capacity and Expansion Targets
- 5.7 Supply Chain Structure and Procurement Trends
- 5.8 Supply-Demand Gap and Bottlenecks
- 5.9 Import Dependence and Sourcing Structure
- 5.10 Contract Manufacturing and Outsourcing
- 5.11 Regional Supply and Demand Concentration
Chapter 6 Asia Pacific Cold Chain Automation Market Pricing Analysis
- 6.1 Pricing Structure and Measurement
- 6.2 Historical Pricing Trends, 2018-2025
- 6.3 Pricing Outlook, 2025-2035
- 6.4 Average Selling Price and Unit Economics
- 6.5 Pricing by Product and Market Segment
- 6.6 Geographic Pricing Differences
- 6.7 Key Input, Energy, Labor and Logistics Costs
- 6.8 Contract Pricing and Purchasing Models
- 6.9 Pricing Sensitivity and Competitive Positioning
- 6.10 Price, Margin and Profitability Implications
Chapter 7 Asia Pacific Cold Chain Automation Market Dynamics
- 7.1 Market Growth Drivers
- 7.1.1 Demand-Side Drivers
- 7.1.2 Technology and Innovation Drivers
- 7.1.3 Infrastructure and Investment Drivers
- 7.1.4 Regulatory and Policy Drivers
- 7.2 Market Restraints
- 7.2.1 Cost and Affordability Constraints
- 7.2.2 Technology and Adoption Barriers
- 7.2.3 Supply Chain and Operational Constraints
- 7.3 Market Challenges
- 7.3.1 Competitive Pressure and Margin Erosion
- 7.3.2 Skills, Infrastructure and Implementation Gaps
- 7.4 Emerging Market Opportunities
- 7.5 Market Dynamics Impact and Time-Horizon Assessment
Chapter 8 Asia Pacific Cold Chain Automation Value Chain Analysis
- 8.1 Industry Value Chain Overview
- 8.2 Upstream Suppliers and Critical Inputs
- 8.3 Technology and Component Providers
- 8.4 Manufacturing or Service Delivery
- 8.5 Distribution, Channel Partners and Integrators
- 8.6 Downstream Applications and End Users
- 8.7 Value Addition and Profit Pools
- 8.8 Vertical Integration and Outsourcing
- 8.9 Supplier Concentration and Risk
- 8.10 Supply Chain Localization and Resilience
Chapter 9 Asia Pacific Cold Chain Automation Market Regulations and Policies
- 9.1 Relevant Laws, Standards and Compliance Frameworks
- 9.2 Product, Service, Safety and Quality Requirements
- 9.3 Government Policies, Incentives and Subsidies
- 9.4 Imports, Exports and Trade Barriers
- 9.5 Public Procurement and Local Content Requirements
- 9.6 Environmental and Sustainability Compliance
- 9.7 Upcoming Policy Changes and Market Implications
Chapter 10 Asia Pacific Cold Chain Automation Market Hotspots and Opportunities
- 10.1 Market Opportunity Mapping and Growth Hotspots
- 10.2 High-Growth Applications and Customer Groups
- 10.3 Underserved Markets and White-Space Opportunities
- 10.4 Emerging Technology and Product Opportunities
- 10.5 New Capacity and Investment Hotspots
- 10.6 Market Entry and Expansion Opportunities
- 10.7 Distribution and Partnership Opportunities
- 10.8 Near-Term and Long-Term Commercial Potential
- 10.9 Opportunity Attractiveness and Execution Risks
Chapter 11 Asia Pacific Cold Chain Automation Market Outlook, 2025-2035
- 11.1 Market Size and Analysis
- 11.1.1 Revenue (Market Measurement: 2025: USD 5.23 billion → 2035: USD 19.35 billion)
- 11.1.2 Market Volume and Quantity Sold
- 11.1.3 Historical Market Size, 2018-2025
- 11.1.4 Base-Year Market Size, 2025
- 11.2 Market Forecast, 2025-2035
- 11.2.1 Revenue Forecast to 2035
- 11.2.2 Volume Forecast to 2035
- 11.2.3 CAGR and Year-on-Year Growth
- 11.2.4 Incremental Revenue Opportunity
- 11.3 Forecast Assumptions and Scenario Analysis
- 11.3.1 Base-Case Forecast
- 11.3.2 Optimistic and Conservative Scenarios
- 11.3.3 Technology, Pricing and Policy Sensitivities
- 11.4 Market Attractiveness and Growth Outlook
Chapter 12 Asia Pacific Cold Chain Automation Market Segmentation and Outlook
- 12.1 Segmentation Summary and Market Shares, 2025
- 12.2 Largest and Fastest-Growing Segments
- 12.3 By Solution Type - Market Size and Forecast, 2025-2035
- 12.3.1 Segment Definition and Scope
- 12.3.2 Historical Market Size, 2018-2025
- 12.3.3 Revenue Forecast, 2025-2035
- 12.3.4 Volume Forecast, 2025-2035
- 12.3.5 Base-Year Market Share, 2025
- 12.3.6 Segment CAGR and Growth Drivers
- 12.3.7 Subsegment Market Size and Forecast
- 12.3.7.1 Hardware Automation Systems
- 12.3.7.2 Software and Control Systems
- 12.3.7.3 Connected Monitoring and Telematics
- 12.3.8 Subsegment Pricing and Adoption Trends
- 12.3.9 Leading Suppliers and Competition
- 12.3.10 Regional Demand and Opportunities
- 12.4 By Application - Market Size and Forecast, 2025-2035
- 12.4.1 Segment Definition and Scope
- 12.4.2 Historical Market Size, 2018-2025
- 12.4.3 Revenue Forecast, 2025-2035
- 12.4.4 Volume Forecast, 2025-2035
- 12.4.5 Base-Year Market Share, 2025
- 12.4.6 Segment CAGR and Growth Drivers
- 12.4.7 Subsegment Market Size and Forecast
- 12.4.7.1 Storage and Retrieval
- 12.4.7.2 Order Fulfilment
- 12.4.7.3 Transport Orchestration
- 12.4.8 Subsegment Pricing and Adoption Trends
- 12.4.9 Leading Suppliers and Competition
- 12.4.10 Regional Demand and Opportunities
- 12.5 By End-Use Industry - Market Size and Forecast, 2025-2035
- 12.5.1 Segment Definition and Scope
- 12.5.2 Historical Market Size, 2018-2025
- 12.5.3 Revenue Forecast, 2025-2035
- 12.5.4 Volume Forecast, 2025-2035
- 12.5.5 Base-Year Market Share, 2025
- 12.5.6 Segment CAGR and Growth Drivers
- 12.5.7 Subsegment Market Size and Forecast
- 12.5.7.1 Food and Beverage
- 12.5.7.2 Pharmaceuticals
- 12.5.7.3 Temperature-Sensitive Chemicals
- 12.5.8 Subsegment Pricing and Adoption Trends
- 12.5.9 Leading Suppliers and Competition
- 12.5.10 Regional Demand and Opportunities
- 12.6 By Customer Type - Market Size and Forecast, 2025-2035
- 12.6.1 Segment Definition and Scope
- 12.6.2 Historical Market Size, 2018-2025
- 12.6.3 Revenue Forecast, 2025-2035
- 12.6.4 Volume Forecast, 2025-2035
- 12.6.5 Base-Year Market Share, 2025
- 12.6.6 Segment CAGR and Growth Drivers
- 12.6.7 Subsegment Market Size and Forecast
- 12.6.7.1 Third-Party Logistics Providers
- 12.6.7.2 Manufacturers
- 12.6.7.3 Grocery Retailers
- 12.6.8 Subsegment Pricing and Adoption Trends
- 12.6.9 Leading Suppliers and Competition
- 12.6.10 Regional Demand and Opportunities
- 12.7 Segment Growth Comparison
- 12.8 Segment Attractiveness and Priority Matrix
Chapter 13 Asia Pacific Cold Chain Automation End-Use and Application Market Outlook
- 13.1 End-Use Industry and Customer Demand Structure
- 13.2 Leading Applications and Customer Groups
- 13.3 End-Use Market Size, Share and Forecast
- 13.4 Major End-Use Industry Deep Dives
- 13.4.1 Customer Requirements and Use Cases
- 13.4.2 Demand and Replacement Cycles
- 13.4.3 Technical and Regulatory Considerations
- 13.4.4 Purchasing and Procurement Models
- 13.4.5 Leading Vendors and Distribution Channels
- 13.4.6 Forecast and Commercial Opportunities
- 13.5 Emerging Applications and Cross-Segment Demand
- 13.6 End-Use Industry Investment Priorities
Chapter 14 Asia Pacific Cold Chain Automation Geographic Market Outlook, 2025-2035
- 14.1 Regional Market Size and Country-Level Shares, 2025
- 14.2 Country Market Size Comparison, 2025
- 14.3 Country Market Forecasts, 2025-2035
- 14.4 Subregional Industrial and Demand Clusters
- 14.5 Intra-Regional Pricing and Cost Differences
- 14.6 Cross-Border Trade and Supply Networks
- 14.7 Regional Supply and Demand Balances
- 14.8 Country Opportunity Comparison and Prioritization
Note: Every listed country is covered on the structure shown under the first country.
Chapter 15 Asia Pacific Cold Chain Automation Technology, Innovation and Sustainability Outlook
- 15.1 Technology Landscape and Maturity
- 15.2 Product, Process and Service Innovation
- 15.3 AI, Automation and Digital Tools in the Industry
- 15.4 Technology Adoption and Performance Benchmarking
- 15.5 Innovation Pipeline and R&D Investment
- 15.6 Patent and Intellectual Property Trends
- 15.7 Energy Efficiency and Resource Management
- 15.8 Sustainability, Recycling and Circularity
- 15.9 Technology Roadmap, 2025-2035
- 15.10 Risks of Obsolescence and Technology Substitution
Chapter 16 Asia Pacific Cold Chain Automation Market Key Strategic Imperatives
- 16.1 Growth and Market Entry Priorities
- 16.2 High-Return Products and Segments
- 16.3 Pricing, Profitability and Cost Optimization
- 16.4 Technology Investment and Product Differentiation
- 16.5 Supply Chain Localization and Resilience
- 16.6 Distribution and Customer Acquisition
- 16.7 Partnership, Acquisition and Capacity Strategy
- 16.8 Regional Expansion Priorities
- 16.9 Short-, Medium- and Long-Term Actions
Chapter 17 Competition Outlook
- 17.1 Industry Competition Characteristics
- 17.2 Market Structure and Concentration
- 17.3 Market Share and Competitive Positioning, 2025
- 17.4 Company-Wise Revenue and Product Benchmarking
- 17.5 Production and Service Capacity Benchmarking
- 17.6 Technology, Pricing and Differentiation
- 17.7 Regional Footprint and Distribution Strength
- 17.8 Mergers, Acquisitions and Strategic Alliances
- 17.9 New Entrants and Competitive Threats
- 17.10 Porter's Five Forces and Industry Attractiveness
- 17.11 Competitive Outlook, 2025-2035
Chapter 18 Company Profiles
- 18.1 Company Coverage and Selection Criteria
- 18.2 Daifuku Co., Ltd.
- 18.2.1 Business Description
- 18.2.2 Company Ownership and Geographic Presence
- 18.2.3 Product and Service Portfolio
- 18.2.4 Manufacturing and Operating Footprint
- 18.2.5 Production Capacity and Expansion Plans
- 18.2.6 Financial Performance and Investment
- 18.2.7 Market Share and Competitive Position
- 18.2.8 Technology and Innovation Capabilities
- 18.2.9 Strategic Alliances or Partnerships
- 18.2.10 Recent Developments
- 18.2.11 Growth Strategy and Outlook
- 18.3 Murata Machinery, Ltd.
- 18.4 Dematic
- 18.5 SSI SCHAEFER
- 18.6 Swisslog
- 18.7 Geekplus
- 18.8 AutoStore
- 18.9 Hai Robotics
- 18.10 Kardex
- 18.11 Addverb
- 18.12 Other Relevant Market Participants
Note: Every listed company is profiled on the structure shown under the first company. The company list is preliminary and may change based on research findings, market developments, data availability and client requirements.
Chapter 19 Disclaimer
- 19.1 Research and Forecast Disclaimer
- 19.2 Data Source and Estimation Limitations
Note: The depth of individual sections depends on data availability for this market. Volume, capacity, trade and other unit-based metrics are included where applicable.

