
Public buyers and cloud access shape regional demand
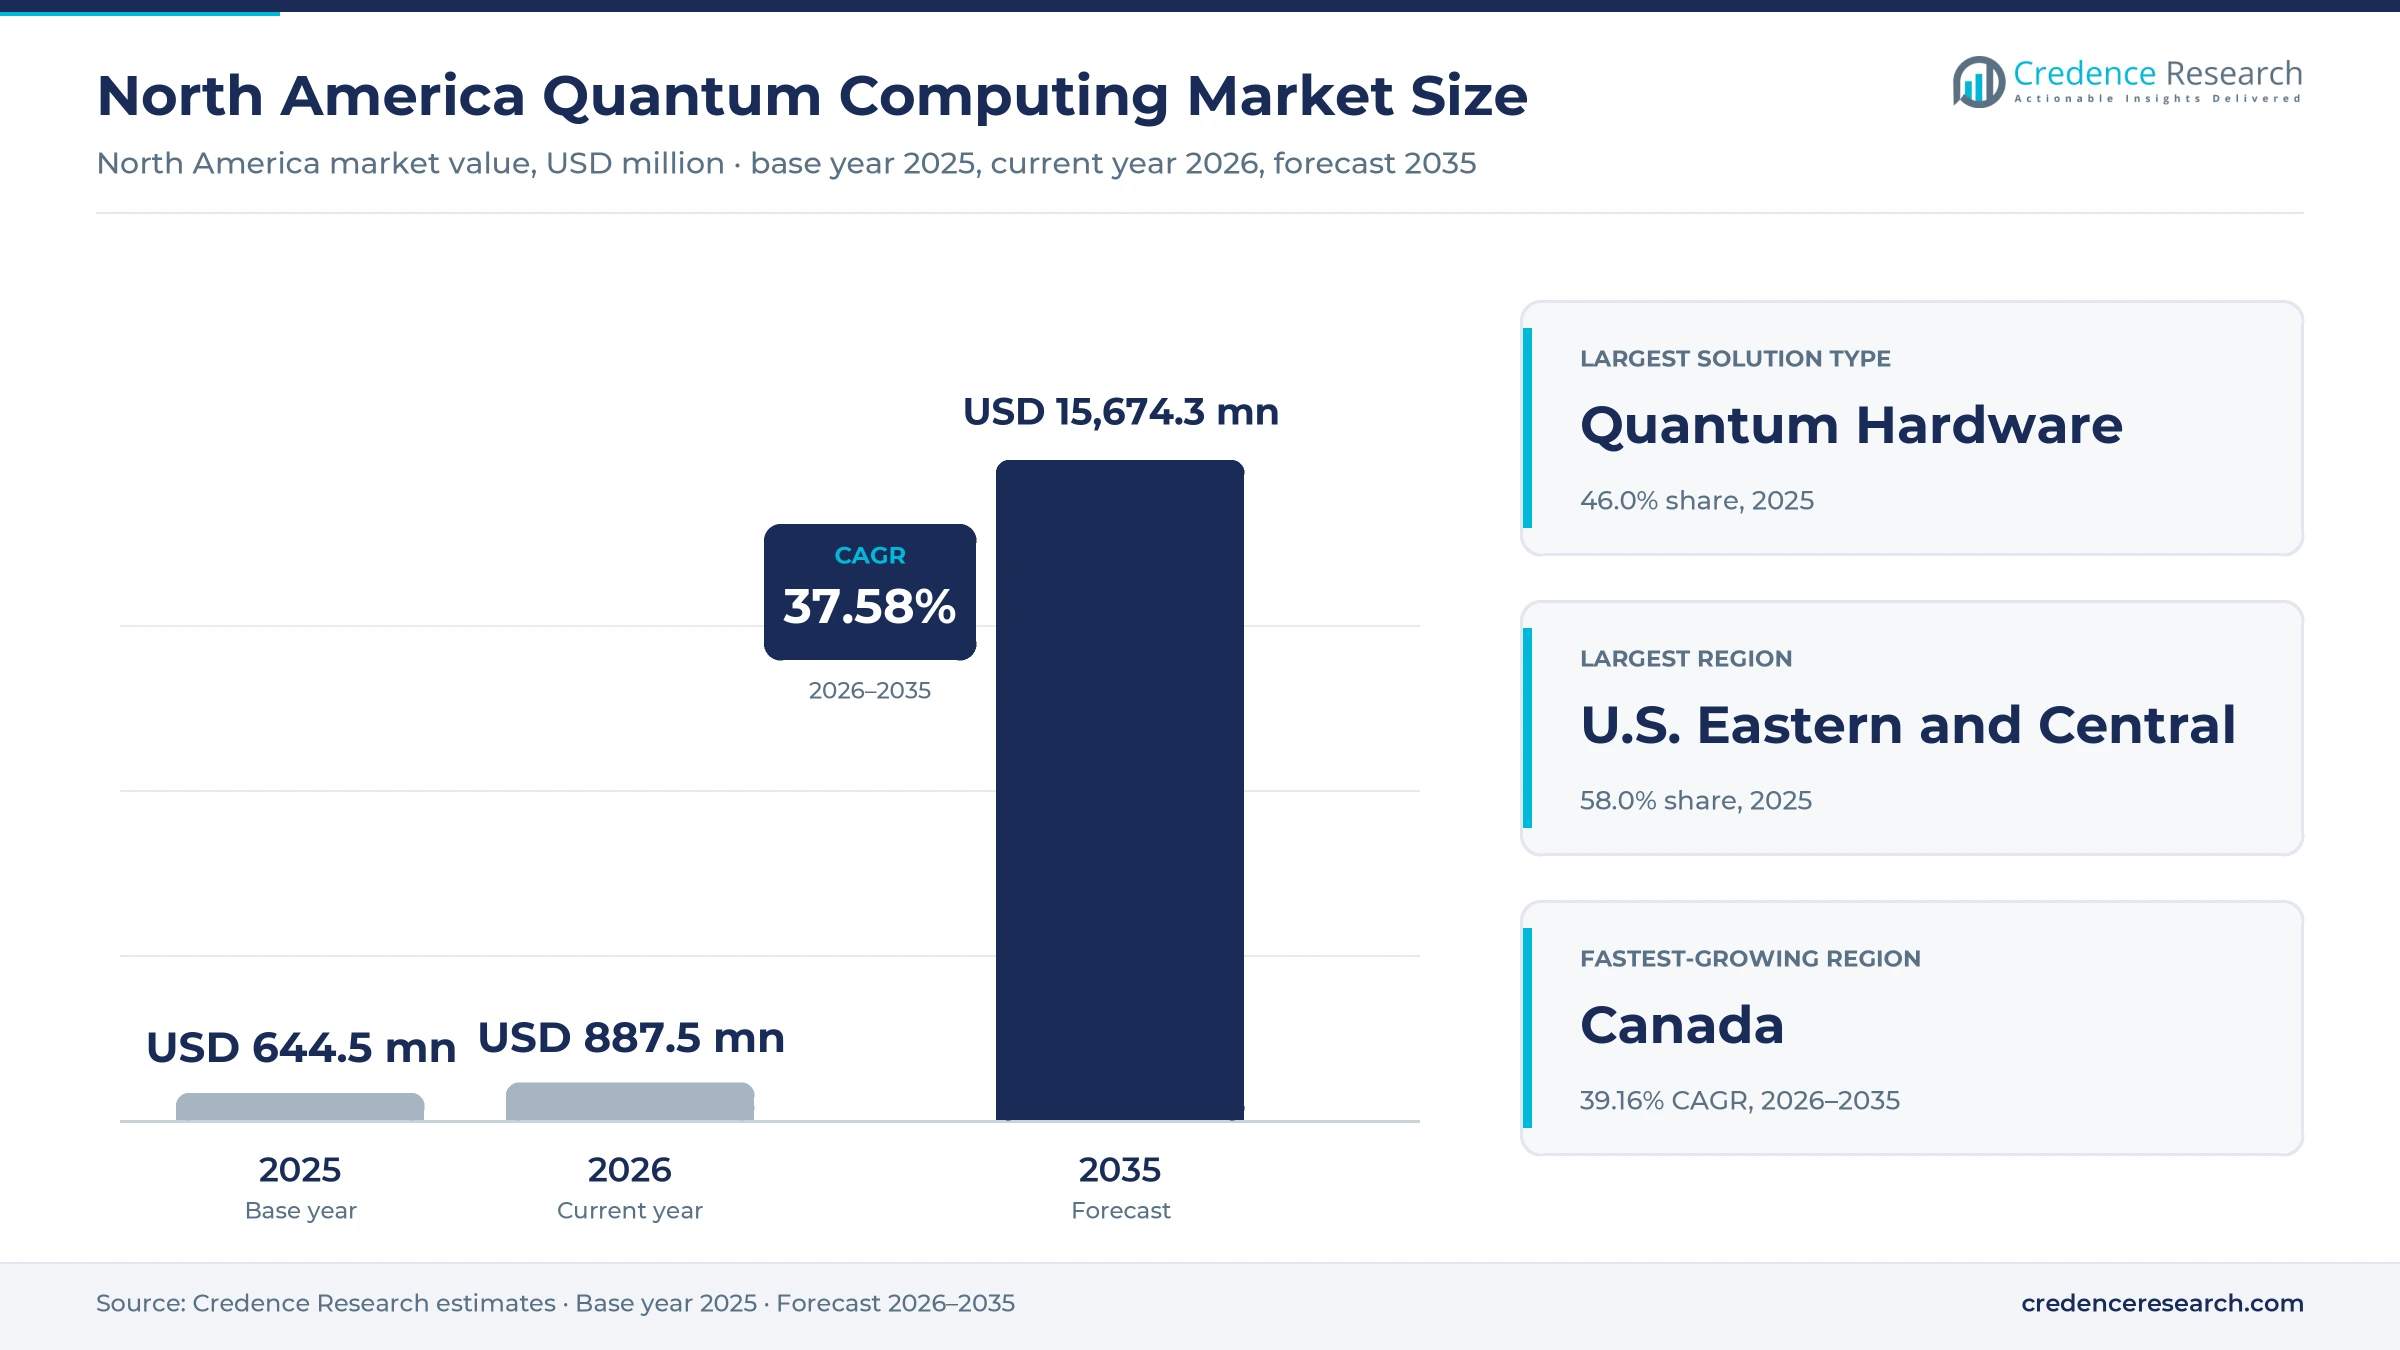
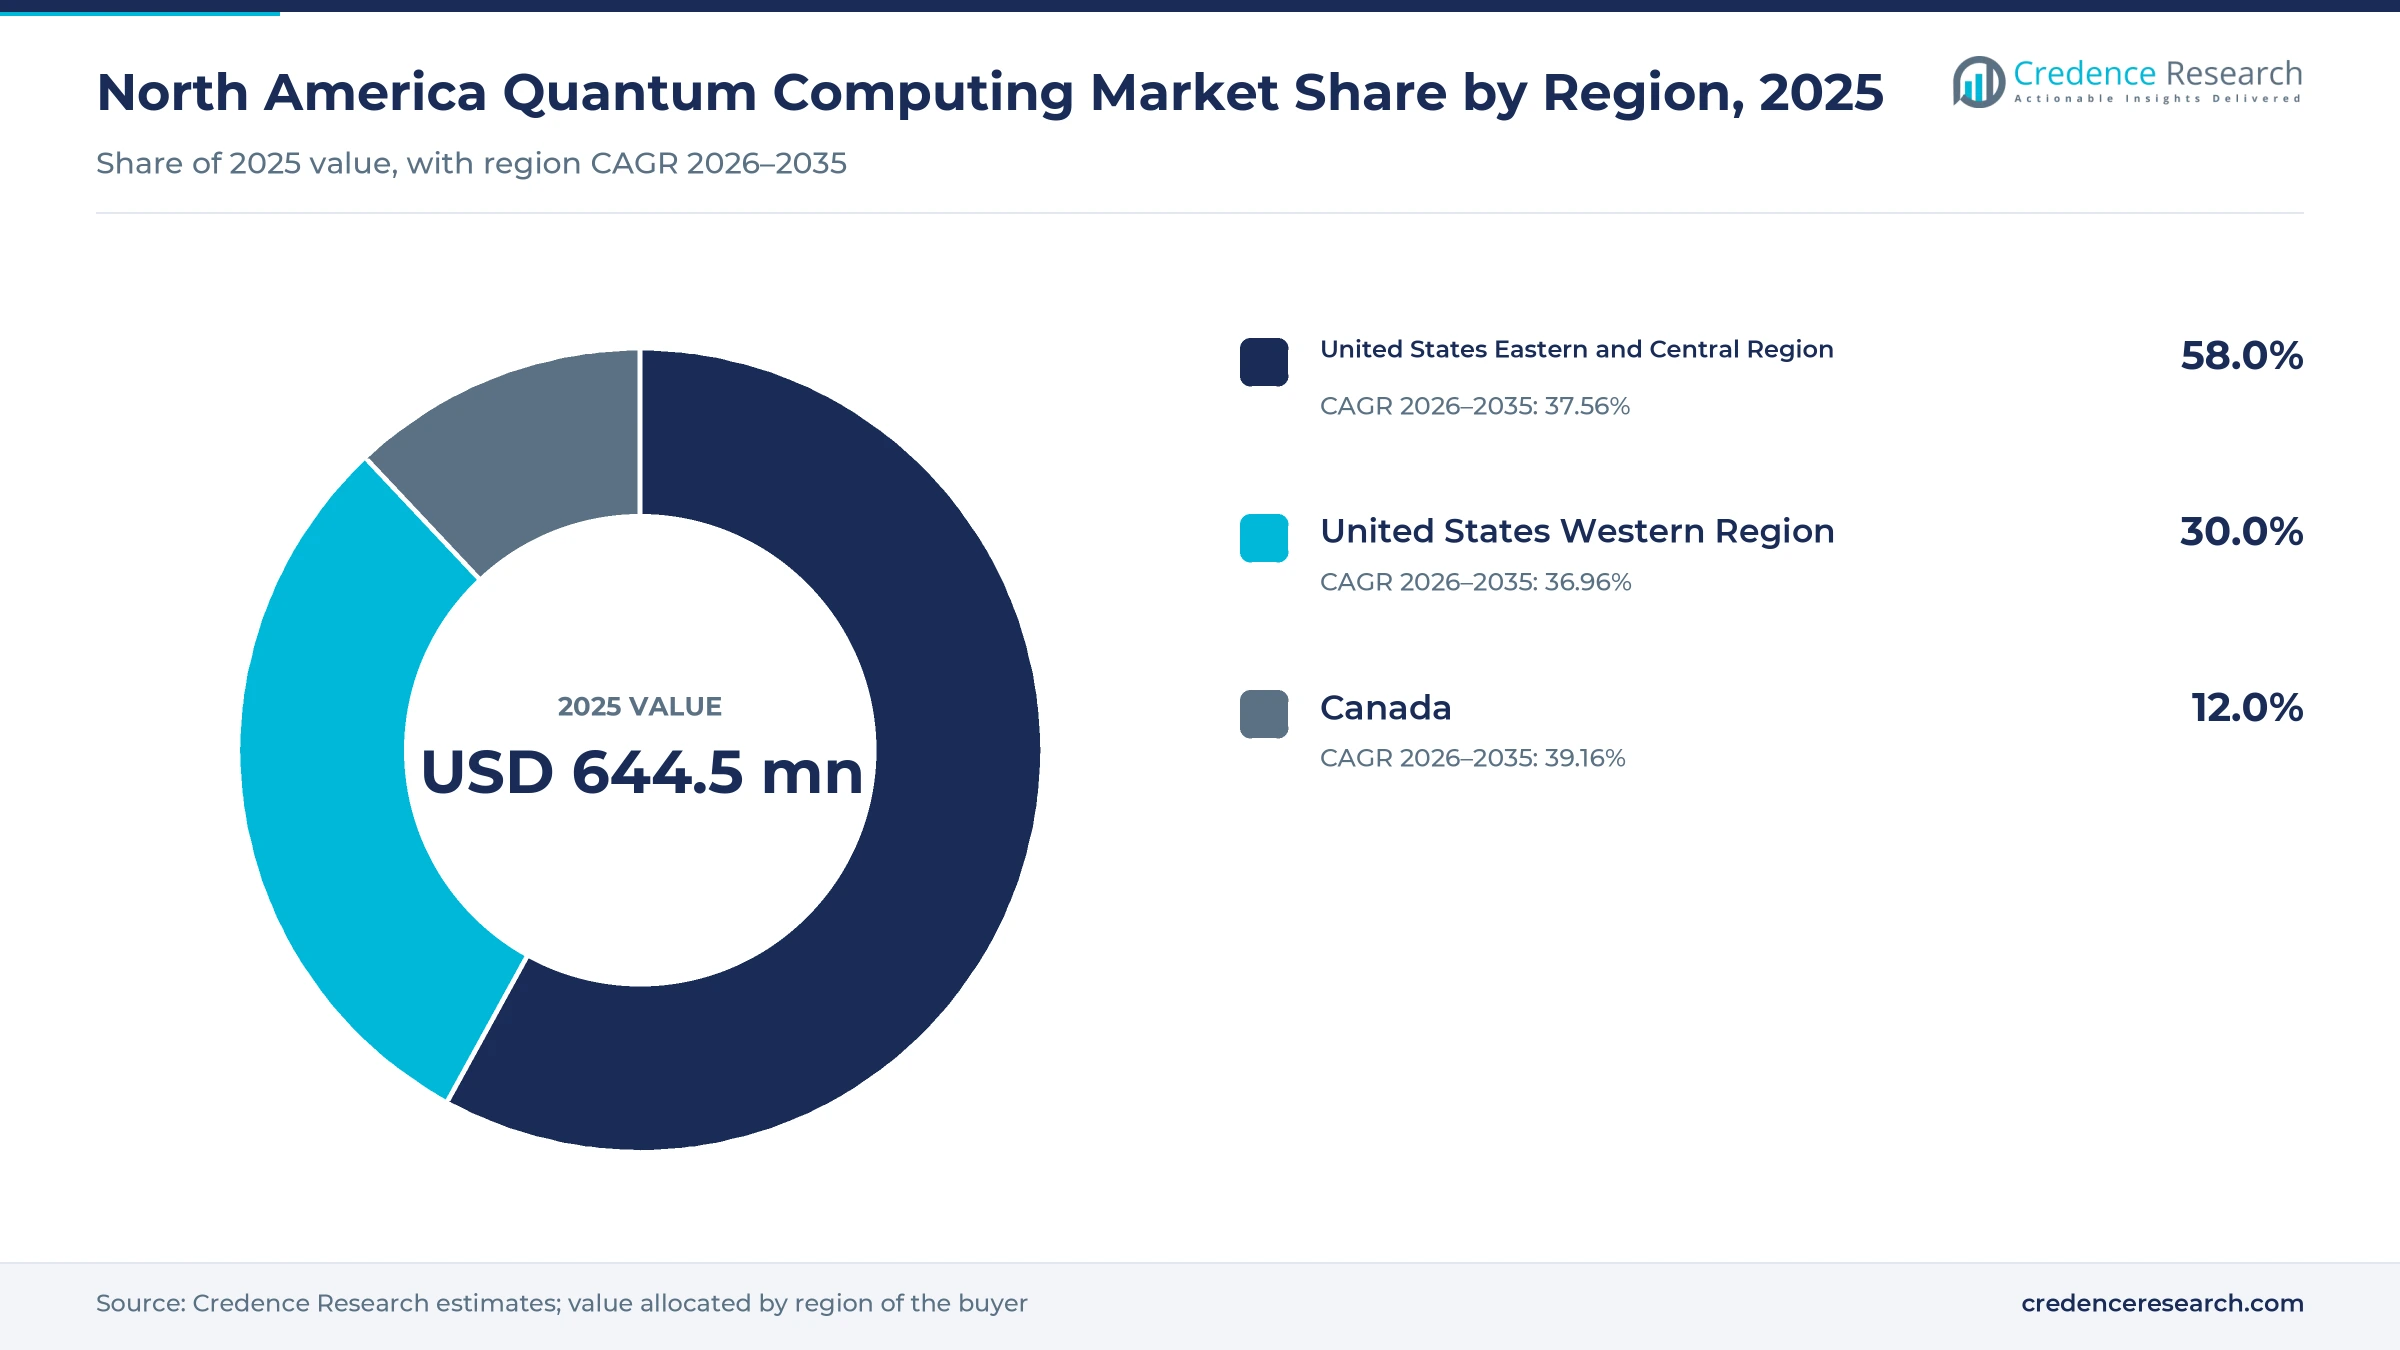
The North America quantum computing market was valued at USD 644.5 million in 2025 and is projected to increase from USD 887.5 million in 2026 to USD 15.67 billion by 2035, registering a CAGR of 37.58% during 2026–2035. Demand comes from federal research programs, national laboratories, universities and enterprises that rent processor time through cloud platforms before committing to systems. The United States Eastern and Central Region held the largest regional share, 58.0% in 2025, because it hosts four of the five Department of Energy quantum centers and IBM's New York operations. Canada is the fastest-growing region at 39.16% a year, helped by a federal program that targets domestic hardware developers. The largest commercial change came on May 21, 2026, when the U.S. Department of Commerce proposed incentives for nine companies in exchange for minority equity stakes. As a result, supply decisions increasingly follow public capital as much as private orders.
What does this North American market count and how do buyers purchase?
The report counts spending in the United States and Canada on quantum processors and complete systems, the software used to program them, and cloud access to those machines. Buyers purchase through on-premises system contracts, reservation blocks, multiyear service agreements and usage billing per task or per shot. Public laboratories and universities tend to buy systems, while enterprises usually begin with cloud access and small pilots.
The scope excludes quantum sensing, quantum networking and post-quantum security products, even when the same vendors sell them. Public research grants count only when they pay for computing systems, software or access. The value chain runs from wafers, cryogenic equipment and control electronics through processor builders to cloud platforms, software developers and application teams.
North America Quantum Computing Market Insights
- The market grows from USD 644.5 million in 2025 to USD 15.67 billion by 2035, a 37.58% CAGR during 2026–2035, as public programs and cloud access widen the buyer base.
- The United States Eastern and Central Region held 58.0% of 2025 value, supported by national laboratories in New York, Illinois and Tennessee and by IBM's New York base.
- Quantum Hardware led solution types with 46.0% of 2025 value, because laboratories and universities still buy physical systems for research and training.
- On May 21, 2026, the U.S. Department of Commerce proposed USD 2.013 billion for nine quantum companies, taking minority stakes and changing how capacity gets financed.
- Vendors now compete on verified performance, since DARPA moved 11 companies to Stage B of its benchmarking program and tests whether utility-scale operation is possible by 2033.
Hardware and government buyers still anchor spending
Why does hardware lead while cloud services grow faster?
Based on solution type, the market is categorized into Quantum Hardware, Quantum Software and Quantum Cloud Services. Quantum Hardware led with 46.0% of 2025 value because institutions still pay most for physical machines, as Florida Atlantic University's USD 20 million purchase of a D-Wave Advantage2 system for its Boca Raton campus shows, according to Data Center Dynamics. Quantum Cloud Services grows fastest at 38.77% a year as Amazon Braket lists six processors on demand at USD 0.30 per task, letting teams test several machines before committing capital. In turn, software spending follows that usage rather than leading it.
How do access routes split between cloud, on-site and hybrid use?
Based on deployment model, the market is categorized into On-Premises, Public Cloud and Hybrid. Public Cloud led with 44.0% of 2025 value because vendors distribute new machines widely through these platforms, and Rigetti Computing reported Cepheus-1-108Q general availability through Amazon Braket and Microsoft Azure Quantum in the first quarter of 2026. These platforms run on hyperscale data centers that enterprises already use. Hybrid grows fastest at 39.40% a year as IBM added a C++ interface in November 2025 that lets developers program quantum hardware inside existing classical environments, according to The Next Platform.
Which buyers fund the most work and which are moving fastest?
Based on end-use industry, the market is categorized into Banking, Financial Services and Insurance; Government, Defense and Research; Healthcare and Pharmaceuticals; and Energy, Manufacturing and Technology. Government, Defense and Research led with 49.0% of 2025 value because federal programs dominate funded work, with requested federal quantum research budgets of USD 998 million for fiscal 2025, according to the National Quantum Initiative annual report. Healthcare and Pharmaceuticals grows fastest at 39.11% a year as Cleveland Clinic and IBM ran a Trp-cage protein simulation on Heron hardware with classical computing, which Quantum Computing Report described in March 2026.
Where do applications produce measurable results today?
Based on application, the market is categorized into Optimization, Simulation, Quantum Machine Learning and Algorithm Research and Benchmarking. Optimization led with 38.0% of 2025 value because scheduling work already delivers measurable savings, as D-Wave reports that Pattison Food Group cut one weekly task from 25 hours to two minutes. Quantum Machine Learning grows fastest at 39.44% a year from a small base as Quantinuum launched Helios in November 2025 for generative quantum AI work, and IBM plans machine learning libraries by 2027. Simulation also draws pharmaceutical users, since Amgen joined Helios as a launch customer.
| Segment Group | Leading Sub-segment | Share, 2025 | Fastest-growing Sub-segment | CAGR, 2026–2035 |
|---|---|---|---|---|
| By Solution Type | Quantum Hardware | 46.0% | Quantum Cloud Services | 38.77% |
| By Deployment Model | Public Cloud | 44.0% | Hybrid | 39.40% |
| By End-Use Industry | Government, Defense and Research | 49.0% | Healthcare and Pharmaceuticals | 39.11% |
| By Application | Optimization | 38.0% | Quantum Machine Learning | 39.44% |
Request a Free Sample
Fill in your details and we'll send you a free sample report.
- Sample data tables & charts
- Research methodology
Federal money and error correction lift commercial demand
Public procurement and research infrastructure
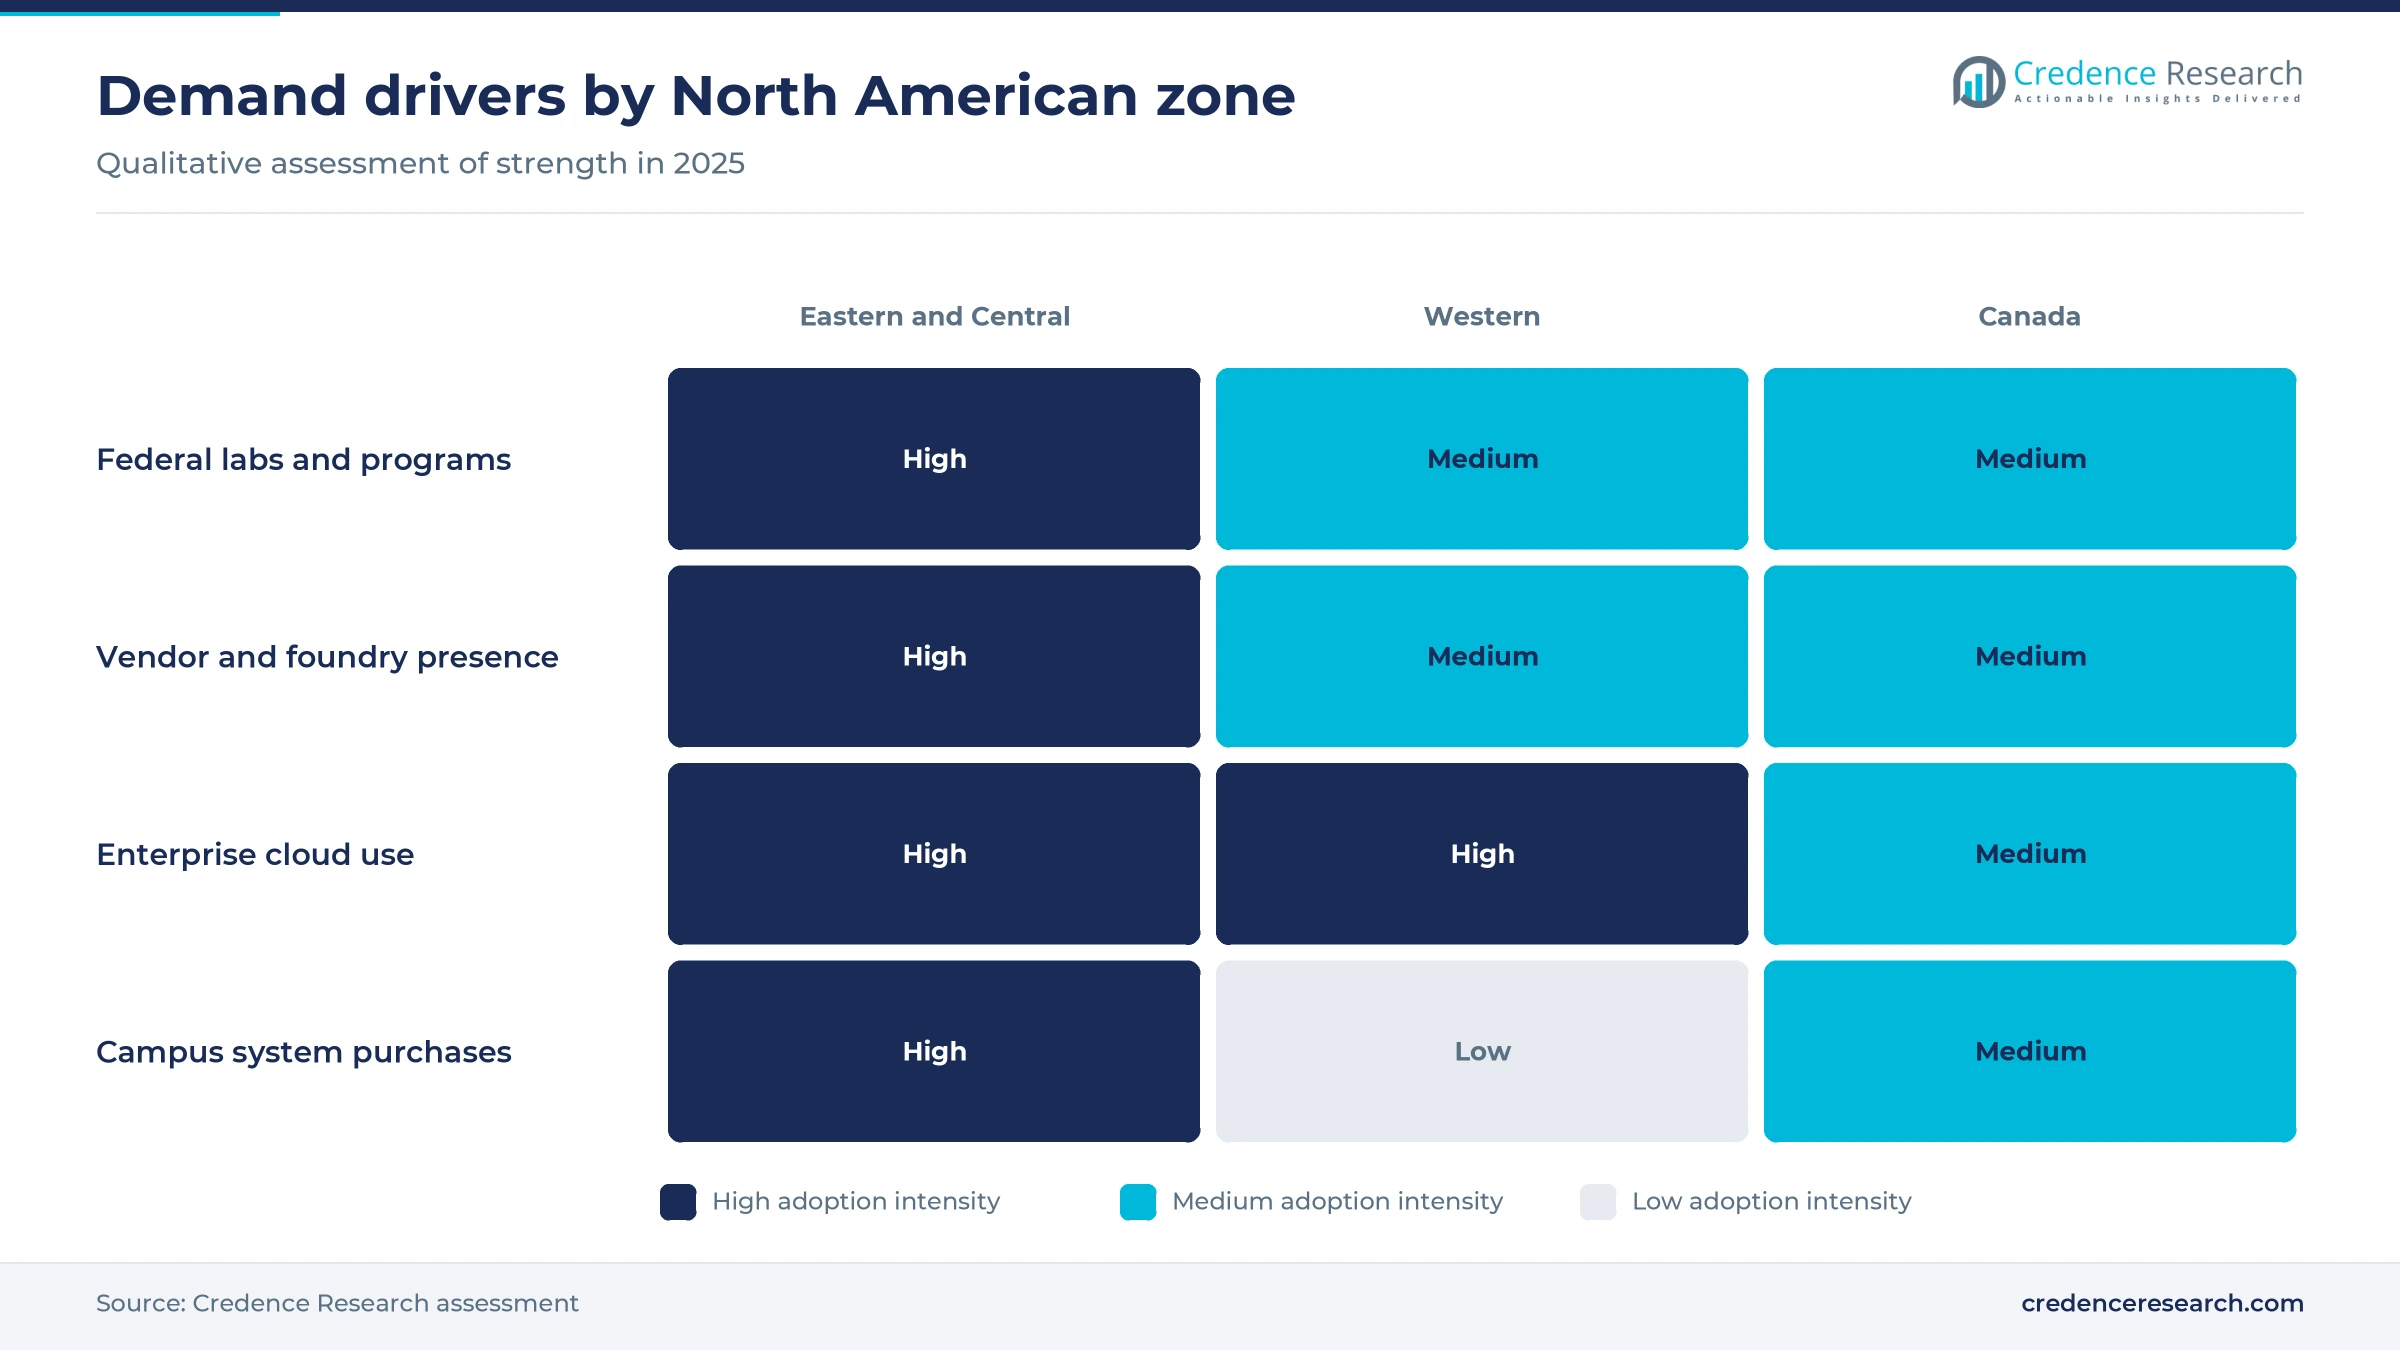
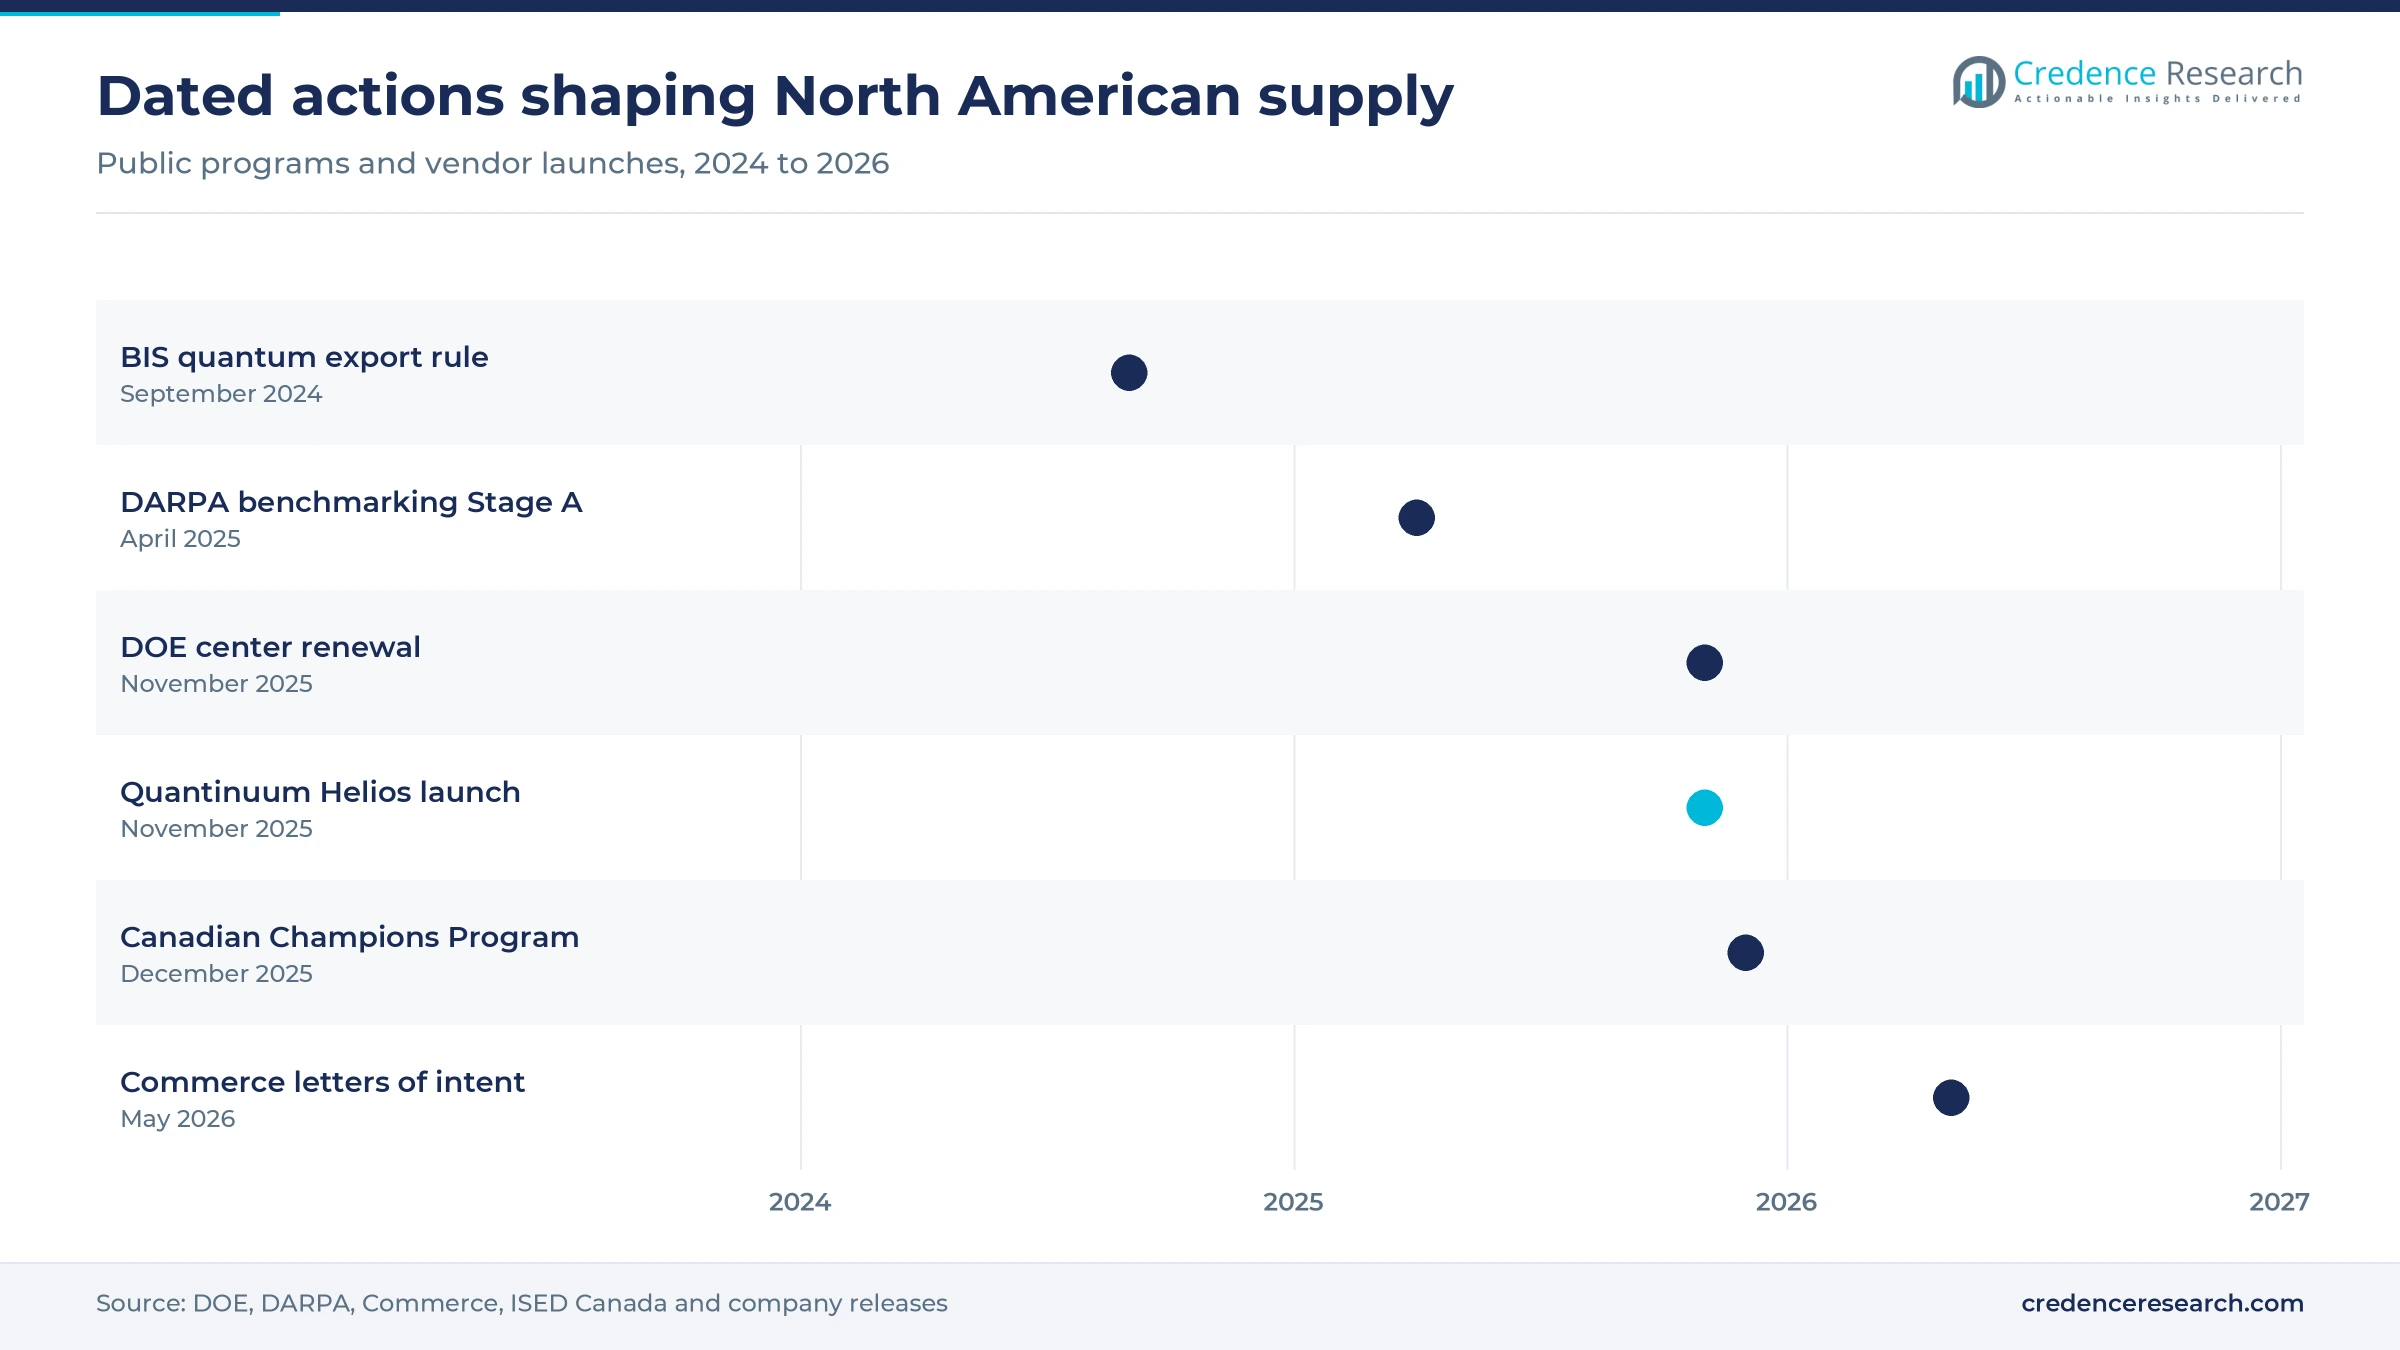
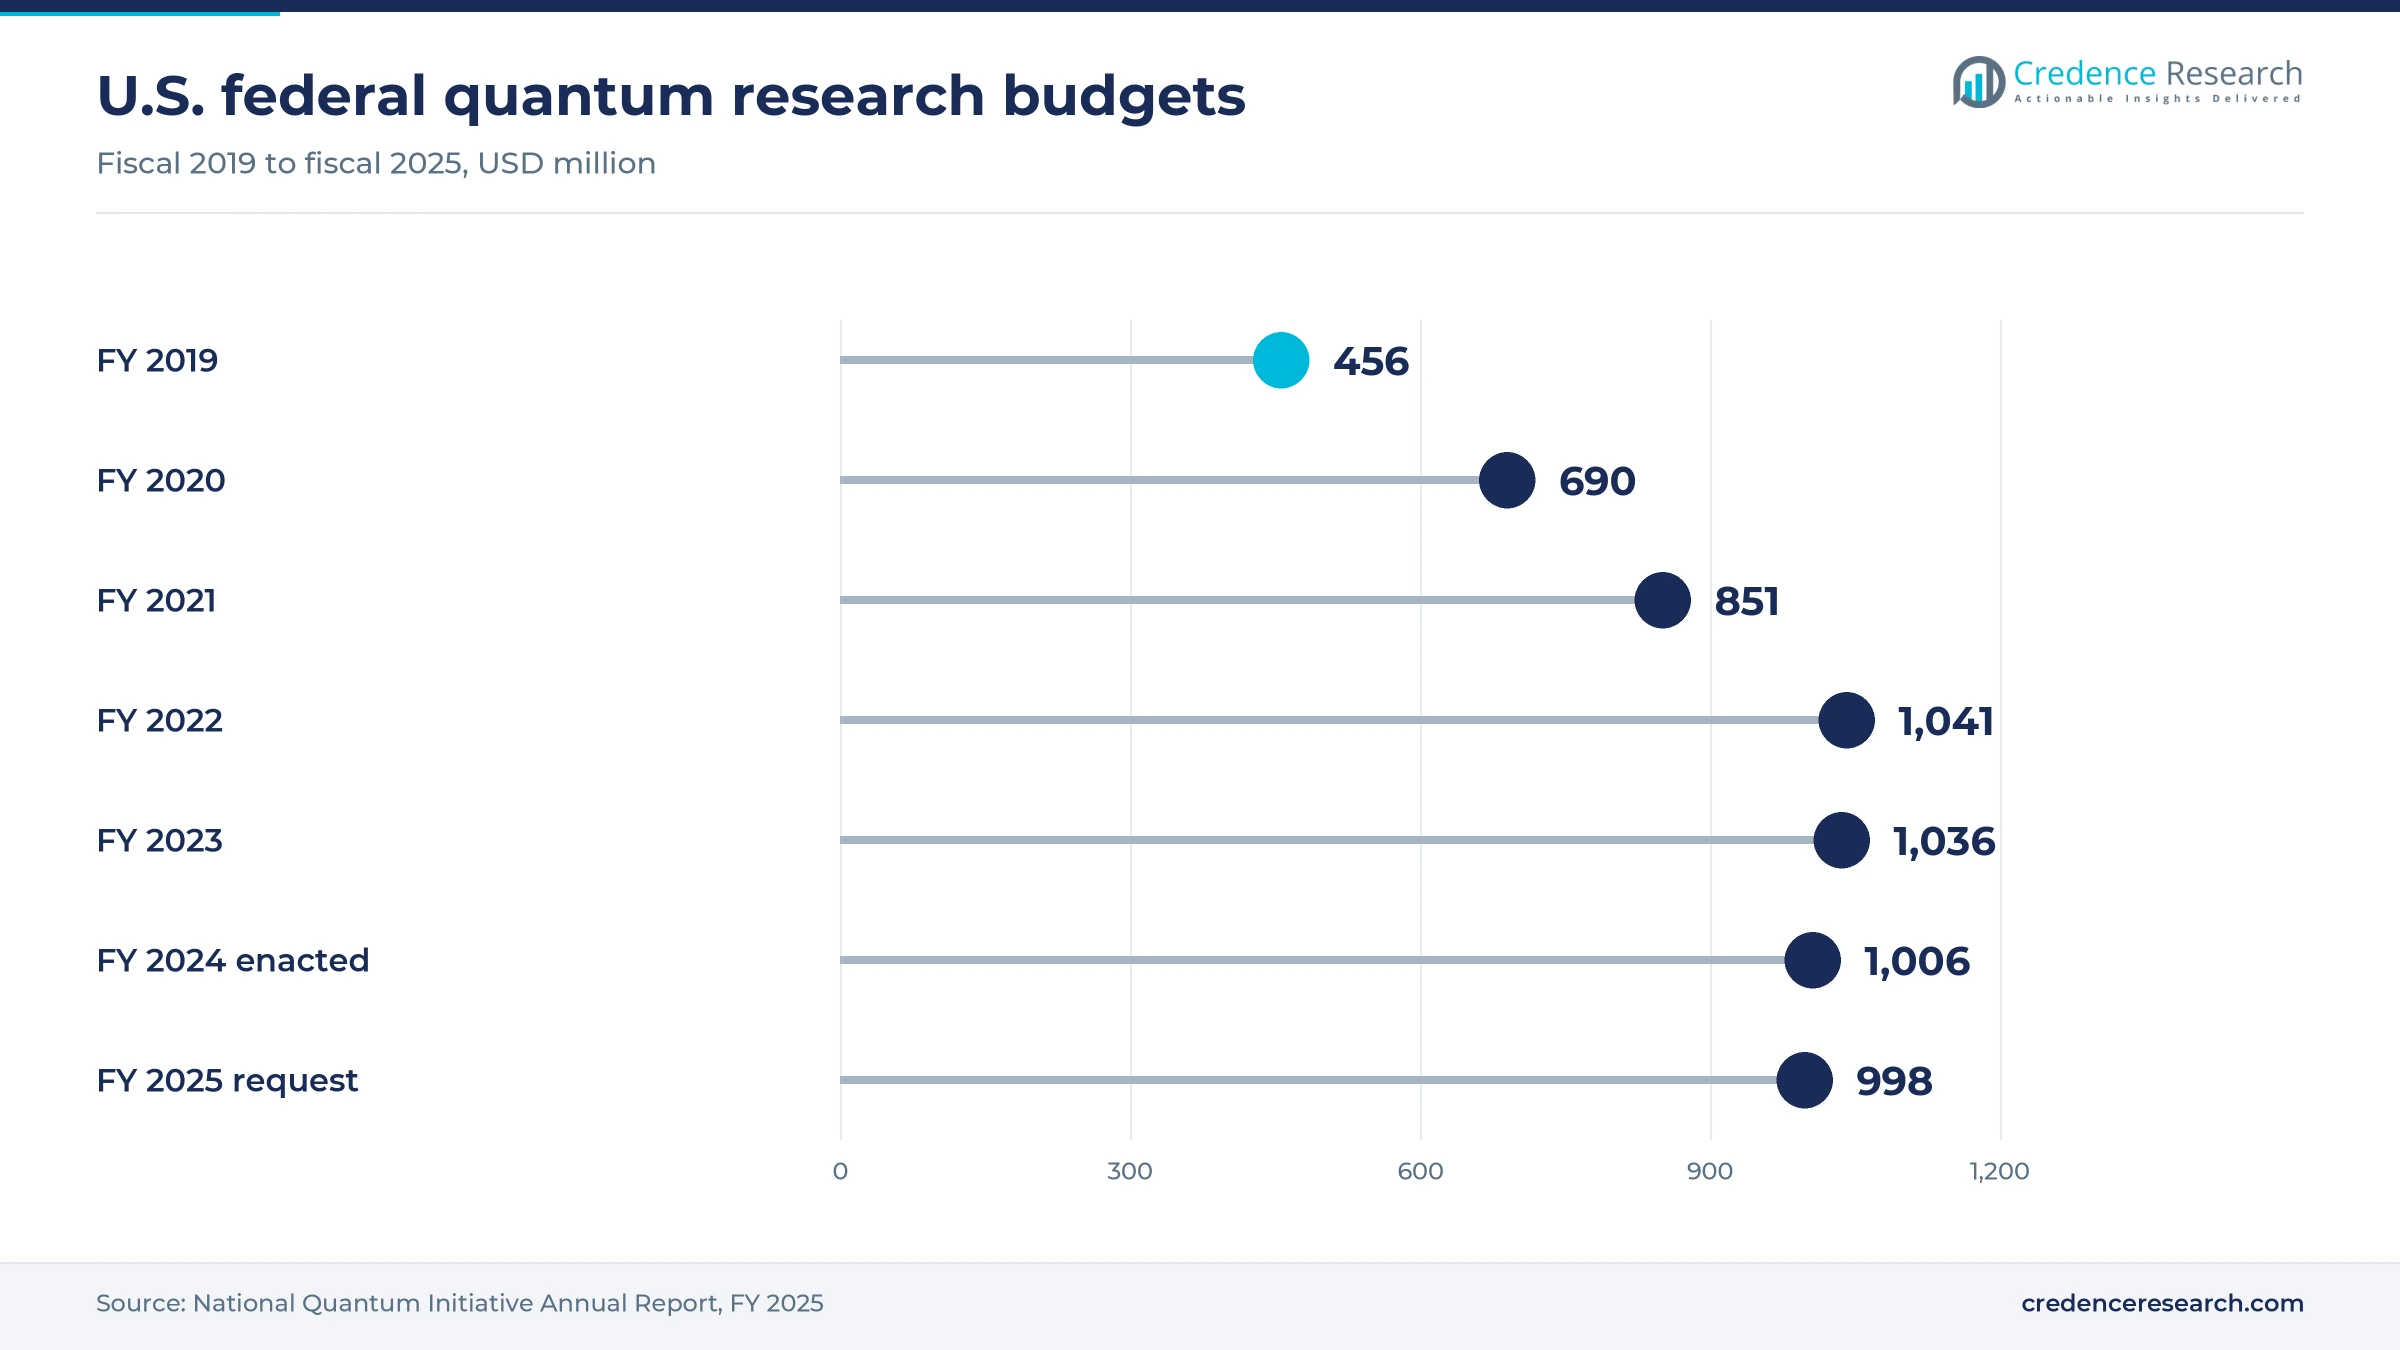
Public buyers provide the most dependable demand, because laboratories and defense programs can fund machines years before commercial payback appears. On Nov. 4, 2025, the Department of Energy renewed its five National Quantum Information Science Research Centers with USD 625 million for up to five years, with USD 125 million in fiscal 2025 money and the rest subject to appropriations. Federal quantum research budgets, according to the National Quantum Initiative annual report, rose from USD 456 million in fiscal 2019 to USD 1,036 million in fiscal 2023. Illinois has separately committed USD 500 million to its Quantum and Microelectronics Park, according to a February 2025 release from Senator Dick Durbin. As a result, Government, Defense and Research accounted for 49.0% of 2025 value, and vendors plan capacity around these budgets.
Accessible quantum cloud workflows
Cloud access lowers the entry cost, so teams can experiment on several machines without buying cryogenic equipment or hiring a hardware staff. Amazon Braket publishes usage prices as low as USD 0.000425 per shot on Rigetti Cepheus and USD 0.08 per shot on IonQ Forte, with reservations at USD 4,100 and USD 7,000 per hour. Rigetti's May 2026 results list Cepheus-1-108Q on four access routes, including Amazon Braket, Microsoft Azure Quantum and qBraid. D-Wave also signed a USD 10 million, two-year service agreement with a Fortune 100 company in January 2026. This access model explains why Quantum Cloud Services grows at 38.77% a year, the highest rate among solution types during the period.
Improving error correction and processor engineering
Better error rates raise the circuit depth buyers can actually use, which turns research purchases into repeat workloads. Google Quantum AI reported on Dec. 9, 2024, that its Willow processor operated below the error correction threshold, a goal pursued since the 1990s. Quantinuum launched the 98-qubit Helios on Nov. 5, 2025, with 99.921% two-qubit gate fidelity and 48 error-corrected logical qubits, according to the company. IBM announced Nighthawk in November 2025 with 120 qubits and 218 tunable couplers, and it plans the fault-tolerant Starling system at Poughkeepsie, New York, for availability around 2029. IonQ separately reported reaching 99.99% two-qubit gate fidelity during 2025. Because these gains are public and comparable, procurement teams can now write performance terms into contracts.
Private capital and listed vendors fund larger roadmaps
Private capital extends vendor roadmaps beyond what grants alone would support, and this keeps sales teams and new system programs funded. The Quantum Economic Development Consortium counted USD 4.9 billion in new venture investment worldwide in 2025, up 192% from 2024. Xanadu raised about USD 302 million when it listed on Nasdaq and the Toronto Stock Exchange on March 27, 2026, according to The Quantum Insider. IonQ also announced its planned purchase of chip maker SkyWater Technology on Jan. 26, 2026, which would bring fabrication closer to its systems. In turn, North American vendors can offer longer delivery commitments, and that supports the 37.58% growth rate expected during 2026–2035 across hardware and access contracts.
Equity stakes, HPC links and campus systems reshape buying
Shift toward federal equity stakes in quantum suppliers
Federal support is shifting from research grants toward direct ownership positions in suppliers, which ties public capital to domestic production. On May 21, 2026, the Department of Commerce issued letters of intent worth USD 2.013 billion under the CHIPS and Science Act. The plan gives IBM USD 1 billion for a foundry subsidiary, GlobalFoundries USD 375 million, and D-Wave, Quantinuum, PsiQuantum, Infleqtion and Atom Computing USD 100 million each. Rigetti could receive up to USD 100 million and Diraq up to USD 38 million. Each award carries a minority, non-controlling government stake and funding remains planned rather than final. Consequently, vendors in the program gain credibility with public buyers, while companies outside it must rely more heavily on venture money and customer contracts during the same period.
Rise of quantum work linked to classical supercomputers
Serious workloads increasingly run across quantum and classical machines together, because error rates still limit what a processor can do alone. JPMorganChase, Quantinuum, Argonne and Oak Ridge reported in Nature on March 26, 2025, that a 56-qubit H2 system and four supercomputers certified 71,313 bits of entropy. Cleveland Clinic and IBM paired Heron hardware with high-performance clusters for protein simulation, according to Quantum Computing Report in March 2026. Quantinuum also built its Guppy language to combine quantum and classical code in one program. This pattern supports Hybrid, which grows at 39.40% a year, and it favors vendors that integrate easily with existing scheduling software.
Opening for domestic foundry and component suppliers
Domestic manufacturing offers a clear opening, because the federal plan funds parts of the supply chain that processor builders previously sourced or built in small batches. IBM's proposed USD 1 billion foundry would focus on superconducting wafers, and GlobalFoundries would serve several qubit types with its USD 375 million. Commerce also earmarked Rigetti money for readout electronics and next-generation cryostats. War on the Rocks reported in October 2025 that Bluefors manufactures dilution refrigerators in Syracuse, New York and that Asian plants dominate advanced control chips. Therefore, suppliers of cryostats, photonics and control electronics can win orders from several builders, even if no single qubit approach becomes the eventual winner.
Opportunity in campus systems and regional hubs
Universities and state hubs present a second opportunity, because they combine research budgets with local workforce goals and can justify on-site machines. Florida Atlantic University agreed to install a USD 20 million D-Wave Advantage2 in Boca Raton, and Florida and the city are adding job and training incentives. Rigetti shipped a 9-qubit Novera processor to the University of Saskatchewan for the school's first quantum system. Senator Dick Durbin said in February 2025 that IBM plans a commercial machine at the Illinois park anchored by PsiQuantum, a site backed by USD 500 million in state money. Smaller systems can therefore reach buyers who cannot fund large installations. As a result, vendors with modest entry configurations and training programs can open territories outside coastal technology centers.
Talent, cryogenics and unproven utility slow purchases
Why is skilled labor a limit on deployment?
Skilled labor limits how quickly buyers can use new systems, as James Kushmerick of NIST told a House committee in January 2026 that the country is "in a workforce shortage." Saul Gonzalez of NSF said supported programs have nearly doubled students and faculty since 2018, yet supply still trails industry demand. Enterprises without specialists therefore stay in pilot projects for longer periods. Vendors and universities are responding with training academies, such as the planned D-Wave program at Florida Atlantic University.
How exposed is the cryogenic and materials supply base?
Materials supply creates cost and timing risk for superconducting builders, because helium-3 trades "without transparent pricing" or reliable long-term contracts, according to War on the Rocks in October 2025. The same analysis estimates that China controls 60% to 70% of high-quality lithium niobate boules used in photonic work. Builders and system buyers therefore face uncertain delivery schedules for critical components. Domestic production backed by federal awards should reduce the exposure gradually, though new capacity will take years to arrive.
Can buyers justify spending before utility is proven?
Return on investment remains hard to show, because DARPA's Quantum Benchmarking Initiative only aims to verify by 2033 whether any approach reaches utility-scale operation. Meanwhile, Amazon Braket lists reserved IonQ Forte time at USD 7,000 per hour, a meaningful bill for an experimental workload. Corporate finance teams consequently limit many projects to small budgets and short terms. Vendors are responding by publishing benchmark results and customer case data, which helps buyers compare options, though it does not settle the wider question.
How do export rules and lapsed legislation affect planning?
Policy gaps complicate long-range planning, since the Bureau of Industry and Security issued quantum export controls on Sept. 6, 2024, requiring licenses for certain systems and components, according to the American Institute of Physics. The National Quantum Initiative authorization also expired in September 2023, according to The Quantum Insider, and lawmakers were still discussing renewal in January 2026. Vendors selling across borders therefore add compliance work, while laboratories face uncertainty over multiyear budgets until Congress completes a reauthorization bill.
Eastern and Central states lead on labs and foundries
| Region | Value, 2025 (USD million) | Share, 2025 | CAGR, 2026–2035 |
|---|---|---|---|
| United States Eastern and Central Region | 373.8 | 58.0% | 37.56% |
| United States Western Region | 193.3 | 30.0% | 36.96% |
| Canada | 77.3 | 12.0% | 39.16% |
United States Eastern and Central Region leads on labs and foundries
The United States Eastern and Central Region held 58.0% of 2025 value and grows at 37.56% a year. Four of the five Department of Energy centers sit here, at Brookhaven, Fermilab, Argonne and Oak Ridge. IBM builds in New York, with wafers from Albany and Starling planned for Poughkeepsie, while Illinois is developing its Quantum and Microelectronics Park in Chicago. Florida Atlantic University adds a campus system, and D-Wave plans to move its headquarters to Boca Raton by the end of 2026.
United States Western Region relies on cloud and trapped-ion activity
The United States Western Region held 30.0% of 2025 value and grows at 36.96% a year. Lawrence Berkeley National Laboratory hosts the Quantum Systems Accelerator, one of the centers renewed in November 2025. Quantinuum is headquartered in Broomfield, Colorado and Maybell Quantum builds cryogenic equipment in the same state, according to War on the Rocks. Pier 300 at the Port of Los Angeles also shows commercial use, since D-Wave reports that cargo handling equipment productivity doubled there with partner SavantX.
Canada grows fastest from a smaller base
Canada held 12.0% of 2025 value and grows at 39.16% a year, the fastest rate among the three zones. The Canadian Quantum Champions Program opened on Dec. 15, 2025, with up to C$92 million and up to C$23 million each for Anyon Systems, Nord Quantique, Photonic and Xanadu. That sits within a C$334.3 million, five-year commitment from Budget 2025. Xanadu is also negotiating up to C$390 million from federal and Ontario governments, while the University of Saskatchewan has bought a Novera system.
Dated federal awards and launches from 2025 to 2026
| Development | Status and market relevance |
|---|---|
| In November 2025, the Department of Energy renewed its five national quantum research centers with USD 625 million over up to five years. | Announced; later years depend on appropriations. |
| In November 2025, Quantinuum launched the 98-qubit Helios system with Amgen, BMW Group, JPMorganChase and SoftBank Corp. as launch customers. | Commercial; offered through cloud and on-premises routes. |
| In December 2025, Canada opened the first phase of its Canadian Quantum Champions Program with up to C$92 million for four companies. | Phase 1 underway for domestic hardware developers. |
| In January 2026, D-Wave announced a USD 10 million, two-year service agreement with an unnamed Fortune 100 company. | Signed; covers annealing and gate-model access, software and services. |
| In May 2026, the Department of Commerce proposed USD 2.013 billion in incentives for nine quantum companies through letters of intent. | Proposed; minority equity stakes are a funding condition. |
Qubit fidelity and classical integration decide adoption
- Superconducting processors remain IBM's and Rigetti's route, with IBM Nighthawk using 218 tunable couplers and Rigetti's 9-qubit system posting 99.8% median two-qubit fidelity at 40-nanosecond gate speeds.
- Trapped-ion systems favor accuracy and connectivity, as Quantinuum Helios reports 99.921% two-qubit fidelity and IonQ reports reaching 99.99% in 2025.
- Quantum annealing targets optimization directly, and D-Wave sells Advantage2 both as an installed machine and through service contracts for scheduling and logistics problems.
- Modular chiplets help builders scale without single large dies, and Rigetti's Cepheus-1-108Q combines twelve interconnected 9-qubit chiplets, according to the company's May 2026 results.
- Security planning adds a related budget, since cryptography migration at federal agencies could cost about USD 7.1 billion in 2024 dollars from 2025 to 2035, according to a White House estimate.
Need a Custom Version of This Report?
Tailor the scope, geography, or segments to your exact requirements.
- Custom geography or segment scope
- Direct access to our analyst team
Five vendors compete on modality, access and federal roles
Competition turns on qubit approach, access route and standing with federal buyers rather than on a single price list. IBM combines superconducting processors, the Qiskit software stack and a planned foundry subsidiary, so it can sell across the chain. Quantinuum and IonQ both compete with trapped-ion accuracy, while Quantinuum stresses logical qubits and IonQ pairs computing with networking and defense work. D-Wave differs by selling annealing systems for optimization and adding gate-model access, whereas Rigetti pushes modular superconducting systems and low per-shot cloud prices. DARPA's November 2025 Stage B list includes IBM, IonQ and Quantinuum, along with Canadian builders Nord Quantique, Photonic and Xanadu. Rigetti and D-Wave do not appear on that list, although both hold proposed Commerce awards. Hyperscale cloud platforms act as both channel and potential rivals, because they control how many enterprise users first reach these machines.
Companies profiled and their roles in this market
| Company | Type | Role in the market |
|---|---|---|
| IBM | Superconducting systems and software | Sells access and systems, plans Starling at Poughkeepsie and a proposed foundry subsidiary with USD 1 billion in Commerce funding. |
| IonQ | Trapped-ion systems | Offers Forte on Amazon Braket, reports 99.99% two-qubit fidelity in 2025 and announced a planned SkyWater Technology purchase. |
| Quantinuum | Trapped-ion systems | The Broomfield, Colorado, company launched Helios with JPMorganChase and Amgen among launch customers. |
| D-Wave Quantum | Annealing and gate-model systems | Sold an Advantage2 to Florida Atlantic University and signed a two-year enterprise service agreement. |
| Rigetti Computing | Superconducting modular systems | Offers Cepheus-1-108Q on major clouds and shipped a Novera processor to the University of Saskatchewan. |
Procurement carries demand until utility is verified
Credence Research's view is that public procurement will carry North America quantum computing demand until independent testing shows clear utility. The DARPA program and the Commerce awards matter more for near-term revenue than any single customer win, because they signal which suppliers public buyers will trust. Enterprises should treat cloud access as the low-risk entry route, then move to reserved time when a workload justifies it. The most assumption-heavy estimate is the regional split, since vendors rarely publish sales by zone. A verified advantage result in 2026 or 2027 would raise the enterprise share faster than this model assumes.
How the regional model and estimates were built
The report uses 2025 as the base year and forecasts values through 2035 from the Credence Research market model. Segment and regional splits are Credence Research estimates built from public evidence, including federal budget documents, agency releases, company securities filings, vendor price lists, trade publications and press releases. Regional shares weigh laboratory locations, vendor sites, announced orders and public program spending. No interviews or surveys were conducted for this edition, so the splits should be read as analytical estimates. Facts cited in the text were checked against the public pages named or linked beside them.
Fault-tolerant roadmaps define spending through 2035
Through 2035, North America quantum computing spending should move from research systems toward repeat production workloads as fault-tolerant machines arrive. IBM's Starling plan around 2029 and DARPA's 2033 utility target mark the main checkpoints for buyers. If those checkpoints hold, cloud services and hybrid deployment should gain share, and the market should reach USD 15.67 billion by 2035 from USD 887.5 million in 2026. Canada should strengthen its role through domestic hardware programs, while Eastern and Central states keep their lead on laboratories and foundry capacity. A delay in error correction would hold more spending inside government programs for longer than expected.
Frequently Asked Questions
How big is the North America quantum computing market?
Which solution type leads the market?
Which region holds the largest share?
Which region grows fastest?
What is driving demand in this market?
How do buyers pay for quantum access?
What are the main challenges for buyers?
Who are the leading companies?
Table of Content
Chapter 1 Market Segmentation
- 1.1 Segmentation Framework
- 1.1.1 Product and Service Classification
- 1.1.2 Application and End-Use Classification
- 1.1.3 Technology and Solution Classification
- 1.1.4 Customer and Distribution Channel Classification
- 1.1.5 Geographic Segmentation
- 1.1.6 Market Segment Definitions and Boundaries
- 1.2 By Solution Type
- 1.2.1 Quantum Hardware
- 1.2.2 Quantum Cloud Services
- 1.2.3 Quantum Software
- 1.3 By Deployment Model
- 1.3.1 Public Cloud
- 1.3.2 On-Premises
- 1.3.3 Hybrid
- 1.4 By End-Use Industry
- 1.4.1 Government, Defense and Research
- 1.4.2 Banking, Financial Services and Insurance
- 1.4.3 Energy, Manufacturing and Technology
- 1.4.4 Healthcare and Pharmaceuticals
- 1.5 By Application
- 1.5.1 Optimization
- 1.5.2 Simulation
- 1.5.3 Algorithm Research and Benchmarking
- 1.5.4 Quantum Machine Learning
Chapter 2 Introduction
- 2.1 Report Objectives and Scope
- 2.2 Product Definition and Industry Terminology
- 2.3 Market Inclusions and Exclusions
- 2.4 Research Process
- 2.4.1 Primary Research and Expert Interviews
- 2.4.2 Secondary Research and Source Review
- 2.4.3 Top-Down and Bottom-Up Estimation
- 2.4.4 Data Triangulation and Verification
- 2.5 Market Size Measurement Basis
- 2.5.1 2025: USD 644.5 million → 2035: USD 15.67 billion
- 2.6 Historical and Forecast Reference Periods
- 2.6.1 Historical Period: 2018-2025
- 2.6.2 Base Year: 2025
- 2.6.3 Forecast Period: 2025-2035
- 2.7 Research Assumptions and Limitations
Chapter 3 Executive Summary
- 3.1 Market Snapshot and Key Findings
- 3.2 Base-Year Market Size, 2025
- 3.3 Forecast Market Size, 2035
- 3.4 Revenue and Volume Growth Outlook
- 3.5 Key Demand and Supply Indicators
- 3.6 Leading Market Segments
- 3.7 Fastest-Growing Market Opportunities
- 3.8 Regional Performance Highlights
- 3.9 Technology and Industry Transformation
- 3.10 Competitive Landscape Summary
- 3.11 Analyst View and Strategic Implications
Chapter 4 North America Quantum Computing Market Trends and Developments
- 4.1 Historical Industry Development, 2018-2025
- 4.2 Recent Market Trends and Developments
- 4.3 Demand and Customer Behavior Trends
- 4.4 Technology and Product Innovation
- 4.5 Artificial Intelligence, Automation and Digitalization
- 4.6 Local Manufacturing and Supply Chain Realignment
- 4.7 Industry Partnerships, Mergers and Acquisitions
- 4.8 Sustainability and Circular Economy Developments
- 4.9 Government and Private Sector Investment Trends
- 4.10 Emerging Business Models and Commercialization
- 4.11 Industry Developments and Announcements
Chapter 5 North America Quantum Computing Market Production, Supply and Demand Analysis
- 5.1 Demand Trend and Consumption Analysis, 2018-2025
- 5.2 Demand Forecast, 2025-2035
- 5.3 Production and Output Trend, 2018-2025
- 5.4 Production and Output Forecast, 2025-2035
- 5.5 Installed Capacity and Capacity Utilization
- 5.6 Company-Wise Production Plants and Statistics
- 5.6.1 Installed Production Capacity
- 5.6.2 Actual Production
- 5.6.3 Planned Capacity and Expansion Targets
- 5.7 Supply Chain Structure and Procurement Trends
- 5.8 Supply-Demand Gap and Bottlenecks
- 5.9 Import Dependence and Sourcing Structure
- 5.10 Contract Manufacturing and Outsourcing
- 5.11 Regional Supply and Demand Concentration
Chapter 6 North America Quantum Computing Market Pricing Analysis
- 6.1 Pricing Structure and Measurement
- 6.2 Historical Pricing Trends, 2018-2025
- 6.3 Pricing Outlook, 2025-2035
- 6.4 Average Selling Price and Unit Economics
- 6.5 Pricing by Product and Market Segment
- 6.6 Geographic Pricing Differences
- 6.7 Key Input, Energy, Labor and Logistics Costs
- 6.8 Contract Pricing and Purchasing Models
- 6.9 Pricing Sensitivity and Competitive Positioning
- 6.10 Price, Margin and Profitability Implications
Chapter 7 North America Quantum Computing Market Dynamics
- 7.1 Market Growth Drivers
- 7.1.1 Demand-Side Drivers
- 7.1.2 Technology and Innovation Drivers
- 7.1.3 Infrastructure and Investment Drivers
- 7.1.4 Regulatory and Policy Drivers
- 7.2 Market Restraints
- 7.2.1 Cost and Affordability Constraints
- 7.2.2 Technology and Adoption Barriers
- 7.2.3 Supply Chain and Operational Constraints
- 7.3 Market Challenges
- 7.3.1 Competitive Pressure and Margin Erosion
- 7.3.2 Skills, Infrastructure and Implementation Gaps
- 7.4 Emerging Market Opportunities
- 7.5 Market Dynamics Impact and Time-Horizon Assessment
Chapter 8 North America Quantum Computing Value Chain Analysis
- 8.1 Industry Value Chain Overview
- 8.2 Upstream Suppliers and Critical Inputs
- 8.3 Technology and Component Providers
- 8.4 Manufacturing or Service Delivery
- 8.5 Distribution, Channel Partners and Integrators
- 8.6 Downstream Applications and End Users
- 8.7 Value Addition and Profit Pools
- 8.8 Vertical Integration and Outsourcing
- 8.9 Supplier Concentration and Risk
- 8.10 Supply Chain Localization and Resilience
Chapter 9 North America Quantum Computing Market Regulations and Policies
- 9.1 Relevant Laws, Standards and Compliance Frameworks
- 9.2 Product, Service, Safety and Quality Requirements
- 9.3 Government Policies, Incentives and Subsidies
- 9.4 Imports, Exports and Trade Barriers
- 9.5 Public Procurement and Local Content Requirements
- 9.6 Environmental and Sustainability Compliance
- 9.7 Data Protection, AI and Cybersecurity Compliance
- 9.8 Upcoming Policy Changes and Market Implications
Chapter 10 North America Quantum Computing Market Hotspots and Opportunities
- 10.1 Market Opportunity Mapping and Growth Hotspots
- 10.2 High-Growth Applications and Customer Groups
- 10.3 Underserved Markets and White-Space Opportunities
- 10.4 Emerging Technology and Product Opportunities
- 10.5 New Capacity and Investment Hotspots
- 10.6 Market Entry and Expansion Opportunities
- 10.7 Distribution and Partnership Opportunities
- 10.8 Near-Term and Long-Term Commercial Potential
- 10.9 Opportunity Attractiveness and Execution Risks
Chapter 11 North America Quantum Computing Market Outlook, 2025-2035
- 11.1 Market Size and Analysis
- 11.1.1 Revenue (Market Measurement: 2025: USD 644.5 million → 2035: USD 15.67 billion)
- 11.1.2 Market Volume and Quantity Sold
- 11.1.3 Historical Market Size, 2018-2025
- 11.1.4 Base-Year Market Size, 2025
- 11.2 Market Forecast, 2025-2035
- 11.2.1 Revenue Forecast to 2035
- 11.2.2 Volume Forecast to 2035
- 11.2.3 CAGR and Year-on-Year Growth
- 11.2.4 Incremental Revenue Opportunity
- 11.3 Forecast Assumptions and Scenario Analysis
- 11.3.1 Base-Case Forecast
- 11.3.2 Optimistic and Conservative Scenarios
- 11.3.3 Technology, Pricing and Policy Sensitivities
- 11.4 Market Attractiveness and Growth Outlook
Chapter 12 North America Quantum Computing Market Segmentation and Outlook
- 12.1 Segmentation Summary and Market Shares, 2025
- 12.2 Largest and Fastest-Growing Segments
- 12.3 By Solution Type - Market Size and Forecast, 2025-2035
- 12.3.1 Segment Definition and Scope
- 12.3.2 Historical Market Size, 2018-2025
- 12.3.3 Revenue Forecast, 2025-2035
- 12.3.4 Volume Forecast, 2025-2035
- 12.3.5 Base-Year Market Share, 2025
- 12.3.6 Segment CAGR and Growth Drivers
- 12.3.7 Subsegment Market Size and Forecast
- 12.3.7.1 Quantum Hardware
- 12.3.7.2 Quantum Cloud Services
- 12.3.7.3 Quantum Software
- 12.3.8 Subsegment Pricing and Adoption Trends
- 12.3.9 Leading Suppliers and Competition
- 12.3.10 Regional Demand and Opportunities
- 12.4 By Deployment Model - Market Size and Forecast, 2025-2035
- 12.4.1 Segment Definition and Scope
- 12.4.2 Historical Market Size, 2018-2025
- 12.4.3 Revenue Forecast, 2025-2035
- 12.4.4 Volume Forecast, 2025-2035
- 12.4.5 Base-Year Market Share, 2025
- 12.4.6 Segment CAGR and Growth Drivers
- 12.4.7 Subsegment Market Size and Forecast
- 12.4.7.1 Public Cloud
- 12.4.7.2 On-Premises
- 12.4.7.3 Hybrid
- 12.4.8 Subsegment Pricing and Adoption Trends
- 12.4.9 Leading Suppliers and Competition
- 12.4.10 Regional Demand and Opportunities
- 12.5 By End-Use Industry - Market Size and Forecast, 2025-2035
- 12.5.1 Segment Definition and Scope
- 12.5.2 Historical Market Size, 2018-2025
- 12.5.3 Revenue Forecast, 2025-2035
- 12.5.4 Volume Forecast, 2025-2035
- 12.5.5 Base-Year Market Share, 2025
- 12.5.6 Segment CAGR and Growth Drivers
- 12.5.7 Subsegment Market Size and Forecast
- 12.5.7.1 Government, Defense and Research
- 12.5.7.2 Banking, Financial Services and Insurance
- 12.5.7.3 Energy, Manufacturing and Technology
- 12.5.7.4 Healthcare and Pharmaceuticals
- 12.5.8 Subsegment Pricing and Adoption Trends
- 12.5.9 Leading Suppliers and Competition
- 12.5.10 Regional Demand and Opportunities
- 12.6 By Application - Market Size and Forecast, 2025-2035
- 12.6.1 Segment Definition and Scope
- 12.6.2 Historical Market Size, 2018-2025
- 12.6.3 Revenue Forecast, 2025-2035
- 12.6.4 Volume Forecast, 2025-2035
- 12.6.5 Base-Year Market Share, 2025
- 12.6.6 Segment CAGR and Growth Drivers
- 12.6.7 Subsegment Market Size and Forecast
- 12.6.7.1 Optimization
- 12.6.7.2 Simulation
- 12.6.7.3 Algorithm Research and Benchmarking
- 12.6.7.4 Quantum Machine Learning
- 12.6.8 Subsegment Pricing and Adoption Trends
- 12.6.9 Leading Suppliers and Competition
- 12.6.10 Regional Demand and Opportunities
- 12.7 Segment Growth Comparison
- 12.8 Segment Attractiveness and Priority Matrix
Chapter 13 North America Quantum Computing End-Use and Application Market Outlook
- 13.1 End-Use Industry and Customer Demand Structure
- 13.2 Leading Applications and Customer Groups
- 13.3 End-Use Market Size, Share and Forecast
- 13.4 Major End-Use Industry Deep Dives
- 13.4.1 Customer Requirements and Use Cases
- 13.4.2 Demand and Replacement Cycles
- 13.4.3 Technical and Regulatory Considerations
- 13.4.4 Purchasing and Procurement Models
- 13.4.5 Leading Vendors and Distribution Channels
- 13.4.6 Forecast and Commercial Opportunities
- 13.5 Emerging Applications and Cross-Segment Demand
- 13.6 End-Use Industry Investment Priorities
Chapter 14 North America Quantum Computing Geographic Market Outlook, 2025-2035
- 14.1 Regional Market Size and Country-Level Shares, 2025
- 14.2 Country Market Size Comparison, 2025
- 14.3 Country Market Forecasts, 2025-2035
- 14.4 Subregional Industrial and Demand Clusters
- 14.5 Intra-Regional Pricing and Cost Differences
- 14.6 Cross-Border Trade and Supply Networks
- 14.7 Regional Supply and Demand Balances
- 14.8 Country Opportunity Comparison and Prioritization
Note: Every listed country is covered on the structure shown under the first country.
Chapter 15 North America Quantum Computing Technology, Innovation and Sustainability Outlook
- 15.1 Technology Landscape and Maturity
- 15.2 Product, Process and Service Innovation
- 15.3 AI, Automation and Digital Tools in the Industry
- 15.4 Technology Adoption and Performance Benchmarking
- 15.5 Innovation Pipeline and R&D Investment
- 15.6 Patent and Intellectual Property Trends
- 15.7 Energy Efficiency and Resource Management
- 15.8 Sustainability, Recycling and Circularity
- 15.9 Technology Roadmap, 2025-2035
- 15.10 Risks of Obsolescence and Technology Substitution
Chapter 16 North America Quantum Computing Market Key Strategic Imperatives
- 16.1 Growth and Market Entry Priorities
- 16.2 High-Return Products and Segments
- 16.3 Pricing, Profitability and Cost Optimization
- 16.4 Technology Investment and Product Differentiation
- 16.5 Supply Chain Localization and Resilience
- 16.6 Distribution and Customer Acquisition
- 16.7 Partnership, Acquisition and Capacity Strategy
- 16.8 Regional Expansion Priorities
- 16.9 Short-, Medium- and Long-Term Actions
Chapter 17 Competition Outlook
- 17.1 Industry Competition Characteristics
- 17.2 Market Structure and Concentration
- 17.3 Market Share and Competitive Positioning, 2025
- 17.4 Company-Wise Revenue and Product Benchmarking
- 17.5 Production and Service Capacity Benchmarking
- 17.6 Technology, Pricing and Differentiation
- 17.7 Regional Footprint and Distribution Strength
- 17.8 Mergers, Acquisitions and Strategic Alliances
- 17.9 New Entrants and Competitive Threats
- 17.10 Porter's Five Forces and Industry Attractiveness
- 17.11 Competitive Outlook, 2025-2035
Chapter 18 Company Profiles
- 18.1 Company Coverage and Selection Criteria
- 18.2 IBM
- 18.2.1 Business Description
- 18.2.2 Company Ownership and Geographic Presence
- 18.2.3 Product and Service Portfolio
- 18.2.4 Manufacturing and Operating Footprint
- 18.2.5 Production Capacity and Expansion Plans
- 18.2.6 Financial Performance and Investment
- 18.2.7 Market Share and Competitive Position
- 18.2.8 Technology and Innovation Capabilities
- 18.2.9 Strategic Alliances or Partnerships
- 18.2.10 Recent Developments
- 18.2.11 Growth Strategy and Outlook
- 18.3 IonQ
- 18.4 Quantinuum
- 18.5 D-Wave Quantum
- 18.6 Rigetti Computing
- 18.7 Other Relevant Market Participants
Note: Every listed company is profiled on the structure shown under the first company. The company list is preliminary and may change based on research findings, market developments, data availability and client requirements.
Chapter 19 Disclaimer
- 19.1 Research and Forecast Disclaimer
- 19.2 Data Source and Estimation Limitations
Note: The depth of individual sections depends on data availability for this market. Volume, capacity, trade and other unit-based metrics are included where applicable.

