
Free ad-funded viewing drives India streaming revenue
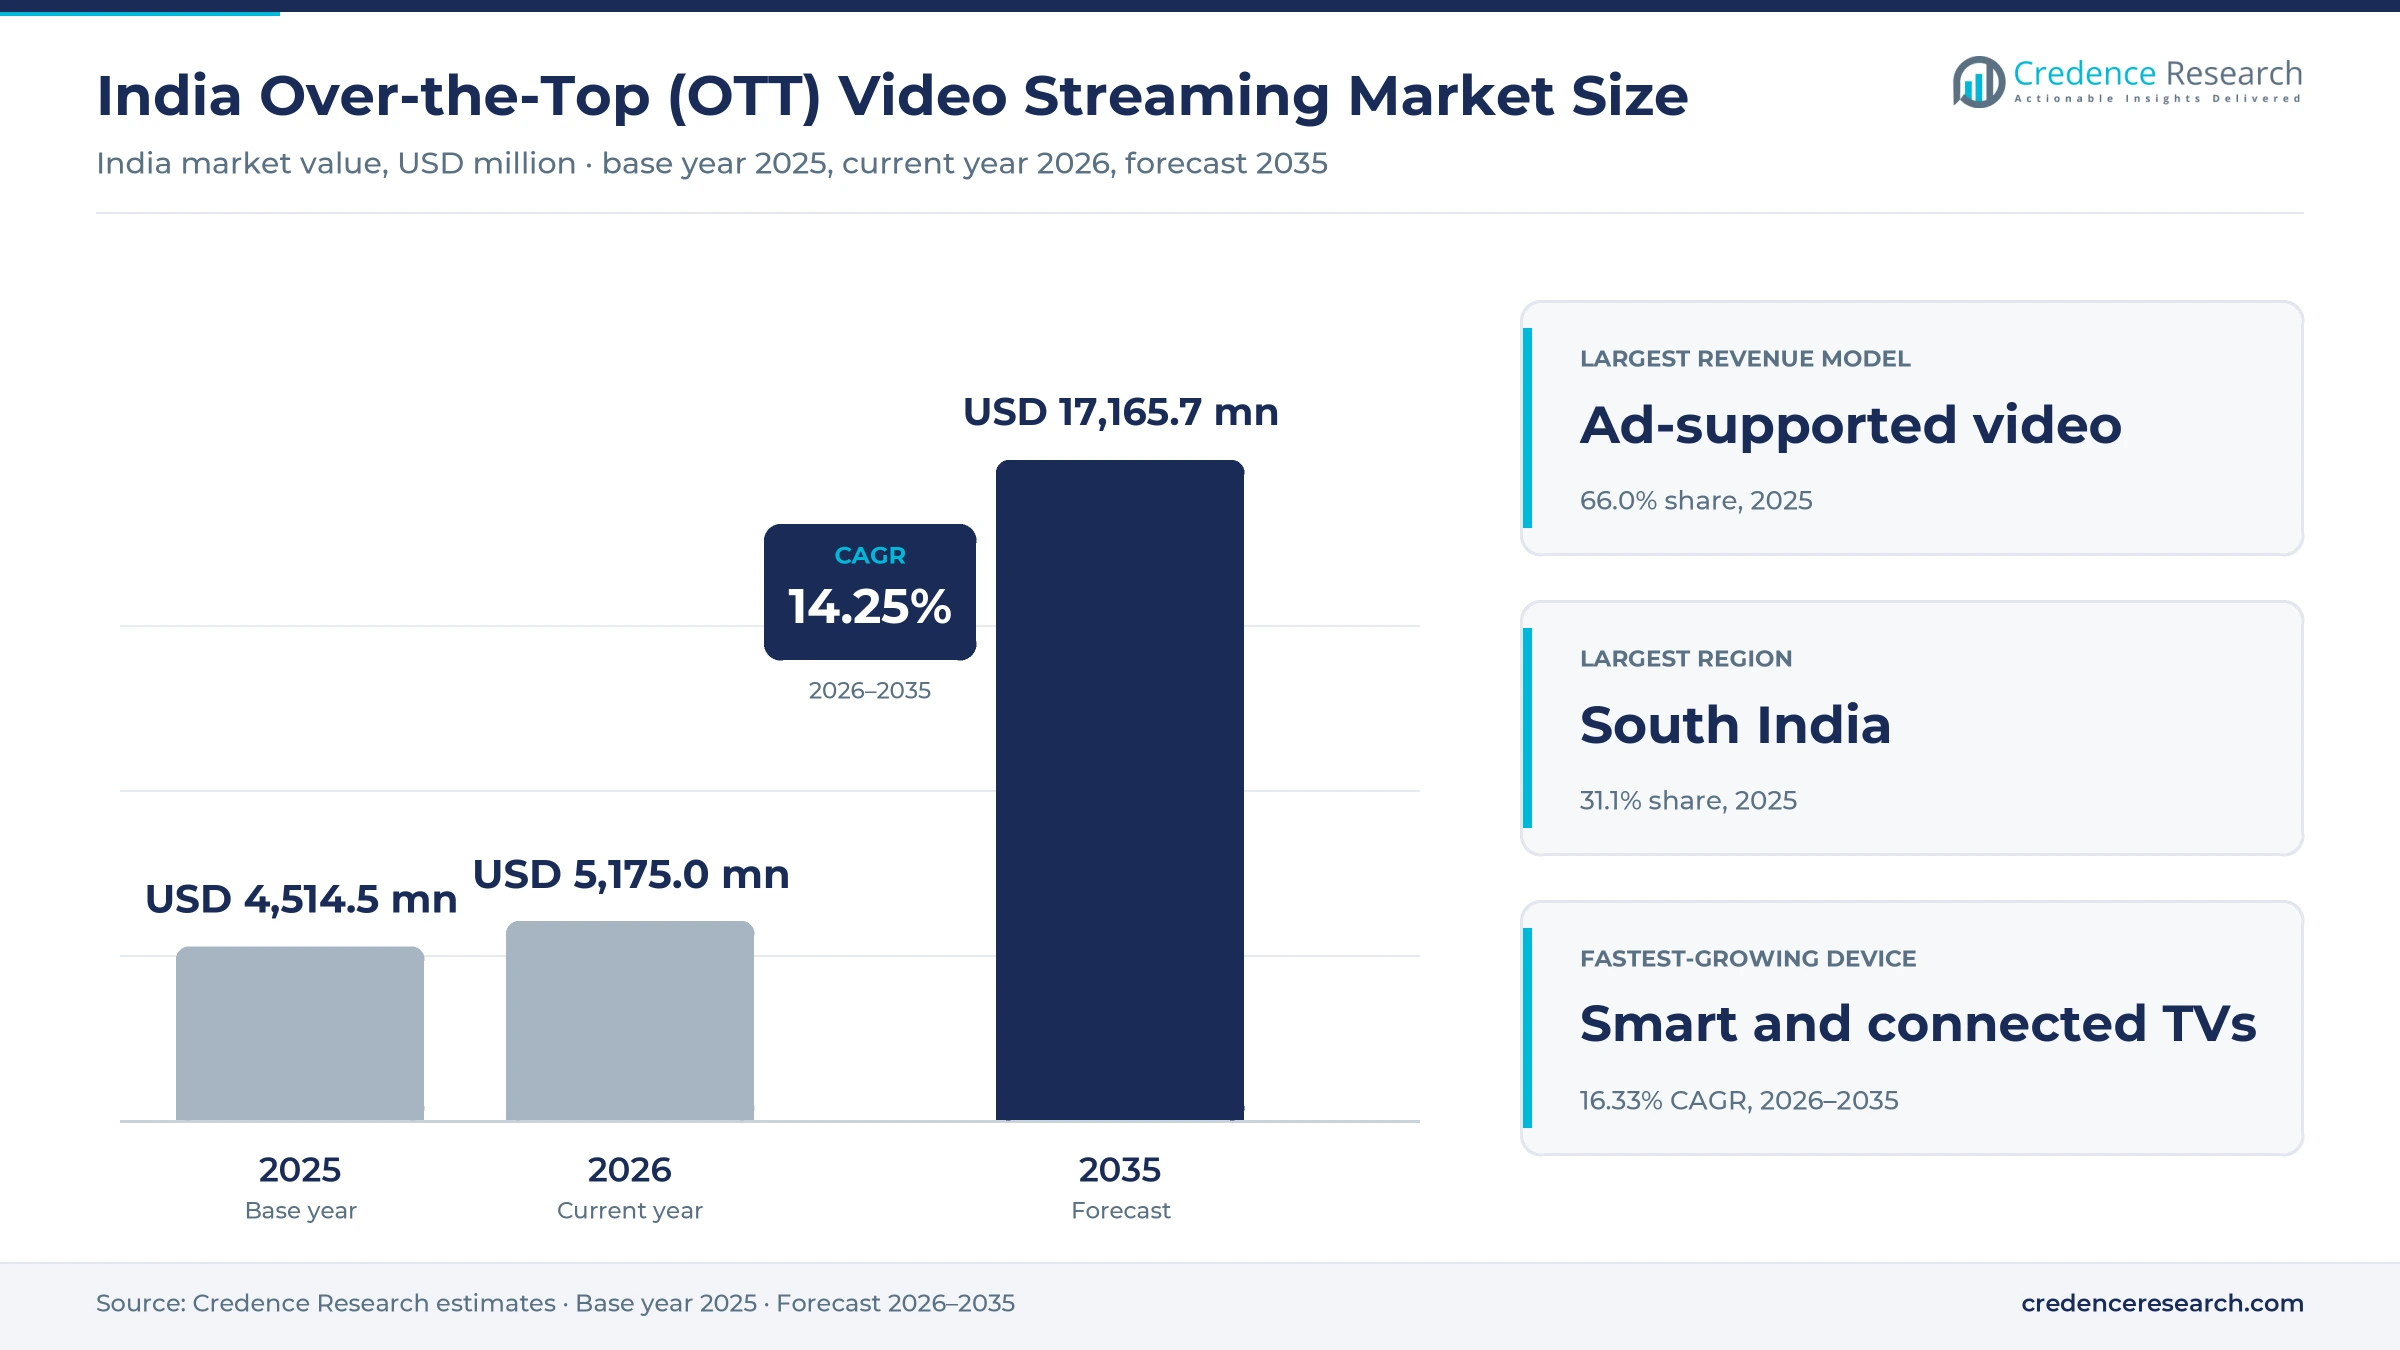
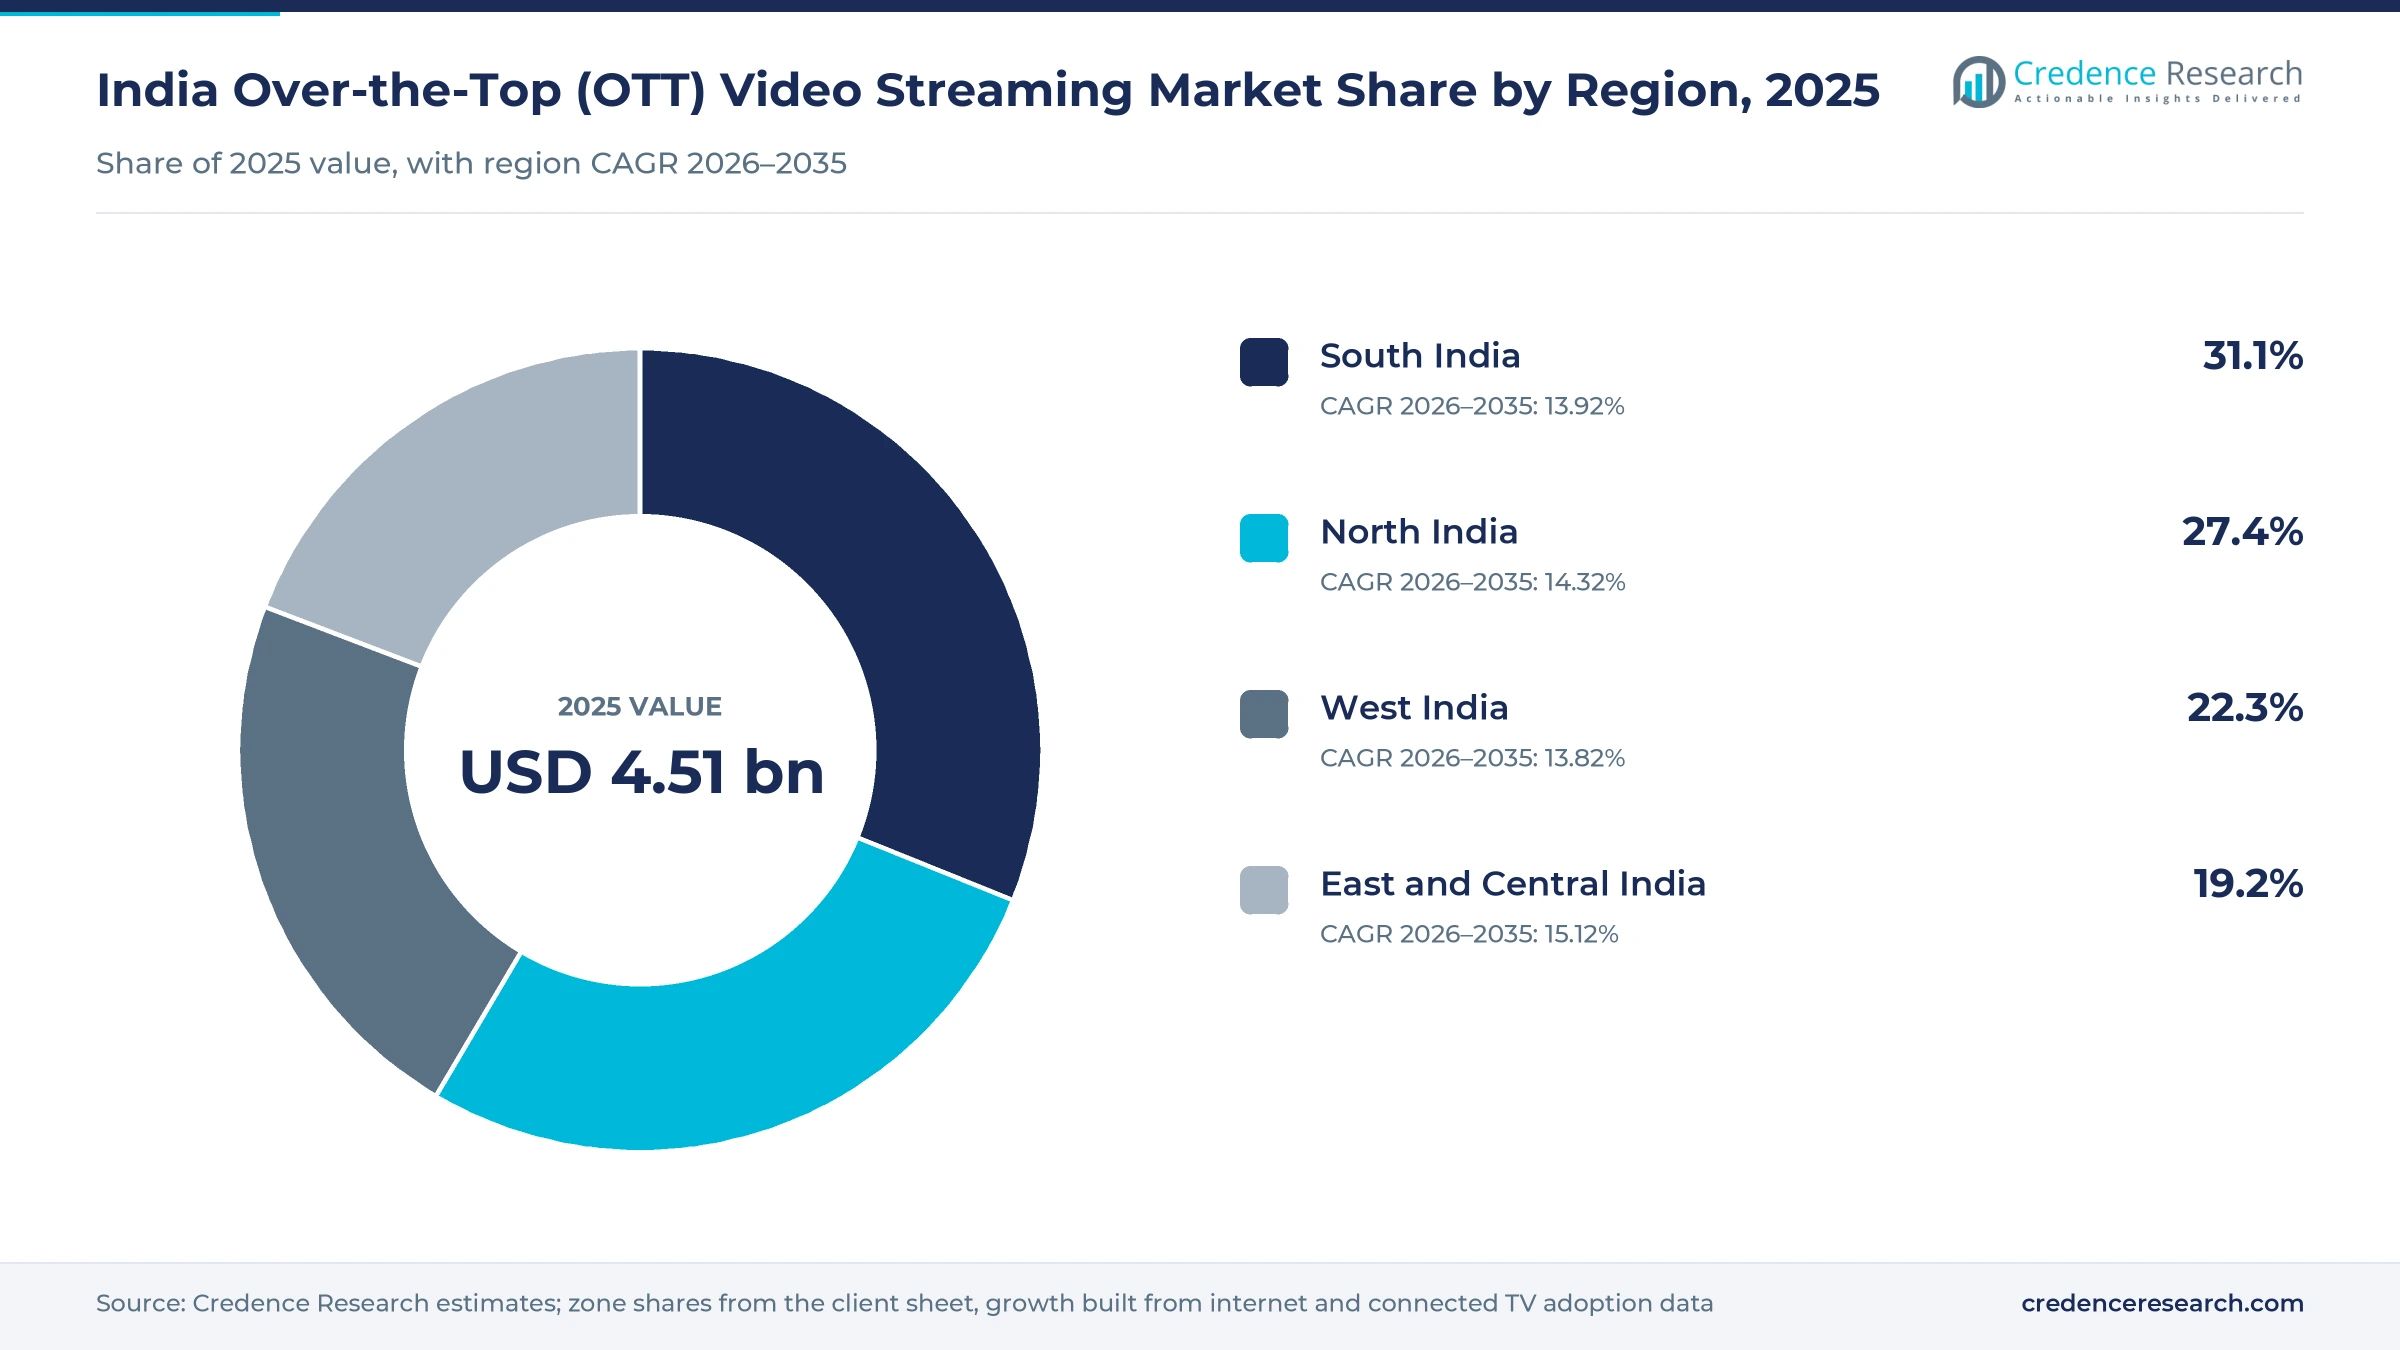
The India over-the-top (OTT) video streaming market was valued at USD 4.51 billion in 2025 and is projected to increase from USD 5.18 billion in 2026 to USD 17.17 billion by 2035, registering a CAGR of 14.25% during 2026–2035. Revenue comes from advertisers that buy video inventory on free and ad-supported apps, from viewers who pay for subscriptions directly or through telecom bundles, and from rentals of new films. South India held the largest regional share, 31.1% in 2025, because Tamil, Telugu, Malayalam and Kannada audiences support dedicated local platforms beside national apps. East and Central India is the fastest-growing region at 15.12% a year, as low-cost mobile data brings first-time viewers in Bihar, Jharkhand and Odisha online. The market structure also changed after Reliance and Disney combined their streaming assets into JioHotstar. As a result, live cricket, ad-supported tiers and connected television viewing now set the pace of revenue growth.
What does the estimate count across free, paid and rental viewing?
The estimate measures the revenue that platforms earn from video delivered over the internet in India, including subscription fees, advertising sold against streamed video and pay-per-view rentals. It covers long-form series and films, live sports and news, and short-form video watched on smartphones, connected TVs, computers and set-top boxes.
The estimate excludes broadband and mobile data charges, device sales, linear television subscriptions and content licensing fees paid between studios. The value chain runs from producers and rights holders through platforms and ad technology providers to telecom operators, aggregators and device makers that bring apps to Indian viewers.
India Over-the-Top (OTT) Video Streaming Market Insights
- The India over-the-top (OTT) video streaming market was valued at USD 4.51 billion in 2025 and is projected to reach USD 17.17 billion by 2035, registering a CAGR of 14.25% during 2026–2035.
- South India held a 31.1% share of 2025 revenue, because regional language platforms and strong film audiences support high viewing in four southern states.
- Advertising-supported video on demand led with a 66.0% share of 2025 revenue, because most of the 601.2 million Indian viewers watch without paying.
- Digital reach of IPL 2025 was 652 million people, ahead of television reach of 537 million, according to JioStar.
- Amazon added ads to Prime Video in India on June 17, 2025, so every major platform except Netflix now sells advertising inventory.
Ad-supported viewing leads while short-form grows fastest
Why does ad-supported viewing earn the most revenue?
Based on revenue model, the market is categorized into advertising-supported video on demand, subscription video on demand and transactional video on demand. Advertising-Supported Video on Demand led with a 66.0% share of 2025 revenue, because YouTube, Amazon MX Player and free tiers reach far more viewers than paid apps. Advertising-Supported Video on Demand also grows fastest at 14.54% a year, as brands move budgets from television to streamed video.
How fast is short-form video gaining on long-form series?
Based on solution type, the market is categorized into long-form video streaming, live video streaming and short-form video streaming. Long-Form Video Streaming led with 58.0% of 2025 revenue, because films and original series anchor paid plans on every major app. Short-Form Video Streaming grows fastest at 16.21% a year, as vertical micro-dramas and creator content attract mobile viewers in smaller towns.
Which screens carry most paid and free viewing?
Based on device type, the market is categorized into smartphones and tablets, smart and connected TVs, and computers and set-top boxes. Smartphones and Tablets led with 62.0% of 2025 revenue, because most Indian viewers stream on a phone with a mobile data plan. Smart and Connected TVs grow fastest at 16.33% a year, as households watch cricket and films together on large screens.
How do telecom bundles shape the deployment mix?
Based on deployment model, the market is categorized into standalone OTT applications, telecom-bundled services and aggregator services. Standalone OTT Applications led with 61.0% of 2025 revenue, because viewers download leading apps and pay or watch ads directly. Aggregator Services grow fastest at 15.54% a year, as Airtel Xstream Play and other aggregators sell many apps under one bill.
| Segment Group | Leading Sub-segment | Share, 2025 | Fastest-growing Sub-segment | CAGR, 2026–2035 |
|---|---|---|---|---|
| By Revenue Model | Advertising-Supported Video on Demand | 66.0% | Advertising-Supported Video on Demand | 14.54% |
| By Solution Type | Long-Form Video Streaming | 58.0% | Short-Form Video Streaming | 16.21% |
| By Device Type | Smartphones and Tablets | 62.0% | Smart and Connected TVs | 16.33% |
| By Deployment Model | Standalone OTT Applications | 61.0% | Aggregator Services | 15.54% |
Request a Free Sample
Fill in your details and we'll send you a free sample report.
- Sample data tables & charts
- Research methodology
Cheap data, cricket and ad budgets lift platform revenue
How do cheap data and 5G widen the viewing base?
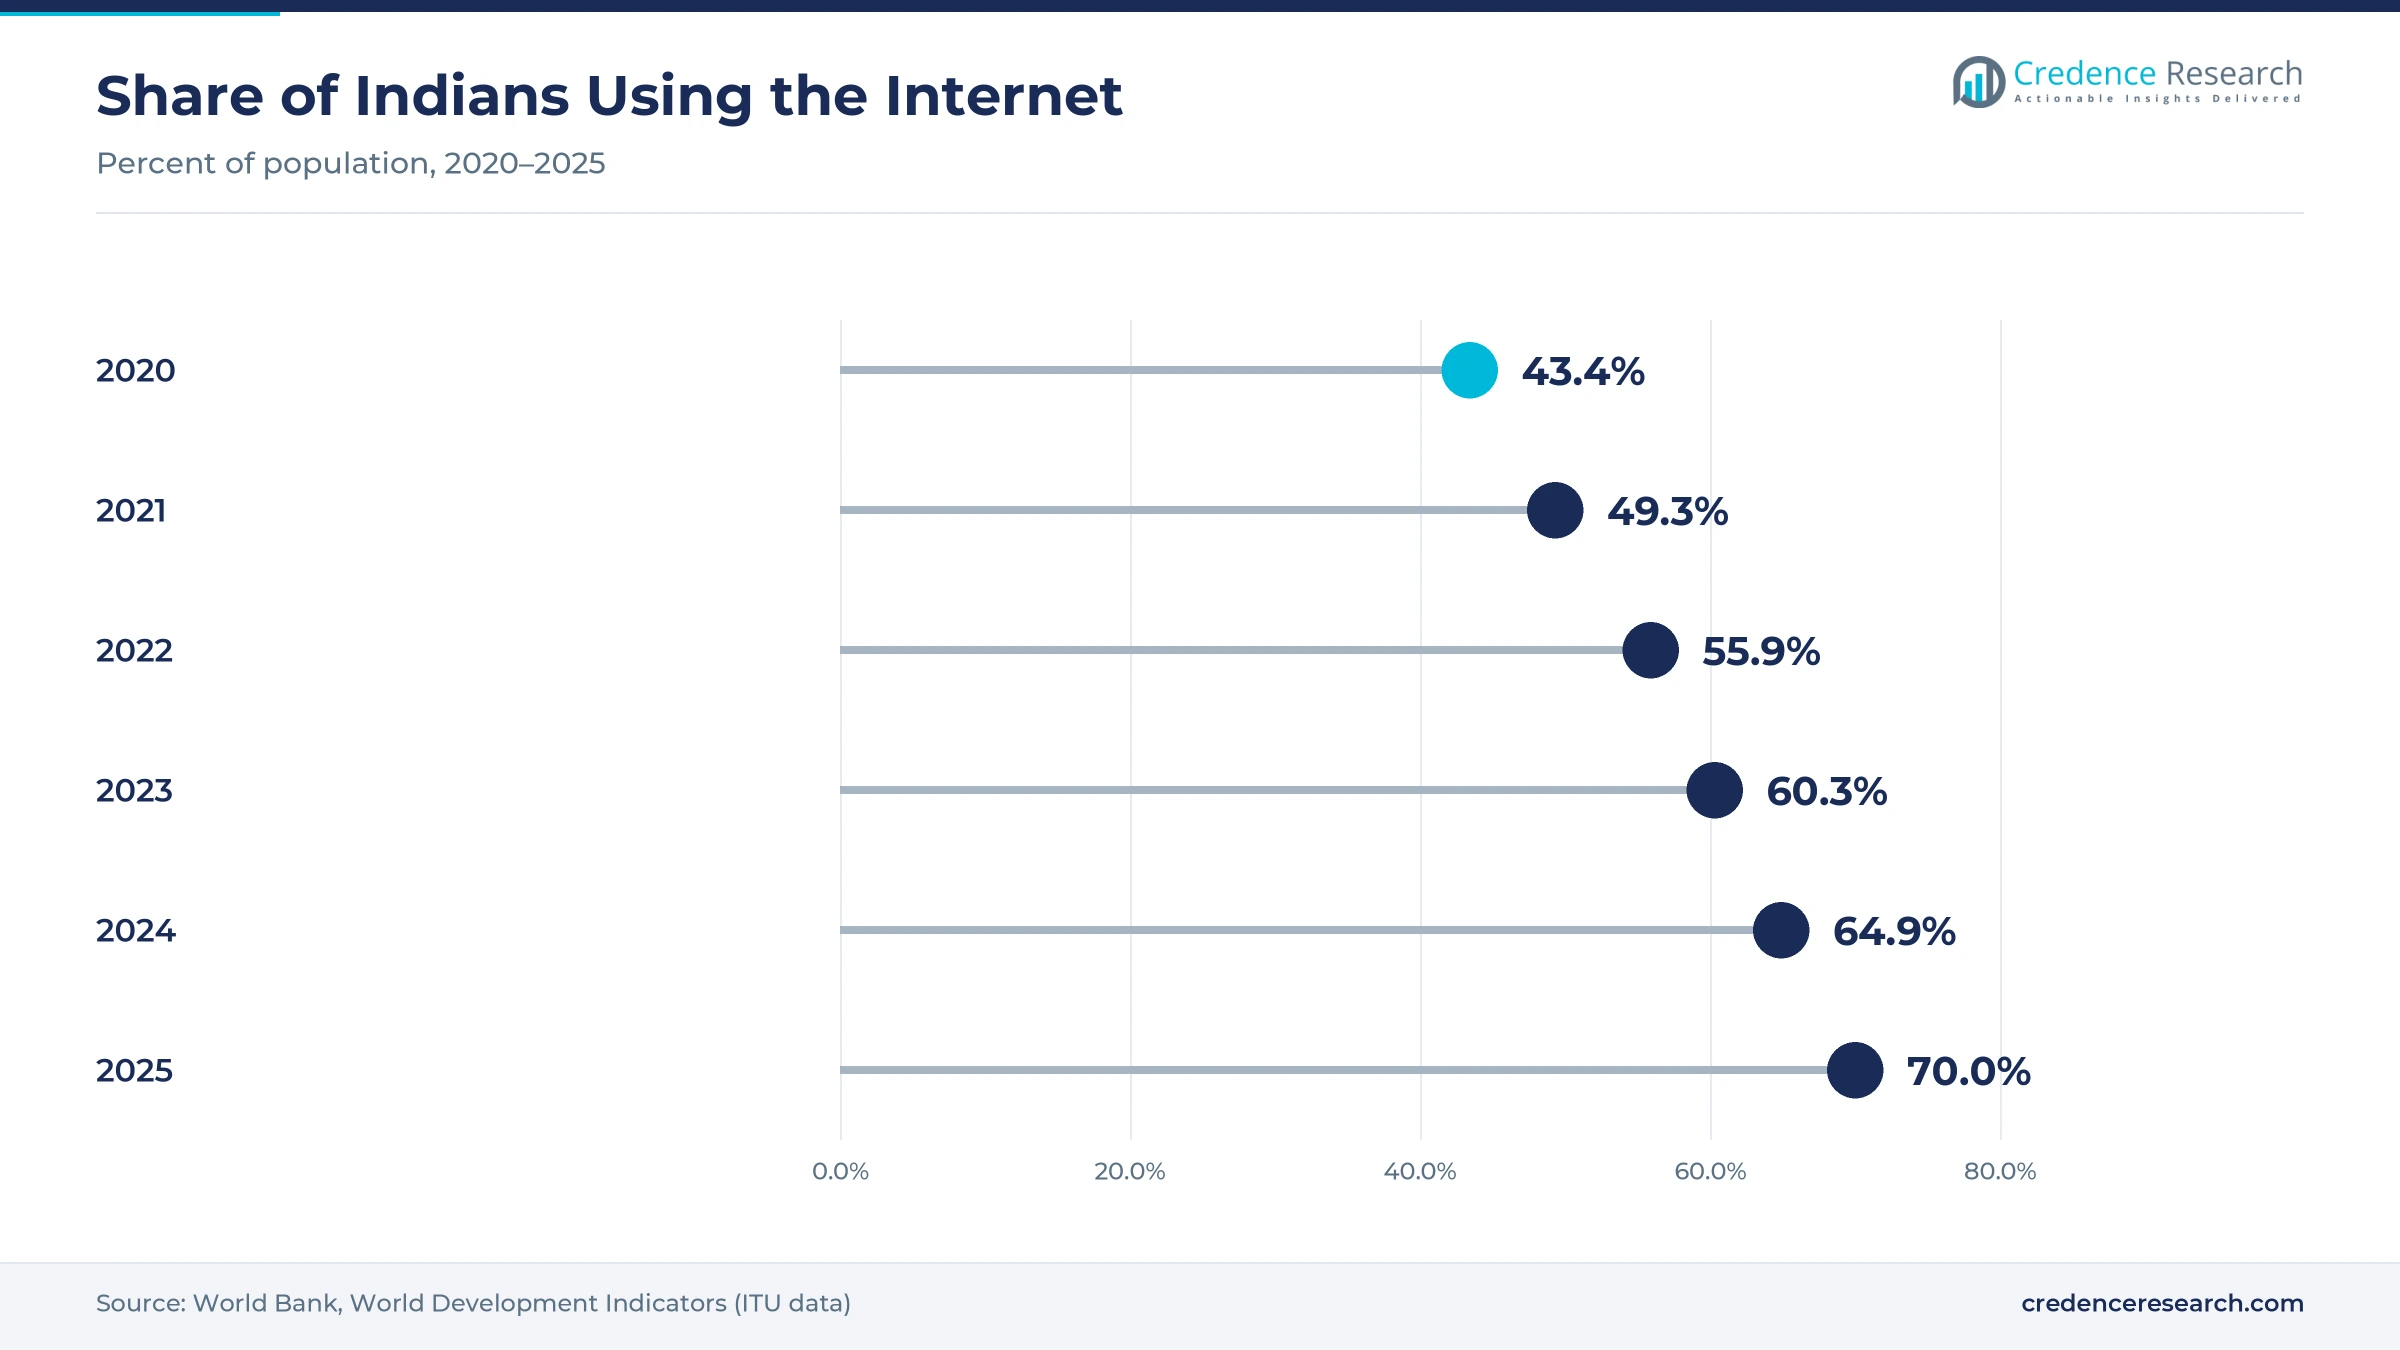
Low mobile data prices and fast 5G rollout let more Indians stream long videos daily, which enlarges the audience that advertisers and platforms can monetize. India had 1,092.79 million internet subscriptions at the end of March 2026, and wireless data use per subscriber rose to 25.51 GB a month in 2025-26 from 21.53 GB a year earlier, according to the Telecom Regulatory Authority of India. Average revenue per GB also fell to INR 8.02 from INR 8.97. The share of Indians using the internet reached 70% in 2025, up from 43.4% in 2020, according to the World Bank. Ericsson counted 394 million 5G subscriptions in India at the end of 2025. As a result, smartphones and tablets carry 62.0% of 2025 revenue.
Why does live cricket drive subscriptions and ad sales?
Live cricket gives platforms their largest audiences of the year, which lets them sell premium ad slots and convert free viewers into paying subscribers. Digital reach of IPL 2025 hit 652 million, ahead of television reach of 537 million, and connected TV reach was 235 million, according to JioStar figures reported by exchange4media. JioHotstar, launched on Feb. 14, 2025, crossed 300 million subscriptions during the tournament, according to OTTVerse. Its ad-supported mobile plan starts at INR 149 for three months, which keeps paid cricket viewing within reach of most households. In turn, live video streaming holds a large share of revenue, which keeps sports platform technology central to peak-season delivery.
How is advertising migration and regional content lifting revenue?
Brands are moving budgets from print and television to digital video, while regional content brings new viewers that advertisers could not reach before. Digital advertising in India reached INR 94,700 crore in 2025, up 26%, and took 63% of total ad spend, according to an industry report covered by Storyboard18. Connected TV ad revenue alone rose 42% to INR 9,900 crore. YouTube said in May 2025 that it had paid more than INR 21,000 crore to Indian creators, artists and media companies over three years. Growth in digital advertising therefore supports advertising-supported video on demand, which grows at 14.54% a year.
Why are more households paying for video subscriptions?
Paid video subscriptions are rising as platforms offer cheap mobile plans, telecom bundles and premium sports, which lifts subscription revenue even though most viewers still watch free content. Paid video subscriptions reached 216 million across 143 million households in 2025, and digital subscription revenue rose 60% to INR 16,300 crore, according to an industry report covered by Storyboard18. Active paid subscriptions reached 148.2 million in mid-2025, including telecom bundles and aggregators, according to survey data reported by afaqs. Amazon added a Prime Video ad-free option at INR 129 a month in June 2025. As a result, subscription video on demand holds a significant share of 2025 revenue.
Connected TVs, micro-dramas and dialect apps reshape demand
How is the rise of connected TV changing viewing habits?
Streaming is moving from the phone to the living room television, which raises session length, ad prices and the value of family plans. India had 129.2 million active connected TV viewers in 2025, implying 35 million to 40 million connected TV homes, after connected TV penetration rose 87% in a year, according to audience survey data reported by afaqs. Connected TV reach for IPL 2025 also stood at 235 million. Amazon MX Player is available on Fire TV and other connected TVs, and media players and dongles bring older televisions online. In turn, smart and connected TVs grow fastest by device at 16.33% a year.
Why is the shift to micro-dramas and short-form video notable?
Vertical micro-dramas and creator clips are winning time on mobile screens, which opens a new revenue stream built on small payments and in-feed ads. Micro-drama apps reached 73.2 million viewers in less than a year, according to an Indian Television year-end review of 2025. Flick TV, Kuku TV, ReelSaga, QuickTV and Chana Jor raised more than USD 44 million through August 2025, a 55% rise over 2024. Amazon MX Player launched a micro-drama format, while Zee Entertainment took an equity stake in content start-up Bullet in June 2025. As a result, short-form video streaming grows fastest by solution type at 16.21% a year, from a smaller base than long-form series.
Can dialect and regional apps open new paying audiences?
Platforms that produce in dialects and regional languages can win paying viewers that national apps underserve, which opens room for focused services. STAGE, which streams in Haryanvi, Rajasthani and Bhojpuri, reported 20 million users and more than 4.4 million paying subscribers at the end of March 2025, according to Entrackr. aha had more than 2.7 million paid subscribers in June 2023, mostly Telugu viewers, and entered the Tamil market in April 2022. Hoichoi sells its Bengali annual plan at INR 599 a year. In turn, regional apps can grow subscription revenue in towns where Hindi and English libraries convert few paying viewers.
Is AI-led content and ad targeting an opening for platforms?
Artificial intelligence lets platforms dub, subtitle and target ads at lower cost, which opens room to serve more languages and raise ad yields. JioHotstar offered more than 300,000 hours of content in 10 Indian languages at launch, according to Digit, which demands fast dubbing and subtitling. YouTube said Indian content drew 45 billion hours of watch time from viewers outside India in a year, which rewards translation at scale. Amazon also said it would use its ad technology and customer signals to help brands reach Amazon MX Player viewers. Spending on AI tools in media should therefore support ad yields over the forecast period.
Low willingness to pay and content costs squeeze margins
How does low willingness to pay limit subscription revenue?
Most Indian viewers still watch free content, which caps subscription revenue even as audiences grow. India had 601.2 million OTT viewers but only 148.2 million active paid subscriptions in 2025, and many of those come through telecom bundles at low effective prices. As a result, platforms depend on advertising, which swings with brand budgets. Platforms respond with cheap mobile plans, sachet pricing and bundles that lower the first payment barrier for viewers.
Why do sports rights and content costs squeeze margins?
Cricket rights and original series cost large sums up front, while revenue arrives over many seasons. A platform that loses a major cricket property can lose a large part of its peak audience and ad sales in one year. In turn, smaller apps struggle to compete for premium rights and big film releases. Platforms now share costs through co-productions, licensing deals with regional studios and tighter budgets for unproven originals.
How does the gaming ad ban affect sports ad budgets?
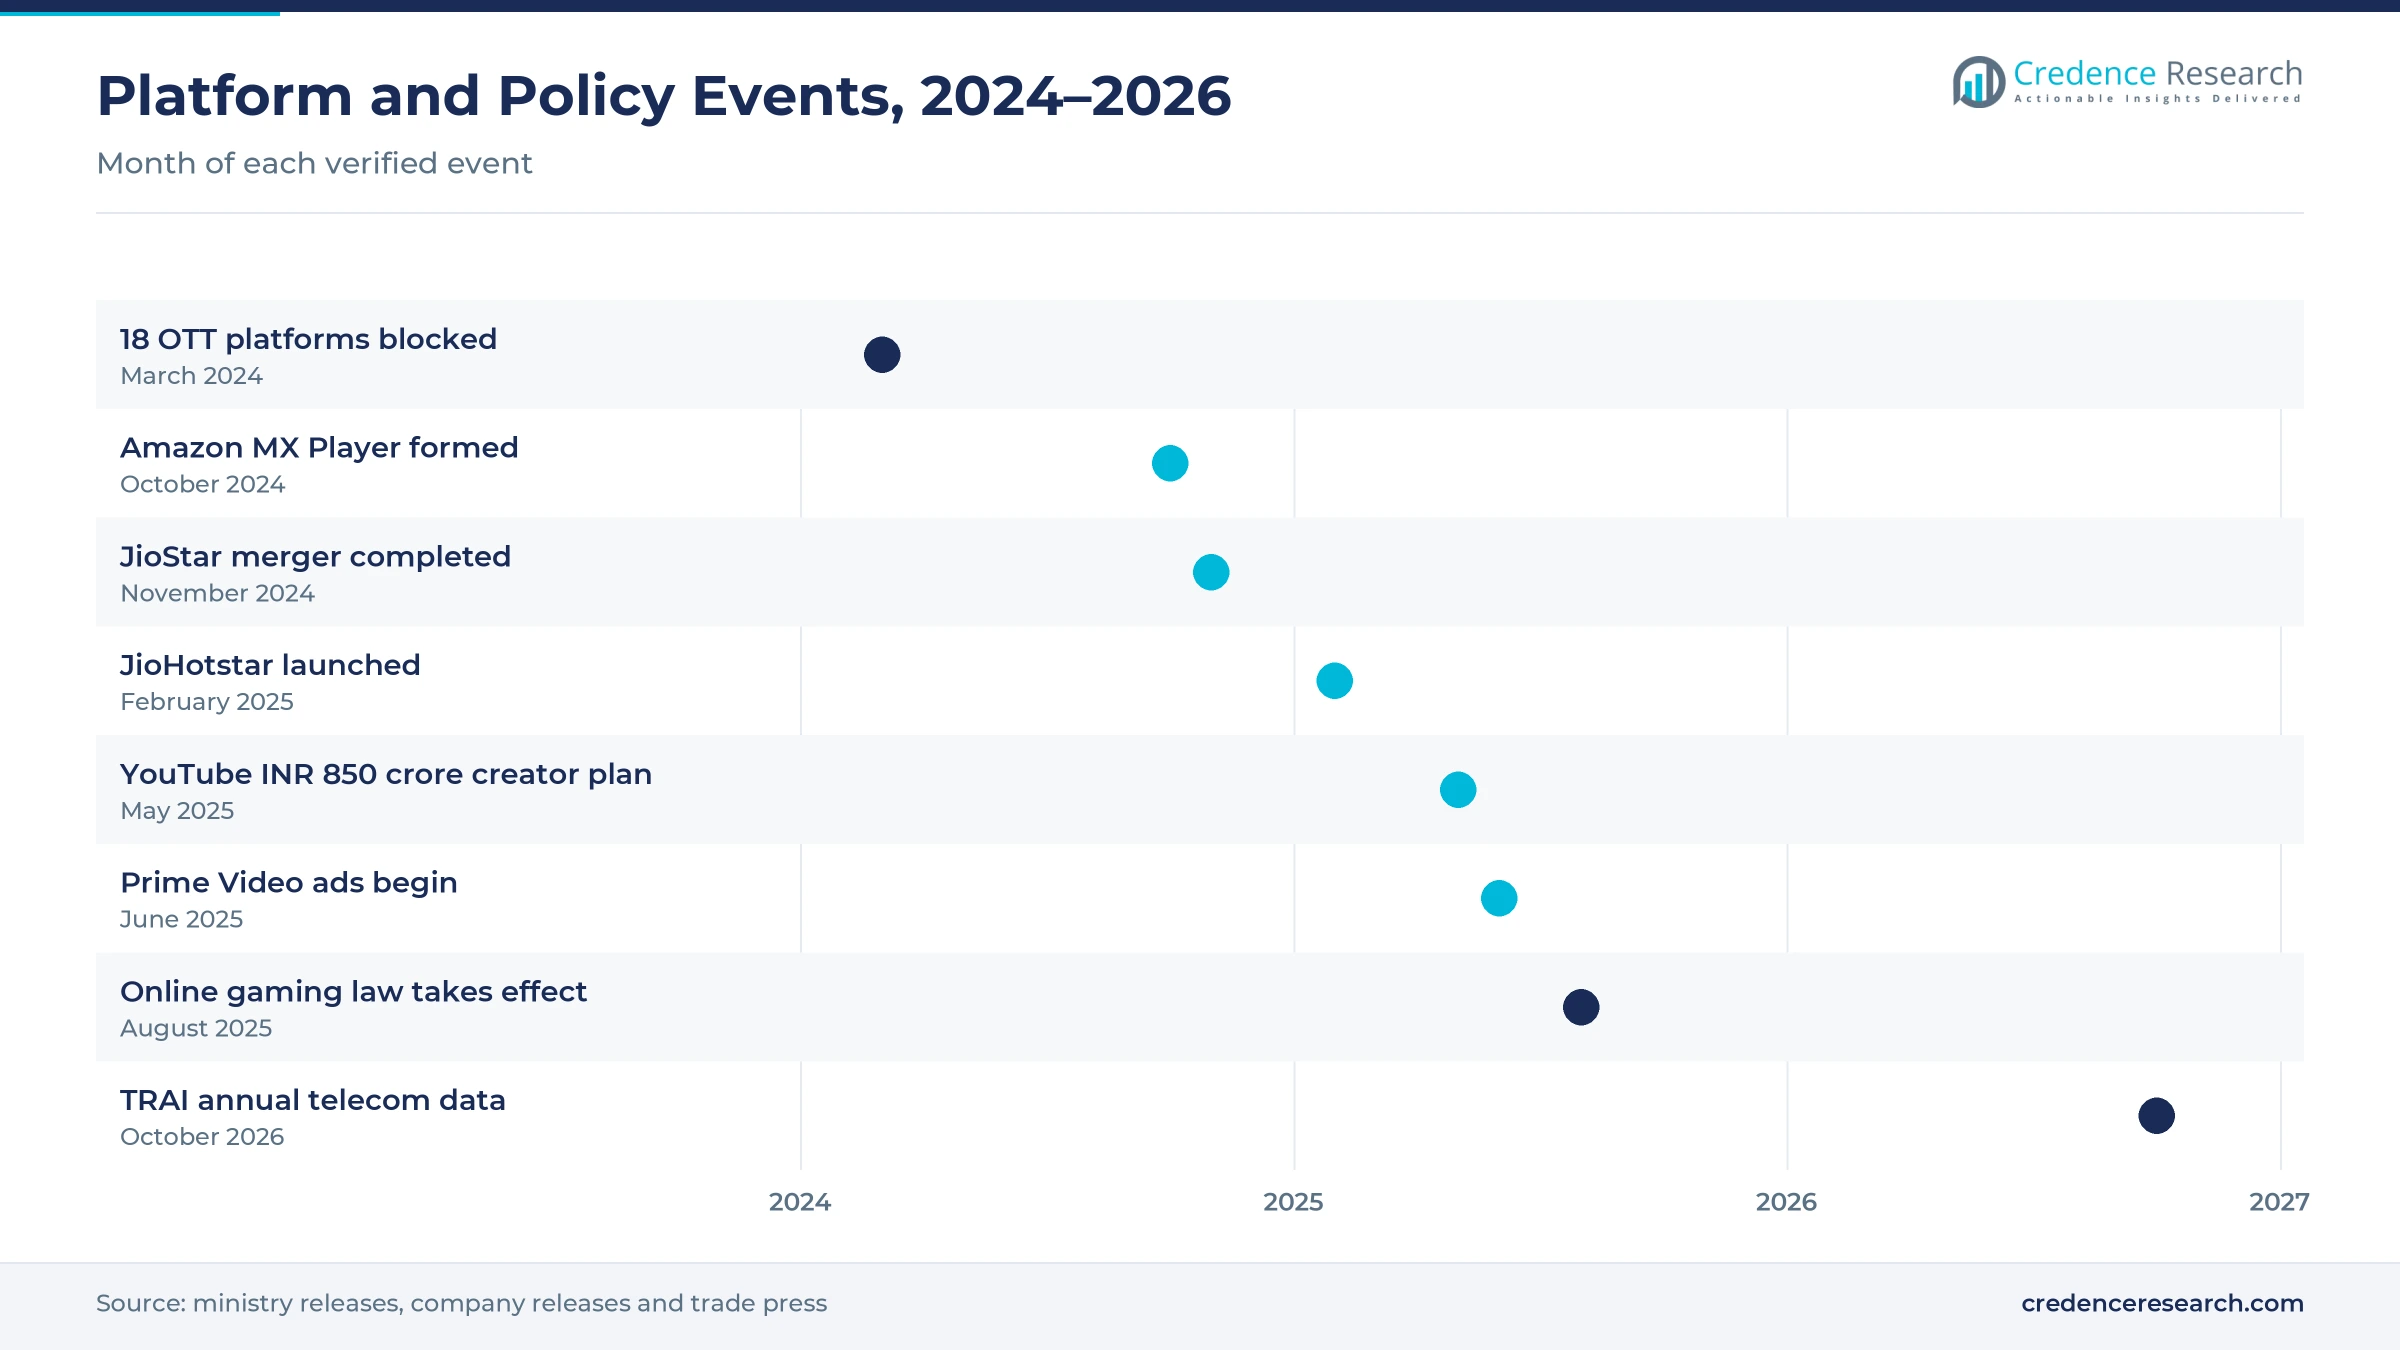
The Promotion and Regulation of Online Gaming Act, which received presidential assent in August 2025, banned online money games and their advertising. Real-money gaming firms such as Dream11, My11Circle and WinZO had been among the largest IPL advertisers, and Social Samosa reported about INR 1,500 crore of IPL ad revenue at risk. As a result, platforms must replace those sponsors with e-commerce, consumer technology and financial brands in later seasons.
Why does content regulation add compliance risk?
The Ministry of Information and Broadcasting blocked 18 OTT platforms for obscene content in March 2024, along with 19 websites, 10 apps and 57 social media accounts. This action showed that the government will act against platforms that breach the IT Act and related laws. In turn, platforms invest more in content review, age ratings and parental controls, which adds cost for smaller services that run thin compliance teams.
Southern language viewers lead while eastern states catch up
| Region | Value, 2025 (USD billion) | Share, 2025 | CAGR, 2026–2035 |
|---|---|---|---|
| South India | 1.40 | 31.1% | 13.92% |
| North India | 1.24 | 27.4% | 14.32% |
| West India | 1.01 | 22.3% | 13.82% |
| East and Central India | 0.87 | 19.2% | 15.12% |
How do regional film audiences put South India first?
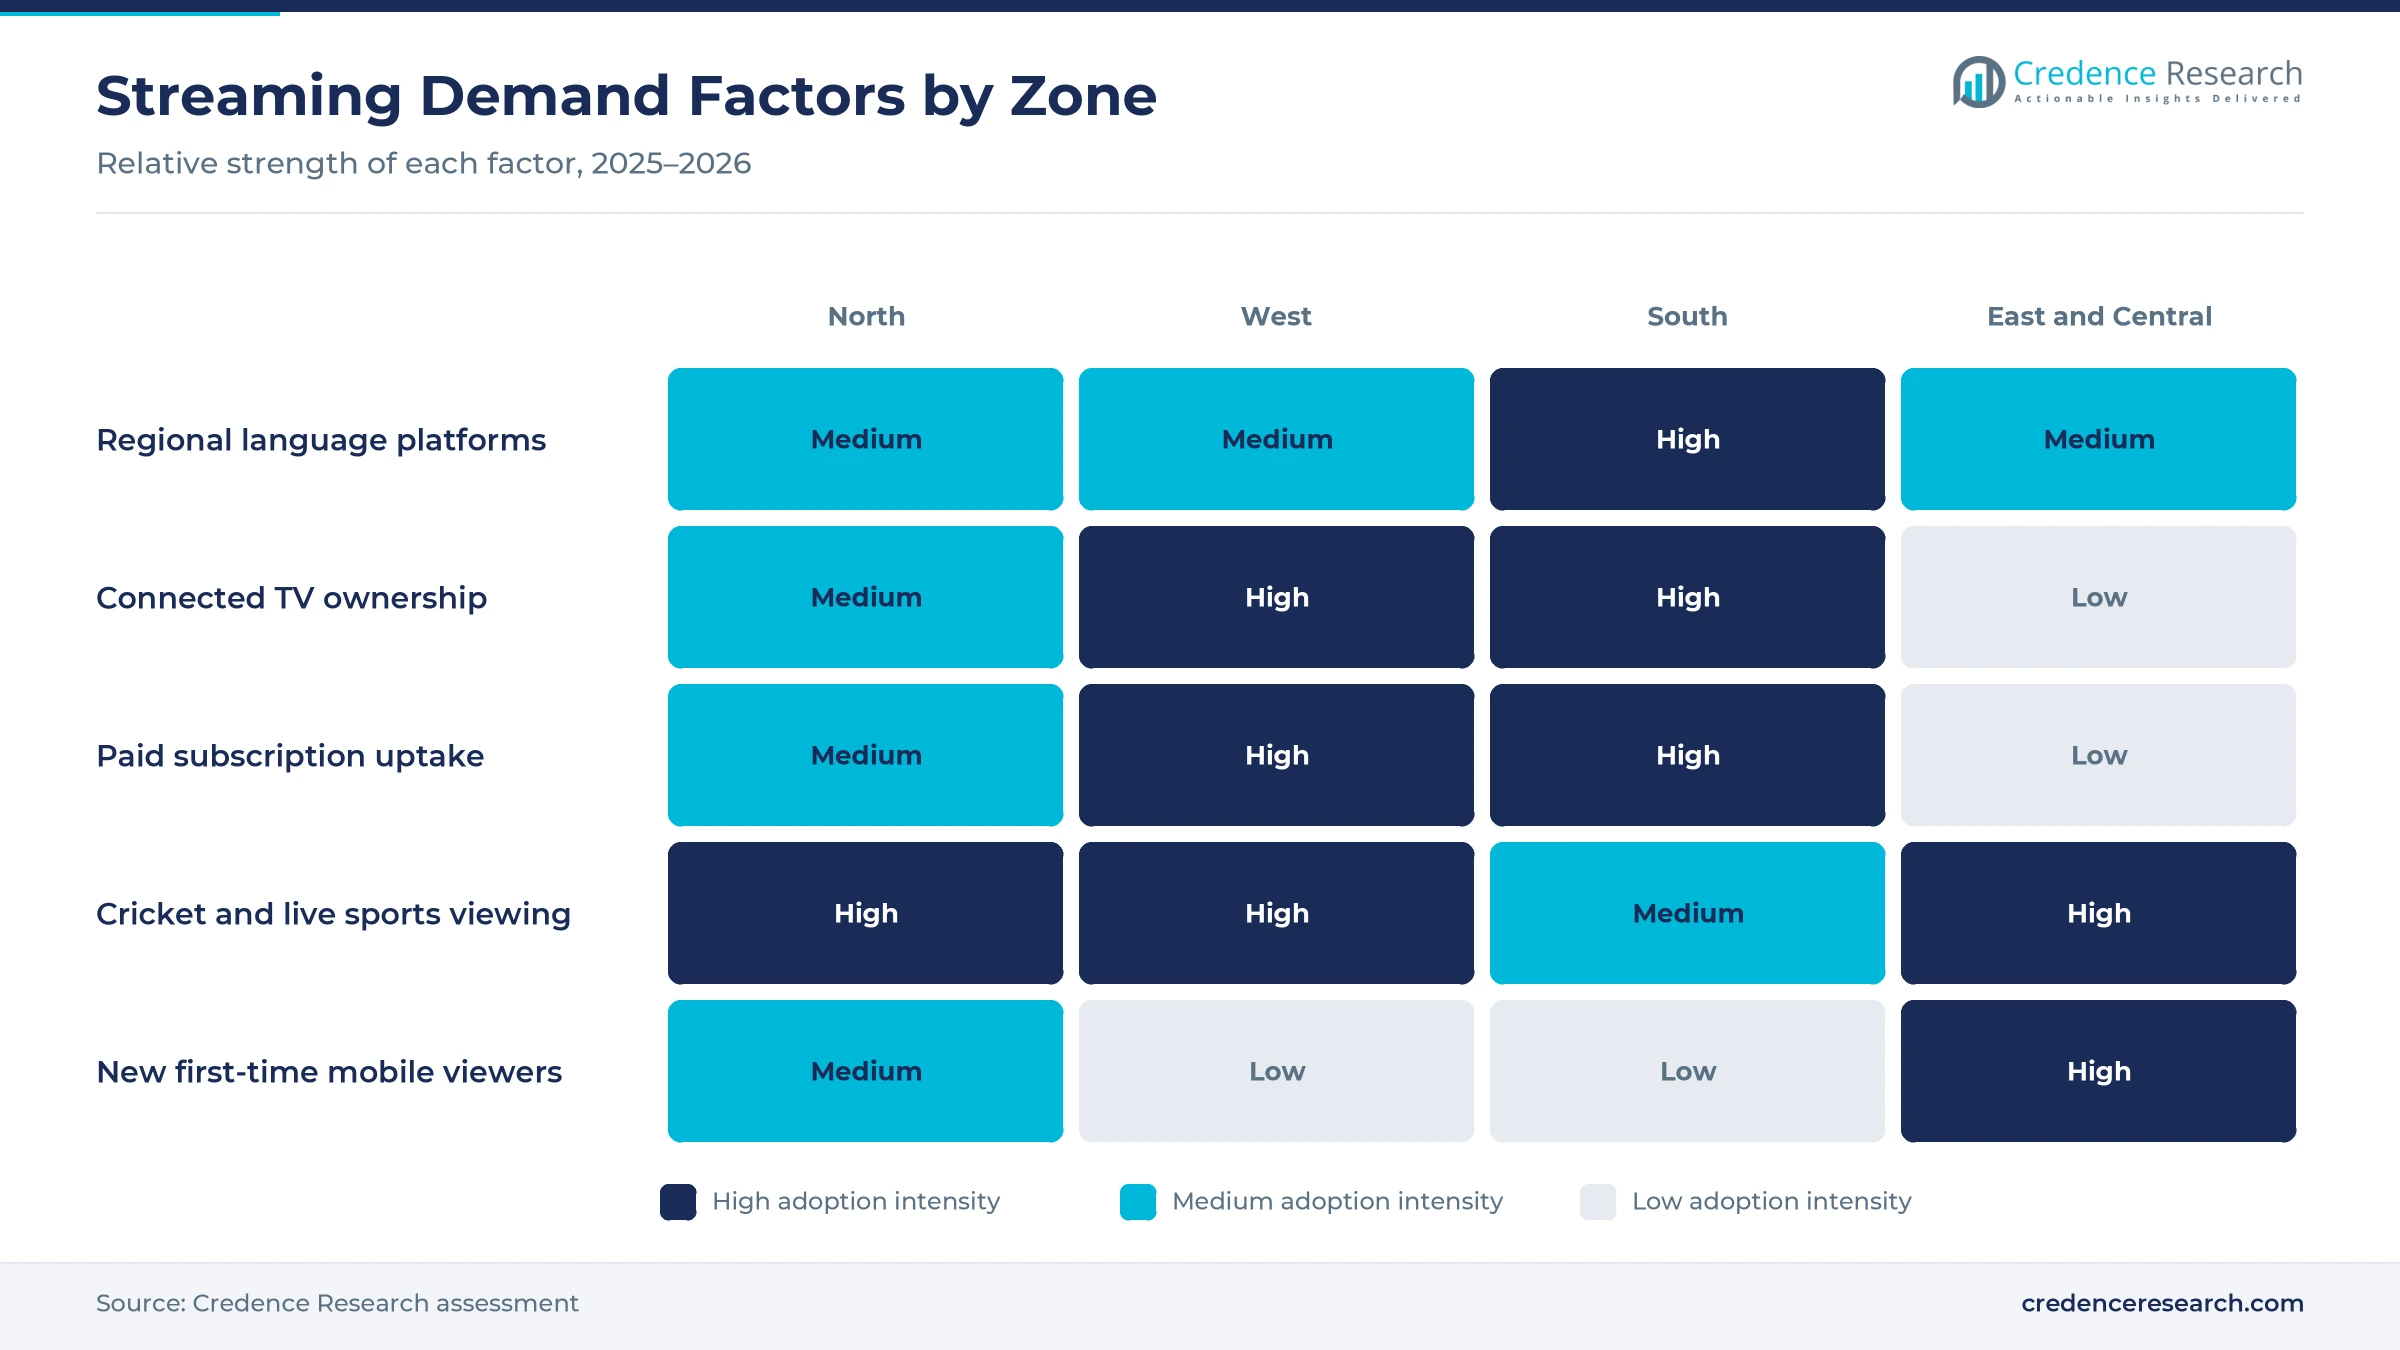
South India held 31.1% of 2025 revenue and grows at 13.92% a year, because Tamil, Telugu, Malayalam and Kannada audiences watch heavily and pay for local platforms. aha built a paid base of more than 2.7 million mostly Telugu subscribers by June 2023, while Sun NXT added micro-dramas in Tamil, Telugu, Kannada and Malayalam in August 2026. Netflix signed multi-year deals with studios in Chennai and Kochi in 2025 for Tamil and Malayalam originals. As a result, southern states combine national and regional subscriptions in one household.
Why do Hindi and dialect viewers make north India large?
North India held 27.4% of 2025 revenue and grows at 14.32% a year, because Delhi, Uttar Pradesh, Punjab, Haryana and Rajasthan hold a large share of Hindi-speaking viewers. STAGE built a paid base of more than 4.4 million subscribers by March 2025 with Haryanvi, Rajasthani and Bhojpuri shows. The same platform reported 20 million users at the end of March 2025, which shows the reach of dialect content. In turn, national advertisers buy heavily against large northern Hindi audiences.
How does Mumbai shape revenue in West India?
West India held 22.3% of 2025 revenue and grows at 13.82% a year, because Mumbai hosts the head offices, studios and ad agencies of most national platforms. Maharashtra and Gujarat also have high household incomes and connected TV ownership, which supports paid plans. SonyLIV expanded Marathi and Punjabi content in 2025 to reach more viewers in western and northern states. However, the zone grows slightly below the national rate because metro audiences already stream heavily.
Why do first-time mobile viewers lift East and Central India?
East and Central India held 19.2% of 2025 revenue and grows fastest at 15.12% a year, because many households in Bihar, Odisha, Jharkhand, Chhattisgarh and Madhya Pradesh are only now going online. Rural India had 48.31 internet subscriptions per 100 people in March 2026, against 126.80 in urban areas, according to TRAI data reported by The Policy Edge. Bengali platform Hoichoi and Bhojpuri content on STAGE also serve eastern audiences. As a result, first-time mobile viewers lift growth from a lower base.
Mergers, ad tiers and creator funds from 2024 to 2026
| Development | Status and market relevance |
|---|---|
| In October 2024, Amazon completed its acquisition of MX Player assets and merged the app with Amazon miniTV. | Amazon MX Player had more than 250 million unique users |
| In February 2025, JioStar launched JioHotstar by combining JioCinema and Disney+ Hotstar. | More than 300,000 hours of content in 10 languages |
| In May 2025, YouTube announced an investment of more than INR 850 crore in Indian creators over two years. | Announced at the WAVES summit in Mumbai |
| In June 2025, Amazon introduced ads on Prime Video in India with an ad-free add-on. | Ad-free option priced at INR 129 a month or INR 699 a year |
| In August 2025, the Promotion and Regulation of Online Gaming Act banned online money games and their advertising. | Removes a large group of sports streaming advertisers |
Ad insertion and adaptive delivery shape platform economics
- Server-side ad insertion stitches ads into live and on-demand streams, which lets platforms sell cricket inventory at scale.
- Adaptive bitrate streaming adjusts video quality to network speed, which keeps playback smooth on crowded mobile networks.
- Content delivery networks cache popular titles near viewers, which cuts delay and cost during live cricket peaks.
- Recommendation engines rank titles by viewing history and language, which raises watch time across large libraries.
- AI dubbing and subtitling converts shows into many Indian languages, which widens the audience for each title.
Need a Custom Version of This Report?
Tailor the scope, geography, or segments to your exact requirements.
- Custom geography or segment scope
- Direct access to our analyst team
Sports rights, free libraries and bundles split the field
Competition centers on sports rights, free libraries, regional content and distribution bundles, because most viewers choose free or low-cost options. YouTube leads free viewing and pays a large creator base, while JioHotstar holds IPL and other cricket rights and passed 300 million subscriptions in 2025. Amazon runs two models, with Prime Video bundled into Prime membership and Amazon MX Player free with ads. Netflix stays the main subscription-only platform and invests in Tamil and Malayalam originals. ZEE5 and SonyLIV rely on regional originals and sports, with SonyLIV reporting 35.9 million subscribers in 2025. Sun NXT and aha focus on southern languages, while STAGE targets dialect audiences in the north. Telecom operators and aggregators decide which apps reach many paying homes, which gives bundled platforms a steady base.
Companies profiled and their roles in this market
| Company | Type | Role in the market |
|---|---|---|
| YouTube India | Free and ad-supported platform | Paid over INR 21,000 crore to Indian creators in three years |
| JioHotstar | Hybrid platform | IPL rights; 300 million subscriptions during IPL 2025 |
| Netflix India | Subscription platform | Only major subscription-only app; Tamil and Malayalam deals |
| Amazon Prime Video India | Hybrid platform | Ads added June 2025; ad-free add-on at INR 129 a month |
| Amazon MX Player | Free and ad-supported platform | Merged with miniTV; over 250 million unique users |
| SonyLIV | Hybrid platform | 35.9 million subscribers in 2025; Marathi and Punjabi content |
| ZEE5 | Hybrid platform | About 48 million users; regional originals |
| Sun NXT | Regional platform | Sun NXT Shorts micro-dramas in four southern languages, 2026 |
| aha | Regional platform | Telugu and Tamil originals; bundled with Airtel Xstream |
| STAGE | Dialect platform | Haryanvi, Rajasthani and Bhojpuri; 4.4 million paying subscribers |
Credence Research view on Indian streaming revenue
Credence Research's view is that Indian streaming revenue will grow strongly, because cheap data, connected TVs and live cricket keep enlarging the audience that advertisers want to reach. Advertising-supported viewing should keep the largest share, while paid plans grow through bundles and low-priced mobile tiers. South India should stay the largest zone as regional platforms deepen paid viewing, while East and Central India grows fastest from a lower base. Platforms that combine sports, regional libraries and strong ad technology should capture most of the new revenue.
Audience, telecom and media spend data anchor the model
The report uses 2025 as the base year on a calendar basis, and market values come from the Credence Research model. That model combines audience counts, paid subscription totals, advertising spend data, internet subscription and data use statistics, and platform announcements. Segment splits, regional shares and zone growth rates are Credence Research estimates. Sources used are regulator releases, World Bank data, industry body reports covered by trade press, company releases and trade press, and no interviews or surveys were used.
Advertising and paid tiers carry growth toward 2035
Streaming video revenue in India is expected to reach USD 17.17 billion by 2035, a 14.25% CAGR during 2026–2035, as advertising and paid tiers grow together. Growth should stay strong through 2029 as connected TV homes multiply and cricket keeps drawing record digital audiences. After that, higher paid conversion in smaller towns and better ad targeting will set the pace. Lower data prices and wider 5G coverage would lift viewing, while weaker ad budgets or costly sports rights would slow margins. Smart and connected TVs are expected to gain the most device share through 2035.
Frequently Asked Questions
How big is the India OTT video streaming market?
Which revenue model leads streaming revenue in India?
Which region leads the Indian market?
How many people watch OTT video in India?
How does cricket affect streaming revenue in India?
Why are connected TVs important for Indian platforms?
Who are the leading streaming platforms in India?
What are the main challenges for the market?
Table of Content
Chapter 1 Market Segmentation
- 1.1 Segmentation Framework
- 1.1.1 Product and Service Classification
- 1.1.2 Application and End-Use Classification
- 1.1.3 Technology and Solution Classification
- 1.1.4 Customer and Distribution Channel Classification
- 1.1.5 Geographic Segmentation
- 1.1.6 Market Segment Definitions and Boundaries
- 1.2 By Revenue Model
- 1.2.1 Advertising-Supported Video on Demand
- 1.2.2 Subscription Video on Demand
- 1.2.3 Transactional Video on Demand
- 1.3 By Solution Type
- 1.3.1 Long-Form Video Streaming
- 1.3.2 Live Video Streaming
- 1.3.3 Short-Form Video Streaming
- 1.4 By Device Type
- 1.4.1 Smartphones and Tablets
- 1.4.2 Smart and Connected TVs
- 1.4.3 Computers and Set-Top Boxes
- 1.5 By Deployment Model
- 1.5.1 Standalone OTT Applications
- 1.5.2 Telecom-Bundled Services
- 1.5.3 Aggregator Services
Chapter 2 Introduction
- 2.1 Report Objectives and Scope
- 2.2 Product Definition and Industry Terminology
- 2.3 Market Inclusions and Exclusions
- 2.4 Research Process
- 2.4.1 Primary Research and Expert Interviews
- 2.4.2 Secondary Research and Source Review
- 2.4.3 Top-Down and Bottom-Up Estimation
- 2.4.4 Data Triangulation and Verification
- 2.5 Market Size Measurement Basis
- 2.5.1 2025: USD 4.51 billion → 2035: USD 17.17 billion
- 2.6 Historical and Forecast Reference Periods
- 2.6.1 Historical Period: 2018-2025
- 2.6.2 Base Year: 2025
- 2.6.3 Forecast Period: 2025-2035
- 2.7 Research Assumptions and Limitations
Chapter 3 Executive Summary
- 3.1 Market Snapshot and Key Findings
- 3.2 Base-Year Market Size, 2025
- 3.3 Forecast Market Size, 2035
- 3.4 Revenue and Volume Growth Outlook
- 3.5 Key Demand and Supply Indicators
- 3.6 Leading Market Segments
- 3.7 Fastest-Growing Market Opportunities
- 3.8 Regional Performance Highlights
- 3.9 Technology and Industry Transformation
- 3.10 Competitive Landscape Summary
- 3.11 Analyst View and Strategic Implications
Chapter 4 India Over-the-Top (OTT) Video Streaming Market Trends and Developments
- 4.1 Historical Industry Development, 2018-2025
- 4.2 Recent Market Trends and Developments
- 4.3 Demand and Customer Behavior Trends
- 4.4 Technology and Product Innovation
- 4.5 Artificial Intelligence, Automation and Digitalization
- 4.6 Local Manufacturing and Supply Chain Realignment
- 4.7 Industry Partnerships, Mergers and Acquisitions
- 4.8 Sustainability and Circular Economy Developments
- 4.9 Government and Private Sector Investment Trends
- 4.10 Emerging Business Models and Commercialization
- 4.11 Industry Developments and Announcements
Chapter 5 India Over-the-Top (OTT) Video Streaming Market Production, Supply and Demand Analysis
- 5.1 Demand Trend and Consumption Analysis, 2018-2025
- 5.2 Demand Forecast, 2025-2035
- 5.3 Production and Output Trend, 2018-2025
- 5.4 Production and Output Forecast, 2025-2035
- 5.5 Installed Capacity and Capacity Utilization
- 5.6 Company-Wise Production Plants and Statistics
- 5.6.1 Installed Production Capacity
- 5.6.2 Actual Production
- 5.6.3 Planned Capacity and Expansion Targets
- 5.7 Supply Chain Structure and Procurement Trends
- 5.8 Supply-Demand Gap and Bottlenecks
- 5.9 Import Dependence and Sourcing Structure
- 5.10 Contract Manufacturing and Outsourcing
- 5.11 Regional Supply and Demand Concentration
Chapter 6 India Over-the-Top (OTT) Video Streaming Market Pricing Analysis
- 6.1 Pricing Structure and Measurement
- 6.2 Historical Pricing Trends, 2018-2025
- 6.3 Pricing Outlook, 2025-2035
- 6.4 Average Selling Price and Unit Economics
- 6.5 Pricing by Product and Market Segment
- 6.6 Geographic Pricing Differences
- 6.7 Key Input, Energy, Labor and Logistics Costs
- 6.8 Contract Pricing and Purchasing Models
- 6.9 Pricing Sensitivity and Competitive Positioning
- 6.10 Price, Margin and Profitability Implications
Chapter 7 India Over-the-Top (OTT) Video Streaming Market Dynamics
- 7.1 Market Growth Drivers
- 7.1.1 Demand-Side Drivers
- 7.1.2 Technology and Innovation Drivers
- 7.1.3 Infrastructure and Investment Drivers
- 7.1.4 Regulatory and Policy Drivers
- 7.2 Market Restraints
- 7.2.1 Cost and Affordability Constraints
- 7.2.2 Technology and Adoption Barriers
- 7.2.3 Supply Chain and Operational Constraints
- 7.3 Market Challenges
- 7.3.1 Competitive Pressure and Margin Erosion
- 7.3.2 Skills, Infrastructure and Implementation Gaps
- 7.4 Emerging Market Opportunities
- 7.5 Market Dynamics Impact and Time-Horizon Assessment
Chapter 8 India Over-the-Top (OTT) Video Streaming Value Chain Analysis
- 8.1 Industry Value Chain Overview
- 8.2 Upstream Suppliers and Critical Inputs
- 8.3 Technology and Component Providers
- 8.4 Manufacturing or Service Delivery
- 8.5 Distribution, Channel Partners and Integrators
- 8.6 Downstream Applications and End Users
- 8.7 Value Addition and Profit Pools
- 8.8 Vertical Integration and Outsourcing
- 8.9 Supplier Concentration and Risk
- 8.10 Supply Chain Localization and Resilience
Chapter 9 India Over-the-Top (OTT) Video Streaming Market Regulations and Policies
- 9.1 Relevant Laws, Standards and Compliance Frameworks
- 9.2 Product, Service, Safety and Quality Requirements
- 9.3 Government Policies, Incentives and Subsidies
- 9.4 Imports, Exports and Trade Barriers
- 9.5 Public Procurement and Local Content Requirements
- 9.6 Environmental and Sustainability Compliance
- 9.7 Data Protection, AI and Cybersecurity Compliance
- 9.8 Upcoming Policy Changes and Market Implications
Chapter 10 India Over-the-Top (OTT) Video Streaming Market Hotspots and Opportunities
- 10.1 Market Opportunity Mapping and Growth Hotspots
- 10.2 High-Growth Applications and Customer Groups
- 10.3 Underserved Markets and White-Space Opportunities
- 10.4 Emerging Technology and Product Opportunities
- 10.5 New Capacity and Investment Hotspots
- 10.6 Market Entry and Expansion Opportunities
- 10.7 Distribution and Partnership Opportunities
- 10.8 Near-Term and Long-Term Commercial Potential
- 10.9 Opportunity Attractiveness and Execution Risks
Chapter 11 India Over-the-Top (OTT) Video Streaming Market Outlook, 2025-2035
- 11.1 Market Size and Analysis
- 11.1.1 Revenue (Market Measurement: 2025: USD 4.51 billion → 2035: USD 17.17 billion)
- 11.1.2 Market Volume and Quantity Sold
- 11.1.3 Historical Market Size, 2018-2025
- 11.1.4 Base-Year Market Size, 2025
- 11.2 Market Forecast, 2025-2035
- 11.2.1 Revenue Forecast to 2035
- 11.2.2 Volume Forecast to 2035
- 11.2.3 CAGR and Year-on-Year Growth
- 11.2.4 Incremental Revenue Opportunity
- 11.3 Forecast Assumptions and Scenario Analysis
- 11.3.1 Base-Case Forecast
- 11.3.2 Optimistic and Conservative Scenarios
- 11.3.3 Technology, Pricing and Policy Sensitivities
- 11.4 Market Attractiveness and Growth Outlook
Chapter 12 India Over-the-Top (OTT) Video Streaming Market Segmentation and Outlook
- 12.1 Segmentation Summary and Market Shares, 2025
- 12.2 Largest and Fastest-Growing Segments
- 12.3 By Revenue Model - Market Size and Forecast, 2025-2035
- 12.3.1 Segment Definition and Scope
- 12.3.2 Historical Market Size, 2018-2025
- 12.3.3 Revenue Forecast, 2025-2035
- 12.3.4 Volume Forecast, 2025-2035
- 12.3.5 Base-Year Market Share, 2025
- 12.3.6 Segment CAGR and Growth Drivers
- 12.3.7 Subsegment Market Size and Forecast
- 12.3.7.1 Advertising-Supported Video on Demand
- 12.3.7.2 Subscription Video on Demand
- 12.3.7.3 Transactional Video on Demand
- 12.3.8 Subsegment Pricing and Adoption Trends
- 12.3.9 Leading Suppliers and Competition
- 12.3.10 Regional Demand and Opportunities
- 12.4 By Solution Type - Market Size and Forecast, 2025-2035
- 12.4.1 Segment Definition and Scope
- 12.4.2 Historical Market Size, 2018-2025
- 12.4.3 Revenue Forecast, 2025-2035
- 12.4.4 Volume Forecast, 2025-2035
- 12.4.5 Base-Year Market Share, 2025
- 12.4.6 Segment CAGR and Growth Drivers
- 12.4.7 Subsegment Market Size and Forecast
- 12.4.7.1 Long-Form Video Streaming
- 12.4.7.2 Live Video Streaming
- 12.4.7.3 Short-Form Video Streaming
- 12.4.8 Subsegment Pricing and Adoption Trends
- 12.4.9 Leading Suppliers and Competition
- 12.4.10 Regional Demand and Opportunities
- 12.5 By Device Type - Market Size and Forecast, 2025-2035
- 12.5.1 Segment Definition and Scope
- 12.5.2 Historical Market Size, 2018-2025
- 12.5.3 Revenue Forecast, 2025-2035
- 12.5.4 Volume Forecast, 2025-2035
- 12.5.5 Base-Year Market Share, 2025
- 12.5.6 Segment CAGR and Growth Drivers
- 12.5.7 Subsegment Market Size and Forecast
- 12.5.7.1 Smartphones and Tablets
- 12.5.7.2 Smart and Connected TVs
- 12.5.7.3 Computers and Set-Top Boxes
- 12.5.8 Subsegment Pricing and Adoption Trends
- 12.5.9 Leading Suppliers and Competition
- 12.5.10 Regional Demand and Opportunities
- 12.6 By Deployment Model - Market Size and Forecast, 2025-2035
- 12.6.1 Segment Definition and Scope
- 12.6.2 Historical Market Size, 2018-2025
- 12.6.3 Revenue Forecast, 2025-2035
- 12.6.4 Volume Forecast, 2025-2035
- 12.6.5 Base-Year Market Share, 2025
- 12.6.6 Segment CAGR and Growth Drivers
- 12.6.7 Subsegment Market Size and Forecast
- 12.6.7.1 Standalone OTT Applications
- 12.6.7.2 Telecom-Bundled Services
- 12.6.7.3 Aggregator Services
- 12.6.8 Subsegment Pricing and Adoption Trends
- 12.6.9 Leading Suppliers and Competition
- 12.6.10 Regional Demand and Opportunities
- 12.7 Segment Growth Comparison
- 12.8 Segment Attractiveness and Priority Matrix
Chapter 13 India Over-the-Top (OTT) Video Streaming Geographic Market Outlook, 2025-2035
- 13.1 Domestic Market Distribution and Demand Clusters
- 13.2 State- or Province-Wise Market Size and Forecast, 2025-2035
- 13.3 City and Metropolitan Market Outlook
- 13.4 Industrial, Manufacturing and Commercial Clusters
- 13.5 Geographic Concentration of Key End Users
- 13.6 Local Pricing and Purchasing Differences
- 13.7 Domestic Production Facilities and Capacity Map
- 13.8 Local Infrastructure and Project Pipeline
- 13.9 State-Level Policy and Incentive Differences
- 13.10 Subnational Investment Hotspots and Opportunities
- 13.11 Distribution and Logistics Networks
- 13.12 Domestic Competitive Footprint
Chapter 14 India Over-the-Top (OTT) Video Streaming Technology, Innovation and Sustainability Outlook
- 14.1 Technology Landscape and Maturity
- 14.2 Product, Process and Service Innovation
- 14.3 AI, Automation and Digital Tools in the Industry
- 14.4 Technology Adoption and Performance Benchmarking
- 14.5 Innovation Pipeline and R&D Investment
- 14.6 Patent and Intellectual Property Trends
- 14.7 Energy Efficiency and Resource Management
- 14.8 Sustainability, Recycling and Circularity
- 14.9 Technology Roadmap, 2025-2035
- 14.10 Risks of Obsolescence and Technology Substitution
Chapter 15 India Over-the-Top (OTT) Video Streaming Market Key Strategic Imperatives
- 15.1 Growth and Market Entry Priorities
- 15.2 High-Return Products and Segments
- 15.3 Pricing, Profitability and Cost Optimization
- 15.4 Technology Investment and Product Differentiation
- 15.5 Supply Chain Localization and Resilience
- 15.6 Distribution and Customer Acquisition
- 15.7 Partnership, Acquisition and Capacity Strategy
- 15.8 Regional Expansion Priorities
- 15.9 Short-, Medium- and Long-Term Actions
Chapter 16 Competition Outlook
- 16.1 Industry Competition Characteristics
- 16.2 Market Structure and Concentration
- 16.3 Market Share and Competitive Positioning, 2025
- 16.4 Company-Wise Revenue and Product Benchmarking
- 16.5 Production and Service Capacity Benchmarking
- 16.6 Technology, Pricing and Differentiation
- 16.7 Regional Footprint and Distribution Strength
- 16.8 Mergers, Acquisitions and Strategic Alliances
- 16.9 New Entrants and Competitive Threats
- 16.10 Porter's Five Forces and Industry Attractiveness
- 16.11 Competitive Outlook, 2025-2035
Chapter 17 Company Profiles
- 17.1 Company Coverage and Selection Criteria
- 17.2 YouTube India
- 17.2.1 Business Description
- 17.2.2 Company Ownership and Geographic Presence
- 17.2.3 Product and Service Portfolio
- 17.2.4 Manufacturing and Operating Footprint
- 17.2.5 Production Capacity and Expansion Plans
- 17.2.6 Financial Performance and Investment
- 17.2.7 Market Share and Competitive Position
- 17.2.8 Technology and Innovation Capabilities
- 17.2.9 Strategic Alliances or Partnerships
- 17.2.10 Recent Developments
- 17.2.11 Growth Strategy and Outlook
- 17.3 JioHotstar
- 17.4 Netflix India
- 17.5 Amazon Prime Video India
- 17.6 Amazon MX Player
- 17.7 SonyLIV
- 17.8 ZEE5
- 17.9 Sun NXT
- 17.10 aha
- 17.11 STAGE
- 17.12 Other Relevant Market Participants
Note: Every listed company is profiled on the structure shown under the first company. The company list is preliminary and may change based on research findings, market developments, data availability and client requirements.
Chapter 18 Disclaimer
- 18.1 Research and Forecast Disclaimer
- 18.2 Data Source and Estimation Limitations
Note: The depth of individual sections depends on data availability for this market. Volume, capacity, trade and other unit-based metrics are included where applicable.

