
Imports and convenience formats reshape regional supply
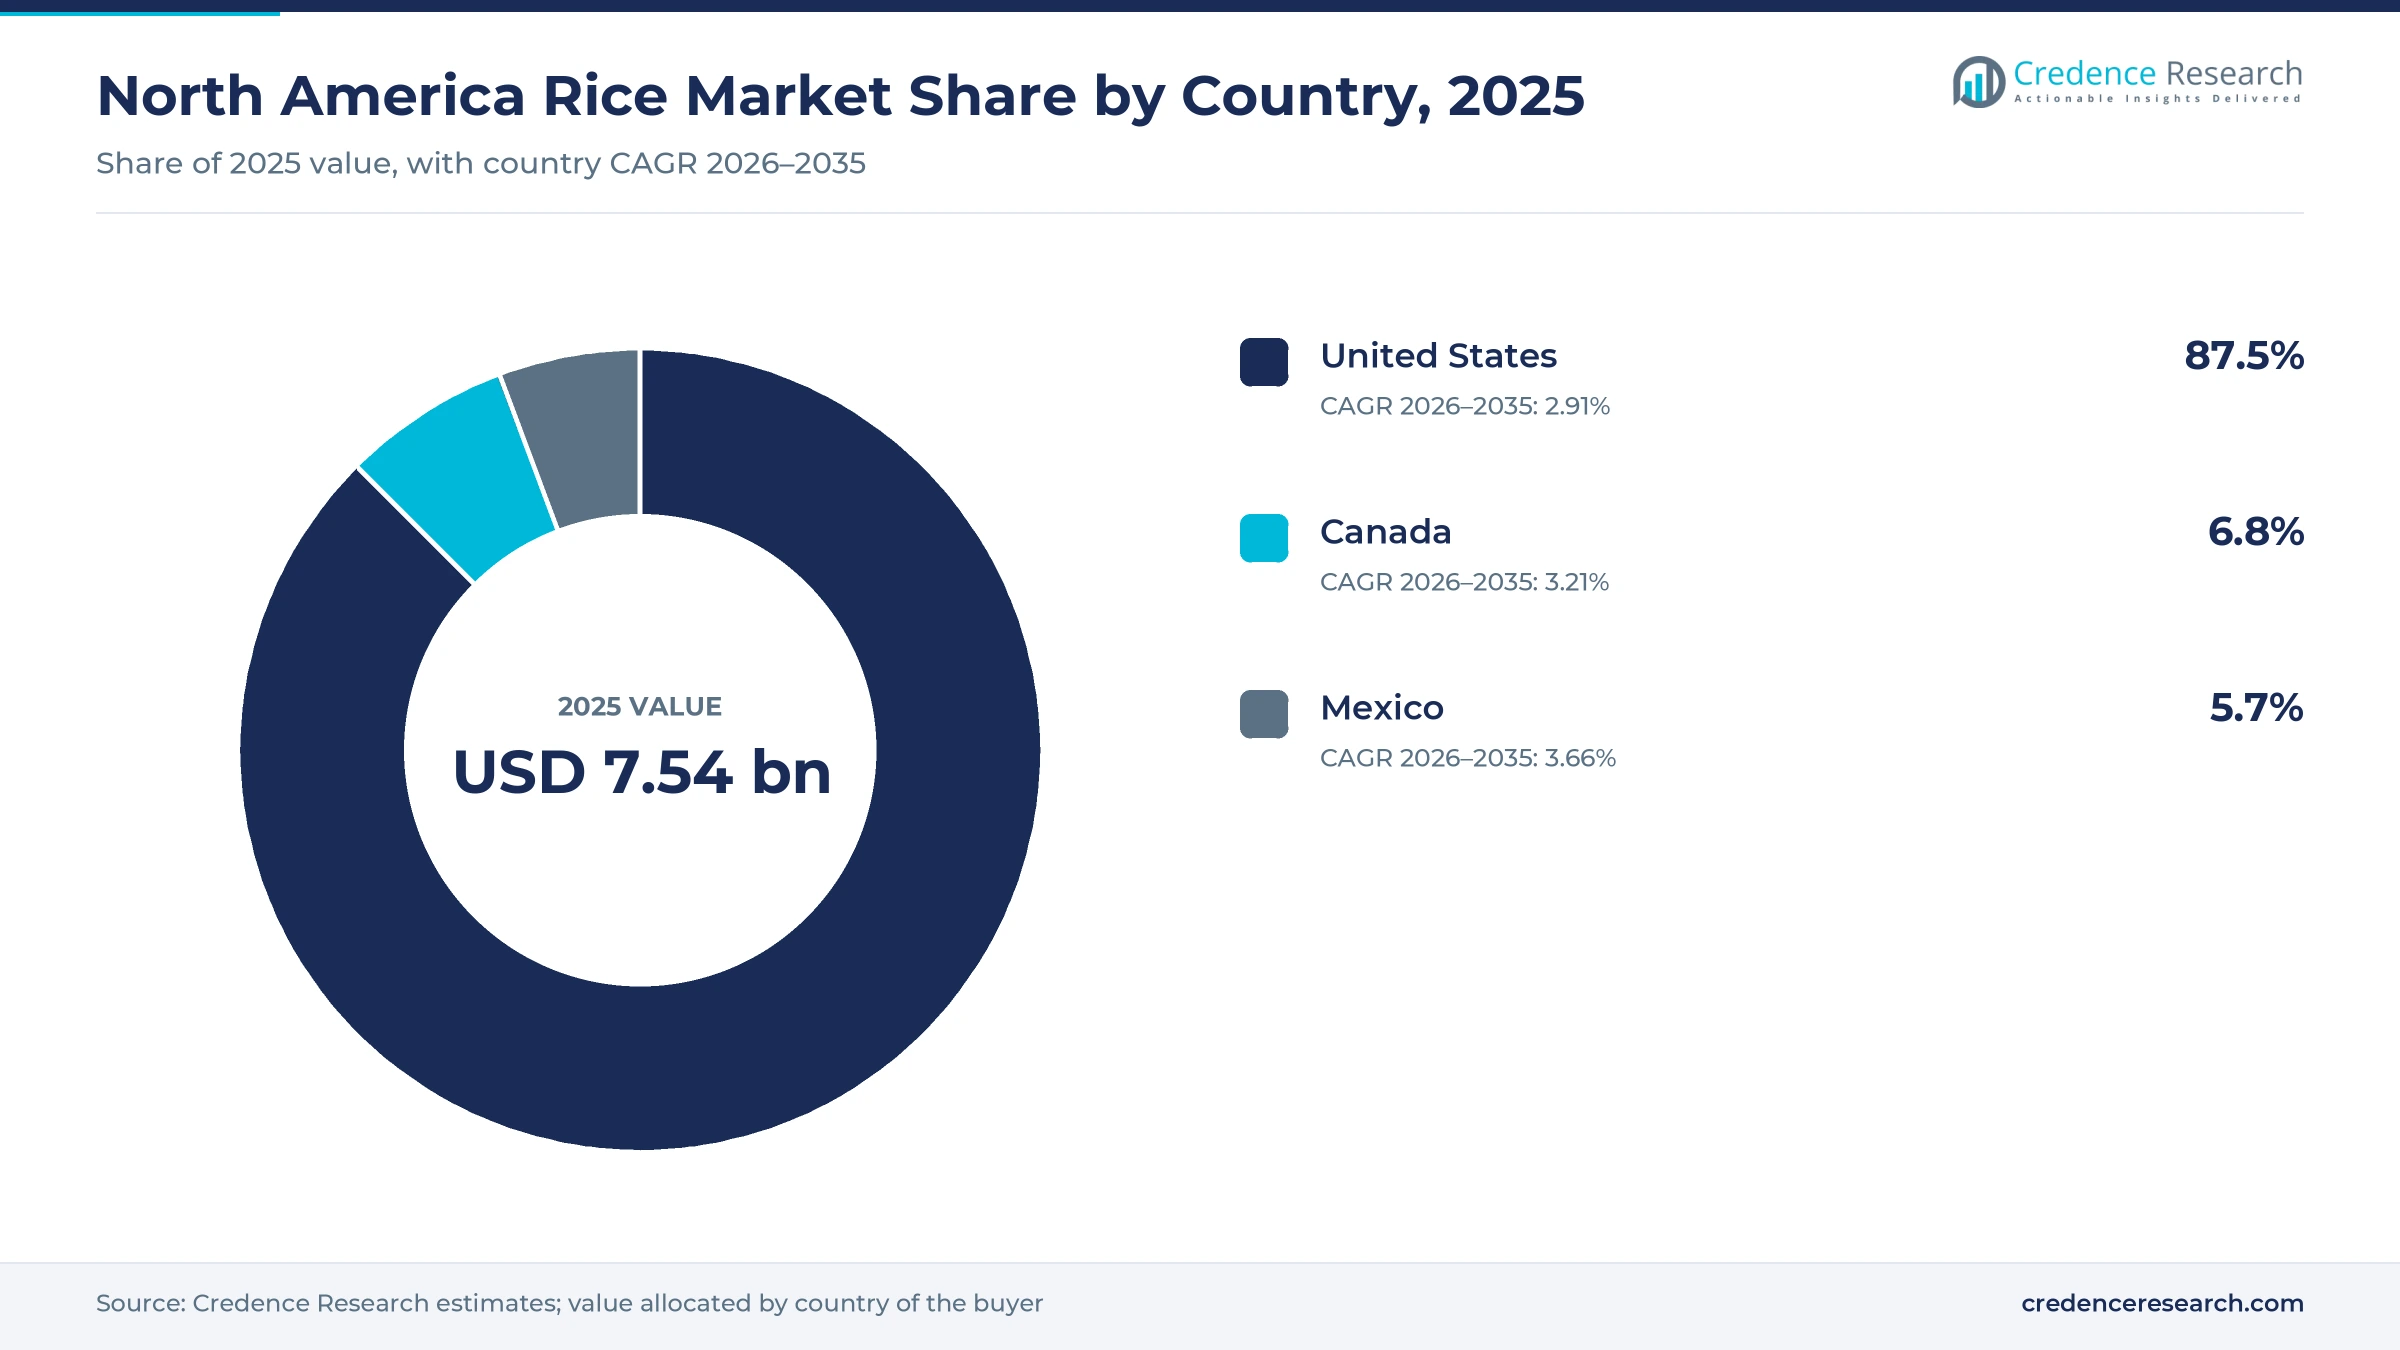
The North America rice market was valued at USD 7.54 billion in 2025 and is projected to increase from USD 7.80 billion in 2026 to USD 10.15 billion by 2035, registering a CAGR of 2.97% during 2026–2035. Demand rests on staple table use, aromatic varieties bought by South Asian households, foodservice menus and processed food, with long-grain varieties taking most of the volume. The United States held the largest regional share, 87.5% in 2025, because it is both the largest consumer and the only large producer. Mexico is the fastest-growing country at 3.66% a year, as a population of more than 134 million relies heavily on imported grain. U.S. supply has changed sharply, with planted area down 28% in 2026 and USDA projecting record imports of 49.8 million hundredweight for 2026/27. Processors are meanwhile adding microwave pouch and cup capacity in Tennessee and Ohio, which moves value toward pre-cooked formats.
What does the North America rice market count, and how do buyers purchase it?
The market counts milled rice sold for human food, ingredient use and pet food in the United States, Canada and Mexico, valued at the first point of sale to retail, foodservice and industrial buyers. Households buy packaged bags and microwave pouches through grocers, while restaurants, institutions and food plants buy in bulk from mills and distributors.
Export shipments from U.S. mills, seed rice and rice-based finished foods such as cereal or crackers fall outside the count. The value chain runs from farms and drying facilities through mills, parboiling and retort plants to brand owners, importers and repackers.
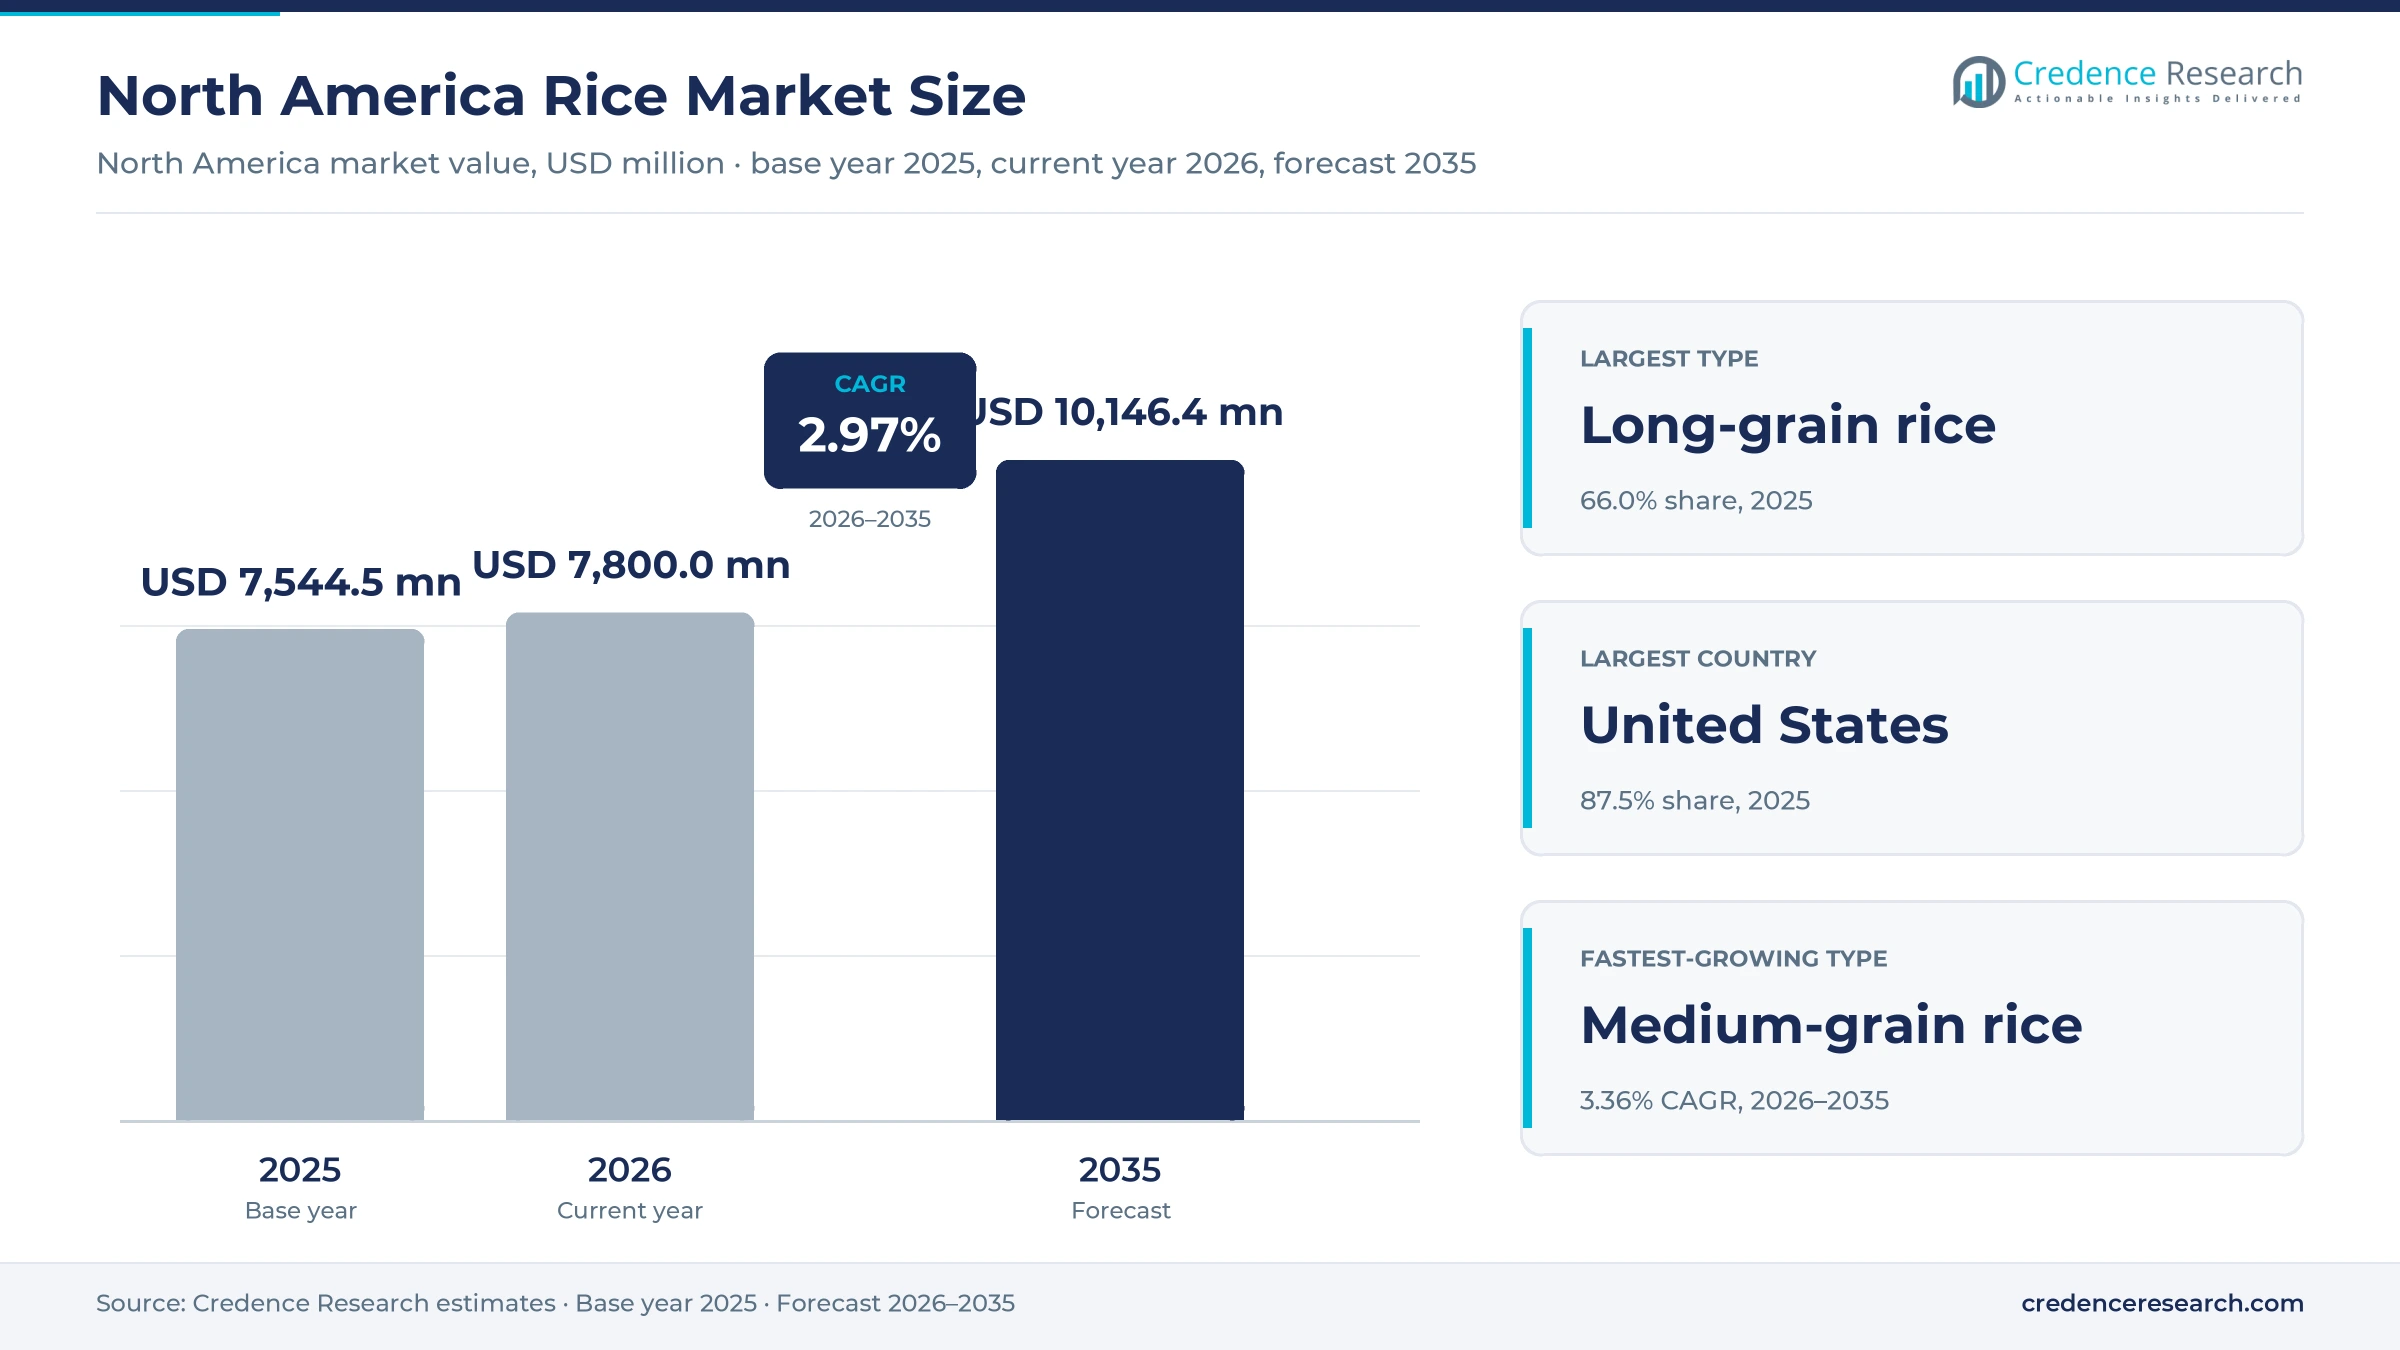
North America Rice Market Insights
- The market grows from USD 7.54 billion in 2025 to USD 10.15 billion by 2035 at 2.97%, with price and format mix adding more to value than volume does.
- The United States held 87.5% of regional value in 2025, while Mexico expands fastest because imports supply about 85% of its rice consumption.
- Long-grain rice led product types with 66.0% of 2025 value, supported by 117.0 million hundredweight of projected 2026/27 U.S. domestic use.
- U.S. planted rice area fell 28% to 2.017 million acres in 2026, the lowest since the 1970s, and Riceland is temporarily closing nine drying facilities for the crop year.
- Dainty Foods committed an initial US$85 million to a plant in Ohio in March 2026, which adds private-label competition to Riviana's $80.6 million Memphis project.
Long-grain table rice anchors category value
Why does long-grain rice lead and medium-grain rice gain value?
Based on product type, the market is categorized into long-grain rice, medium-grain rice, short-grain rice and broken rice. Long-grain rice led with 66.0% of 2025 value because it dominates U.S. consumption, taking 117.0 million hundredweight of 2026/27 domestic use against 31.0 million for medium and short grains, as the USDA Economic Research Service projected in October 2026. Medium-grain rice grows fastest at 3.36% a year as its price premium supports value, with Rice Farming reporting in July 2026 a California medium- and short-grain farm price projection of $20.00 per hundredweight, while USDA projected $14.00 for long-grain rice in October 2026.
Why does table rice lead while ingredient use gains share?
Based on application, the market is categorized into table rice, food ingredient processing and pet food manufacturing. Table rice led with 62.0% of 2025 value because direct food use took 54.7% of U.S. domestic milled shipments between August 2023 and July 2024, according to the USA Rice Domestic Usage Report. Food ingredient processing grows fastest at 3.26% a year as processed uses, which include beer, sake and flour, rose to 45.3% of those shipments from 37.8% a year earlier. An earlier Arkansas Business profile also noted that broken kernels from Producers Rice Mill go into pet food, which ties that application to milling output.
Why does conventional milling lead while pre-cooking expands?
Based on technology, the market is categorized into conventional milling, parboiling and pre-cooking. Conventional milling led with 71.0% of 2025 value because it remains the standard route for bulk grades, and a USDA Agricultural Marketing Service invitation for April to June 2025 delivery sought 8.36 million pounds of rice, of which parboiled brown rice made up only 1.3 million pounds. Pre-cooking grows fastest at 4.18% a year as processors fund new lines, including Riviana's $80.6 million Memphis project and the initial US$85 million that Dainty Foods committed to Batavia, Ohio, in March 2026.
Why does grocery retail lead while digital retail grows fastest?
Based on distribution channel, the market is categorized into grocery retail, specialist retail, digital retail and business supply. Grocery retail led with 47.0% of 2025 value because large grocers anchor packaged volume through store brands, and JobsOhio reported in March 2026 that Dainty Foods makes store-brand microwave packets for Walmart, Safeway and IGA. Digital retail grows fastest at 4.94% a year as Talk Business & Politics reported in June 2026 a 19% rise in U.S. online grocery spending during the first quarter of 2026, with Walmart approaching 40% of those sales.
| Segment Group | Leading Sub-segment | Share, 2025 | Fastest-growing Sub-segment | CAGR, 2026–2035 |
|---|---|---|---|---|
| By Product Type | Long-grain rice | 66.0% | Medium-grain rice | 3.36% |
| By Application | Table rice | 62.0% | Food ingredient processing | 3.26% |
| By Technology | Conventional milling | 71.0% | Pre-cooking | 4.18% |
| By Distribution Channel | Grocery retail | 47.0% | Digital retail | 4.94% |
Request a Free Sample
Fill in your details and we'll send you a free sample report.
- Sample data tables & charts
- Research methodology
Varietal demand and new pouch lines lift category value
Demographic anchors and varietal demand
Household demand is tied to communities that cook rice daily and buy specific varieties, which supports aromatic prices above commodity grades. South Asian populations in Canada reached nearly 2.6 million in 2021, or 7.1% of the country, and Statistics Canada projects 4.7 million to 6.5 million by 2041. This explains why basmati is the top-selling variety by volume in Canada, according to Canadian Grocer in August 2025. In the United States, long-grain imports are mostly jasmine from Thailand and basmati from India and Pakistan, according to USDA. As a result, LT Foods' Royal brand held 61% of U.S. basmati imports, Business Standard reported in December 2025. Mexico adds a steadier staple base at 6.5 kilograms per person a year, according to BigMint's June 2026 summary of USDA data.
Convenience processing and format expansion
Ready-to-heat formats raise the value of each pound sold, so processors are investing in capacity rather than in new milling. Riviana Foods committed $80.6 million to its Memphis plant, doubling Minute cup capacity by April 2024, with a second phase of about 65,000 square feet for pouch lines due in early 2025, serving Tilda, Carolina and Mahatma in the United States and Canada. In turn, Dainty Foods bought a 250,000-square-foot site in Batavia, Ohio and plans up to 250 million retort units a year once fully operational. Riviana added Carolina basmati and red beans pouches that heat in 90 seconds on Sept. 23, 2025. These products compete directly with chilled and frozen ready meals for weekday dinners, which is why Pre-cooking grows fastest at 4.18% a year.
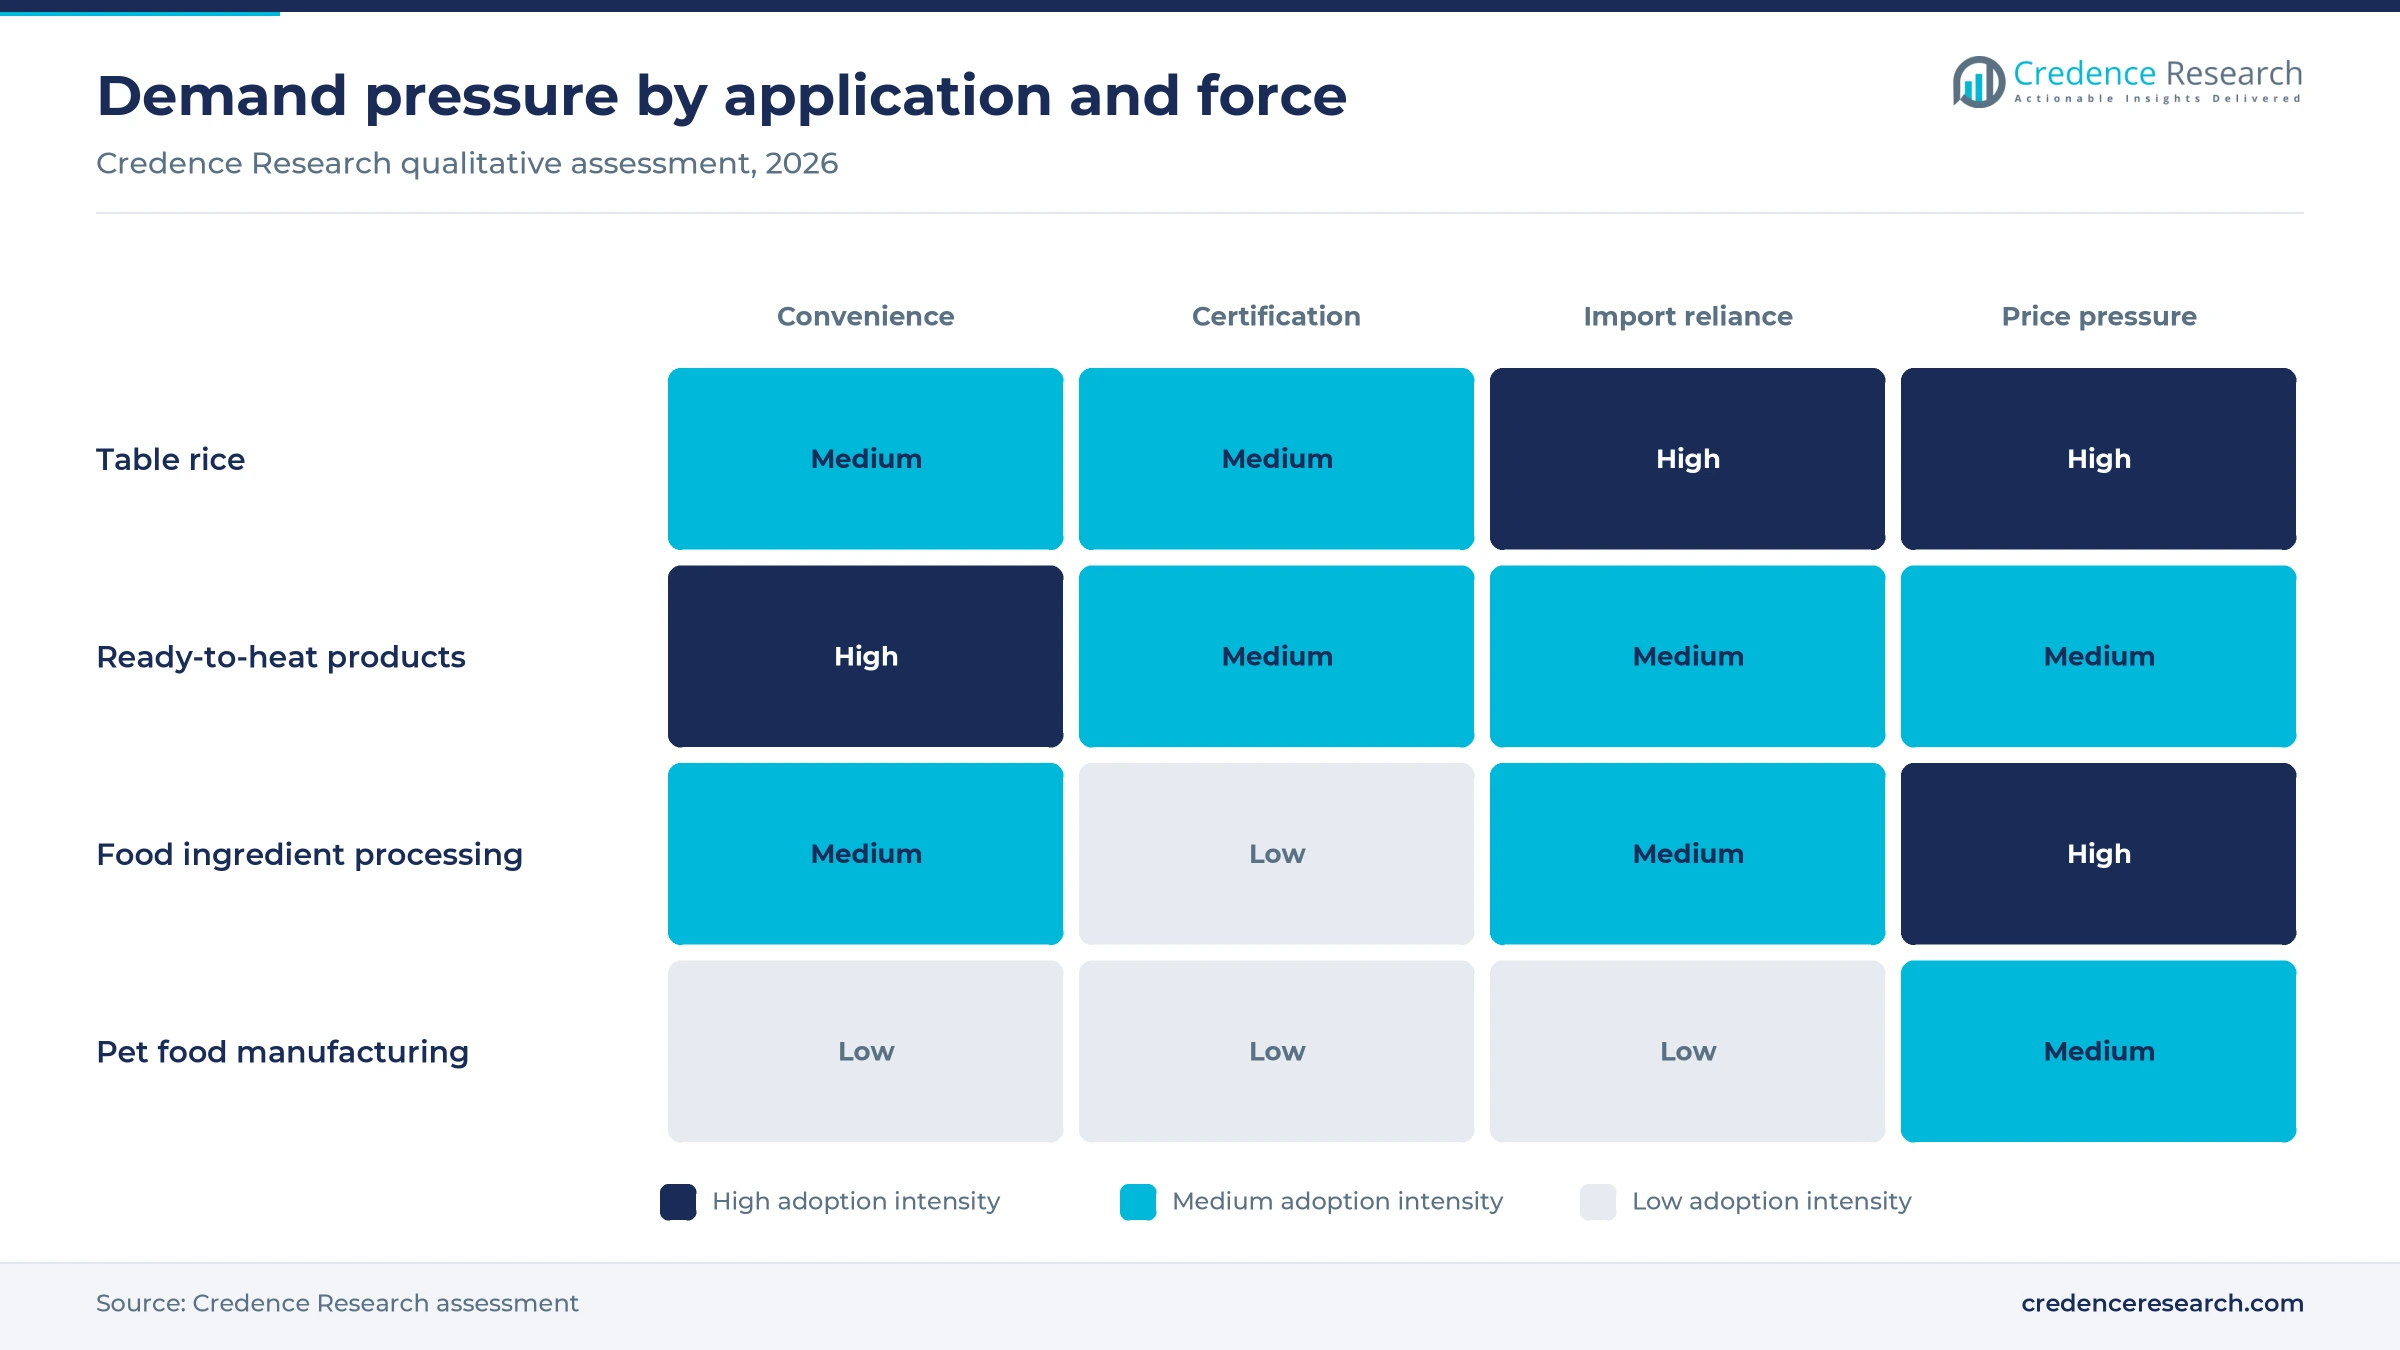
Certified sourcing and packaged market development
Certification and origin claims let packers charge more in a category where bulk rice competes mainly on price. Lundberg Family Farms said in March 2024 that it had certified more than 8,500 acres with the Regenerative Organic Alliance, about four times the prior year, and that more than 70 products would use that rice. Its plan to convert the remaining organic acreage by 2027 extends the supply of certified organic grains for premium shelves. Origin also sells, because Riceland Foods told buyers at the 2026 National Restaurant Association Show that its rice is grown in Arkansas and Missouri, according to USA Rice. In May 2025, FoodBev reported that California-grown rice tested 32% lower in heavy metals in a Healthy Babies Bright Futures study, which supports that premium.
Processed food and pet food buyers widen demand
Industrial buyers now take a much larger part of U.S. rice, which steadies mill volume when table demand softens. USA Rice counted 73.2 million hundredweight of domestic milled shipments for the year to July 2024, up 5.5%, and processed uses reached 45.3% of that total against 37.8% a year earlier. Those uses include pet food, beer, sake and flour, so one mill can place several grades with different customers. An earlier Arkansas Business profile described Producers Rice Mill as selling in roughly equal parts to retail, foodservice and industrial buyers. Public buying adds another outlet, as a USDA Agricultural Marketing Service invitation sought 8.36 million pounds for domestic food programs in January 2025. This breadth explains why Food ingredient processing grows at 3.26% a year.
Record imports and store brands redraw competition
A shift toward imports as U.S. production falls
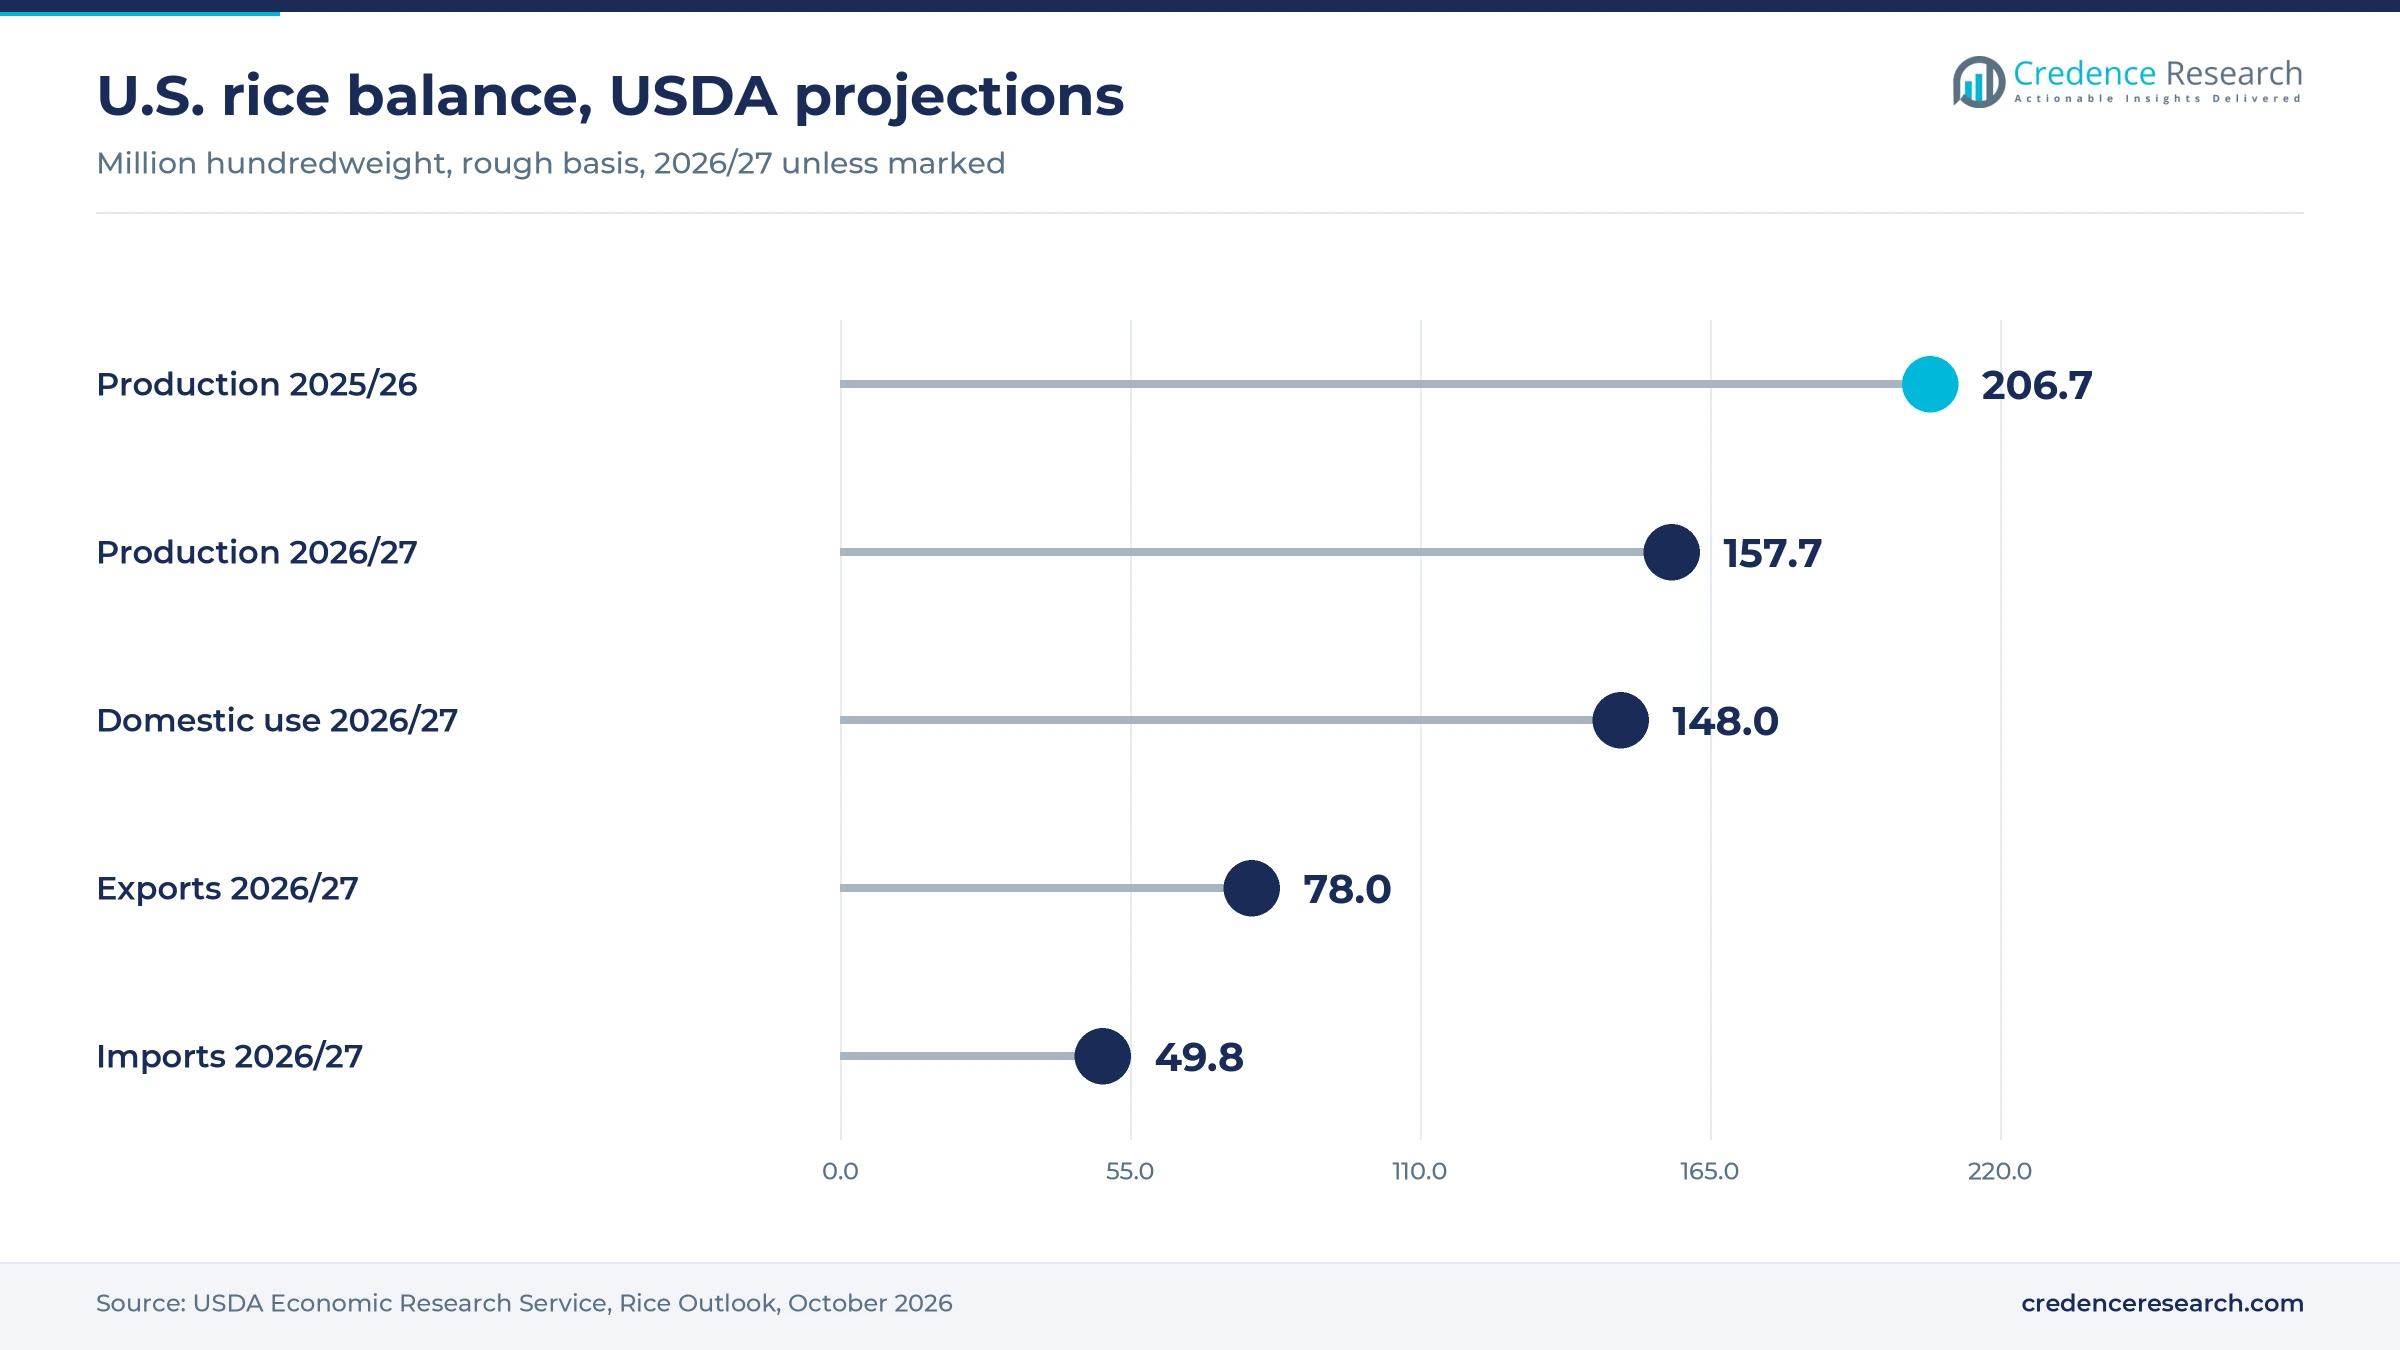
U.S. supply is moving toward imported grain, and this changes who sets prices on the shelf. USDA Economic Research Service data from October 2026 put 2026/27 production at 157.7 million hundredweight, down from 206.7 million, while imports should reach a record 49.8 million. Long-grain imports alone should reach a record 43.0 million hundredweight, and long-grain output is the lowest since 1987/88. As a result, the all-rice farm price projection climbed to $15.20 per hundredweight from $12.40. USA Rice said in July 2026 that it is urging a Section 301 investigation into more than 1.5 million metric tons of annual imports, so trade policy could change this shift.
Rise of store brands and online rice purchases
Private-label microwave rice and online ordering are challenging the shelf position of national brands. JobsOhio reported in March 2026 that Dainty Foods makes store-brand packets for Walmart, Safeway and IGA, and its Ohio plant is due to open in the first quarter of 2027. This matters because Walmart is approaching 40% of U.S. online grocery sales, according to Talk Business & Politics in June 2026. Online spending rose 19% in the first quarter of 2026, and same-day orders made up nearly 80% of delivery orders. Brands are responding, as Riviana listed Instacart among the outlets for its September 2025 Carolina pouches. Digital retail therefore grows at 4.94% a year, the fastest of the channels.
Opportunity for U.S. and regional suppliers in Mexico
Mexico offers an open door for mills because domestic output covers only about 15% of consumption, according to BigMint's June 2026 summary of USDA data. Consumption should reach 1.01 million metric tons in 2026/27, against rough rice output of 279,000 metric tons. USA Rice reported in January 2026 that Mexico restored a 9% duty on paddy rice with a 200,000-ton quota, while U.S. rice stays exempt under trade preferences. The opening is contested, since the United States supplied 39% of imports from October 2025 to April 2026, ahead of Uruguay at 36% and Brazil at 24%. Paddy made up 73% of those imports, which favors suppliers that work with local mills. This helps explain why Mexico is the fastest-growing country in the North America rice market.
Opportunity in U.S.-grown aromatic and foodservice rice
Trade costs on imported aromatics create an opening for domestic jasmine and for chefs who want a U.S. origin story. USA Rice said in July 2026 that it had discussed U.S. jasmine promotions and crop insurance options for aromatic rice with Riceland's board, which shows growers are preparing. At the 2026 National Restaurant Association Show in Chicago, Della Rice promoted premium Arkansas-grown jasmine to foodservice buyers and won a Taste of the Show award. Riceland also markets parboiled options that hold longer on a steam table. USA Rice found retail and foodservice evenly split in its 2022-23 report, so a modest menu switch would matter. USDA's projection of record long-grain imports at 43.0 million hundredweight for 2026/27 shows how much volume domestic jasmine could target.
Shrinking U.S. acres and trade costs squeeze margins
Shrinking U.S. acreage strains mills and growers
U.S. planted area fell 28% to 2.017 million acres in 2026, the lowest since the 1970s, according to Rice Farming in July 2026. This reduces throughput at the plants that serve the whole region, and Riceland is temporarily closing nine of its 23 drying facilities for the crop year. Producers Rice Mill is also considering idling two more drying sites. Buyers then face tighter long-grain supply and higher prices, so packers may need to widen their origin lists and contract earlier.
Tariffs raise landed cost of aromatic varieties
Importers of basmati and jasmine carry most of the tariff risk, because Indian suppliers hold more than 80% of the U.S. basmati market, according to Business Standard in December 2025. That report cited a 50% U.S. tariff then applied to Indian shipments, and LT Foods shares fell 7% on Dec. 9, 2025. The Week reported in July 2026 that Indian goods now face a 10% Section 301 duty, without addressing rice separately. Importers can respond by widening origins and adding domestic jasmine lines.
Import dependence leaves Canadian shelves exposed
Canada grows no rice commercially and relies on imports, which passes every outside shock to shoppers. Canadian Grocer reported in August 2025 that Statistics Canada showed rice prices up 48.9% since January, the fastest rise among grocery foods. A two-kilogram bag of white rice cost close to C$10, partly after Canadian tariffs on U.S. rice that were later lifted. Value-tier households feel this first, while Dainty, described as the country's only rice miller, limits risk by importing from several countries.
Arsenic findings pressure brands and retailers
Healthy Babies Bright Futures tested 145 rice samples and found more than one in four above the 100 ppb level that FDA set for infant rice cereal, FoodBev reported in May 2025. That limit does not apply to table rice, but the finding still raises questions from parents, retailers and institutional buyers. Brands selling on purity face more testing costs and closer label scrutiny. In response, suppliers can promote lower-testing origins, since California rice and Thai jasmine both measured 32% lower.
The United States dominates while Mexico grows fastest
| Country | Value, 2025 (USD billion) | Share, 2025 | CAGR, 2026–2035 |
|---|---|---|---|
| United States | 6.60 | 87.5% | 2.91% |
| Canada | 0.51 | 6.8% | 3.21% |
| Mexico | 0.43 | 5.7% | 3.66% |
United States holds the largest share through scale and mix
The United States held 87.5% of 2025 value and grows at 2.91% a year, because it combines large-scale use with the region's main milling and brand base. USDA projects 148.0 million hundredweight of domestic use for 2026/27, down from 164.3 million, which limits volume growth in the near term. Higher farm prices and microwave formats offset part of that decline in value terms. Riceland alone has more than 5,500 owner members, according to USA Rice, which shows the depth of the country's supply base.
Canada buys aromatic rice through imports and one domestic miller
Canada held 6.8% of 2025 value and grows at 3.21% a year, helped by a South Asian population that Statistics Canada expects to reach as much as 6.5 million by 2041. All supply is imported, because no rice is commercially grown in the country. Dainty, which Canadian Grocer describes as Canada's only rice milling facility, has invested more than C$28 million in Windsor, Ontario, over five years, according to the company. Riviana's Memphis pouch lines were also designed to serve Canadian shoppers, so cross-border packaged trade remains important.
Mexico grows fastest as imports fill a large supply gap
Mexico held 5.7% of 2025 value and grows at 3.66% a year, the fastest in the region, because a large import program supports the value of a steady staple. BigMint's summary of USDA data shows 2026/27 imports of 830,000 metric tons and harvested area rising to 41,000 hectares from 39,000. Campeche is the largest producer, with expansion expected in Jalisco, Tabasco and Michoacan. The first auction of the 200,000-ton paddy quota was canceled, which left that volume unallocated in mid-2026.
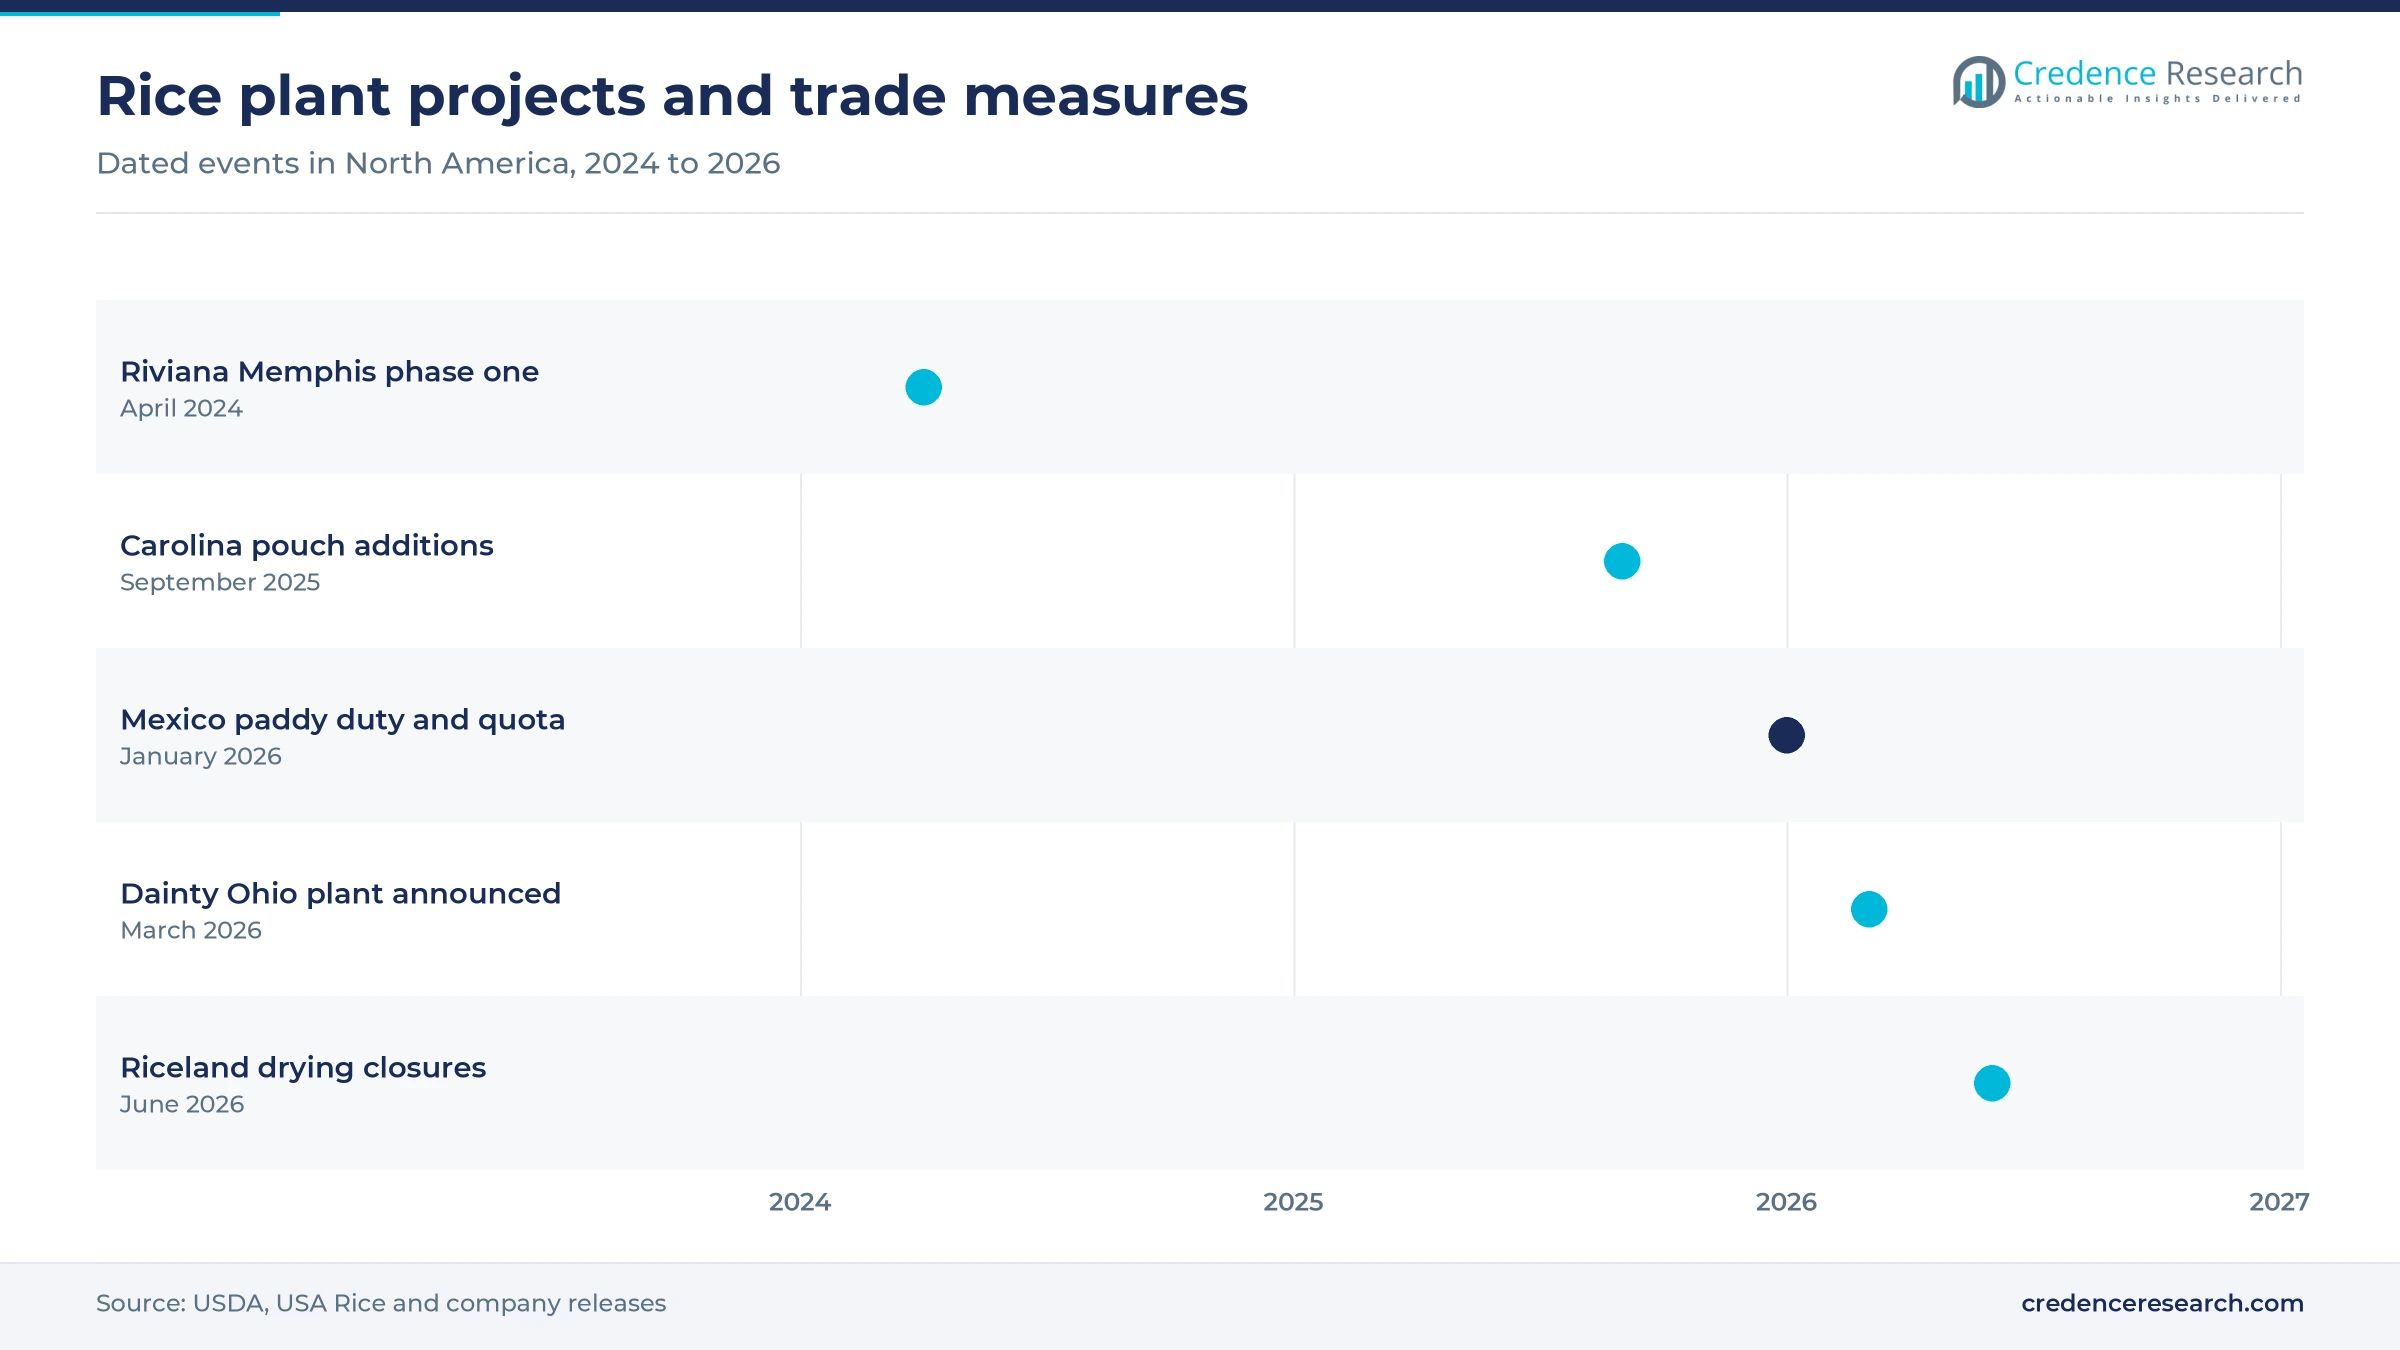
Plant projects and trade measures mark 2024 to 2026
| Development | Status and market relevance |
|---|---|
| In April 2024, Riviana Foods completed the first phase of its $80.6 million Memphis, Tennessee, project and doubled Minute cup capacity. | Second phase of pouch lines for the U.S. and Canada was due in early 2025 |
| In September 2025, Riviana Foods added Carolina Ready to Heat Basmati and Red Beans and Rice pouches. | On sale through Instacart and Northeast grocers |
| In January 2026, Mexico restored a 9% duty on paddy rice and set a 200,000-ton quota through the end of 2026. | U.S. rice remains exempt under trade preferences |
| In March 2026, Dainty Foods announced a first U.S. plant in Batavia, Ohio, with an initial investment of US$85 million. | Phase one targeted for the first quarter of 2027 |
| In June 2026, Riceland Foods announced that it would temporarily close nine drying facilities for the 2026 crop year. | USA Rice cited the smallest U.S. rice area since the early 1970s |
Retort lines and field practices change processing
- Conventional milling removes hulls and bran to produce white and brown grades, and it relies on milling machinery that also separates the broken kernels sold to pet food and flour buyers.
- Parboiling steams rice before milling, and Riceland markets parboiled options for kitchens that need rice to hold longer on a steam table.
- Pre-cooking and retort seals cooked rice in pouches, cups or bowls, and Dainty Foods plans these three formats at its Ohio plant for the U.S. market.
- Water-managed growing covers field methods such as the Dry Up weed approach, which Lundberg says can cut global warming potential by 49% against continuous flooding.
Need a Custom Version of This Report?
Tailor the scope, geography, or segments to your exact requirements.
- Custom geography or segment scope
- Direct access to our analyst team
Cooperatives and brand owners compete on sourcing
Competition in the North America rice market splits between farmer-owned mills, multinational brand owners, importers of aromatic varieties and private-label packers. Riceland Foods and Producers Rice Mill compete on secure Arkansas-area supply and the ability to serve retail, foodservice and industrial accounts from one network. Riviana Foods relies on brands such as Minute, Carolina and Mahatma and on its Memphis ready-to-serve capacity. LT Foods holds strong import positions through Royal in basmati and Golden Star in jasmine, which also exposes it to tariff changes. Lundberg Family Farms competes through certified California sourcing rather than through scale, and its regenerative organic line targets premium shelves. New pressure comes from Dainty Foods, which enters the United States with private-label retort capacity in 2027. As acreage falls, access to grain and multiple origins matters as much as brand strength, so companies with a wider sourcing base hold an advantage over single-origin mills.
Companies profiled and their roles in this market
| Company | Type | Role in the market |
|---|---|---|
| Riceland Foods | Farmer-owned cooperative | Largest U.S. rice cooperative with more than 5,500 owner members, Stuttgart, Arkansas |
| Riviana Foods | Brand owner and processor | Minute, Carolina and Mahatma brands, $80.6 million Memphis expansion |
| LT Foods | Importer and brand owner | Royal basmati and Golden Star jasmine brands in the United States |
| Producers Rice Mill | Farmer-owned cooperative | Milled, parboiled, brown and instant rice, with broken kernels sold into pet food |
| Lundberg Family Farms | Grower and brand owner | Richvale, California, grower of about 70% of the state's certified regenerative organic rice |
Supply stress favors processors with varied origins
Credence Research's view is that the next few years of the North America rice market will reward companies that can move grain between origins and formats. The USDA's October 2026 figures show record imports alongside the lowest long-grain output since 1987/88, so purely domestic suppliers face a thinner base. At the same time, retort capacity in Tennessee and Ohio raises the value of each pound and gives grocers more store-brand options. Mills that combine U.S. sourcing claims with parboiled or pouch products should hold margin better than bulk sellers when prices swing.
How the regional value and splits were estimated
The report uses 2025 as the base year and 2035 as the forecast year. The market values come from the Credence Research model and were compared against a top-down check of USDA use data and blended prices. Segment and country splits are Credence Research estimates built from public shipment, trade and price data. Sources are USDA and Statistics Canada publications, trade association releases, company announcements and named trade press, and no interviews or surveys were conducted for this edition.
Value-added formats carry growth through 2035
The North America rice market is expected to reach USD 10.15 billion by 2035, growing at 2.97% during 2026–2035, with pre-cooked formats and aromatic varieties adding more value than volume. Mexico should keep importing most of its rice, with USDA data placing 2026/27 demand at 1.01 million metric tons, while Canadian demand follows its South Asian population growth. U.S. acreage is the main uncertainty, because a recovery would ease prices while a further decline would deepen import reliance. Over the period, value should keep shifting toward certified, ready-to-heat and store-brand products sold through large grocers and online platforms.
Frequently Asked Questions
How big is the North America rice market?
Which country leads the market?
Which country grows fastest?
Which product type leads?
Why are pre-cooked products growing?
What is happening to U.S. rice supply?
How do tariffs affect the market?
Who are the main companies?
Table of Content
Chapter 1 Market Segmentation
- 1.1 Segmentation Framework
- 1.1.1 Product and Service Classification
- 1.1.2 Application and End-Use Classification
- 1.1.3 Technology and Solution Classification
- 1.1.4 Customer and Distribution Channel Classification
- 1.1.5 Geographic Segmentation
- 1.1.6 Market Segment Definitions and Boundaries
- 1.2 By Product Type
- 1.2.1 Long-grain rice
- 1.2.2 Medium-grain rice
- 1.2.3 Short-grain rice
- 1.2.4 Broken rice
- 1.3 By Application
- 1.3.1 Table rice
- 1.3.2 Food ingredient processing
- 1.3.3 Pet food manufacturing
- 1.4 By Technology
- 1.4.1 Conventional milling
- 1.4.2 Parboiling
- 1.4.3 Pre-cooking
- 1.5 By Country
- 1.5.1 United States
- 1.5.2 Canada
- 1.5.3 Mexico
Chapter 2 Introduction
- 2.1 Report Objectives and Scope
- 2.2 Product Definition and Industry Terminology
- 2.3 Market Inclusions and Exclusions
- 2.4 Research Process
- 2.4.1 Primary Research and Expert Interviews
- 2.4.2 Secondary Research and Source Review
- 2.4.3 Top-Down and Bottom-Up Estimation
- 2.4.4 Data Triangulation and Verification
- 2.5 Market Size Measurement Basis
- 2.5.1 2025: USD 7.54 billion → 2035: USD 10.15 billion
- 2.6 Historical and Forecast Reference Periods
- 2.6.1 Historical Period: 2018-2025
- 2.6.2 Base Year: 2025
- 2.6.3 Forecast Period: 2025-2035
- 2.7 Research Assumptions and Limitations
Chapter 3 Executive Summary
- 3.1 Market Snapshot and Key Findings
- 3.2 Base-Year Market Size, 2025
- 3.3 Forecast Market Size, 2035
- 3.4 Revenue and Volume Growth Outlook
- 3.5 Key Demand and Supply Indicators
- 3.6 Leading Market Segments
- 3.7 Fastest-Growing Market Opportunities
- 3.8 Regional Performance Highlights
- 3.9 Technology and Industry Transformation
- 3.10 Competitive Landscape Summary
- 3.11 Analyst View and Strategic Implications
Chapter 4 North America Rice Market Trends and Developments
- 4.1 Historical Industry Development, 2018-2025
- 4.2 Recent Market Trends and Developments
- 4.3 Demand and Customer Behavior Trends
- 4.4 Technology and Product Innovation
- 4.5 Artificial Intelligence, Automation and Digitalization
- 4.6 Local Manufacturing and Supply Chain Realignment
- 4.7 Industry Partnerships, Mergers and Acquisitions
- 4.8 Sustainability and Circular Economy Developments
- 4.9 Government and Private Sector Investment Trends
- 4.10 Emerging Business Models and Commercialization
- 4.11 Industry Developments and Announcements
Chapter 5 North America Rice Market Production, Supply and Demand Analysis
- 5.1 Demand Trend and Consumption Analysis, 2018-2025
- 5.2 Demand Forecast, 2025-2035
- 5.3 Production and Output Trend, 2018-2025
- 5.4 Production and Output Forecast, 2025-2035
- 5.5 Installed Capacity and Capacity Utilization
- 5.6 Company-Wise Production Plants and Statistics
- 5.6.1 Installed Production Capacity
- 5.6.2 Actual Production
- 5.6.3 Planned Capacity and Expansion Targets
- 5.7 Supply Chain Structure and Procurement Trends
- 5.8 Supply-Demand Gap and Bottlenecks
- 5.9 Import Dependence and Sourcing Structure
- 5.10 Contract Manufacturing and Outsourcing
- 5.11 Regional Supply and Demand Concentration
Chapter 6 North America Rice Market Pricing Analysis
- 6.1 Pricing Structure and Measurement
- 6.2 Historical Pricing Trends, 2018-2025
- 6.3 Pricing Outlook, 2025-2035
- 6.4 Average Selling Price and Unit Economics
- 6.5 Pricing by Product and Market Segment
- 6.6 Geographic Pricing Differences
- 6.7 Key Input, Energy, Labor and Logistics Costs
- 6.8 Contract Pricing and Purchasing Models
- 6.9 Pricing Sensitivity and Competitive Positioning
- 6.10 Price, Margin and Profitability Implications
Chapter 7 North America Rice Market Dynamics
- 7.1 Market Growth Drivers
- 7.1.1 Demand-Side Drivers
- 7.1.2 Technology and Innovation Drivers
- 7.1.3 Infrastructure and Investment Drivers
- 7.1.4 Regulatory and Policy Drivers
- 7.2 Market Restraints
- 7.2.1 Cost and Affordability Constraints
- 7.2.2 Technology and Adoption Barriers
- 7.2.3 Supply Chain and Operational Constraints
- 7.3 Market Challenges
- 7.3.1 Competitive Pressure and Margin Erosion
- 7.3.2 Skills, Infrastructure and Implementation Gaps
- 7.4 Emerging Market Opportunities
- 7.5 Market Dynamics Impact and Time-Horizon Assessment
Chapter 8 North America Rice Value Chain Analysis
- 8.1 Industry Value Chain Overview
- 8.2 Upstream Suppliers and Critical Inputs
- 8.3 Technology and Component Providers
- 8.4 Manufacturing or Service Delivery
- 8.5 Distribution, Channel Partners and Integrators
- 8.6 Downstream Applications and End Users
- 8.7 Value Addition and Profit Pools
- 8.8 Vertical Integration and Outsourcing
- 8.9 Supplier Concentration and Risk
- 8.10 Supply Chain Localization and Resilience
Chapter 9 North America Rice Market Regulations and Policies
- 9.1 Relevant Laws, Standards and Compliance Frameworks
- 9.2 Product, Service, Safety and Quality Requirements
- 9.3 Government Policies, Incentives and Subsidies
- 9.4 Imports, Exports and Trade Barriers
- 9.5 Public Procurement and Local Content Requirements
- 9.6 Environmental and Sustainability Compliance
- 9.7 Upcoming Policy Changes and Market Implications
Chapter 10 North America Rice Market Hotspots and Opportunities
- 10.1 Market Opportunity Mapping and Growth Hotspots
- 10.2 High-Growth Applications and Customer Groups
- 10.3 Underserved Markets and White-Space Opportunities
- 10.4 Emerging Technology and Product Opportunities
- 10.5 New Capacity and Investment Hotspots
- 10.6 Market Entry and Expansion Opportunities
- 10.7 Distribution and Partnership Opportunities
- 10.8 Near-Term and Long-Term Commercial Potential
- 10.9 Opportunity Attractiveness and Execution Risks
Chapter 11 North America Rice Market Outlook, 2025-2035
- 11.1 Market Size and Analysis
- 11.1.1 Revenue (Market Measurement: 2025: USD 7.54 billion → 2035: USD 10.15 billion)
- 11.1.2 Market Volume and Quantity Sold
- 11.1.3 Historical Market Size, 2018-2025
- 11.1.4 Base-Year Market Size, 2025
- 11.2 Market Forecast, 2025-2035
- 11.2.1 Revenue Forecast to 2035
- 11.2.2 Volume Forecast to 2035
- 11.2.3 CAGR and Year-on-Year Growth
- 11.2.4 Incremental Revenue Opportunity
- 11.3 Forecast Assumptions and Scenario Analysis
- 11.3.1 Base-Case Forecast
- 11.3.2 Optimistic and Conservative Scenarios
- 11.3.3 Technology, Pricing and Policy Sensitivities
- 11.4 Market Attractiveness and Growth Outlook
Chapter 12 North America Rice Market Segmentation and Outlook
- 12.1 Segmentation Summary and Market Shares, 2025
- 12.2 Largest and Fastest-Growing Segments
- 12.3 By Product Type - Market Size and Forecast, 2025-2035
- 12.3.1 Segment Definition and Scope
- 12.3.2 Historical Market Size, 2018-2025
- 12.3.3 Revenue Forecast, 2025-2035
- 12.3.4 Volume Forecast, 2025-2035
- 12.3.5 Base-Year Market Share, 2025
- 12.3.6 Segment CAGR and Growth Drivers
- 12.3.7 Subsegment Market Size and Forecast
- 12.3.7.1 Long-grain rice
- 12.3.7.2 Medium-grain rice
- 12.3.7.3 Short-grain rice
- 12.3.7.4 Broken rice
- 12.3.8 Subsegment Pricing and Adoption Trends
- 12.3.9 Leading Suppliers and Competition
- 12.3.10 Regional Demand and Opportunities
- 12.4 By Application - Market Size and Forecast, 2025-2035
- 12.4.1 Segment Definition and Scope
- 12.4.2 Historical Market Size, 2018-2025
- 12.4.3 Revenue Forecast, 2025-2035
- 12.4.4 Volume Forecast, 2025-2035
- 12.4.5 Base-Year Market Share, 2025
- 12.4.6 Segment CAGR and Growth Drivers
- 12.4.7 Subsegment Market Size and Forecast
- 12.4.7.1 Table rice
- 12.4.7.2 Food ingredient processing
- 12.4.7.3 Pet food manufacturing
- 12.4.8 Subsegment Pricing and Adoption Trends
- 12.4.9 Leading Suppliers and Competition
- 12.4.10 Regional Demand and Opportunities
- 12.5 By Technology - Market Size and Forecast, 2025-2035
- 12.5.1 Segment Definition and Scope
- 12.5.2 Historical Market Size, 2018-2025
- 12.5.3 Revenue Forecast, 2025-2035
- 12.5.4 Volume Forecast, 2025-2035
- 12.5.5 Base-Year Market Share, 2025
- 12.5.6 Segment CAGR and Growth Drivers
- 12.5.7 Subsegment Market Size and Forecast
- 12.5.7.1 Conventional milling
- 12.5.7.2 Parboiling
- 12.5.7.3 Pre-cooking
- 12.5.8 Subsegment Pricing and Adoption Trends
- 12.5.9 Leading Suppliers and Competition
- 12.5.10 Regional Demand and Opportunities
- 12.6 By Country - Market Size and Forecast, 2025-2035
- 12.6.1 Segment Definition and Scope
- 12.6.2 Historical Market Size, 2018-2025
- 12.6.3 Revenue Forecast, 2025-2035
- 12.6.4 Volume Forecast, 2025-2035
- 12.6.5 Base-Year Market Share, 2025
- 12.6.6 Segment CAGR and Growth Drivers
- 12.6.7 Subsegment Market Size and Forecast
- 12.6.7.1 United States
- 12.6.7.2 Canada
- 12.6.7.3 Mexico
- 12.6.8 Subsegment Pricing and Adoption Trends
- 12.6.9 Leading Suppliers and Competition
- 12.6.10 Regional Demand and Opportunities
- 12.7 Segment Growth Comparison
- 12.8 Segment Attractiveness and Priority Matrix
Chapter 13 North America Rice End-Use and Application Market Outlook
- 13.1 End-Use Industry and Customer Demand Structure
- 13.2 Leading Applications and Customer Groups
- 13.3 End-Use Market Size, Share and Forecast
- 13.4 Major End-Use Industry Deep Dives
- 13.4.1 Customer Requirements and Use Cases
- 13.4.2 Demand and Replacement Cycles
- 13.4.3 Technical and Regulatory Considerations
- 13.4.4 Purchasing and Procurement Models
- 13.4.5 Leading Vendors and Distribution Channels
- 13.4.6 Forecast and Commercial Opportunities
- 13.5 Emerging Applications and Cross-Segment Demand
- 13.6 End-Use Industry Investment Priorities
Chapter 14 North America Rice Geographic Market Outlook, 2025-2035
- 14.1 Regional Market Size and Country-Level Shares, 2025
- 14.2 Country Market Size Comparison, 2025
- 14.3 Country Market Forecasts, 2025-2035
- 14.4 Subregional Industrial and Demand Clusters
- 14.5 Intra-Regional Pricing and Cost Differences
- 14.6 Cross-Border Trade and Supply Networks
- 14.7 Regional Supply and Demand Balances
- 14.8 Country Opportunity Comparison and Prioritization
Note: Every listed country is covered on the structure shown under the first country.
Chapter 15 North America Rice Technology, Innovation and Sustainability Outlook
- 15.1 Technology Landscape and Maturity
- 15.2 Product, Process and Service Innovation
- 15.3 AI, Automation and Digital Tools in the Industry
- 15.4 Technology Adoption and Performance Benchmarking
- 15.5 Innovation Pipeline and R&D Investment
- 15.6 Patent and Intellectual Property Trends
- 15.7 Energy Efficiency and Resource Management
- 15.8 Sustainability, Recycling and Circularity
- 15.9 Technology Roadmap, 2025-2035
- 15.10 Risks of Obsolescence and Technology Substitution
Chapter 16 North America Rice Market Key Strategic Imperatives
- 16.1 Growth and Market Entry Priorities
- 16.2 High-Return Products and Segments
- 16.3 Pricing, Profitability and Cost Optimization
- 16.4 Technology Investment and Product Differentiation
- 16.5 Supply Chain Localization and Resilience
- 16.6 Distribution and Customer Acquisition
- 16.7 Partnership, Acquisition and Capacity Strategy
- 16.8 Regional Expansion Priorities
- 16.9 Short-, Medium- and Long-Term Actions
Chapter 17 Competition Outlook
- 17.1 Industry Competition Characteristics
- 17.2 Market Structure and Concentration
- 17.3 Market Share and Competitive Positioning, 2025
- 17.4 Company-Wise Revenue and Product Benchmarking
- 17.5 Production and Service Capacity Benchmarking
- 17.6 Technology, Pricing and Differentiation
- 17.7 Regional Footprint and Distribution Strength
- 17.8 Mergers, Acquisitions and Strategic Alliances
- 17.9 New Entrants and Competitive Threats
- 17.10 Porter's Five Forces and Industry Attractiveness
- 17.11 Competitive Outlook, 2025-2035
Chapter 18 Company Profiles
- 18.1 Company Coverage and Selection Criteria
- 18.2 Riceland Foods
- 18.2.1 Business Description
- 18.2.2 Company Ownership and Geographic Presence
- 18.2.3 Product and Service Portfolio
- 18.2.4 Manufacturing and Operating Footprint
- 18.2.5 Production Capacity and Expansion Plans
- 18.2.6 Financial Performance and Investment
- 18.2.7 Market Share and Competitive Position
- 18.2.8 Technology and Innovation Capabilities
- 18.2.9 Strategic Alliances or Partnerships
- 18.2.10 Recent Developments
- 18.2.11 Growth Strategy and Outlook
- 18.3 Riviana Foods
- 18.4 LT Foods
- 18.5 Producers Rice Mill
- 18.6 Lundberg Family Farms
- 18.7 Other Relevant Market Participants
Note: Every listed company is profiled on the structure shown under the first company. The company list is preliminary and may change based on research findings, market developments, data availability and client requirements.
Chapter 19 Disclaimer
- 19.1 Research and Forecast Disclaimer
- 19.2 Data Source and Estimation Limitations
Note: The depth of individual sections depends on data availability for this market. Volume, capacity, trade and other unit-based metrics are included where applicable.

