
Eating out now outweighs groceries in household budgets
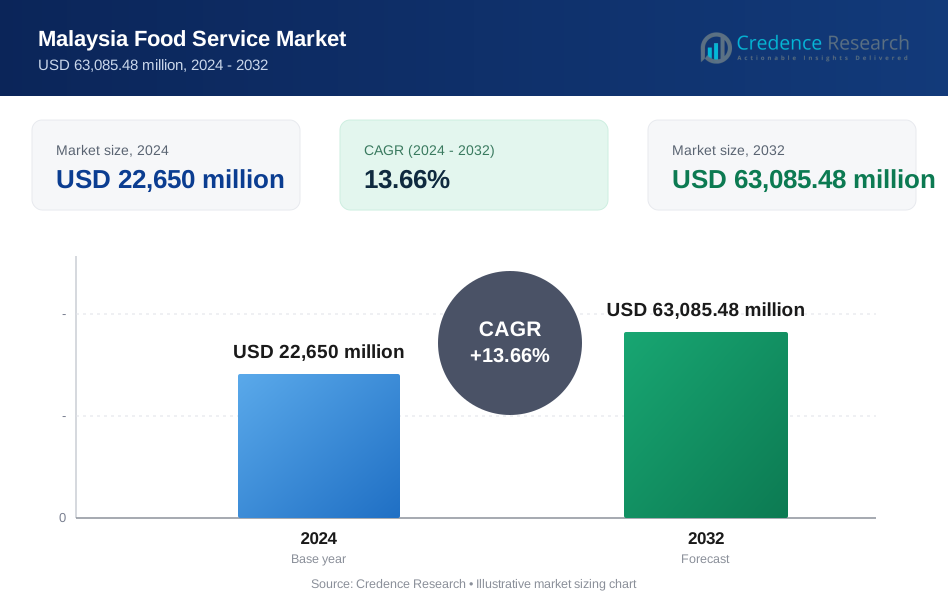
The Malaysia food service market was valued at USD 25.74 billion in 2025 and is projected to increase from USD 28.00 billion in 2026 to USD 59.56 billion by 2035, registering a CAGR of 8.75% during 2026–2035. Demand comes from households that now spend more on meals away from home than on groceries, 42.2 million visitor arrivals in 2025 and chain investment that reaches beyond the largest cities. Central Region held the largest regional share, 44.0% in 2025, because Selangor and Kuala Lumpur combine the densest outlet networks with the highest incomes. East Malaysia is the fastest-growing region at 9.4% a year as chains add sites in Sabah and Sarawak. The main commercial change is the arrival of an 8% service tax on commercial rent from July 1, 2025, which raises occupancy costs for mall-based operators and favors chains with stronger bargaining power over landlords.
How is the food service industry in Malaysia structured?
The market counts consumer spending on meals and drinks prepared away from home, across restaurants, fast food chains, cafes, hawker stalls, delivery kitchens, caterers and institutional canteens. The Department of Statistics Malaysia counted 136,453 food and beverage establishments in its latest census, with 2022 gross output of RM99.0 billion and about 1.08 million people engaged. Most buyers pay at the counter or through delivery apps, while institutions buy through contracts and fixed meal rates.
Packaged groceries, home-cooked meal kits and food processing are excluded, and so are kitchen equipment and disposable packaging. The value chain runs from suppliers of poultry, rice and coffee through central kitchens and franchise owners to outlets and delivery platforms, and independent operators remain most of the outlet base.
Malaysia Food Service Market Insights
- The market stands at USD 25.74 billion in 2025 and is forecast to reach USD 59.56 billion by 2035, an 8.75% CAGR over 2026–2035 on household and visitor spending.
- The Central Region held 44.0% of value in 2025, since Selangor had 24,625 establishments and Kuala Lumpur 13,849 in the latest census.
- Full-Service Restaurants led outlet types with 31.0% of 2025 value, while commercial outlets took 84.0% across end users.
- ZUS Coffee ended 2025 with about 850 Malaysian stores while Berjaya Food cut Starbucks from 400 stores to 320, showing a shift toward local coffee brands.
- McDonald’s Malaysia announced RM1 billion and 100 new restaurants in February 2026, with part of the program aimed at Sabah and Sarawak.
Full-service restaurants and dine-in still hold most value
Why full-service restaurants lead and delivery kitchens grow fastest
Based on type of outlet, the market is categorized into full-service restaurants, quick-service restaurants, cafes and coffee shops, street food and hawker centers, food delivery and cloud kitchens, and catering services. Full-Service Restaurants led with 31.0% of 2025 value because food services, a group that includes restaurants, took 83.4% of sector value added from 78.5% of establishments in 2022, according to Department of Statistics Malaysia data reported by The Star, so value concentrates in larger sites. Food Delivery and Cloud Kitchens grow fastest at 11.9% a year, as The Straits Times reported platform sales up about 18% to 19% in 2025, which supports dark kitchens near dense suburbs.
How dine-in holds value while home delivery gains share
Based on service style, the market is categorized into dine-in, takeaway, home delivery, drive-thru and self-service. Dine-In led with 58.0% of 2025 value because cafes and restaurants grew 2.5% in the second quarter of 2025 while takeaway kiosks and stalls fell 8.1%, according to The Star in September 2025. Home Delivery grows fastest at 11.1% a year, as Maybank said in September 2026 that foodpanda ranks second in Malaysian delivery and ShopeeFood holds 11%, which keeps platforms competing on price and membership benefits.
Why commercial outlets dominate and travel sites grow fastest
Based on end user, the market is categorized into commercial, institutional and transportation buyers. Commercial outlets led with 84.0% of 2025 value because households alone averaged RM902.70 a month on eating out, according to Khazanah Research Institute. School meals give institutional demand a fixed base, with the Education Ministry paying RM3.50 a meal in Peninsular Malaysia and RM4.00 in Sabah, Sarawak and Labuan, and contract catering firms bid for such work. Transportation grows fastest at 10.1% a year, as Malaysia Airports reported 104.4 million passengers across its Malaysian network in 2025, up 11.2%.
| Segment Group | Leading Sub-segment | Share, 2025 | Fastest-growing Sub-segment | CAGR, 2026–2035 |
|---|---|---|---|---|
| By Type of Outlet | Full-Service Restaurants | 31.0% | Food Delivery and Cloud Kitchens | 11.9% |
| By Service Style | Dine-In | 58.0% | Home Delivery | 11.1% |
| By End-User | Commercial | 84.0% | Transportation | 10.1% |
Request a Free Sample
Fill in your details and we'll send you a free sample report.
- Sample data tables & charts
- Research methodology
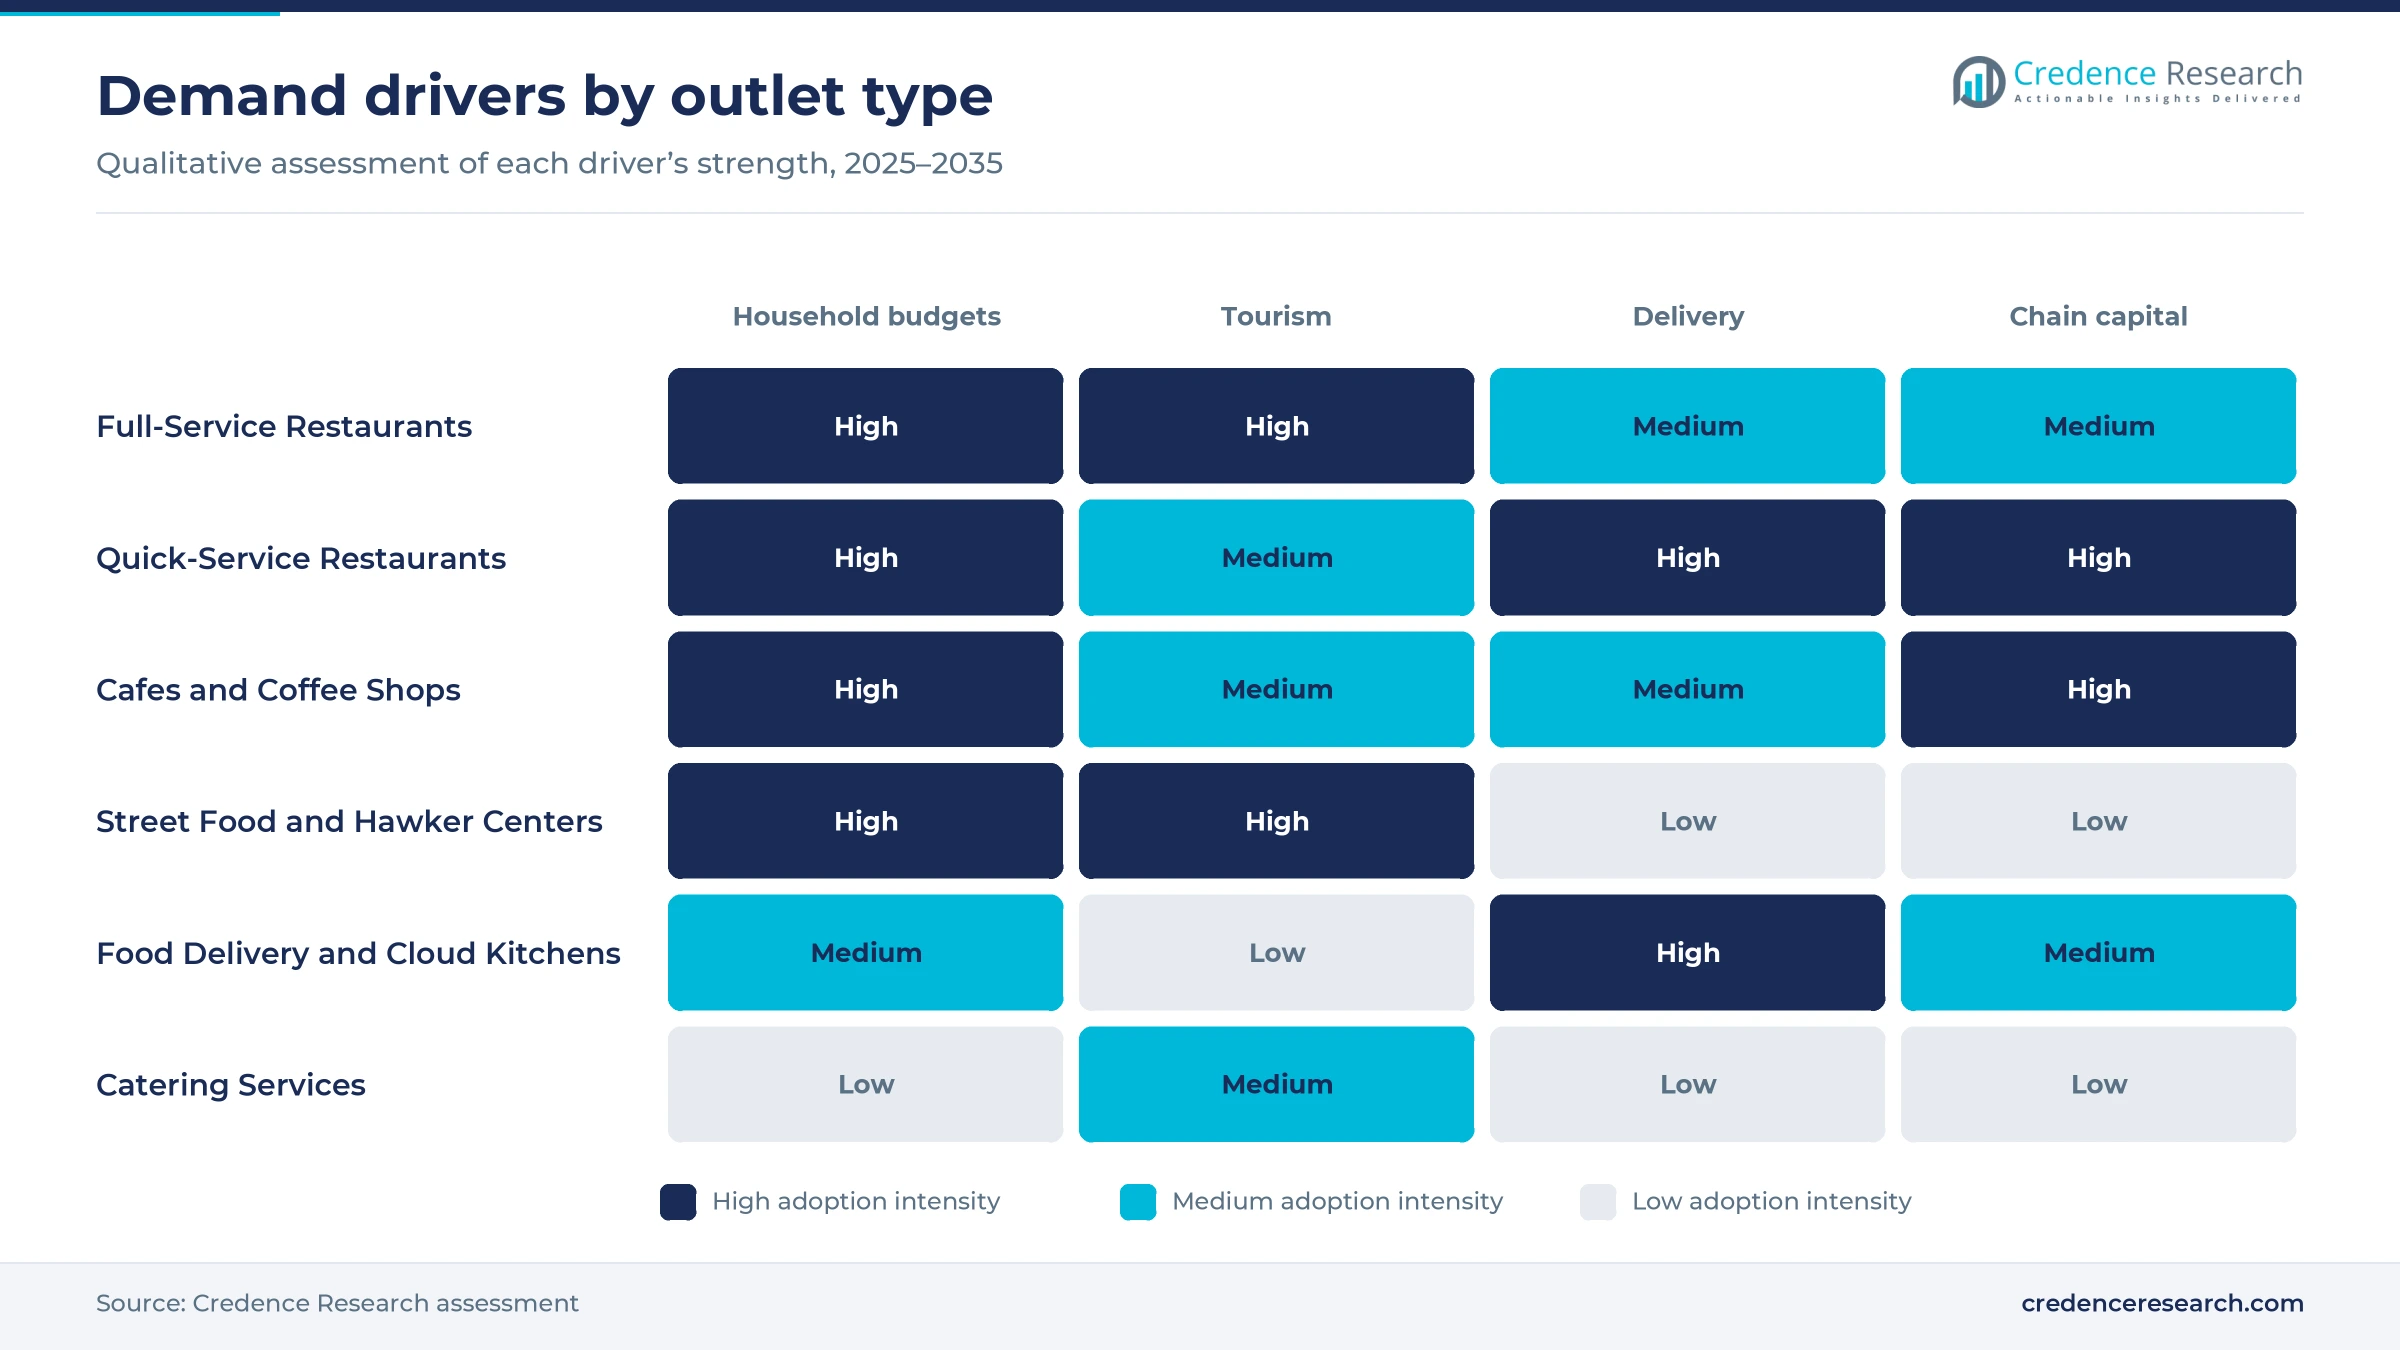
Household budgets, visitors and chain capital lift sales
Eating out has overtaken grocery spending in household budgets
Malaysian households now spend more on meals away from home than on groceries, and that change gives the market its widest demand base. According to Khazanah Research Institute, as reported by Malay Mail in October 2026, households averaged RM902.70 a month on eating out against RM875.80 on groceries. Eating out reached 16.2% of household spending, up from 12.6% in 2016, and it added RM78.20 a month between 2022 and 2024. Sector value added grew 6.6% a year from 2015 to 2022, according to Department of Statistics Malaysia data reported by The Star. The World Bank estimates that 77.4% of Malaysians lived in urban areas in 2025, which concentrates this spending in mall and suburban catchments. As a result, commercial outlets hold 84.0% of 2025 value.
Higher arrivals and domestic trips add meals outside the home
Visitors add meals that households would not otherwise buy, and their numbers rose sharply in 2025. The Department of Statistics Malaysia recorded 42.2 million arrivals, up 11.2% and 20.6% above 2019, with Singapore supplying 21.1 million of them, according to RinggitPlus. Food and beverage services took 16.1% of total visitor spending of RM236.9 billion, or about RM38 billion, and they generated 16.4% of tourism value added. Domestic tourism also reached 290.1 million visitors, up 11.5%, according to Malay Mail. These flows support hawker centers in heritage towns as well as airport and highway outlets. Consequently, transportation sites lead end-user growth at 10.1% a year as Visit Malaysia 2026 extends the campaign.
Delivery platforms keep extending the reach of kitchens
Delivery platforms let kitchens sell beyond their walk-in catchment, and competition among them keeps order costs under pressure. TNGlobal reported in September 2026 that Maybank places foodpanda second in Malaysia with 22% and ShopeeFood at 11%. ShopeeVIP membership, which had more than seven million subscribers at the end of 2025, already bundles ShopeeFood benefits in Malaysia. The Straits Times reported that Malaysian food delivery grew about 18% to 19% in 2025, close behind 22% in Thailand, where delivery also feeds the restaurant sector. That platform growth explains why Home Delivery expands at 11.1% a year while independent outlets gain customers they could not otherwise reach.
Chain capital commitments push outlets into smaller cities
Chains are committing capital for several years, which gives the market a visible pipeline of new outlets. McDonald’s Malaysia said in February 2026 that it will invest RM1 billion over five years and open 100 restaurants on top of more than 370 outlets, according to Malay Mail. ZUS Coffee ended 2025 with about 850 Malaysian stores and targets about 1,050 by the end of 2026, Newswav reported in April 2026. Texchem Resources said in August 2024 that the market could hold 200 Sushi King restaurants, up from about 130, according to The Star. Location data from GapMaps shows the largest restaurant chains expanding into lower-tier areas, which widens access beyond Greater Kuala Lumpur.
Local coffee chains and halal certification reshape outlets
Shift from global coffee brands toward local and low-priced chains
Coffee demand is shifting toward local and low-priced chains, and store counts show how fast the change has moved. Berjaya Food cut its Starbucks network from 400 stores to 320 after nearly two years of boycott pressure, Malay Mail reported in November 2025. ZUS Coffee meanwhile passed Starbucks in store presence and runs selected RM5 coffees at more than 250 outlets in Kuala Lumpur and Putrajaya, according to Newswav. Mixue passed 700 Malaysian outlets in 2025, according to Malaysiakini. The Department of Statistics Malaysia counted 13,116 beverage establishments in the latest census, so chain growth still leaves many independents to compete with. As a result, Cafes and Coffee Shops grow faster than the market overall through 2035.
Rise of formal halal certification across foreign and local chains
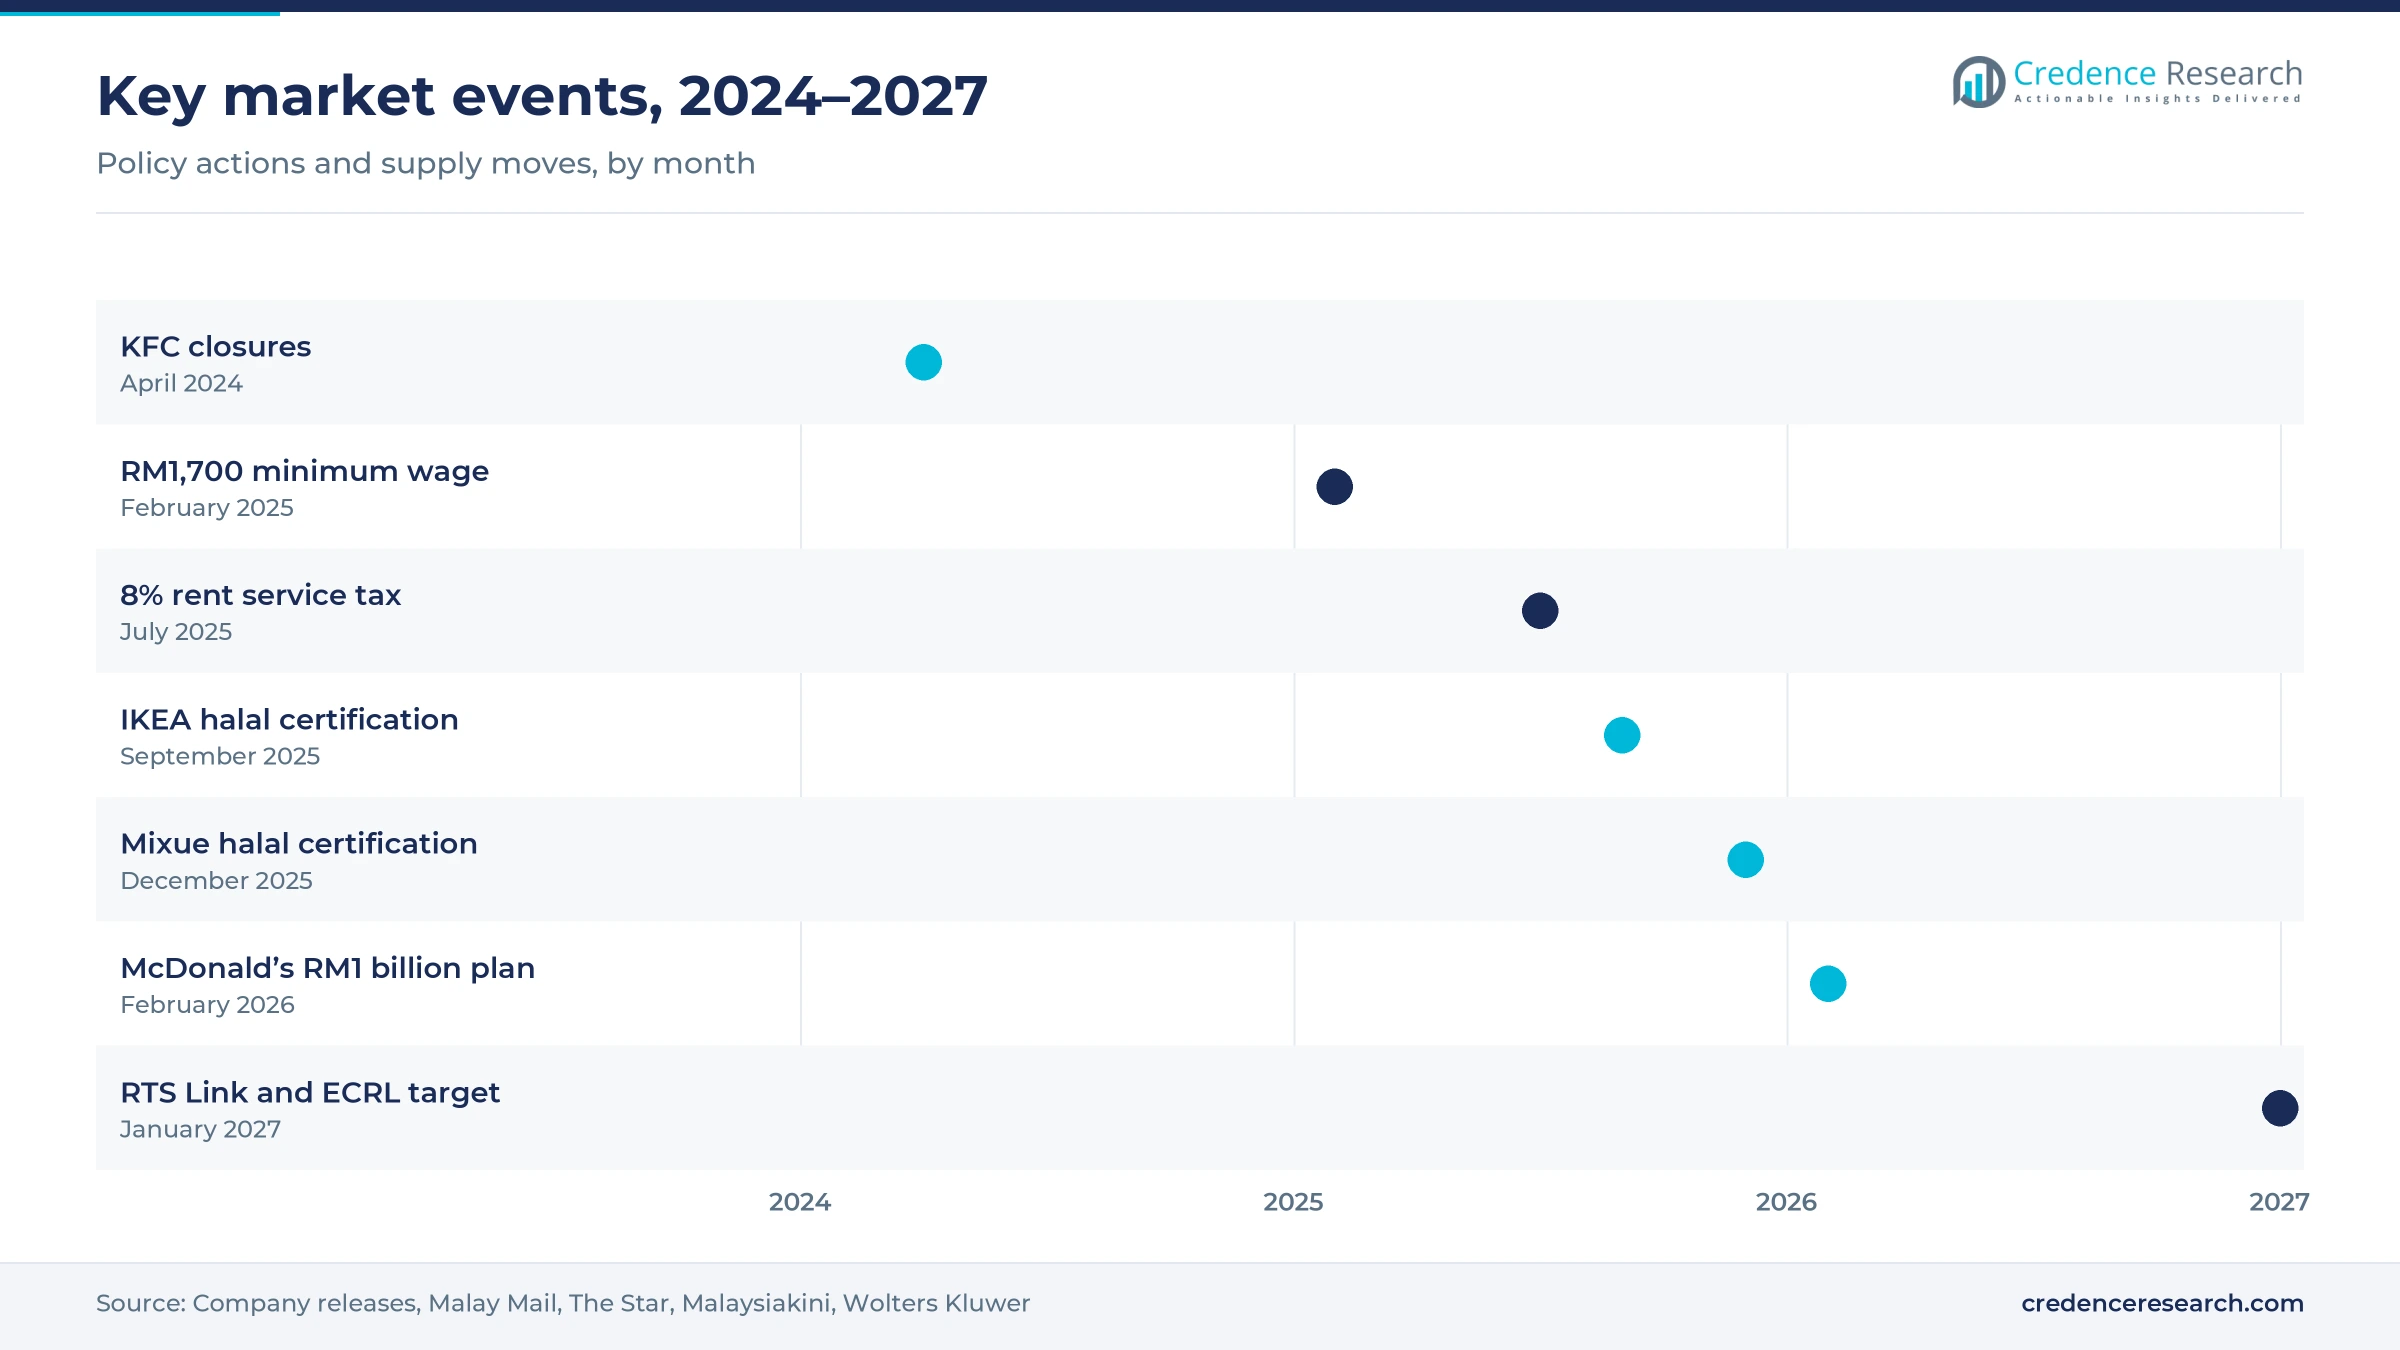
Formal halal certification is becoming a visible test for brands that want to reach Muslim diners, and public scrutiny of chains has increased. New Straits Times reported in September 2024 that JAKIM identified five popular restaurant chains without Malaysian halal certification. Mixue said in December 2025 that more than 100 of its outlets had received JAKIM certification, according to Malaysiakini. IKEA Malaysia announced on Sept. 24, 2025, that all of its restaurants, cafes and bistros at Damansara, Cheras, Tebrau and Batu Kawan were certified. As a result, certification now separates brands in a market where Full-Service Restaurants hold 31.0% of 2025 value and compete directly for family dining occasions.
Opportunity for new outlets in Sabah and Sarawak
Sabah and Sarawak offer the clearest opening for new chain outlets, because demand is running ahead of existing stores. McDonald’s Malaysia said in February 2026 that a number of its 100 new restaurants will open there since demand is outpacing current sites, according to Malay Mail. Kota Kinabalu airport handled 802,000 passengers in December 2025, up 23.5%, and Kuching handled 540,000, up 10.3%, according to Malaysia Airports. GapMaps data from October 2023 showed McDonald’s present in 65% of Malaysian cities above 50,000 residents, against 100% for KFC, so gaps remain for rival chains. East Malaysia therefore starts from a 15.0% share in 2025 with room for more chain entrants.
Opportunity along the Johor rail link and the east coast line
Two rail projects due in January 2027 open new catchments for restaurants and cafes. The Star reported in July 2026 that the Johor Baru-Singapore RTS Link should start passenger service that month, and the Johor Indian Business Association said more cafes and restaurants are moving into the city center. Singapore already supplied 21.1 million arrivals in 2025, so easier crossings could draw some spending away from Singapore’s dining sector toward Johor outlets. Transport Minister Anthony Loke said in January 2026 that the East Coast Rail Link, 89% complete in October 2025, targets the same month. The East Coast Region therefore grows at 9.1% a year as station towns gain new visitor traffic.
Labor approvals, rent tax and boycotts squeeze operators
Foreign worker approvals leave Indian Muslim restaurants understaffed
Labor supply is the most urgent constraint for independent restaurants that rely on foreign kitchen staff. Primas and Presma said in a joint statement reported in May 2026 that more than 600 Indian and Indian Muslim restaurants could close permanently, putting about 5,000 related livelihoods at risk. Presma had already told The Star in March 2026 of severe manpower shortages. Primas also said its members are not receiving approvals for new or replacement foreign workers, which leaves them few short-term options.
Minimum wage increases raise costs for coffee shops and food courts
Payroll costs rose when the national minimum wage moved from RM1,500 to RM1,700 on Feb. 1, 2025. The Malaysia-Singapore Coffee Shop Proprietors General Association told The Star that about 40% of coffee shops hire more than three foreign workers, and that bean prices had climbed sharply since mid-2024. Small food courts therefore face two increases at once and have limited room to raise prices. The association urged members to absorb higher costs where possible and to keep any price increases reasonable.
Service tax on rent raises occupancy costs for mall outlets
An 8% service tax on commercial rent took effect on July 1, 2025, and it falls hardest on mall tenants. The Malaysia Retail Chain Association told The Star that rent is often 20% to 30% of monthly overheads, so an outlet paying RM50,000 faces about RM4,000 more each month. Tenants below RM1 million in annual turnover may qualify for relief, according to Wolters Kluwer, while the association expects small and medium operators to be hit harder than large chains.
Boycotts and softer traffic make single-brand networks vulnerable
Demand shocks can remove stores quickly from networks tied to a single international brand. QSR Brands temporarily closed 108 KFC outlets in April 2024, citing challenging economic conditions, and Berjaya Food later shrank Starbucks by 80 stores. Cafes and restaurants grew only 2.5% in the second quarter of 2025 against an 8.5% projection, according to The Star in September 2025. QSR Brands said in January 2026 that all outlets had reopened, which shows recovery is possible but slow.
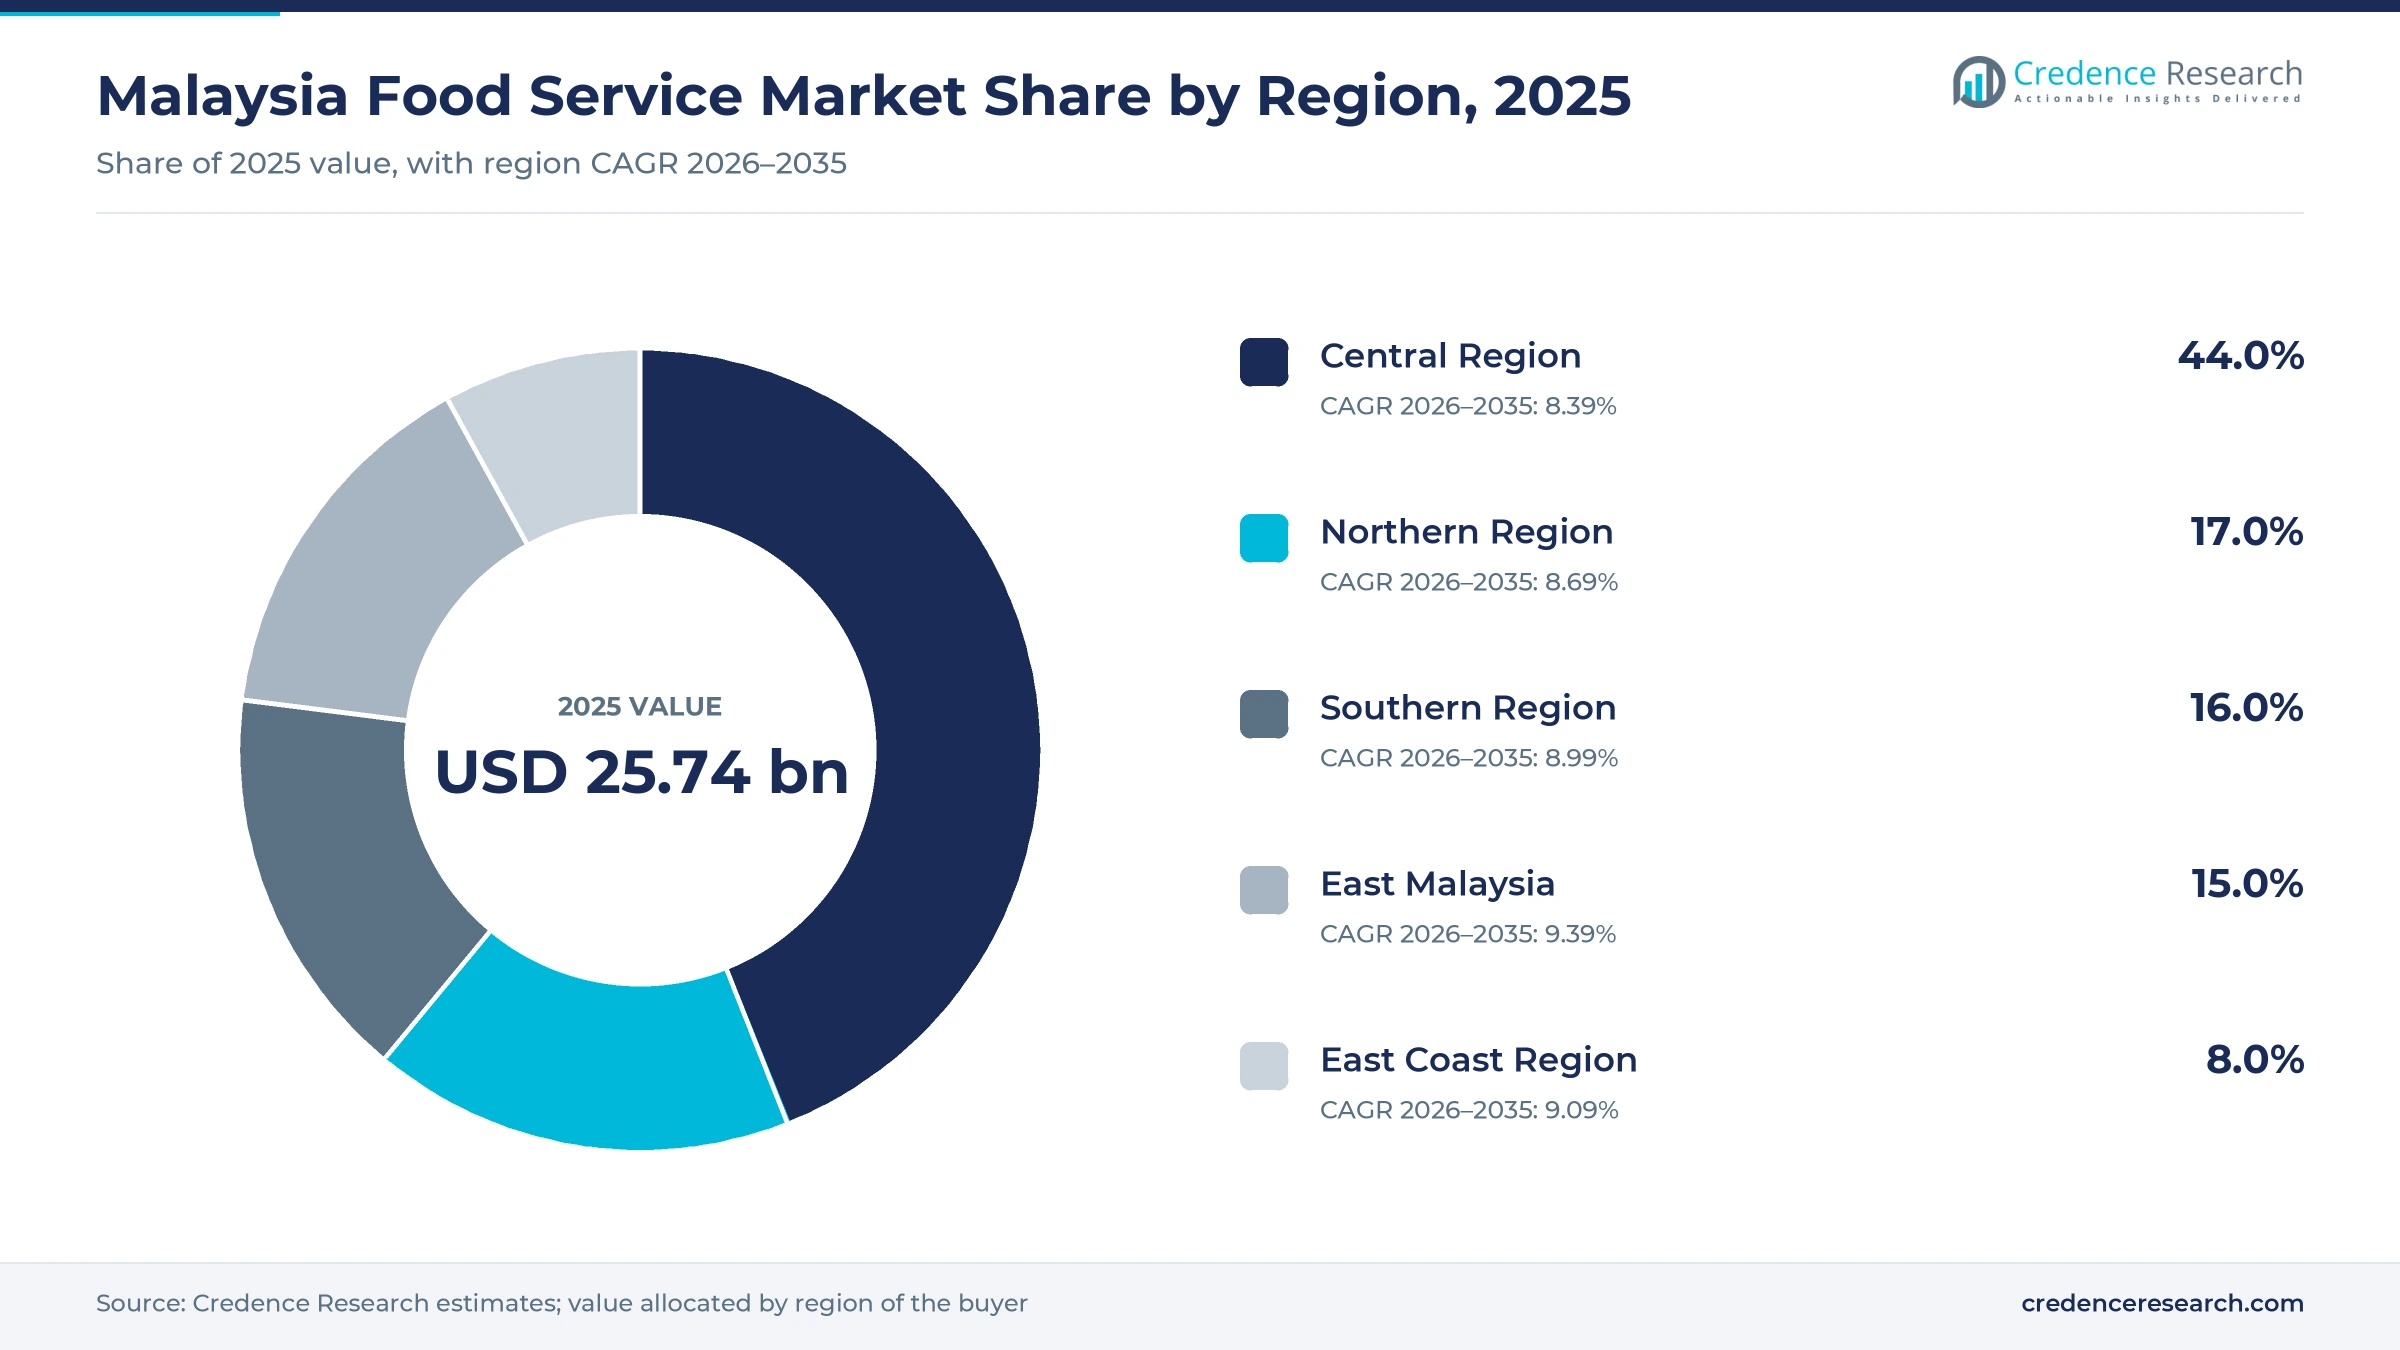
Central region leads as East Malaysia expands fastest
| Region | Value, 2025 (USD billion) | Share, 2025 | CAGR, 2026–2035 |
|---|---|---|---|
| Central Region | 11.33 | 44.0% | 8.4% |
| Northern Region | 4.38 | 17.0% | 8.7% |
| Southern Region | 4.12 | 16.0% | 9.0% |
| East Malaysia | 3.86 | 15.0% | 9.4% |
| East Coast Region | 2.06 | 8.0% | 9.1% |
Central region holds the densest outlet base
The Central Region, covering Selangor, Kuala Lumpur and Putrajaya, held 44.0% of 2025 value and grows at 8.4% a year. The Department of Statistics Malaysia counted 24,625 establishments in Selangor and 13,849 in Kuala Lumpur, while The Star reported value added of RM18.5 billion and RM6.4 billion for them. GapMaps also placed 1,435 of 3,329 tracked fast food locations in Greater Kuala Lumpur in 2023. KLIA, which handled 63.3 million passengers in 2025, adds travel demand to this base.
Northern Region benefits from Penang visitors and hawker culture
The Northern Region, covering Penang, Kedah, Perak and Perlis, held 17.0% of 2025 value and grows at 8.7% a year. Penang anchors this demand, since its airport handled 772,000 passengers in December 2025, up 12.2%, according to Malaysia Airports. IKEA’s Batu Kawan restaurant shows large-format retail dining reaching the mainland as well. Credence Research estimates that street food holds a stronger position here than in the capital, which keeps independent operators important in George Town and Ipoh.
Southern Region gains from Singapore traffic and the RTS Link
The Southern Region, covering Johor, Melaka and Negeri Sembilan, held 16.0% of 2025 value and grows at 9.0% a year. Johor alone had 15,727 establishments and RM4.1 billion of value added in the latest census, according to the Department of Statistics Malaysia and The Star. Malaysia recorded 15.6 million same-day visitors in 2025, and Johor Baru dining stands to gain as passenger service on the RTS Link is expected from January 2027. The Johor Indian Business Association says cafes and restaurants keep moving into the city center despite rising rents.
East Malaysia is the fastest-growing zone for chain entry
East Malaysia, covering Sabah, Sarawak and Labuan, held 15.0% of 2025 value and grows at 9.4% a year, the fastest of the five zones. McDonald’s Malaysia has named Sabah and Sarawak in its plan for 100 new restaurants, and Kota Kinabalu airport traffic rose 23.5% in December 2025. School meals here also carry a higher public rate of RM4.00, compared with RM3.50 in Peninsular Malaysia, which supports institutional caterers. Kuching airport traffic rose 10.3% in the same month, so demand is spreading beyond the Sabah capital.
East Coast Region waits on rail access to station towns
The East Coast Region, covering Pahang, Terengganu and Kelantan, held 8.0% of 2025 value and grows at 9.1% a year. Tourism Malaysia’s eastern region director said in September 2025 that accommodation there is usually fully booked during holiday seasons, and that the East Coast Rail Link could lift tourism further. Markets such as Pasar Payang in Terengganu and Pasar Siti Khadijah in Kelantan are being promoted to raise visitor spending. Credence Research expects independent stalls to remain the main format, with chains likely to follow the rail corridor.
Chains reopened and committed new capital in 2025 and 2026
| Development | Status and market relevance |
|---|---|
| In February 2026, McDonald’s Malaysia announced a RM1 billion investment over five years with 100 new restaurants and more than 10,000 job opportunities. | Announced; the largest disclosed chain pipeline in this review, with sites planned in Sabah and Sarawak |
| In January 2026, QSR Brands said all of its temporarily closed outlets were back in full operation. | Completed; ends the temporary closures that began in April 2024 |
| In December 2025, Mixue said more than 100 of its Malaysian outlets had received JAKIM halal certification. | Under way; the chain passed 700 outlets in 2025 |
| In November 2025, Berjaya Food said Starbucks Malaysia recovery was slow but visible after it cut the network from 400 stores to 320. | Under way; local rivals have passed it in store presence |
| In July 2025, Malaysia applied an 8% service tax to commercial rent and leasing. | In force; a transitional exemption for some contracts ran to June 30, 2026 |
Delivery membership and e-invoicing change outlet operations
- Delivery membership programs such as ShopeeVIP, with more than seven million subscribers at the end of 2025, tie repeat food orders to wider shopping benefits.
- MyInvois e-invoicing reached businesses above RM5 million in turnover from July 1, 2025, and Fiscal Solutions reported a Jan. 1, 2027, start for those between RM1 million and RM5 million.
- Location analytics from providers such as GapMaps map chain coverage across 72 Malaysian cities, which helps brands choose lower-tier sites with fewer rivals.
- JAKIM halal certification now extends to multi-outlet groups, as the approvals at Mixue and IKEA Malaysia showed in late 2025.
Need a Custom Version of This Report?
Tailor the scope, geography, or segments to your exact requirements.
- Custom geography or segment scope
- Direct access to our analyst team
KFC and McDonald’s scale meets low-priced local coffee
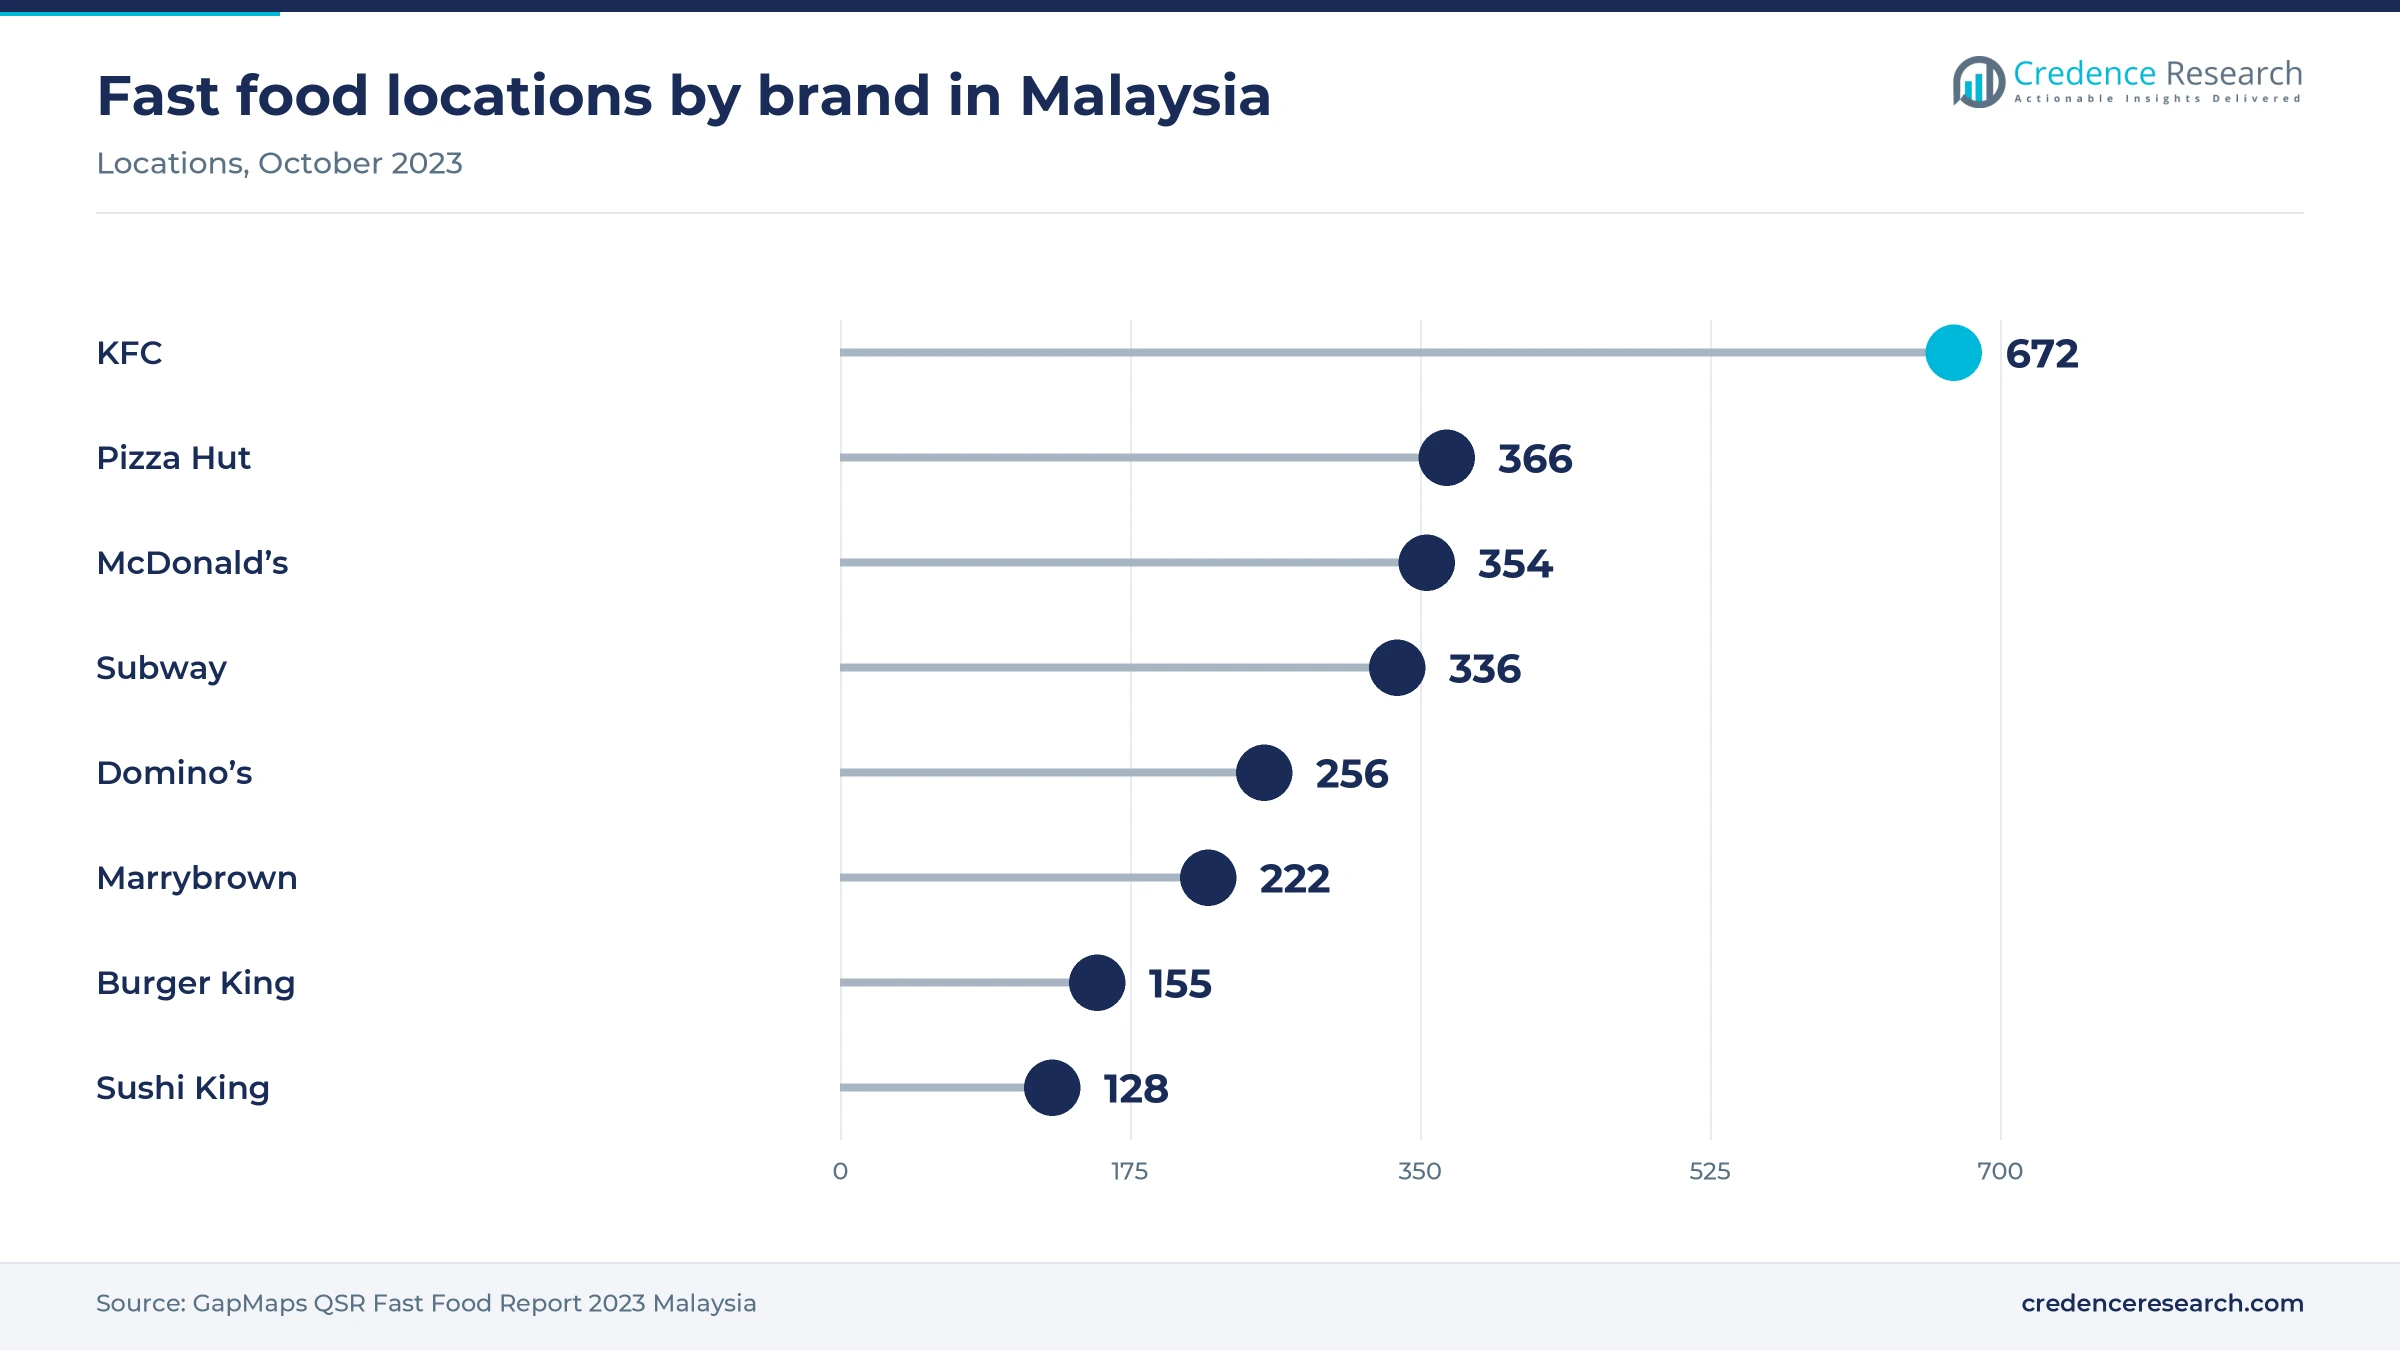
Competition splits into international franchises, fast-growing local chains, a large independent base and delivery platforms that influence all three. Current fast food chains operating in Malaysia include KFC, Pizza Hut, McDonald’s, Subway, Domino’s, Marrybrown, Burger King, Sushi King, A&W, Texas Chicken and Nando’s. GapMaps counted 672 KFC, 366 Pizza Hut, 354 McDonald’s, 336 Subway, 256 Domino’s and 222 Marrybrown locations in 2023, and McDonald’s has since passed 370. In coffee, ZUS Coffee has overtaken Starbucks in store presence while Mixue competes on price. Scale matters because it improves bargaining power with landlords, which the new rent tax has made more valuable. Local identity also matters, since boycott pressure hurt some Western brands for nearly two years. Independent restaurants keep their customers through price and familiarity, but foreign labor approvals limit their ability to open more sites.
Companies profiled and their roles in this market
| Company | Type | Role in the market |
|---|---|---|
| QSR Brands (M) Holdings | Franchise operator | Runs KFC and Pizza Hut in Malaysia, with 672 and 366 locations tracked in 2023 |
| McDonald's Malaysia | Franchise operator | More than 370 outlets and a RM1 billion plan for 100 more over five years |
| ZUS Coffee | Local chain | About 850 Malaysian stores at the end of 2025, with about 1,050 targeted for 2026 |
| Berjaya Food (Starbucks Malaysia) | Franchise operator | Operates Starbucks in Malaysia, now 320 stores after cutting the network from 400 |
| Texchem Resources (Sushi King) | Local group | Owns Sushi King, about 130 outlets in 2024, with room for 200 stated by its founder |
| Domino's | Pizza chain | 256 Malaysian locations tracked by GapMaps in 2023 |
| Marrybrown | Local chain | 222 Malaysian locations tracked by GapMaps in 2023 |
| Mixue Malaysia | Beverage chain | More than 700 outlets in 2025, with over 100 halal-certified |
| Tealive (Loob Holding) | Local beverage chain | Home-grown bubble tea chain run by Loob Holding, with outlets across Malaysia |
| Secret Recipe | Local cafe chain | Home-grown cake and cafe chain that opened its 350th outlet in 2023 |
Value will favor operators with secure labor and sites
Credence Research’s view is that Malaysia’s food service spending is more secure than the margins of the companies serving it. Households have already moved eating out ahead of groceries, and arrivals have passed their 2019 level, so demand has a firm floor. However, the rent tax, higher wages and slow foreign worker approvals favor groups with central kitchens and landlord leverage. Investors should therefore treat store pipelines cautiously and test them against labor availability. The strongest positions are likely to be local chains with halal certification and multi-state supply, along with independents that secure their staffing early.
Public statistics and company data underpin the estimates
The report uses 2025 as the base year, 2026 as the first forecast year and 2035 as the final year. Market values come from the Credence Research model, and the segment and regional splits are Credence Research estimates. Inputs include the Department of Statistics Malaysia census and tourism releases, World Bank data, Malaysia Airports traffic, company announcements and press reports naming the source organization. No interviews or surveys were conducted for this edition of the report.
Outlet openings shift toward borneo and rail corridors
Spending is forecast to rise from USD 28.00 billion in 2026 to USD 59.56 billion by 2035, an 8.75% CAGR. The Central Region should remain largest, although East Malaysia and the rail corridors are likely to take a larger share of new outlets once service starts in January 2027. Delivery should continue to grow faster than dine-in, but dine-in will still hold most value because restaurants and cafes remain the core of household eating-out budgets. Labor policy is the main swing factor, since a faster approval process would protect independent restaurants, while delays would hand more sites to the larger chains.
Frequently Asked Questions
What is the size of the Malaysia food service market?
How big is the food and beverage services industry in Malaysia by official statistics?
Which fast food chains are currently operating in Malaysia?
How many KFC and McDonald’s outlets are in Malaysia?
What is foodpanda’s market share in Malaysia?
What is driving the food and beverage industry in Malaysia?
Which segment leads the Malaysia food service market?
What challenges do food service operators in Malaysia face?
Table of Content
Chapter 1 Market Segmentation
- 1.1 Segmentation Framework
- 1.1.1 Product and Service Classification
- 1.1.2 Application and End-Use Classification
- 1.1.3 Technology and Solution Classification
- 1.1.4 Customer and Distribution Channel Classification
- 1.1.5 Geographic Segmentation
- 1.1.6 Market Segment Definitions and Boundaries
- 1.2 By Type of Outlet
- 1.2.1 Full-Service Restaurants
- 1.2.2 Quick-Service Restaurants
- 1.2.3 Cafes and Coffee Shops
- 1.2.4 Street Food and Hawker Centers
- 1.2.5 Catering Services
- 1.2.6 Food Delivery and Cloud Kitchens
- 1.3 By Service Style
- 1.3.1 Dine-In
- 1.3.2 Takeaway
- 1.3.3 Home Delivery
- 1.3.4 Self-Service
- 1.3.5 Drive-Thru
- 1.4 By End-User
- 1.4.1 Commercial
- 1.4.2 Institutional
- 1.4.3 Transportation
Chapter 2 Introduction
- 2.1 Report Objectives and Scope
- 2.2 Product Definition and Industry Terminology
- 2.3 Market Inclusions and Exclusions
- 2.4 Research Process
- 2.4.1 Primary Research and Expert Interviews
- 2.4.2 Secondary Research and Source Review
- 2.4.3 Top-Down and Bottom-Up Estimation
- 2.4.4 Data Triangulation and Verification
- 2.5 Market Size Measurement Basis
- 2.5.1 2025: USD 25.74 billion → 2035: USD 59.56 billion
- 2.6 Historical and Forecast Reference Periods
- 2.6.1 Historical Period: 2018-2025
- 2.6.2 Base Year: 2025
- 2.6.3 Forecast Period: 2025-2035
- 2.7 Research Assumptions and Limitations
Chapter 3 Executive Summary
- 3.1 Market Snapshot and Key Findings
- 3.2 Base-Year Market Size, 2025
- 3.3 Forecast Market Size, 2035
- 3.4 Revenue and Volume Growth Outlook
- 3.5 Key Demand and Supply Indicators
- 3.6 Leading Market Segments
- 3.7 Fastest-Growing Market Opportunities
- 3.8 Regional Performance Highlights
- 3.9 Technology and Industry Transformation
- 3.10 Competitive Landscape Summary
- 3.11 Analyst View and Strategic Implications
Chapter 4 Malaysia Food Service Market Trends and Developments
- 4.1 Historical Industry Development, 2018-2025
- 4.2 Recent Market Trends and Developments
- 4.3 Demand and Customer Behavior Trends
- 4.4 Technology and Product Innovation
- 4.5 Artificial Intelligence, Automation and Digitalization
- 4.6 Local Manufacturing and Supply Chain Realignment
- 4.7 Industry Partnerships, Mergers and Acquisitions
- 4.8 Sustainability and Circular Economy Developments
- 4.9 Government and Private Sector Investment Trends
- 4.10 Emerging Business Models and Commercialization
- 4.11 Industry Developments and Announcements
Chapter 5 Malaysia Food Service Market Supply and Demand Analysis
- 5.1 Demand Trend and Consumption Analysis, 2018-2025
- 5.2 Demand Forecast, 2025-2035
- 5.3 Supply Chain Structure and Procurement Trends
- 5.4 Supply-Demand Gap and Bottlenecks
- 5.5 Import Dependence and Sourcing Structure
- 5.6 Regional Supply and Demand Concentration
Chapter 6 Malaysia Food Service Market Pricing Analysis
- 6.1 Pricing Structure and Measurement
- 6.2 Historical Pricing Trends, 2018-2025
- 6.3 Pricing Outlook, 2025-2035
- 6.4 Pricing by Product and Market Segment
- 6.5 Geographic Pricing Differences
- 6.6 Key Input, Energy, Labor and Logistics Costs
- 6.7 Contract Pricing and Purchasing Models
- 6.8 Pricing Sensitivity and Competitive Positioning
- 6.9 Price, Margin and Profitability Implications
Chapter 7 Malaysia Food Service Market Dynamics
- 7.1 Market Growth Drivers
- 7.1.1 Demand-Side Drivers
- 7.1.2 Technology and Innovation Drivers
- 7.1.3 Infrastructure and Investment Drivers
- 7.1.4 Regulatory and Policy Drivers
- 7.2 Market Restraints
- 7.2.1 Cost and Affordability Constraints
- 7.2.2 Technology and Adoption Barriers
- 7.2.3 Supply Chain and Operational Constraints
- 7.3 Market Challenges
- 7.3.1 Competitive Pressure and Margin Erosion
- 7.3.2 Skills, Infrastructure and Implementation Gaps
- 7.4 Emerging Market Opportunities
- 7.5 Market Dynamics Impact and Time-Horizon Assessment
Chapter 8 Malaysia Food Service Value Chain Analysis
- 8.1 Industry Value Chain Overview
- 8.2 Upstream Suppliers and Critical Inputs
- 8.3 Technology and Component Providers
- 8.4 Manufacturing or Service Delivery
- 8.5 Distribution, Channel Partners and Integrators
- 8.6 Downstream Applications and End Users
- 8.7 Value Addition and Profit Pools
- 8.8 Vertical Integration and Outsourcing
- 8.9 Supplier Concentration and Risk
- 8.10 Supply Chain Localization and Resilience
Chapter 9 Malaysia Food Service Market Regulations and Policies
- 9.1 Relevant Laws, Standards and Compliance Frameworks
- 9.2 Product, Service, Safety and Quality Requirements
- 9.3 Government Policies, Incentives and Subsidies
- 9.4 Imports, Exports and Trade Barriers
- 9.5 Public Procurement and Local Content Requirements
- 9.6 Data Protection, AI and Cybersecurity Compliance
- 9.7 Upcoming Policy Changes and Market Implications
Chapter 10 Malaysia Food Service Market Hotspots and Opportunities
- 10.1 Market Opportunity Mapping and Growth Hotspots
- 10.2 High-Growth Applications and Customer Groups
- 10.3 Underserved Markets and White-Space Opportunities
- 10.4 Emerging Technology and Product Opportunities
- 10.5 New Capacity and Investment Hotspots
- 10.6 Market Entry and Expansion Opportunities
- 10.7 Distribution and Partnership Opportunities
- 10.8 Near-Term and Long-Term Commercial Potential
- 10.9 Opportunity Attractiveness and Execution Risks
Chapter 11 Malaysia Food Service Market Outlook, 2025-2035
- 11.1 Market Size and Analysis
- 11.1.1 Revenue (Market Measurement: 2025: USD 25.74 billion → 2035: USD 59.56 billion)
- 11.1.2 Historical Market Size, 2018-2025
- 11.1.3 Base-Year Market Size, 2025
- 11.2 Market Forecast, 2025-2035
- 11.2.1 Revenue Forecast to 2035
- 11.2.2 CAGR and Year-on-Year Growth
- 11.2.3 Incremental Revenue Opportunity
- 11.3 Forecast Assumptions and Scenario Analysis
- 11.3.1 Base-Case Forecast
- 11.3.2 Optimistic and Conservative Scenarios
- 11.3.3 Technology, Pricing and Policy Sensitivities
- 11.4 Market Attractiveness and Growth Outlook
Chapter 12 Malaysia Food Service Market Segmentation and Outlook
- 12.1 Segmentation Summary and Market Shares, 2025
- 12.2 Largest and Fastest-Growing Segments
- 12.3 By Type of Outlet - Market Size and Forecast, 2025-2035
- 12.3.1 Segment Definition and Scope
- 12.3.2 Historical Market Size, 2018-2025
- 12.3.3 Revenue Forecast, 2025-2035
- 12.3.4 Base-Year Market Share, 2025
- 12.3.5 Segment CAGR and Growth Drivers
- 12.3.6 Subsegment Market Size and Forecast
- 12.3.6.1 Full-Service Restaurants
- 12.3.6.2 Quick-Service Restaurants
- 12.3.6.3 Cafes and Coffee Shops
- 12.3.6.4 Street Food and Hawker Centers
- 12.3.6.5 Catering Services
- 12.3.6.6 Food Delivery and Cloud Kitchens
- 12.3.7 Subsegment Pricing and Adoption Trends
- 12.3.8 Leading Suppliers and Competition
- 12.3.9 Regional Demand and Opportunities
- 12.4 By Service Style - Market Size and Forecast, 2025-2035
- 12.4.1 Segment Definition and Scope
- 12.4.2 Historical Market Size, 2018-2025
- 12.4.3 Revenue Forecast, 2025-2035
- 12.4.4 Base-Year Market Share, 2025
- 12.4.5 Segment CAGR and Growth Drivers
- 12.4.6 Subsegment Market Size and Forecast
- 12.4.6.1 Dine-In
- 12.4.6.2 Takeaway
- 12.4.6.3 Home Delivery
- 12.4.6.4 Self-Service
- 12.4.6.5 Drive-Thru
- 12.4.7 Subsegment Pricing and Adoption Trends
- 12.4.8 Leading Suppliers and Competition
- 12.4.9 Regional Demand and Opportunities
- 12.5 By End-User - Market Size and Forecast, 2025-2035
- 12.5.1 Segment Definition and Scope
- 12.5.2 Historical Market Size, 2018-2025
- 12.5.3 Revenue Forecast, 2025-2035
- 12.5.4 Base-Year Market Share, 2025
- 12.5.5 Segment CAGR and Growth Drivers
- 12.5.6 Subsegment Market Size and Forecast
- 12.5.6.1 Commercial
- 12.5.6.2 Institutional
- 12.5.6.3 Transportation
- 12.5.7 Subsegment Pricing and Adoption Trends
- 12.5.8 Leading Suppliers and Competition
- 12.5.9 Regional Demand and Opportunities
- 12.6 Segment Growth Comparison
- 12.7 Segment Attractiveness and Priority Matrix
Chapter 13 Malaysia Food Service End-Use and Application Market Outlook
- 13.1 End-Use Industry and Customer Demand Structure
- 13.2 Leading Applications and Customer Groups
- 13.3 End-Use Market Size, Share and Forecast
- 13.4 Major End-Use Industry Deep Dives
- 13.4.1 Customer Requirements and Use Cases
- 13.4.2 Demand and Replacement Cycles
- 13.4.3 Technical and Regulatory Considerations
- 13.4.4 Purchasing and Procurement Models
- 13.4.5 Leading Vendors and Distribution Channels
- 13.4.6 Forecast and Commercial Opportunities
- 13.5 Emerging Applications and Cross-Segment Demand
- 13.6 End-Use Industry Investment Priorities
Chapter 14 Malaysia Food Service Geographic Market Outlook, 2025-2035
- 14.1 Domestic Market Distribution and Demand Clusters
- 14.2 State- or Province-Wise Market Size and Forecast, 2025-2035
- 14.3 City and Metropolitan Market Outlook
- 14.4 Industrial, Manufacturing and Commercial Clusters
- 14.5 Geographic Concentration of Key End Users
- 14.6 Local Pricing and Purchasing Differences
- 14.7 Domestic Production Facilities and Capacity Map
- 14.8 Local Infrastructure and Project Pipeline
- 14.9 State-Level Policy and Incentive Differences
- 14.10 Subnational Investment Hotspots and Opportunities
- 14.11 Distribution and Logistics Networks
- 14.12 Domestic Competitive Footprint
Chapter 15 Malaysia Food Service Technology, Innovation and Sustainability Outlook
- 15.1 Technology Landscape and Maturity
- 15.2 Product, Process and Service Innovation
- 15.3 AI, Automation and Digital Tools in the Industry
- 15.4 Technology Adoption and Performance Benchmarking
- 15.5 Innovation Pipeline and R&D Investment
- 15.6 Energy Efficiency and Resource Management
- 15.7 Sustainability, Recycling and Circularity
- 15.8 Technology Roadmap, 2025-2035
- 15.9 Risks of Obsolescence and Technology Substitution
Chapter 16 Malaysia Food Service Market Key Strategic Imperatives
- 16.1 Growth and Market Entry Priorities
- 16.2 High-Return Products and Segments
- 16.3 Pricing, Profitability and Cost Optimization
- 16.4 Technology Investment and Product Differentiation
- 16.5 Supply Chain Localization and Resilience
- 16.6 Distribution and Customer Acquisition
- 16.7 Partnership, Acquisition and Capacity Strategy
- 16.8 Regional Expansion Priorities
- 16.9 Short-, Medium- and Long-Term Actions
Chapter 17 Competition Outlook
- 17.1 Industry Competition Characteristics
- 17.2 Market Structure and Concentration
- 17.3 Market Share and Competitive Positioning, 2025
- 17.4 Company-Wise Revenue and Product Benchmarking
- 17.5 Production and Service Capacity Benchmarking
- 17.6 Technology, Pricing and Differentiation
- 17.7 Regional Footprint and Distribution Strength
- 17.8 Mergers, Acquisitions and Strategic Alliances
- 17.9 New Entrants and Competitive Threats
- 17.10 Porter's Five Forces and Industry Attractiveness
- 17.11 Competitive Outlook, 2025-2035
Chapter 18 Company Profiles
- 18.1 Company Coverage and Selection Criteria
- 18.2 QSR Brands (M) Holdings
- 18.2.1 Business Description
- 18.2.2 Company Ownership and Geographic Presence
- 18.2.3 Product and Service Portfolio
- 18.2.4 Manufacturing and Operating Footprint
- 18.2.5 Financial Performance and Investment
- 18.2.6 Market Share and Competitive Position
- 18.2.7 Technology and Innovation Capabilities
- 18.2.8 Strategic Alliances or Partnerships
- 18.2.9 Recent Developments
- 18.2.10 Growth Strategy and Outlook
- 18.3 McDonald's Malaysia
- 18.4 ZUS Coffee
- 18.5 Berjaya Food (Starbucks Malaysia)
- 18.6 Texchem Resources (Sushi King)
- 18.7 Domino's
- 18.8 Marrybrown
- 18.9 Mixue Malaysia
- 18.10 Tealive (Loob Holding)
- 18.11 Secret Recipe
- 18.12 Other Relevant Market Participants
Note: Every listed company is profiled on the structure shown under the first company. The company list is preliminary and may change based on research findings, market developments, data availability and client requirements.
Chapter 19 Disclaimer
- 19.1 Research and Forecast Disclaimer
- 19.2 Data Source and Estimation Limitations
Note: The depth of individual sections depends on data availability for this market. Volume, capacity, trade and other unit-based metrics are included where applicable.

