
Cultured dairy habits anchor a chilled shelf
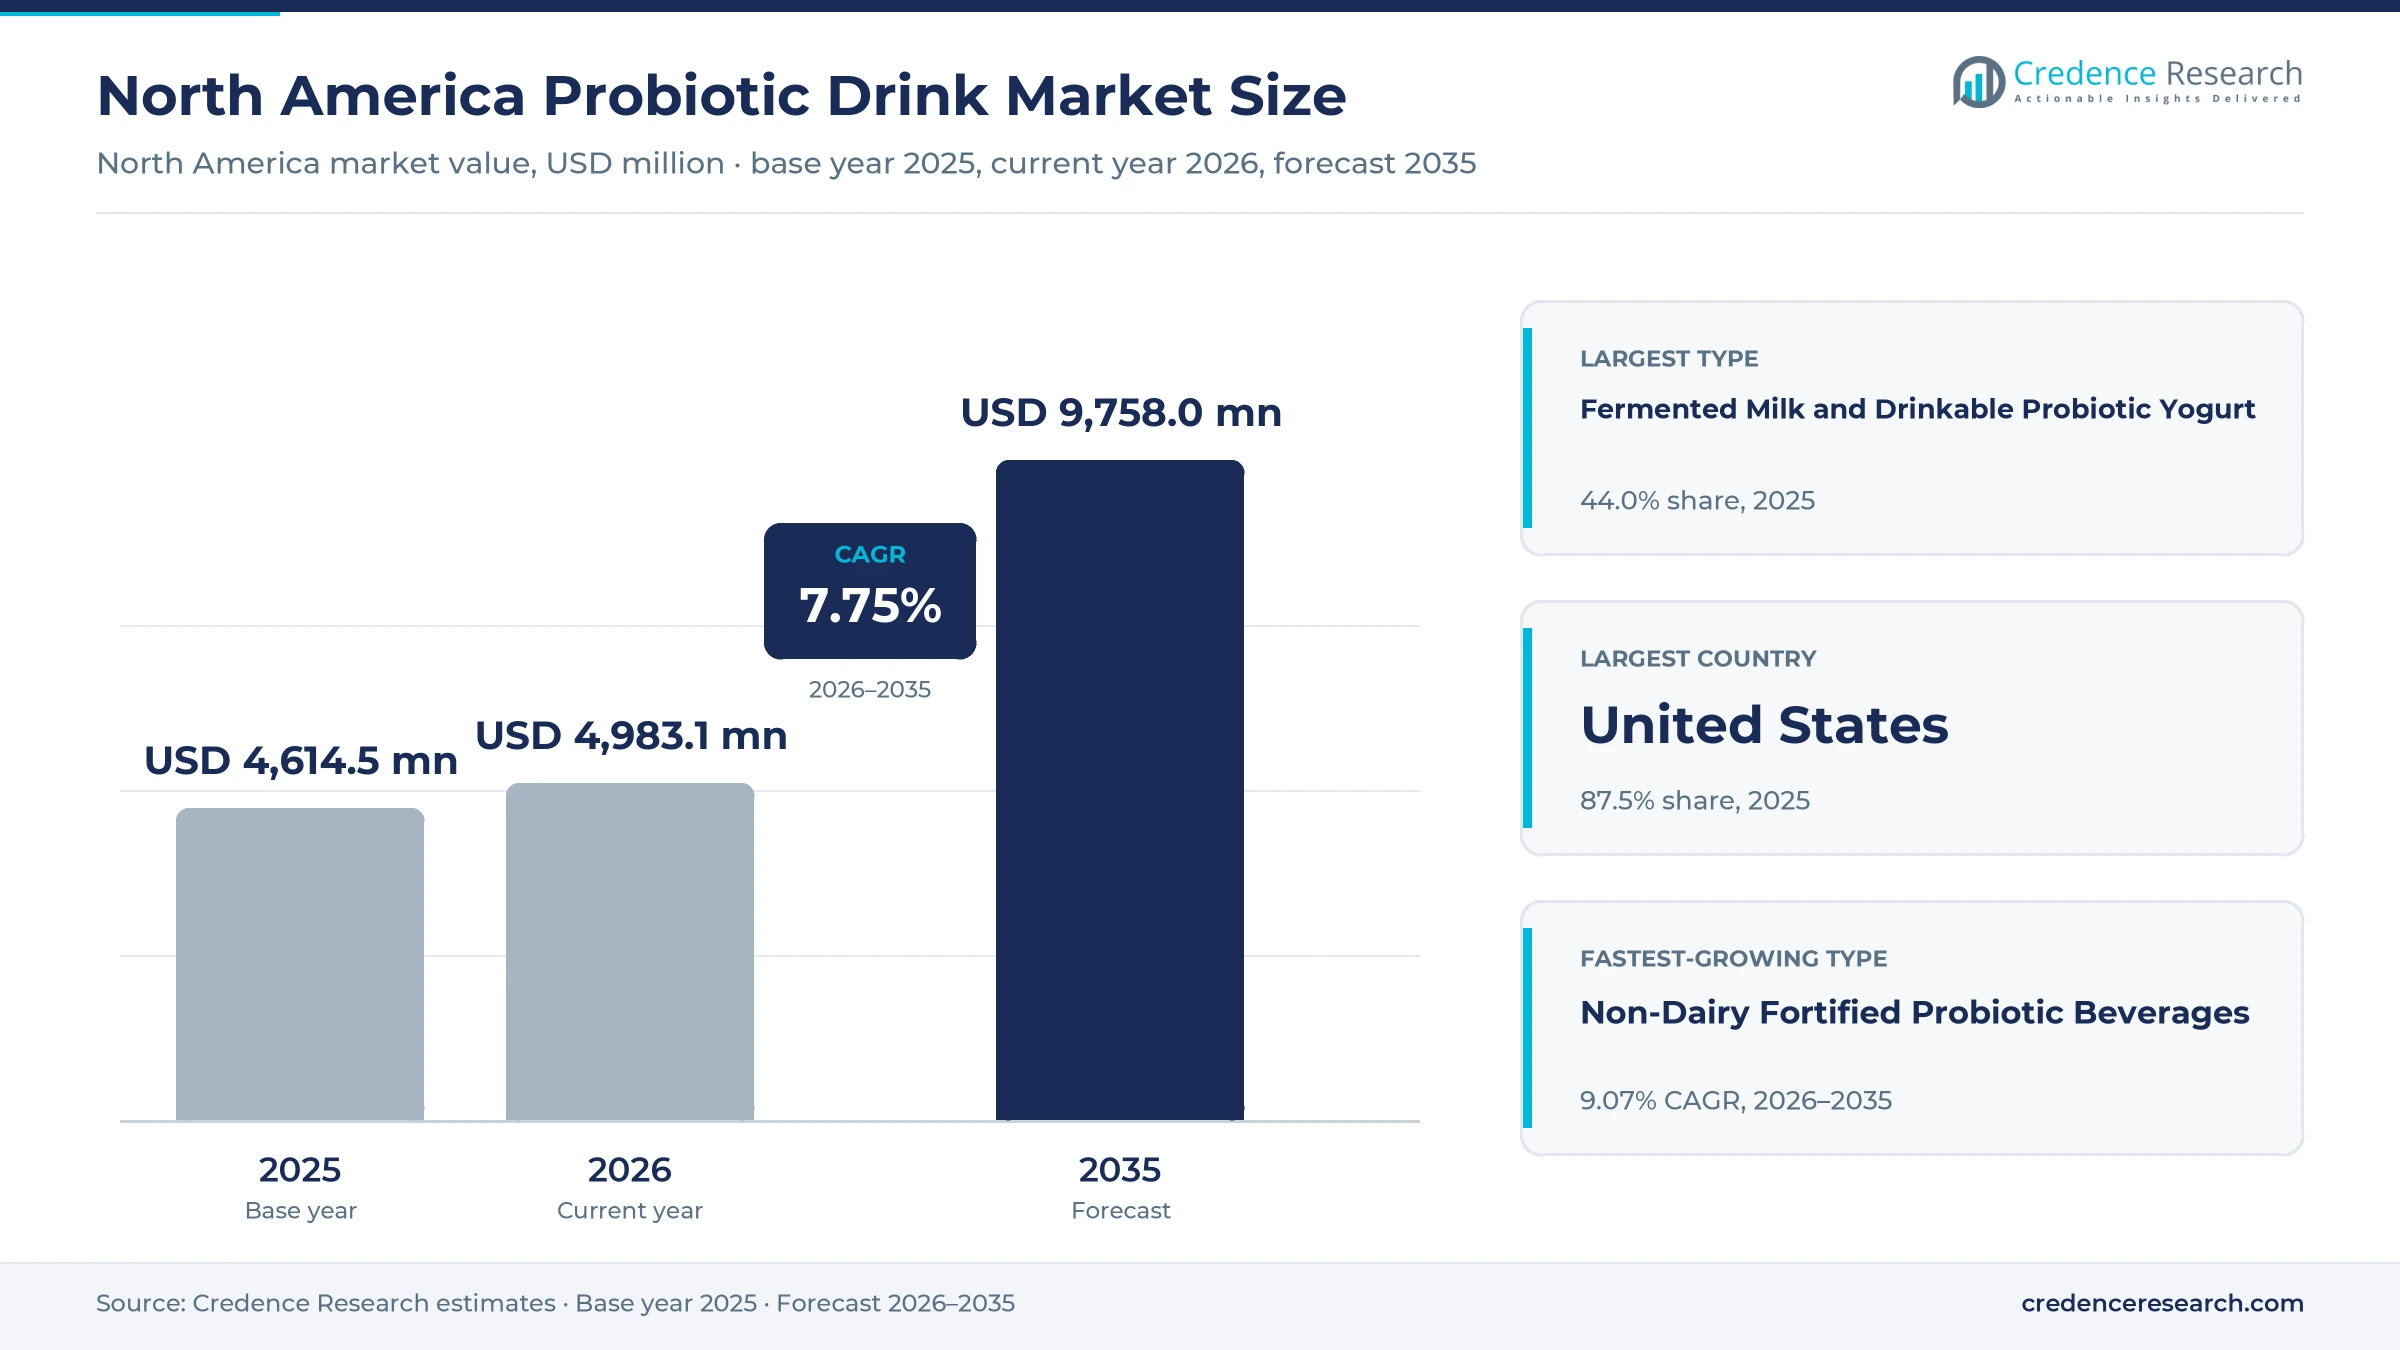
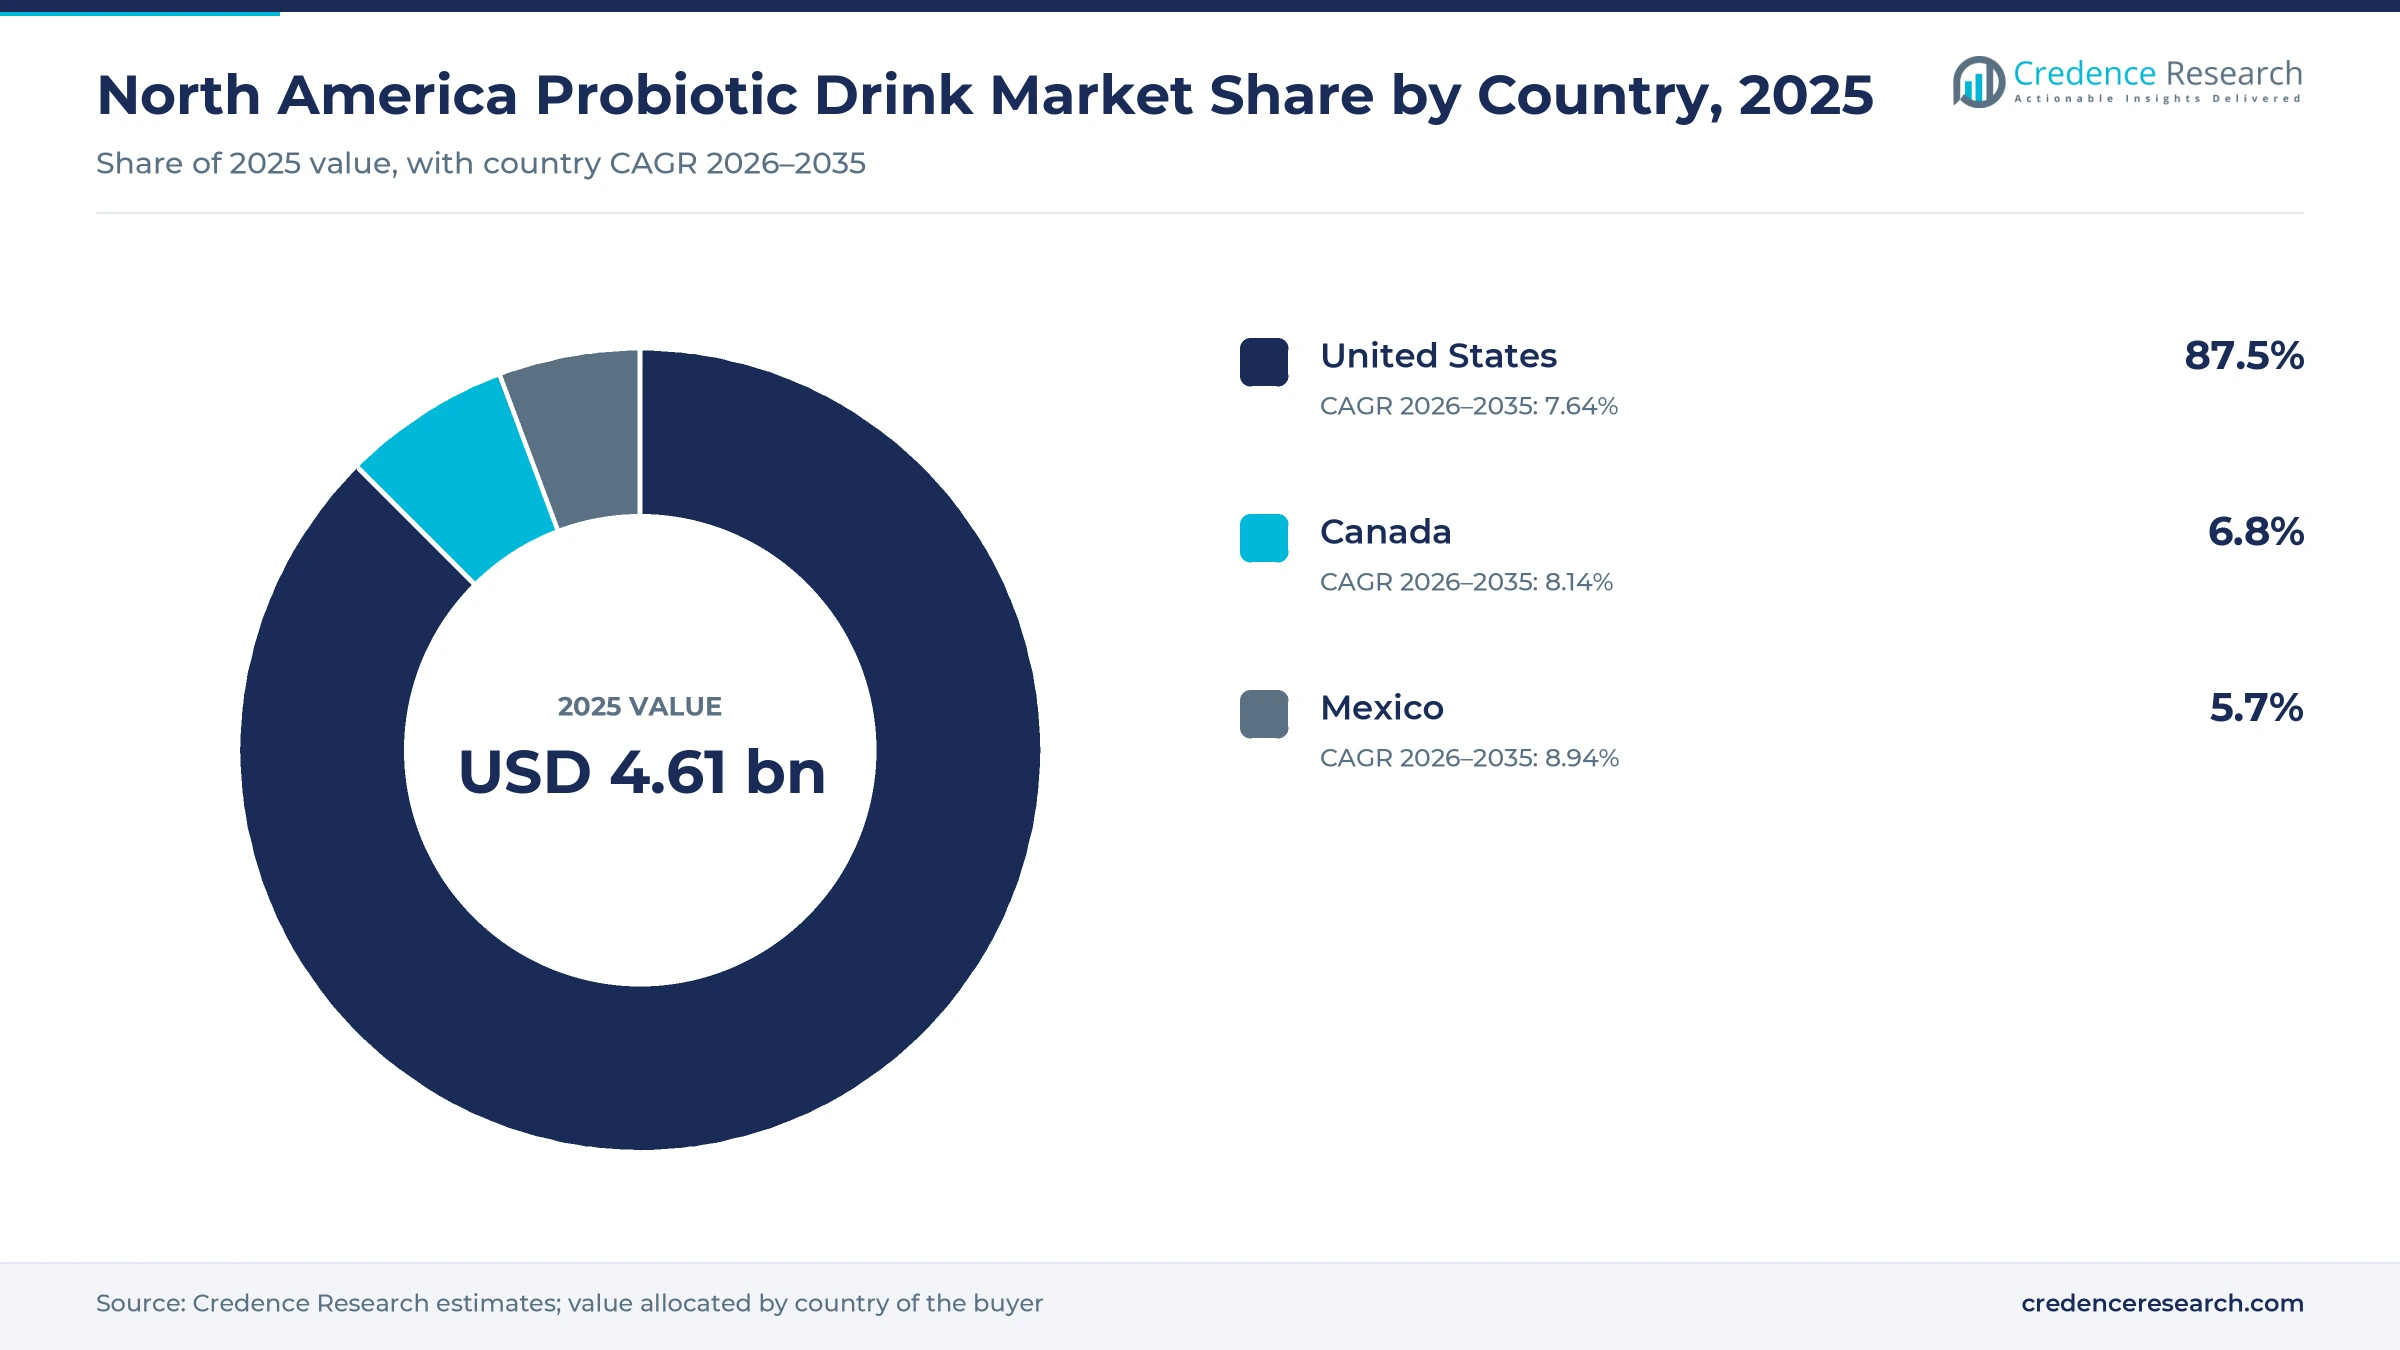
The North America probiotic drink market was valued at USD 4.61 billion in 2025 and is projected to increase from USD 4.98 billion in 2026 to USD 9.76 billion by 2035, registering a CAGR of 7.75% during 2026–2035. Demand rests on repeat purchases of small daily cultured dairy bottles and refrigerated kombucha, sold mainly through grocery coolers and increasingly through online replenishment. United States held the largest share, 87.5% in 2025, because household incomes and chilled distribution there exceed those of its neighbors. Mexico is the fastest-growing country at 8.94% a year, helped by reformulated low-sugar kefir and a higher tax on sweetened soft drinks in 2026. The most significant recent change is federal guidance, since the 2025–2030 Dietary Guidelines for Americans released in January 2026 name kefir among fermented dairy foods. Producers are responding with capacity, including a Yakult plant in Georgia designed for 2.7 million bottles a day at peak.
Which live-culture beverages count toward this estimate?
The market counts refrigerated and shelf-stable beverages sold with live cultures, including kombucha, fermented milk, drinkable yogurt, kefir and non-dairy fortified drinks. Values reflect sales across grocery, club, convenience, online and foodservice channels in the United States, Canada and Mexico. Household shoppers buy most volume through weekly grocery trips, while individual consumers buy single bottles for immediate use.
Spoonable yogurt, capsules, powders and prebiotic-only sodas without live cultures are excluded from the estimate. The value chain runs from culture suppliers and milk or tea inputs through fermentation plants, refrigerated distributors and retailers. Cold storage matters at every stage because culture counts and, for kombucha, alcohol levels both change as bottles warm.
North America Probiotic Drink Market Insights
- The market rises from USD 4.61 billion in 2025 to USD 9.76 billion by 2035, a 7.75% CAGR, as cultured dairy, kombucha and dairy-free bottles win regular grocery purchases.
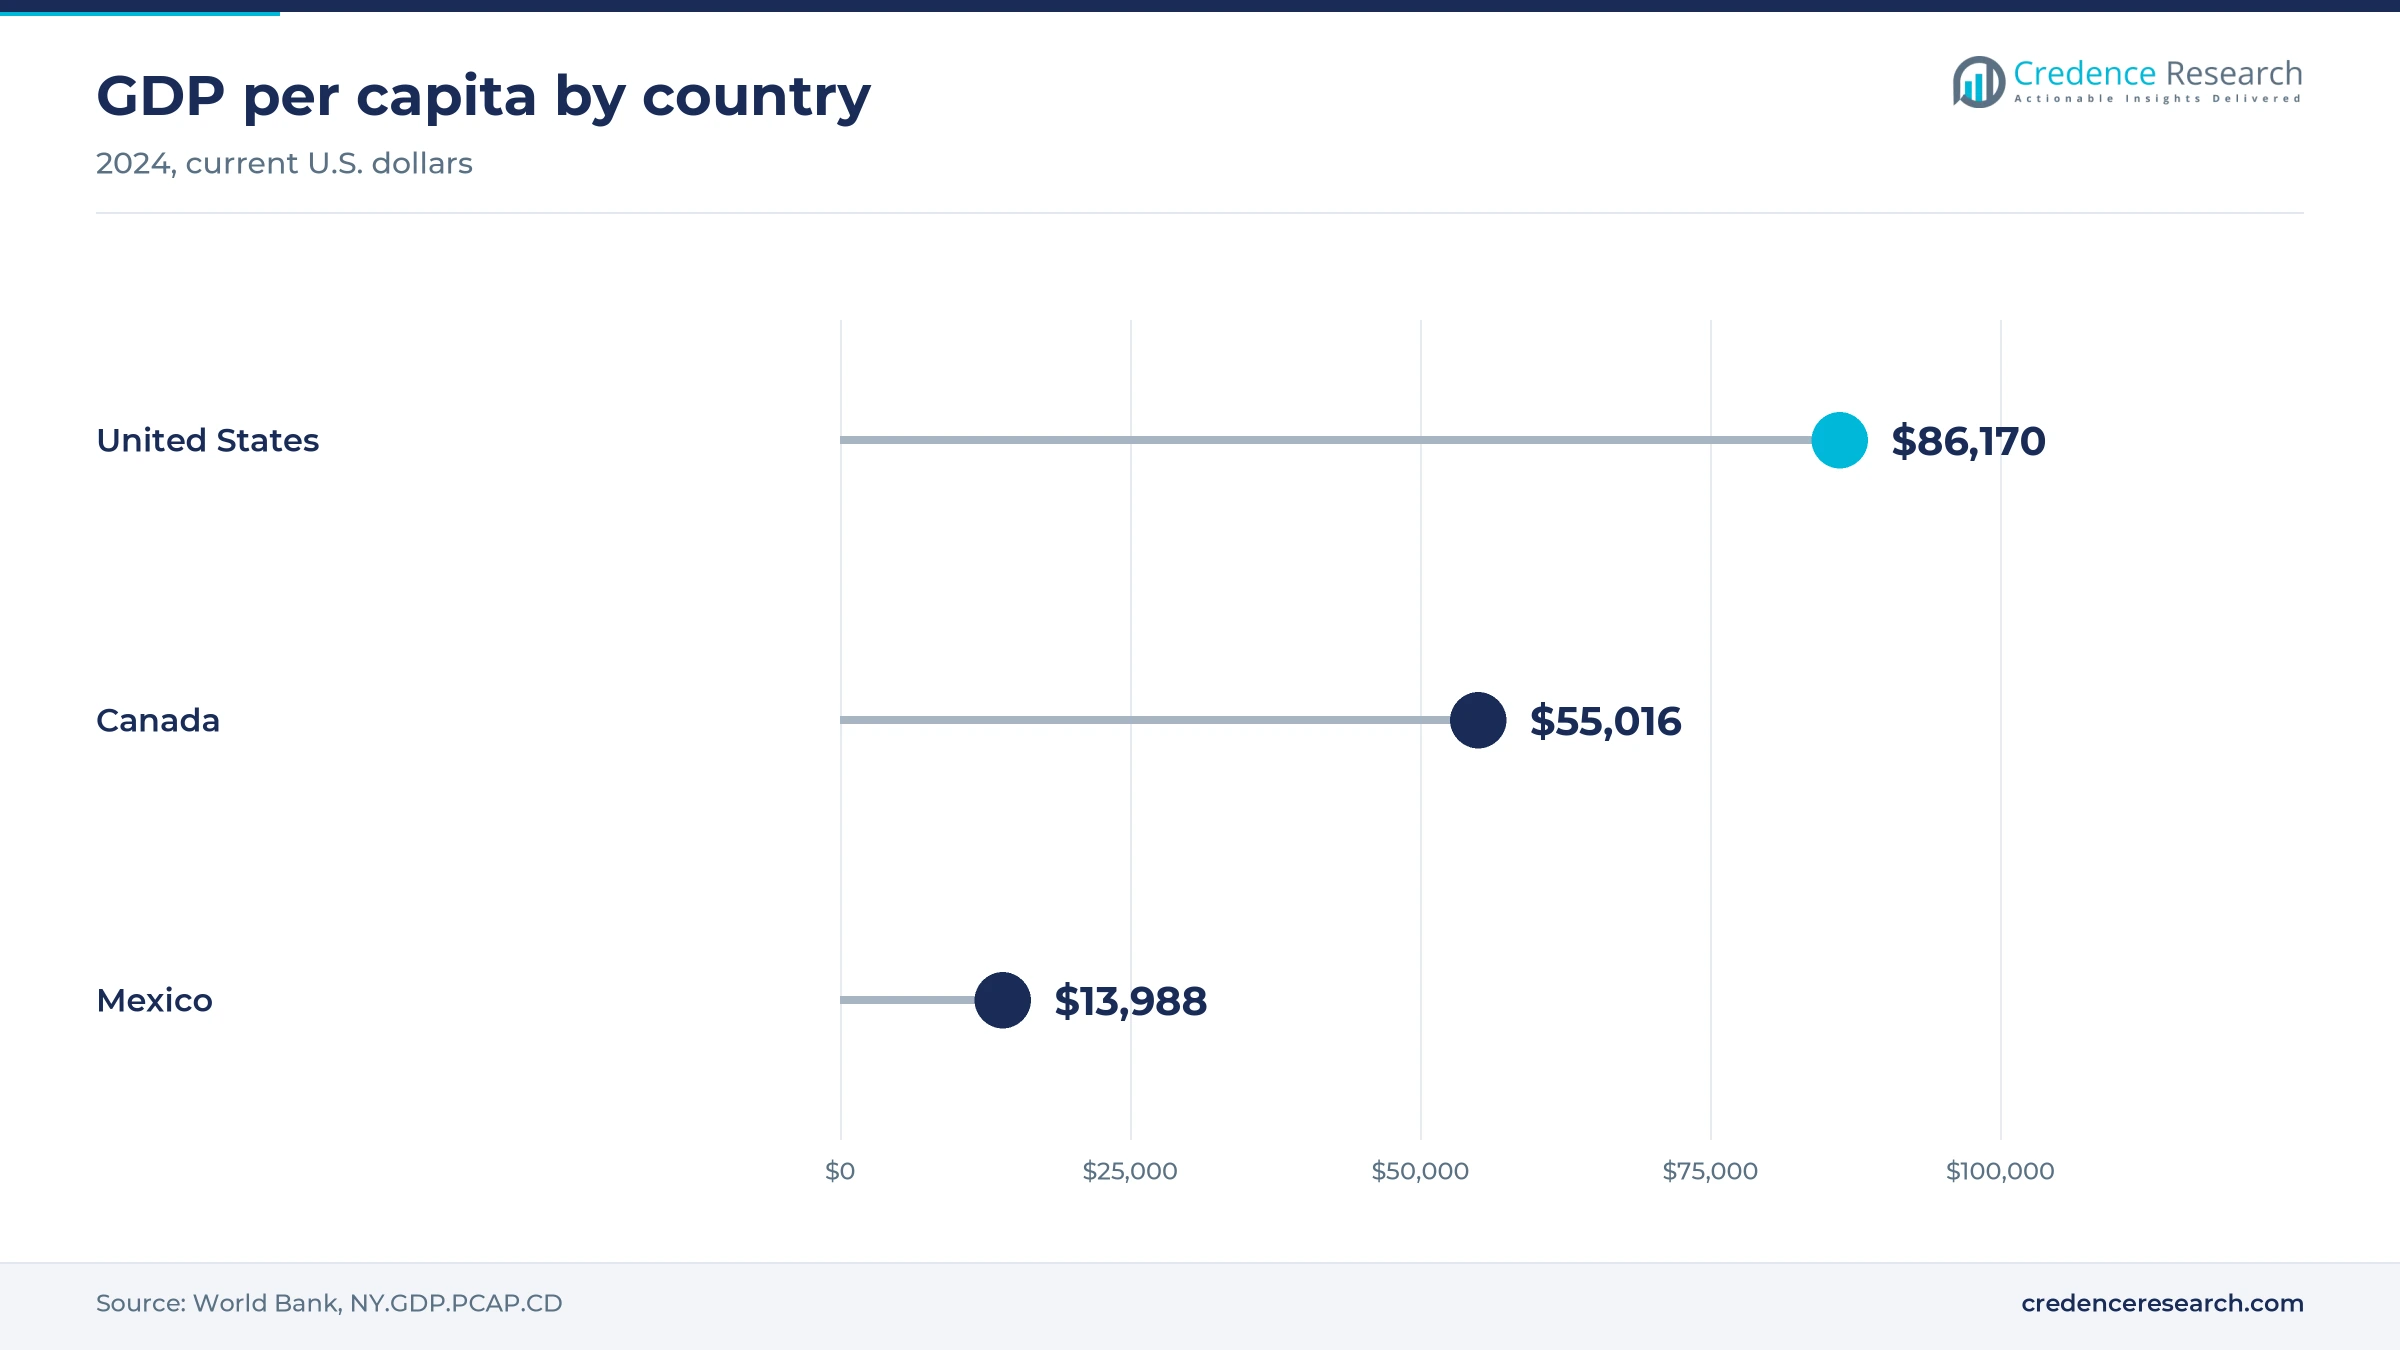
- The United States held 87.5% of 2025 value, supported by GDP per capita of about $86,170 in 2024 according to World Bank data.
- Fermented Milk and Drinkable Probiotic Yogurt led product types with 44.0% of 2025 value, because low-priced daily bottles anchor repeat purchases in grocery coolers.
- Federal guidance shifted on Jan. 7, 2026, when the Dietary Guidelines for Americans named kefir, following an FDA qualified yogurt claim dated March 1, 2024.
- Investment is concentrating in scale, shown by Chobani raising $650 million in October 2025 and Yakult building a $305 million plant in White, Georgia.
Daily-dose cultured dairy still sets the volume base
Why cultured dairy bottles outsell kombucha and kefir
Based on product type, the market is categorized into kombucha, Fermented Milk and Drinkable Probiotic Yogurt, Kefir and Non-Dairy Fortified Probiotic Beverages. Fermented Milk and Drinkable Probiotic Yogurt led with 44.0% of 2025 value because small daily doses stay cheap, and a five-pack of Yakult was listed at $3.28 on Walmart's U.S. site in November 2026. Non-Dairy Fortified Probiotic Beverages grows fastest at 9.07% a year as coconut bottles carrying 10 billion CFUs from Harmless Harvest, reviewed by BevNET in February 2020, have opened a route for shoppers avoiding dairy.
How price tiers split between daily and premium bottles
Based on price tier, the market is categorized into Mainstream, Accessible Premium and Specialist Premium. Mainstream led with 58.0% of 2025 value because a 32-ounce Lifeway kefir was listed at $3.66 on Walmart's U.S. site in November 2026, which gives households several servings per bottle. Accessible Premium grows fastest at 8.43% a year as 16-ounce Synergy kombucha at $3.64 on the same site and Costco six-packs of Health-Ade averaging $13.38, according to Warehouse Runner price checks, keep premium brands within reach of weekly shoppers.
Why store coolers still dominate while online scales
Based on distribution channel, the market is categorized into Store-Based Retail, Online and Direct-to-Consumer, and Foodservice. Store-Based Retail led with 78.0% of 2025 value because live cultures need refrigerated handling, and Health-Ade alone reached about 65,000 retail outlets, according to Food Processing in July 2025. Online and Direct-to-Consumer grows fastest at 9.30% a year as e-commerce reached 17.1% of U.S. retail sales in the second quarter of 2026, according to the U.S. Census Bureau, which widens the base for scheduled grocery orders.
How pack size follows the occasion
Based on packaging format, the market is categorized into Single-Serve Packs, Multi-Serve Packs and Multipacks. Single-Serve Packs led with 55.0% of 2025 value because grab-and-go bottles dominate the cooler, with KeVita Master Brew at 15.2 ounces listed from $3.28 on Walmart's U.S. site in November 2026. Multipacks grows fastest at 8.43% a year as club and online buyers favor bulk, shown by a 12-count Humm case at $39.95 on Walmart's site and six-packs of Health-Ade sold across 562 Costco warehouses, according to Warehouse Runner.
| Segment Group | Leading Sub-segment | Share, 2025 | Fastest-growing Sub-segment | CAGR, 2026–2035 |
|---|---|---|---|---|
| By Product Type | Fermented Milk and Drinkable Probiotic Yogurt | 44.0% | Non-Dairy Fortified Probiotic Beverages | 9.07% |
| By Price Tier | Mainstream | 58.0% | Accessible Premium | 8.43% |
| By Distribution Channel | Store-Based Retail | 78.0% | Online and Direct-to-Consumer | 9.30% |
| By Packaging Format | Single-Serve Packs | 55.0% | Multipacks | 8.43% |
Request a Free Sample
Fill in your details and we'll send you a free sample report.
- Sample data tables & charts
- Research methodology
Federal guidance and new plants lift supply and demand
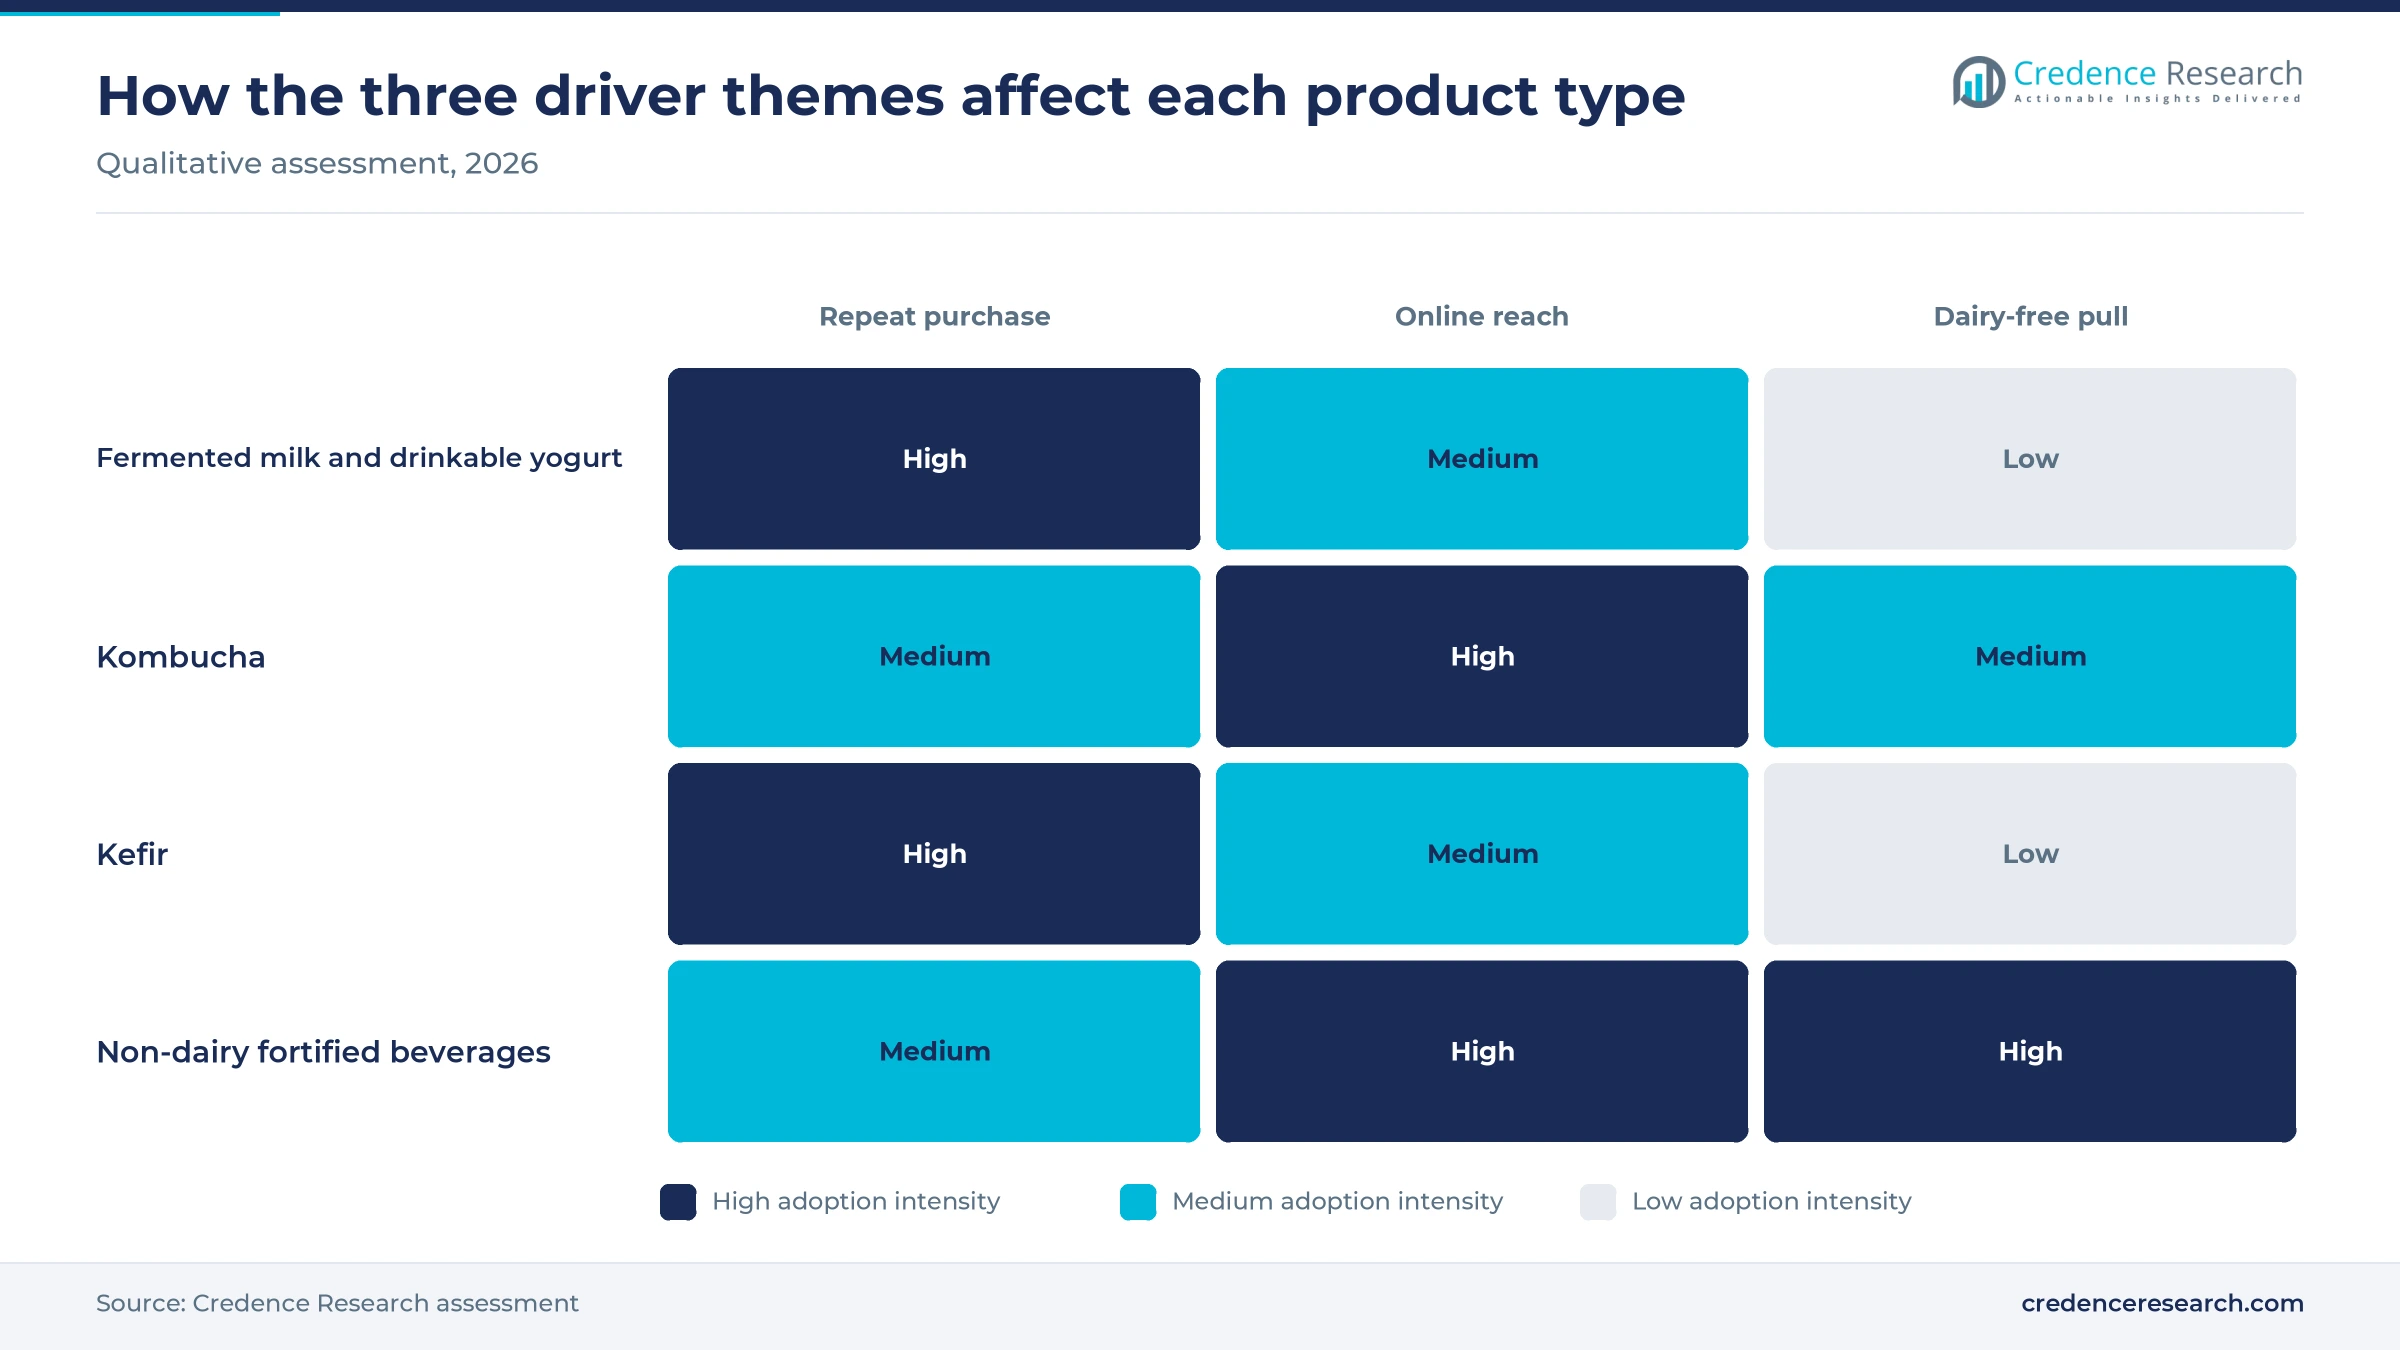
Repeat-purchase cultured nutrition builds a weekly habit
Cultured drinks behave like a routine grocery item, and that habit gives producers unusually steady volume. The FDA strengthened this position on March 1, 2024, when it allowed a qualified yogurt claim tied to at least two cups, or three servings, a week. In turn, the Dietary Guidelines for Americans released on Jan. 7, 2026, named kefir among fermented dairy products, according to FoodBev Media. Lifeway Foods reported 22 consecutive quarters of growth by September 2025, which shows how persistent kefir demand has become. These signals favor fermented foods and beverages sold at weekly-shop prices, which explains why Fermented Milk and Drinkable Probiotic Yogurt held 44.0% of 2025 value.
Digital replenishment infrastructure widens chilled reach
Online grocery systems now let shoppers schedule chilled cases instead of buying single bottles, and that raises purchase frequency. According to the U.S. Census Bureau, e-commerce reached 17.1% of retail sales in the second quarter of 2026, a figure that supports online demand for chilled cases. Walmart's U.S. site listed case formats in November 2026, including an 18-count Humm variety pack at $53.95. Costco also carried Health-Ade six-packs in 562 warehouses, according to Warehouse Runner, and those club listings train shoppers to buy in bulk. As a result, Online and Direct-to-Consumer grows at 9.30% a year, while brands with national cold-chain partners gain an advantage over regional brewers.
Dairy-free format expansion brings in new households
Dairy-free recipes extend the category to lactose-avoiding and vegan households that cultured milk cannot serve. Chobani launched oat-based probiotic drinks in 14-ounce bottles at $3.79 in July 2020, according to vegconomist, which set an early mainstream price point. Harmless Harvest followed with coconut drinks in 8-ounce and 24-ounce bottles carrying 10 billion CFUs, according to BevNET in February 2020. The Systm Foods purchase of Humm in January 2024 then added low- and zero-sugar kombucha to a refrigerated functional beverage portfolio, according to Food Processing. Because each launch widened cooler space beyond dairy, Non-Dairy Fortified Probiotic Beverages is the fastest product group at 9.07% a year through the forecast period.
New North American plants ease chilled capacity limits
Producers are adding plants because cultured drinks are difficult to import fresh over long distances. Yakult U.S.A. committed $305 million to White, Georgia, according to Manufacturing Dive in July 2023, and its 250,000-square-foot plant is designed for 2.7 million bottles a day across six lines from 2026. Chobani broke ground on a $1.2 billion plant in Rome, New York on April 22, 2025, sized for 12 million pounds of milk a day. Danone also announced a Boucherville, Quebec, expansion in November 2025, according to Just Food, which lifts milk processing by 20% to serve yogurt demand. This capacity supports the 7.64% annual growth expected in United States.
Consolidation and low-sugar recipes reshape the shelf
Shift toward consolidated refrigerated beverage portfolios
Independent brands are moving into larger portfolios because national cooler access is expensive to build alone. PepsiCo agreed to pay $1.95 billion for the prebiotic soda brand poppi on March 17, 2025, according to Food Processing, and it already owns KeVita. Generous Brands then agreed in July 2025 to acquire Health-Ade, adding it to Bolthouse Farms and Evolution Fresh, according to the same publication. Lifeway Foods said on Sept. 18, 2025, that Danone had withdrawn its unsolicited proposal, which shows that dairy majors are also pursuing kefir assets. Consequently, smaller brewers face stronger rivals for distribution, and buyers increasingly see bundled portfolios rather than single kombucha brands.
Rise of low-sugar and high-protein cultured recipes
Recipes are moving toward less sugar and more protein as labels and federal guidance reward both attributes. Danone launched Oikos Fusion, a drinking yogurt built around satiety and muscle health, in North America during 2025, according to NutraIngredients in February 2026. Grupo Lala introduced Lala Kefir in Mexico in October 2026 with no added sugar, 19 live strains and none of the country's warning labels, according to Dairy News Today. Humm sells low- and zero-sugar kombucha under Systm Foods, according to Food Processing. This reformulation pulls functional yogurt and drinkable formats closer together, and it helps Accessible Premium products justify higher shelf prices.
Opportunity in Mexican low-sugar kefir and yogurt drinks
Mexico offers an opening for cultured drinks that avoid warning labels and sit outside the sweetened-soda price rise. The tax on sweetened beverages rose from MX$1.64 to MX$3.08 a liter in the 2026 budget, according to Mexico Daily Post, with shelf prices expected to climb 10% to 15%, which may shift demand toward unsweetened options. Schools also banned sugary fruit drinks from March 29, 2025, according to the Canadian Press, and UNICEF attributes 40% of children's daily calories to sugary drinks and processed foods. Danone earmarked 100 million euros for Mexican operations in 2024, according to Dairy News Today. Producers with low-sugar lines can therefore build share in the fastest-growing country in this report.
Opportunity in foodservice cold boxes and draft kombucha
Foodservice remains underdeveloped, which gives brands an opening to reach drinkers who rarely visit the chilled aisle. Food away from home took 56.3% of U.S. food spending in 2025, according to the USDA Economic Research Service, yet Store-Based Retail still dominates this category. Brew Dr. Kombucha showed a workable model at Portland's Providence Park, where a custom cart served four flavors on tap during the 2018 and 2019 seasons, according to BevNET. KeVita also released 2-ounce shots in July 2021, according to Beverage Industry, a size that suits cafeterias and counters. Operators gain a nonalcoholic choice for their menus, while brands gain trial among individual consumers who seldom shop the chilled aisle.
Claims, alcohol limits and sugar rules raise compliance cost
Gut-health claims attract litigation and tighter review
Health wording carries legal risk because evidence often lags marketing. The prebiotic soda brand Poppi agreed to an $8.9 million settlement in July 2025 over "gut healthy" claims without admitting wrongdoing, according to KPTV. Health Canada guidance last modified in October 2024 also says that only certain disease risk reduction claims are permitted on food. Brands selling across borders therefore need separate wording and strain evidence for each country. Mitigation means funding strain-specific studies and keeping label language close to approved claim text.
Alcohol thresholds complicate kombucha distribution
Kombucha keeps fermenting after bottling, so warm handling can push alcohol above legal limits. Current federal law treats fermented beverages at 0.5% alcohol or more as beer, while S. 4457, introduced April 30, 2026, would raise that line to 1.25%, according to The Lobby News. British Columbia tested about 760 kombucha samples in 2019, according to CKPG Today. These rules affect U.S. kombucha brewers most directly, and they respond with tighter cold chains and lower-residual recipes.
Front-of-pack labels and sugar rules squeeze flavored lines
Nutrition labels now penalize sweetened recipes in two of the three countries. Canada's front-of-package symbol took effect Jan. 1, 2026, generally at 15% of daily value for saturated fat, sugars or sodium, according to JD Supra. Mexico also applies warning labels and nearly doubled its soda tax rate in 2026. Sweetened fruit-flavored fermented milks are the most exposed products, particularly among children's lines. Producers mitigate the effect by cutting added sugar, shrinking serving sizes and printing separate packs for each country.
Cold-chain bottlenecks limit supply during demand peaks
Chilled capacity remains tight even with new plants under construction. Danone faced North American yogurt supply bottlenecks in the third quarter of 2025, with new capacity due in 2026, according to NutraIngredients. Lala Kefir is distributed at about 4°C, according to Dairy News Today, which shows how much refrigeration each route requires. Shortages hit retailers and regional brands first because plants prioritize larger accounts. Mitigation includes co-packing agreements, regional production near demand and shelf-life testing on warmer distribution routes.
The U.S. holds the value while Mexico grows fastest
| Country | Value, 2025 (USD billion) | Share, 2025 | CAGR, 2026–2035 |
|---|---|---|---|
| United States | 4.04 | 87.5% | 7.64% |
| Canada | 0.31 | 6.8% | 8.14% |
| Mexico | 0.26 | 5.7% | 8.94% |
United States holds the deepest chilled retail network
The United States held 87.5% of 2025 value and grows at 7.64% a year through the forecast period. GDP per capita of about $86,170 in 2024, according to World Bank data, supports premium demand alongside mainstream cultured dairy. Domestic capacity is also expanding quickly, since Chobani added a $500 million expansion at Twin Falls, Idaho, according to Food Processing. National grocery and club chains give leading brands immediate reach once a product proves itself.
Canada pairs high incomes with stricter claim rules
Canada held 6.8% of 2025 value and grows at 8.14% a year, with a population of about 41.3 million in 2024, according to World Bank data. Danone's Boucherville expansion in Quebec, announced Nov. 14, 2025, raises yogurt tub output by 40%, according to Just Food, which reinforces local supply for cultured dairy demand. However, strict claim limits and new front-of-package symbols mean that U.S. brands usually need separate Canadian labels before entering the market.
Mexico grows fastest on reformulated cultured dairy
Mexico held 5.7% of 2025 value and is the fastest-growing country at 8.94% a year. Its population of about 130.9 million in 2024 is about three times Canada's, but GDP per capita of about $13,988, according to World Bank data, keeps demand per person lower. Local dairy groups lead the response, as Grupo Lala's kefir launch shows, and Lifeway Foods also lists Mexico among its markets in its September 2025 statement.
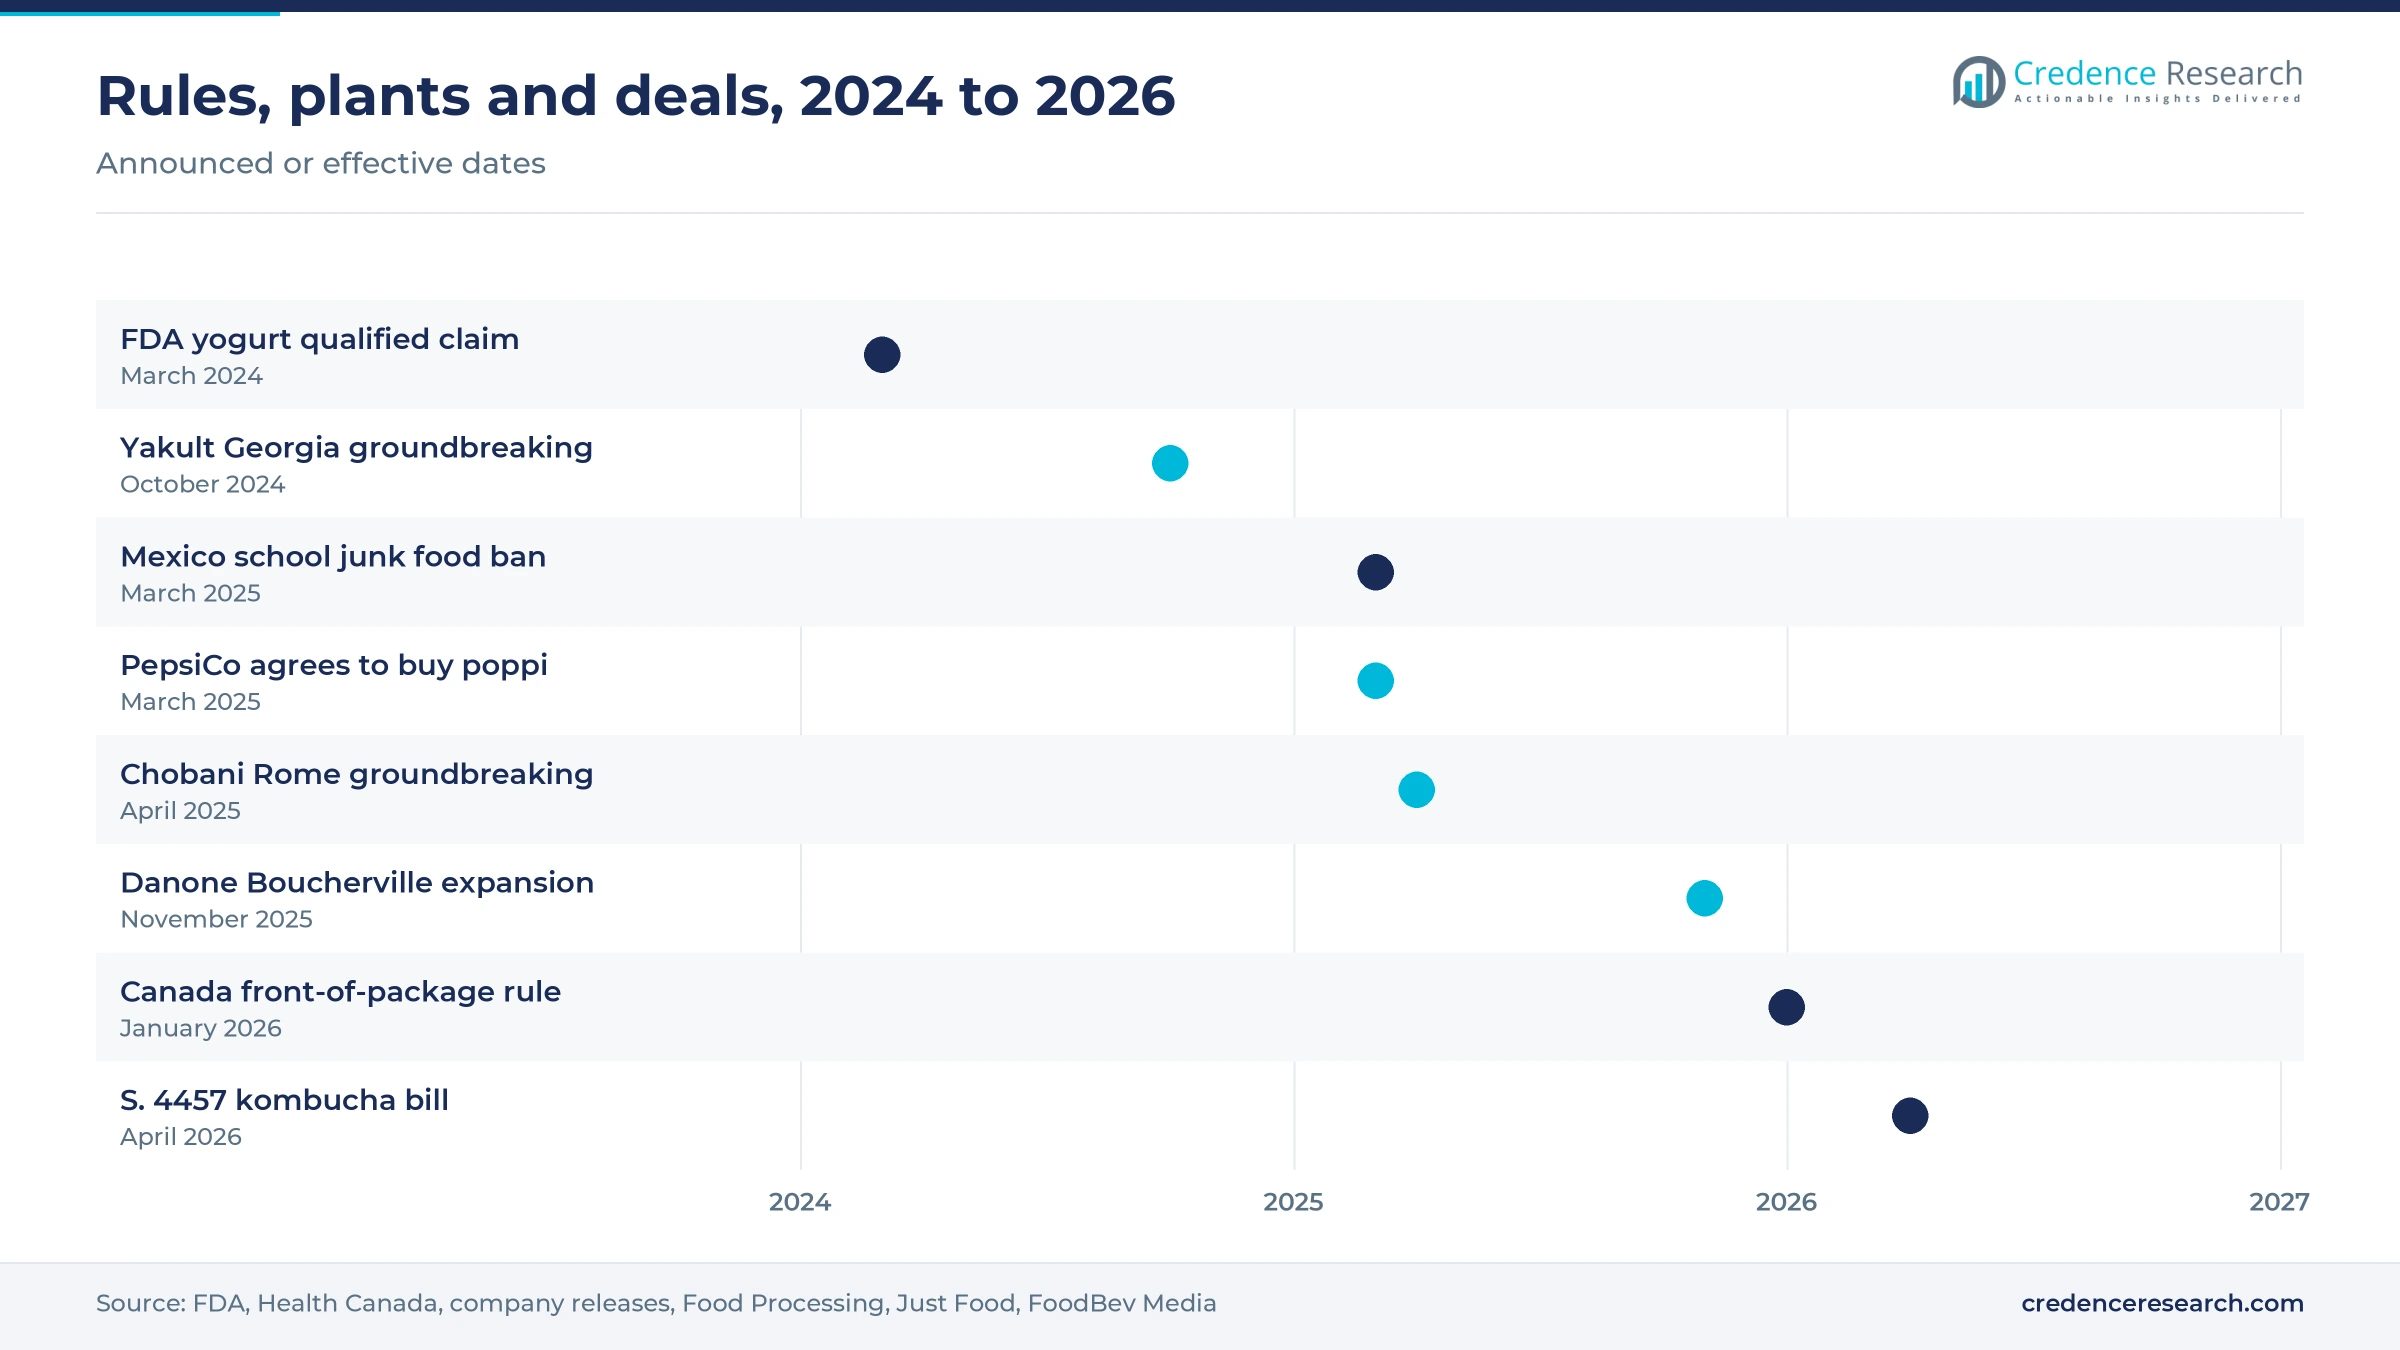
Plants, deals and rules between 2024 and 2026
| Development | Status and market relevance |
|---|---|
| In October 2024, Yakult U.S.A. and contractor Gray broke ground in White, Georgia, on a plant designed for 2.7 million bottles a day at peak. | Production expected in 2026, adding a second U.S. site |
| In April 2025, Chobani broke ground on its $1.2 billion Rome, New York, dairy plant with up to 28 production lines. | Under construction; funded partly by $650 million raised in October 2025 |
| In July 2025, Generous Brands agreed to acquire Health-Ade, which sells through about 65,000 retail outlets. | Adds kombucha to a refrigerated portfolio led by Bolthouse Farms |
| In September 2025, Lifeway Foods said Danone had withdrawn its unsolicited acquisition proposal. | Lifeway remains independent and continues its strategic plan |
| In April 2026, Sen. Ron Wyden introduced S. 4457 to raise the kombucha alcohol threshold to 1.25%. | Pending in Congress; would ease excise exposure for brewers |
Live-culture stability decides shelf life and claims
- Strain selection determines which claims are possible, since Lala Kefir uses 19 live strains and Health Canada ties acceptable claims to specific strains.
- Cold-chain control protects culture counts and limits further fermentation, which matters for kombucha because alcohol can rise as bottles warm.
- Traditional grain fermentation gives kefir its mix of bacteria and yeast, and Grupo Lala markets this method using the local name búlgaros.
- High-speed bottling lowers unit cost for small doses, and the six lines planned at White, Georgia, show the scale now being built.
Need a Custom Version of This Report?
Tailor the scope, geography, or segments to your exact requirements.
- Custom geography or segment scope
- Direct access to our analyst team
Dairy majors and kombucha brewers fight for cooler space
Competition splits between dairy majors, which rely on plant scale and low unit prices, and kombucha brewers, which rely on brand identity and premium cooler placement. Yakult sells small daily doses and Danone is pushing drinking yogurt, while Lifeway describes itself as the leading U.S. kefir supplier and has stayed independent after Danone withdrew its proposal in September 2025. Chobani is building scale in Idaho and New York and launched oat-based probiotic drinks in 2020. In kombucha, GT's Living Foods released three Synergy flavors tied to the film "Supergirl" in April 2026, according to Superman Homepage. Health-Ade moved to Generous Brands in 2025, and Humm joined Systm Foods in January 2024. PepsiCo uses KeVita and poppi to reach mainstream grocery coolers. Brew Dr. Kombucha and Harmless Harvest compete through draft programs and coconut-based recipes respectively, which keeps specialist niches open for smaller brands.
Companies profiled and their roles in this market
| Company | Type | Role in the market |
|---|---|---|
| GT's Living Foods | Kombucha brewer | Sells Synergy raw kombucha through national grocers and online |
| Danone S.A. | Dairy major | Launched Oikos Fusion in 2025 and is expanding Boucherville, Quebec |
| Health-Ade LLC | Kombucha brand | Reaches about 65,000 outlets under Generous Brands ownership |
| PepsiCo / KeVita | Beverage major | Owns KeVita, and agreed to buy poppi in March 2025 |
| Lifeway Foods, Inc. | Kefir specialist | Supplies drinkable kefir in the U.S. and Mexico |
| Yakult USA / Yakult Honsha | Fermented milk producer | Building a White, Georgia, plant due to produce from 2026 |
| Chobani LLC | Dairy producer | Investing in Rome, New York and Twin Falls, Idaho |
| Brew Dr. Kombucha | Kombucha brewer | Ran on-tap service at Providence Park in Portland |
| Humm Kombucha LLC | Kombucha brand | Sells low- and zero-sugar recipes under Systm Foods |
| Harmless Harvest | Coconut beverage producer | Sells dairy-free coconut drinks with 10 billion CFUs |
Capacity arriving in 2026 favors scaled cultured dairy
Credence Research's view is that 2026 is a turning point because new chilled capacity arrives just as federal guidance names kefir. Scaled cultured dairy producers should benefit first, since Yakult's Georgia plant and Danone's new lines lower constraints that limited supply in 2025. Kombucha brands will need sharper distribution partners, and the recent move of Health-Ade into a larger portfolio points that way. The largest risk is claim-related, because the Poppi settlement shows that plaintiffs will test gut-health language. Buyers should favor brands with strain evidence and cold-chain control.
How this market estimate was built
The report uses 2025 as the base year and 2026 to 2035 as the forecast period. Market values come from the Credence Research model, and segment and country splits are Credence Research estimates informed by income, population and channel data. Sources used include regulators such as the FDA, Health Canada and the U.S. Census Bureau, the World Bank, the USDA Economic Research Service, company filings and announcements, and trade publications named in the text. Prices come from public retail listings checked in November 2026. No interviews or surveys were conducted for this edition of the report.
Dairy-free and online lines gain share through 2035
The North America probiotic drink market reaches USD 9.76 billion by 2035, and its composition should change more than its leadership. Cultured dairy keeps the largest share, while non-dairy recipes and online orders gain ground each year. Mexico should narrow its gap slowly as low-sugar kefir spreads through modern retail chains. Passage of the KOMBUCHA bill would lower excise exposure for brewers, although the outcome remains uncertain. Plant openings in Georgia and New York should ease shortages by the end of the decade, which may pressure prices. Brands with strong evidence, reliable cold chains and clear labels should hold their premium.
Frequently Asked Questions
How big is the North America probiotic drink market?
Which country leads the market?
Which country is growing fastest?
Which product type is the largest?
Which product type grows fastest?
How did federal policy change for these products?
What are the main challenges?
Which new plants matter most?
Table of Content
Chapter 1 Market Segmentation
- 1.1 Segmentation Framework
- 1.1.1 Product and Service Classification
- 1.1.2 Application and End-Use Classification
- 1.1.3 Technology and Solution Classification
- 1.1.4 Customer and Distribution Channel Classification
- 1.1.5 Geographic Segmentation
- 1.1.6 Market Segment Definitions and Boundaries
- 1.2 By Product Type
- 1.2.1 Fermented Milk and Drinkable Probiotic Yogurt
- 1.2.2 Kombucha
- 1.2.3 Kefir
- 1.2.4 Non-Dairy Fortified Probiotic Beverages
- 1.3 By Price Tier
- 1.3.1 Mainstream
- 1.3.2 Accessible Premium
- 1.3.3 Specialist Premium
- 1.4 By Packaging Format
- 1.4.1 Single-Serve Packs
- 1.4.2 Multi-Serve Packs
- 1.4.3 Multipacks
- 1.5 By Country
- 1.5.1 United States
- 1.5.2 Canada
- 1.5.3 Mexico
Chapter 2 Introduction
- 2.1 Report Objectives and Scope
- 2.2 Product Definition and Industry Terminology
- 2.3 Market Inclusions and Exclusions
- 2.4 Research Process
- 2.4.1 Primary Research and Expert Interviews
- 2.4.2 Secondary Research and Source Review
- 2.4.3 Top-Down and Bottom-Up Estimation
- 2.4.4 Data Triangulation and Verification
- 2.5 Market Size Measurement Basis
- 2.5.1 2025: USD 4.61 billion → 2035: USD 9.76 billion
- 2.6 Historical and Forecast Reference Periods
- 2.6.1 Historical Period: 2018-2025
- 2.6.2 Base Year: 2025
- 2.6.3 Forecast Period: 2025-2035
- 2.7 Research Assumptions and Limitations
Chapter 3 Executive Summary
- 3.1 Market Snapshot and Key Findings
- 3.2 Base-Year Market Size, 2025
- 3.3 Forecast Market Size, 2035
- 3.4 Revenue and Volume Growth Outlook
- 3.5 Key Demand and Supply Indicators
- 3.6 Leading Market Segments
- 3.7 Fastest-Growing Market Opportunities
- 3.8 Regional Performance Highlights
- 3.9 Technology and Industry Transformation
- 3.10 Competitive Landscape Summary
- 3.11 Analyst View and Strategic Implications
Chapter 4 North America Probiotic Drink Market Trends and Developments
- 4.1 Historical Industry Development, 2018-2025
- 4.2 Recent Market Trends and Developments
- 4.3 Demand and Customer Behavior Trends
- 4.4 Technology and Product Innovation
- 4.5 Artificial Intelligence, Automation and Digitalization
- 4.6 Local Manufacturing and Supply Chain Realignment
- 4.7 Industry Partnerships, Mergers and Acquisitions
- 4.8 Sustainability and Circular Economy Developments
- 4.9 Government and Private Sector Investment Trends
- 4.10 Emerging Business Models and Commercialization
- 4.11 Industry Developments and Announcements
Chapter 5 North America Probiotic Drink Market Production, Supply and Demand Analysis
- 5.1 Demand Trend and Consumption Analysis, 2018-2025
- 5.2 Demand Forecast, 2025-2035
- 5.3 Production and Output Trend, 2018-2025
- 5.4 Production and Output Forecast, 2025-2035
- 5.5 Installed Capacity and Capacity Utilization
- 5.6 Company-Wise Production Plants and Statistics
- 5.6.1 Installed Production Capacity
- 5.6.2 Actual Production
- 5.6.3 Planned Capacity and Expansion Targets
- 5.7 Supply Chain Structure and Procurement Trends
- 5.8 Supply-Demand Gap and Bottlenecks
- 5.9 Import Dependence and Sourcing Structure
- 5.10 Contract Manufacturing and Outsourcing
- 5.11 Regional Supply and Demand Concentration
Chapter 6 North America Probiotic Drink Market Pricing Analysis
- 6.1 Pricing Structure and Measurement
- 6.2 Historical Pricing Trends, 2018-2025
- 6.3 Pricing Outlook, 2025-2035
- 6.4 Average Selling Price and Unit Economics
- 6.5 Pricing by Product and Market Segment
- 6.6 Geographic Pricing Differences
- 6.7 Key Input, Energy, Labor and Logistics Costs
- 6.8 Contract Pricing and Purchasing Models
- 6.9 Pricing Sensitivity and Competitive Positioning
- 6.10 Price, Margin and Profitability Implications
Chapter 7 North America Probiotic Drink Market Dynamics
- 7.1 Market Growth Drivers
- 7.1.1 Demand-Side Drivers
- 7.1.2 Technology and Innovation Drivers
- 7.1.3 Infrastructure and Investment Drivers
- 7.1.4 Regulatory and Policy Drivers
- 7.2 Market Restraints
- 7.2.1 Cost and Affordability Constraints
- 7.2.2 Technology and Adoption Barriers
- 7.2.3 Supply Chain and Operational Constraints
- 7.3 Market Challenges
- 7.3.1 Competitive Pressure and Margin Erosion
- 7.3.2 Skills, Infrastructure and Implementation Gaps
- 7.4 Emerging Market Opportunities
- 7.5 Market Dynamics Impact and Time-Horizon Assessment
Chapter 8 North America Probiotic Drink Value Chain Analysis
- 8.1 Industry Value Chain Overview
- 8.2 Upstream Suppliers and Critical Inputs
- 8.3 Technology and Component Providers
- 8.4 Manufacturing or Service Delivery
- 8.5 Distribution, Channel Partners and Integrators
- 8.6 Downstream Applications and End Users
- 8.7 Value Addition and Profit Pools
- 8.8 Vertical Integration and Outsourcing
- 8.9 Supplier Concentration and Risk
- 8.10 Supply Chain Localization and Resilience
Chapter 9 North America Probiotic Drink Market Regulations and Policies
- 9.1 Relevant Laws, Standards and Compliance Frameworks
- 9.2 Product, Service, Safety and Quality Requirements
- 9.3 Government Policies, Incentives and Subsidies
- 9.4 Imports, Exports and Trade Barriers
- 9.5 Public Procurement and Local Content Requirements
- 9.6 Environmental and Sustainability Compliance
- 9.7 Upcoming Policy Changes and Market Implications
Chapter 10 North America Probiotic Drink Market Hotspots and Opportunities
- 10.1 Market Opportunity Mapping and Growth Hotspots
- 10.2 High-Growth Applications and Customer Groups
- 10.3 Underserved Markets and White-Space Opportunities
- 10.4 Emerging Technology and Product Opportunities
- 10.5 New Capacity and Investment Hotspots
- 10.6 Market Entry and Expansion Opportunities
- 10.7 Distribution and Partnership Opportunities
- 10.8 Near-Term and Long-Term Commercial Potential
- 10.9 Opportunity Attractiveness and Execution Risks
Chapter 11 North America Probiotic Drink Market Outlook, 2025-2035
- 11.1 Market Size and Analysis
- 11.1.1 Revenue (Market Measurement: 2025: USD 4.61 billion → 2035: USD 9.76 billion)
- 11.1.2 Market Volume and Quantity Sold
- 11.1.3 Historical Market Size, 2018-2025
- 11.1.4 Base-Year Market Size, 2025
- 11.2 Market Forecast, 2025-2035
- 11.2.1 Revenue Forecast to 2035
- 11.2.2 Volume Forecast to 2035
- 11.2.3 CAGR and Year-on-Year Growth
- 11.2.4 Incremental Revenue Opportunity
- 11.3 Forecast Assumptions and Scenario Analysis
- 11.3.1 Base-Case Forecast
- 11.3.2 Optimistic and Conservative Scenarios
- 11.3.3 Technology, Pricing and Policy Sensitivities
- 11.4 Market Attractiveness and Growth Outlook
Chapter 12 North America Probiotic Drink Market Segmentation and Outlook
- 12.1 Segmentation Summary and Market Shares, 2025
- 12.2 Largest and Fastest-Growing Segments
- 12.3 By Product Type - Market Size and Forecast, 2025-2035
- 12.3.1 Segment Definition and Scope
- 12.3.2 Historical Market Size, 2018-2025
- 12.3.3 Revenue Forecast, 2025-2035
- 12.3.4 Volume Forecast, 2025-2035
- 12.3.5 Base-Year Market Share, 2025
- 12.3.6 Segment CAGR and Growth Drivers
- 12.3.7 Subsegment Market Size and Forecast
- 12.3.7.1 Fermented Milk and Drinkable Probiotic Yogurt
- 12.3.7.2 Kombucha
- 12.3.7.3 Kefir
- 12.3.7.4 Non-Dairy Fortified Probiotic Beverages
- 12.3.8 Subsegment Pricing and Adoption Trends
- 12.3.9 Leading Suppliers and Competition
- 12.3.10 Regional Demand and Opportunities
- 12.4 By Price Tier - Market Size and Forecast, 2025-2035
- 12.4.1 Segment Definition and Scope
- 12.4.2 Historical Market Size, 2018-2025
- 12.4.3 Revenue Forecast, 2025-2035
- 12.4.4 Volume Forecast, 2025-2035
- 12.4.5 Base-Year Market Share, 2025
- 12.4.6 Segment CAGR and Growth Drivers
- 12.4.7 Subsegment Market Size and Forecast
- 12.4.7.1 Mainstream
- 12.4.7.2 Accessible Premium
- 12.4.7.3 Specialist Premium
- 12.4.8 Subsegment Pricing and Adoption Trends
- 12.4.9 Leading Suppliers and Competition
- 12.4.10 Regional Demand and Opportunities
- 12.5 By Packaging Format - Market Size and Forecast, 2025-2035
- 12.5.1 Segment Definition and Scope
- 12.5.2 Historical Market Size, 2018-2025
- 12.5.3 Revenue Forecast, 2025-2035
- 12.5.4 Volume Forecast, 2025-2035
- 12.5.5 Base-Year Market Share, 2025
- 12.5.6 Segment CAGR and Growth Drivers
- 12.5.7 Subsegment Market Size and Forecast
- 12.5.7.1 Single-Serve Packs
- 12.5.7.2 Multi-Serve Packs
- 12.5.7.3 Multipacks
- 12.5.8 Subsegment Pricing and Adoption Trends
- 12.5.9 Leading Suppliers and Competition
- 12.5.10 Regional Demand and Opportunities
- 12.6 By Country - Market Size and Forecast, 2025-2035
- 12.6.1 Segment Definition and Scope
- 12.6.2 Historical Market Size, 2018-2025
- 12.6.3 Revenue Forecast, 2025-2035
- 12.6.4 Volume Forecast, 2025-2035
- 12.6.5 Base-Year Market Share, 2025
- 12.6.6 Segment CAGR and Growth Drivers
- 12.6.7 Subsegment Market Size and Forecast
- 12.6.7.1 United States
- 12.6.7.2 Canada
- 12.6.7.3 Mexico
- 12.6.8 Subsegment Pricing and Adoption Trends
- 12.6.9 Leading Suppliers and Competition
- 12.6.10 Regional Demand and Opportunities
- 12.7 Segment Growth Comparison
- 12.8 Segment Attractiveness and Priority Matrix
Chapter 13 North America Probiotic Drink Geographic Market Outlook, 2025-2035
- 13.1 Regional Market Size and Country-Level Shares, 2025
- 13.2 Country Market Size Comparison, 2025
- 13.3 Country Market Forecasts, 2025-2035
- 13.4 Subregional Industrial and Demand Clusters
- 13.5 Intra-Regional Pricing and Cost Differences
- 13.6 Cross-Border Trade and Supply Networks
- 13.7 Regional Supply and Demand Balances
- 13.8 Country Opportunity Comparison and Prioritization
Note: Every listed country is covered on the structure shown under the first country.
Chapter 14 North America Probiotic Drink Technology, Innovation and Sustainability Outlook
- 14.1 Technology Landscape and Maturity
- 14.2 Product, Process and Service Innovation
- 14.3 AI, Automation and Digital Tools in the Industry
- 14.4 Technology Adoption and Performance Benchmarking
- 14.5 Innovation Pipeline and R&D Investment
- 14.6 Patent and Intellectual Property Trends
- 14.7 Energy Efficiency and Resource Management
- 14.8 Sustainability, Recycling and Circularity
- 14.9 Technology Roadmap, 2025-2035
- 14.10 Risks of Obsolescence and Technology Substitution
Chapter 15 North America Probiotic Drink Market Key Strategic Imperatives
- 15.1 Growth and Market Entry Priorities
- 15.2 High-Return Products and Segments
- 15.3 Pricing, Profitability and Cost Optimization
- 15.4 Technology Investment and Product Differentiation
- 15.5 Supply Chain Localization and Resilience
- 15.6 Distribution and Customer Acquisition
- 15.7 Partnership, Acquisition and Capacity Strategy
- 15.8 Regional Expansion Priorities
- 15.9 Short-, Medium- and Long-Term Actions
Chapter 16 Competition Outlook
- 16.1 Industry Competition Characteristics
- 16.2 Market Structure and Concentration
- 16.3 Market Share and Competitive Positioning, 2025
- 16.4 Company-Wise Revenue and Product Benchmarking
- 16.5 Production and Service Capacity Benchmarking
- 16.6 Technology, Pricing and Differentiation
- 16.7 Regional Footprint and Distribution Strength
- 16.8 Mergers, Acquisitions and Strategic Alliances
- 16.9 New Entrants and Competitive Threats
- 16.10 Porter's Five Forces and Industry Attractiveness
- 16.11 Competitive Outlook, 2025-2035
Chapter 17 Company Profiles
- 17.1 Company Coverage and Selection Criteria
- 17.2 GT's Living Foods
- 17.2.1 Business Description
- 17.2.2 Company Ownership and Geographic Presence
- 17.2.3 Product and Service Portfolio
- 17.2.4 Manufacturing and Operating Footprint
- 17.2.5 Production Capacity and Expansion Plans
- 17.2.6 Financial Performance and Investment
- 17.2.7 Market Share and Competitive Position
- 17.2.8 Technology and Innovation Capabilities
- 17.2.9 Strategic Alliances or Partnerships
- 17.2.10 Recent Developments
- 17.2.11 Growth Strategy and Outlook
- 17.3 Danone S.A.
- 17.4 Health-Ade LLC
- 17.5 PepsiCo / KeVita
- 17.6 Lifeway Foods, Inc.
- 17.7 Yakult USA / Yakult Honsha
- 17.8 Chobani LLC
- 17.9 Brew Dr. Kombucha
- 17.10 Humm Kombucha LLC
- 17.11 Harmless Harvest
- 17.12 Other Relevant Market Participants
Note: Every listed company is profiled on the structure shown under the first company. The company list is preliminary and may change based on research findings, market developments, data availability and client requirements.
Chapter 18 Disclaimer
- 18.1 Research and Forecast Disclaimer
- 18.2 Data Source and Estimation Limitations
Note: The depth of individual sections depends on data availability for this market. Volume, capacity, trade and other unit-based metrics are included where applicable.

