
Soy scale and pea localization define regional supply
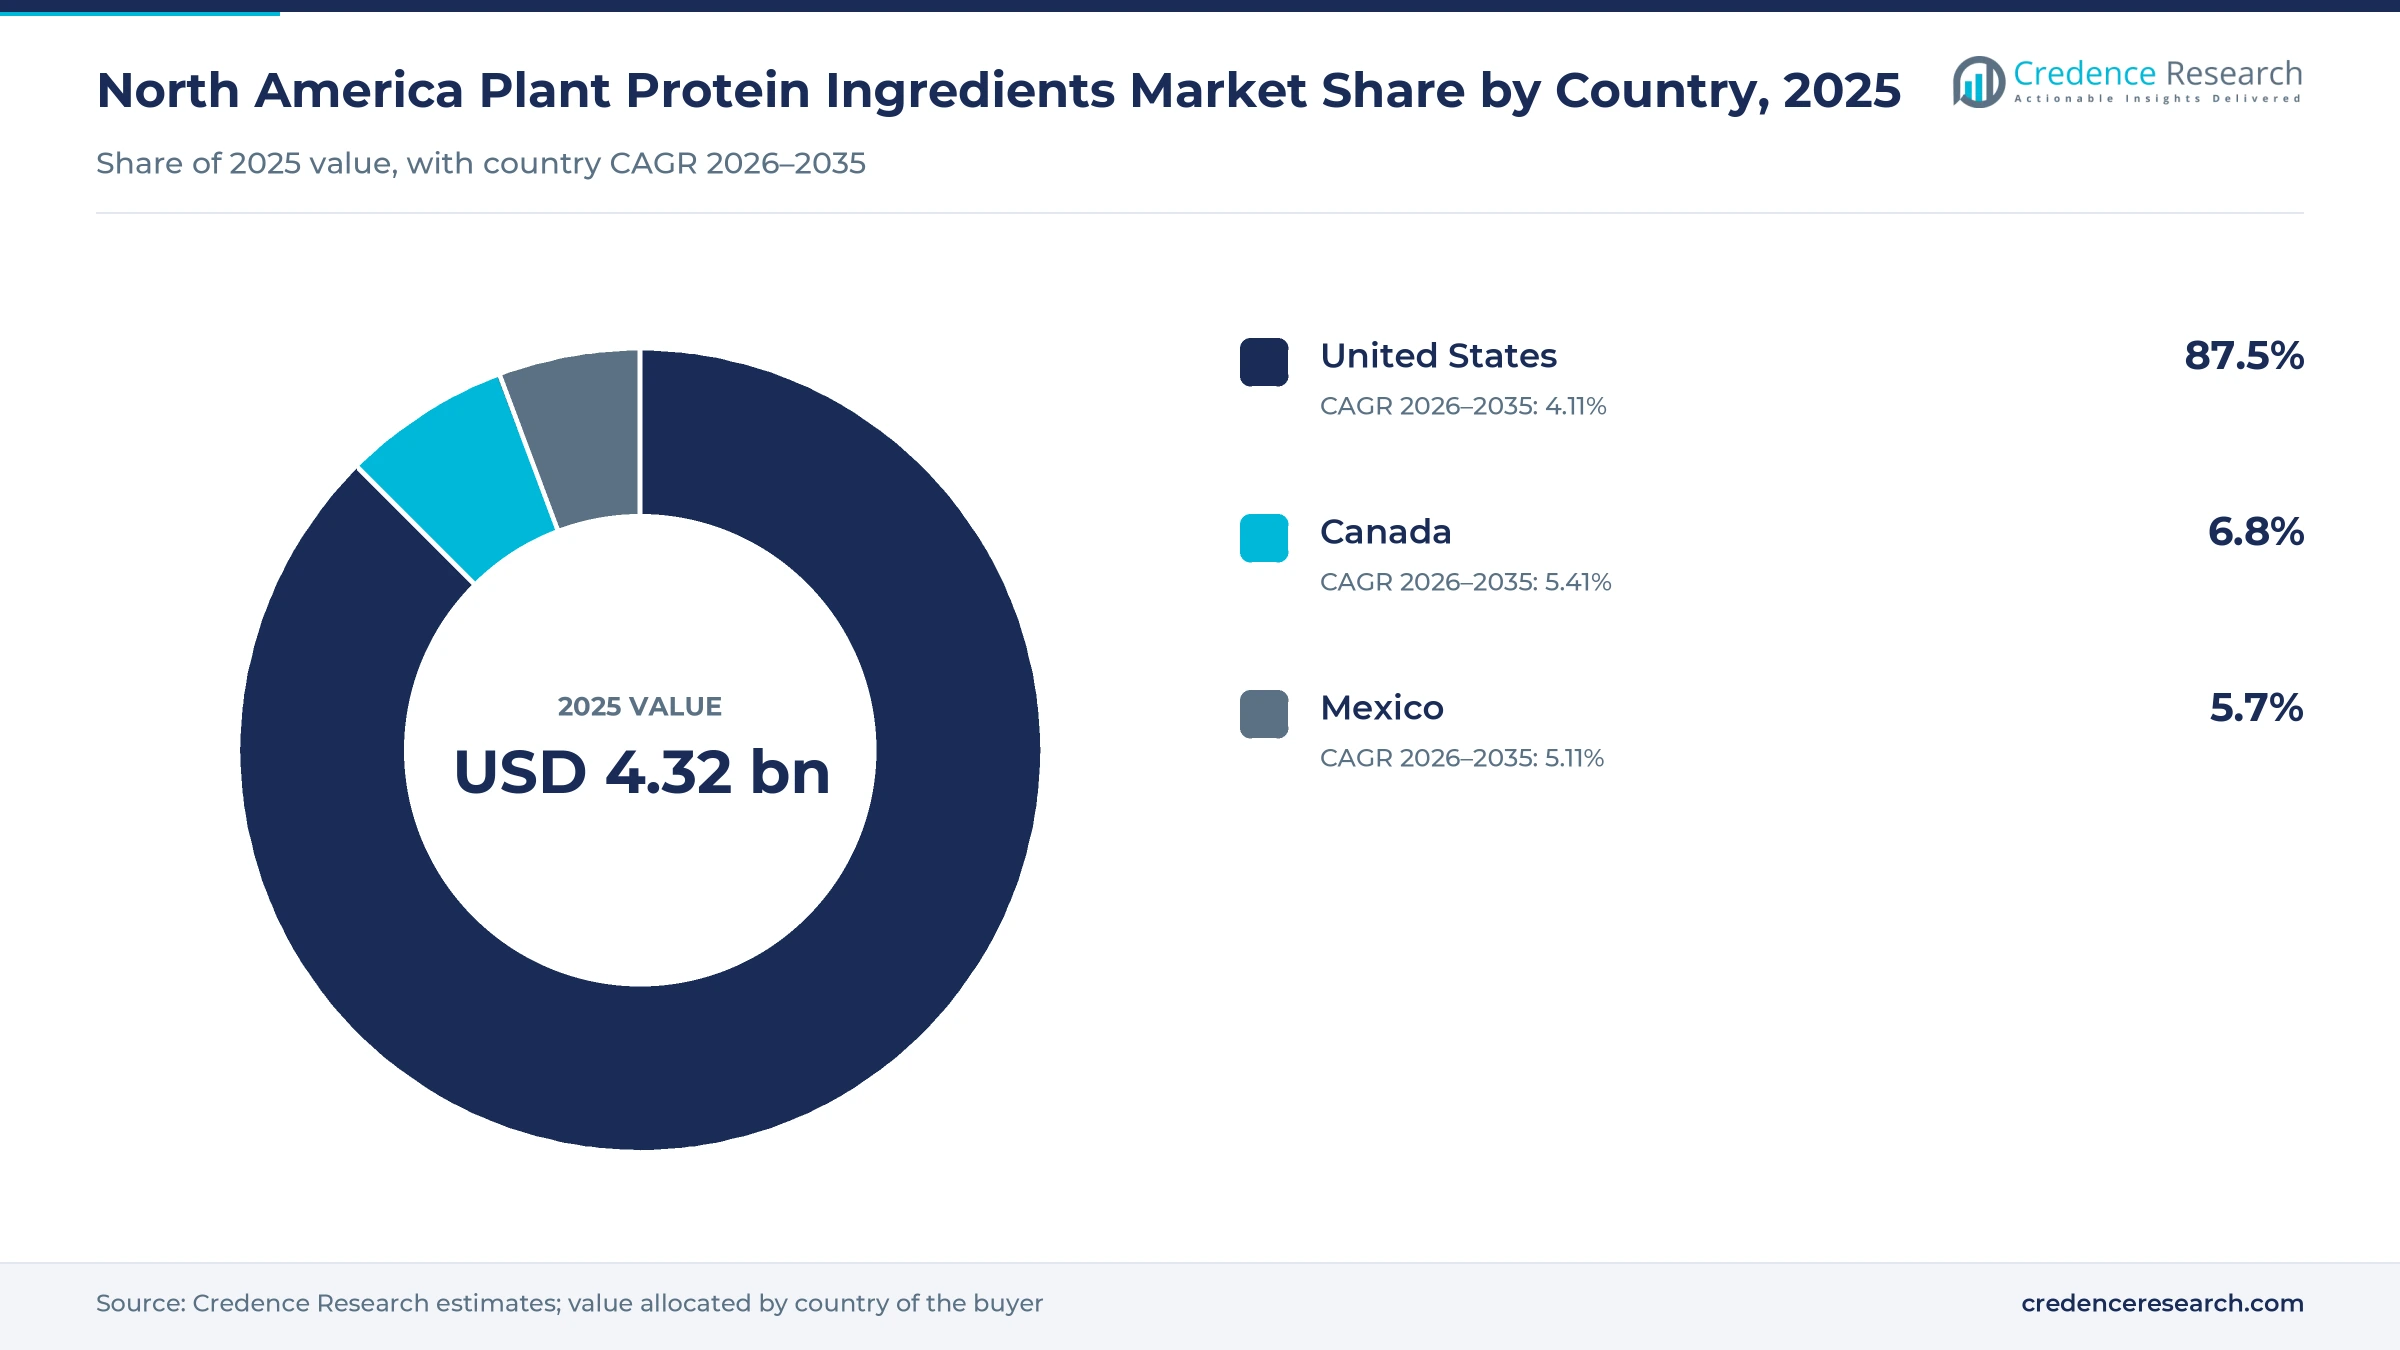
The North America plant protein ingredients market was valued at USD 4.32 billion in 2025 and is projected to increase from USD 4.51 billion in 2026 to USD 6.57 billion by 2035, registering a CAGR of 4.26% during 2026–2035. Demand comes from food and beverage formulators, feed mills and sports nutrition brands that buy soy, pea and wheat proteins against functional specifications rather than as commodity grades. The United States held the largest share, 87.5% in 2025, because its soybean processing base and large brand owners anchor regional purchasing. Canada is the fastest-growing country at 5.41% a year as Prairie pulse processing adds local supply. The Dietary Guidelines for Americans released on Jan. 7, 2026, set a protein intake of 1.2 to 1.6 grams per kilogram of body weight a day, which widens fortification beyond meat alternatives. U.S. antidumping and countervailing duty orders on Chinese pea protein, applicable from Aug. 26, 2024, have also moved buyers toward qualified North American supply.
What do North American plant protein buyers actually purchase?
The market counts soy, pea, wheat and specialty proteins sold as concentrates, flours, isolates, textured pieces and hydrolysates to manufacturers in the United States, Canada and Mexico. Most volume moves through direct supply contracts, with specialty distributors and blending partners serving smaller formulators. Buyers qualify each grade on protein content, solubility, flavor and documented origin before a recipe is approved.
Finished foods, retail protein powders and whole commodity beans fall outside the count, as do animal and fermentation-derived proteins. The value chain runs from growers and crushers through extraction and functionalization plants to brand owners, contract manufacturers and feed mills, and margin concentrates in the isolate and textured grades.
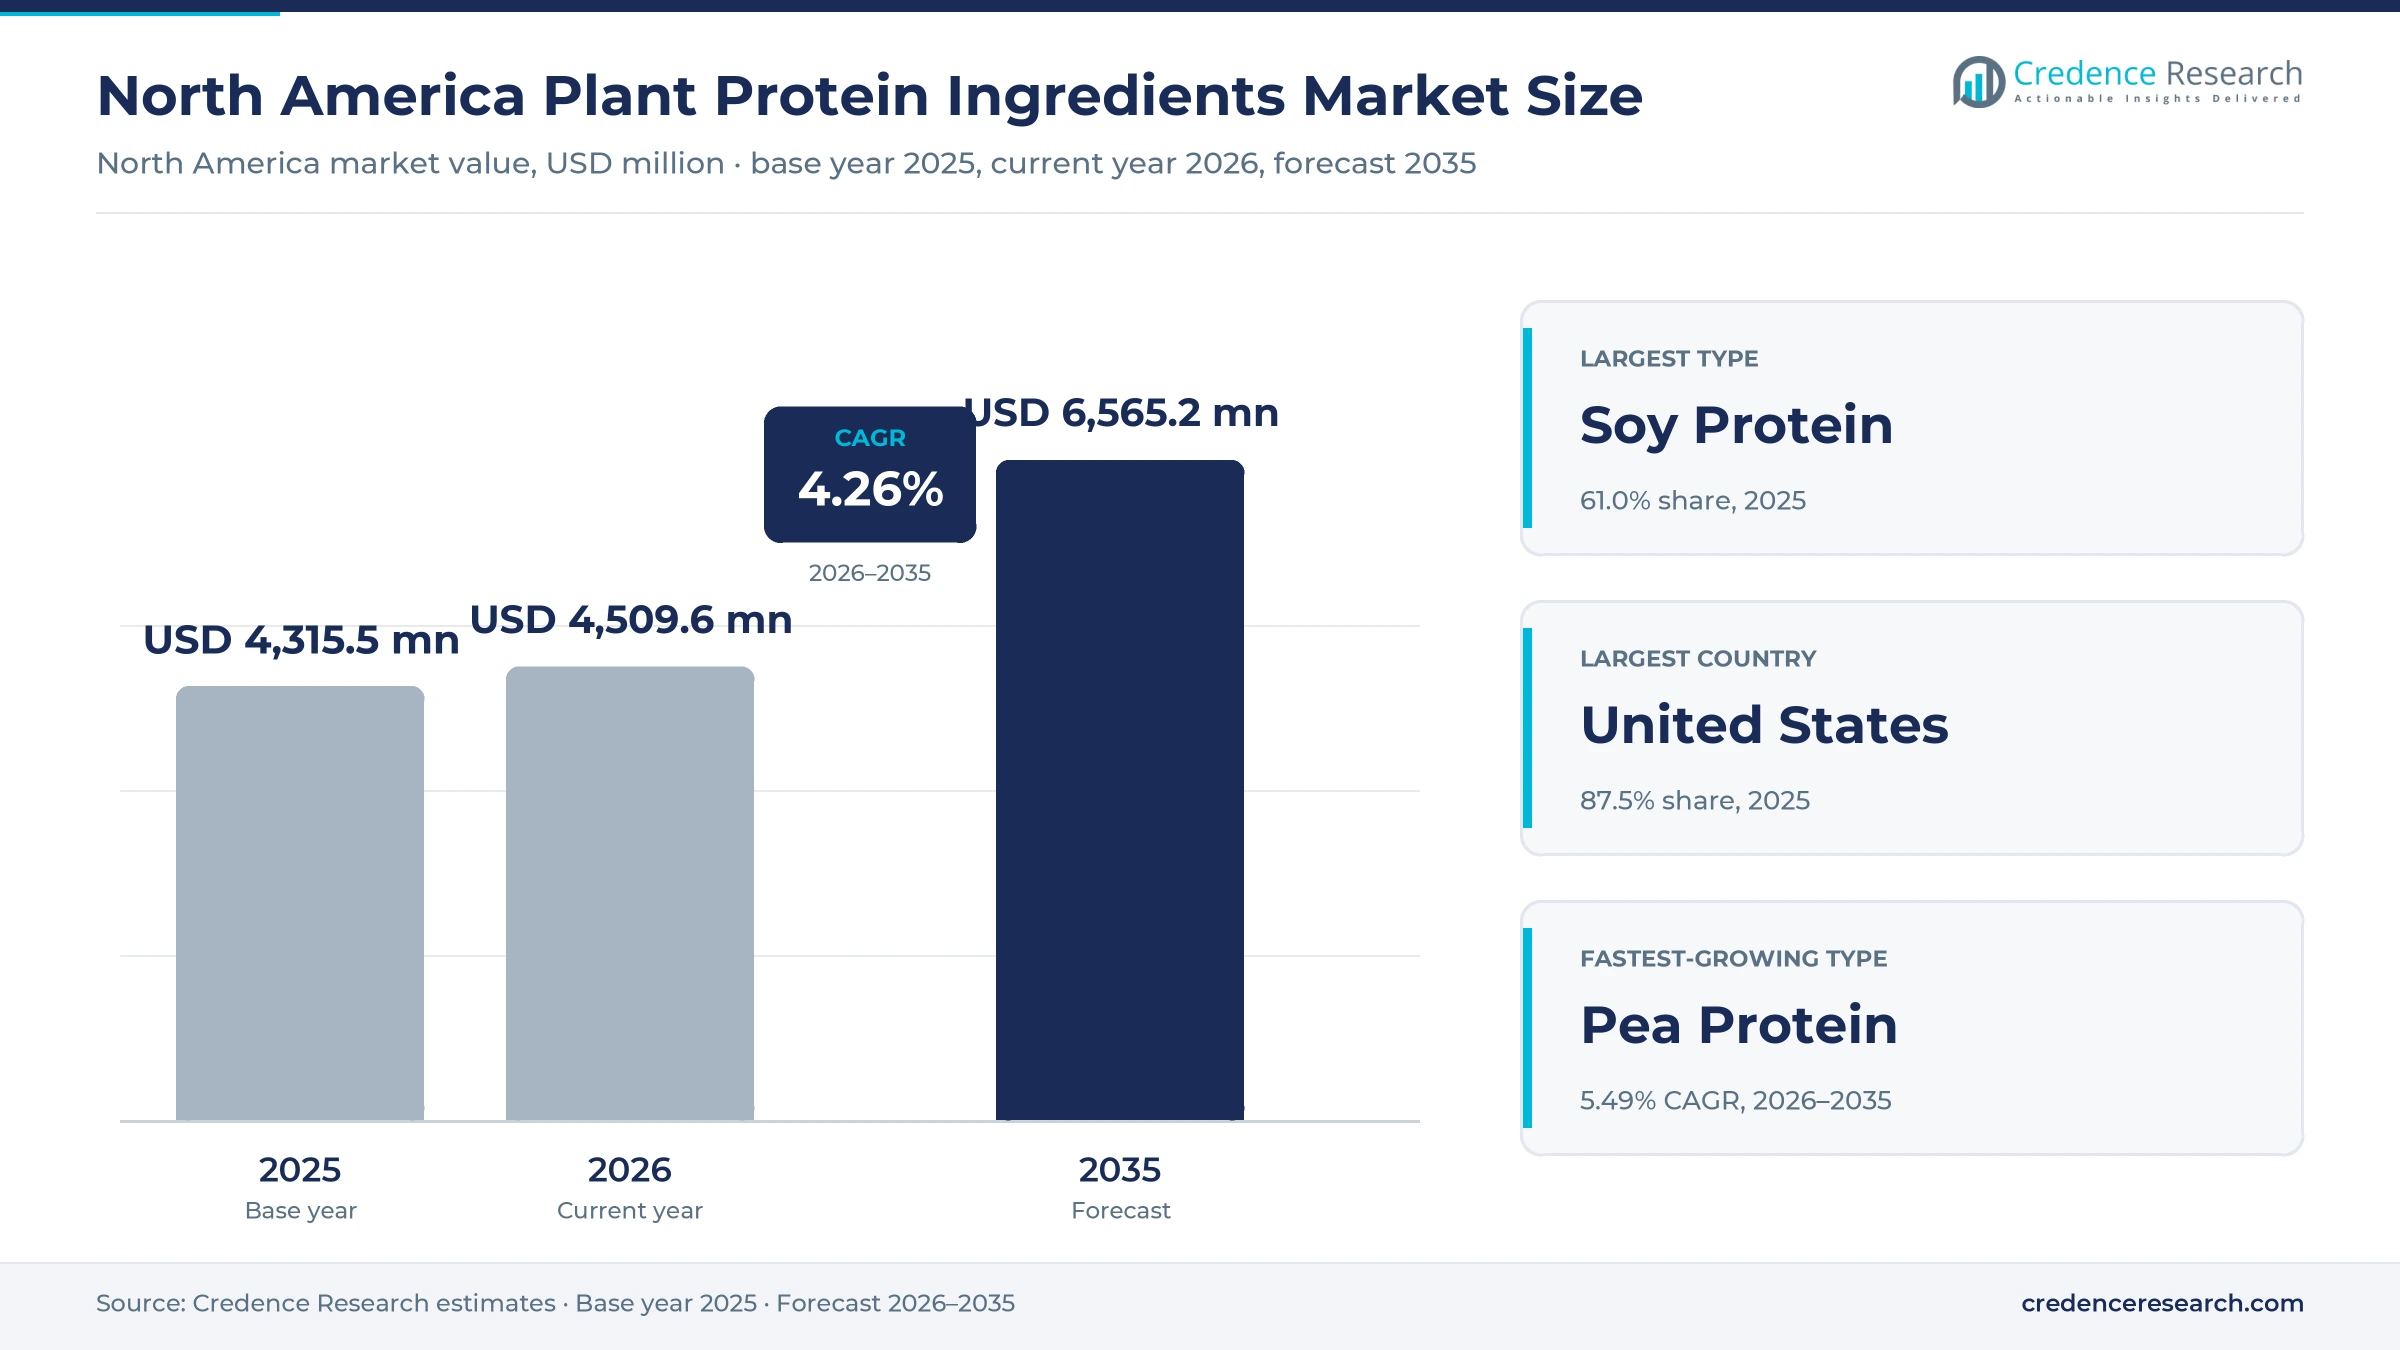
North America Plant Protein Ingredients Market Insights
- The market grows from USD 4.32 billion in 2025 to USD 6.57 billion by 2035, a 4.26% CAGR, with fortification adding demand outside meat alternatives.
- The United States held 87.5% of 2025 value, supported by 68 solvent soybean crushing plants counted by the American Soybean Association in April 2025.
- Soy protein led product types with 61.0% of 2025 value, while pea protein is the fastest-growing type at 5.49% a year.
- Commerce Department orders on Chinese pea protein, applicable from Aug. 26, 2024, changed sourcing economics and strengthened the case for North American pea supply.
- ADM, Roquette, Ingredion, Cargill and PURIS have all shown pea, soy or textured capacity or launches aimed at regional formulators, so function and origin now decide competition.
Soy leads on crush scale while pea gains on duties
Why soy keeps the largest product position
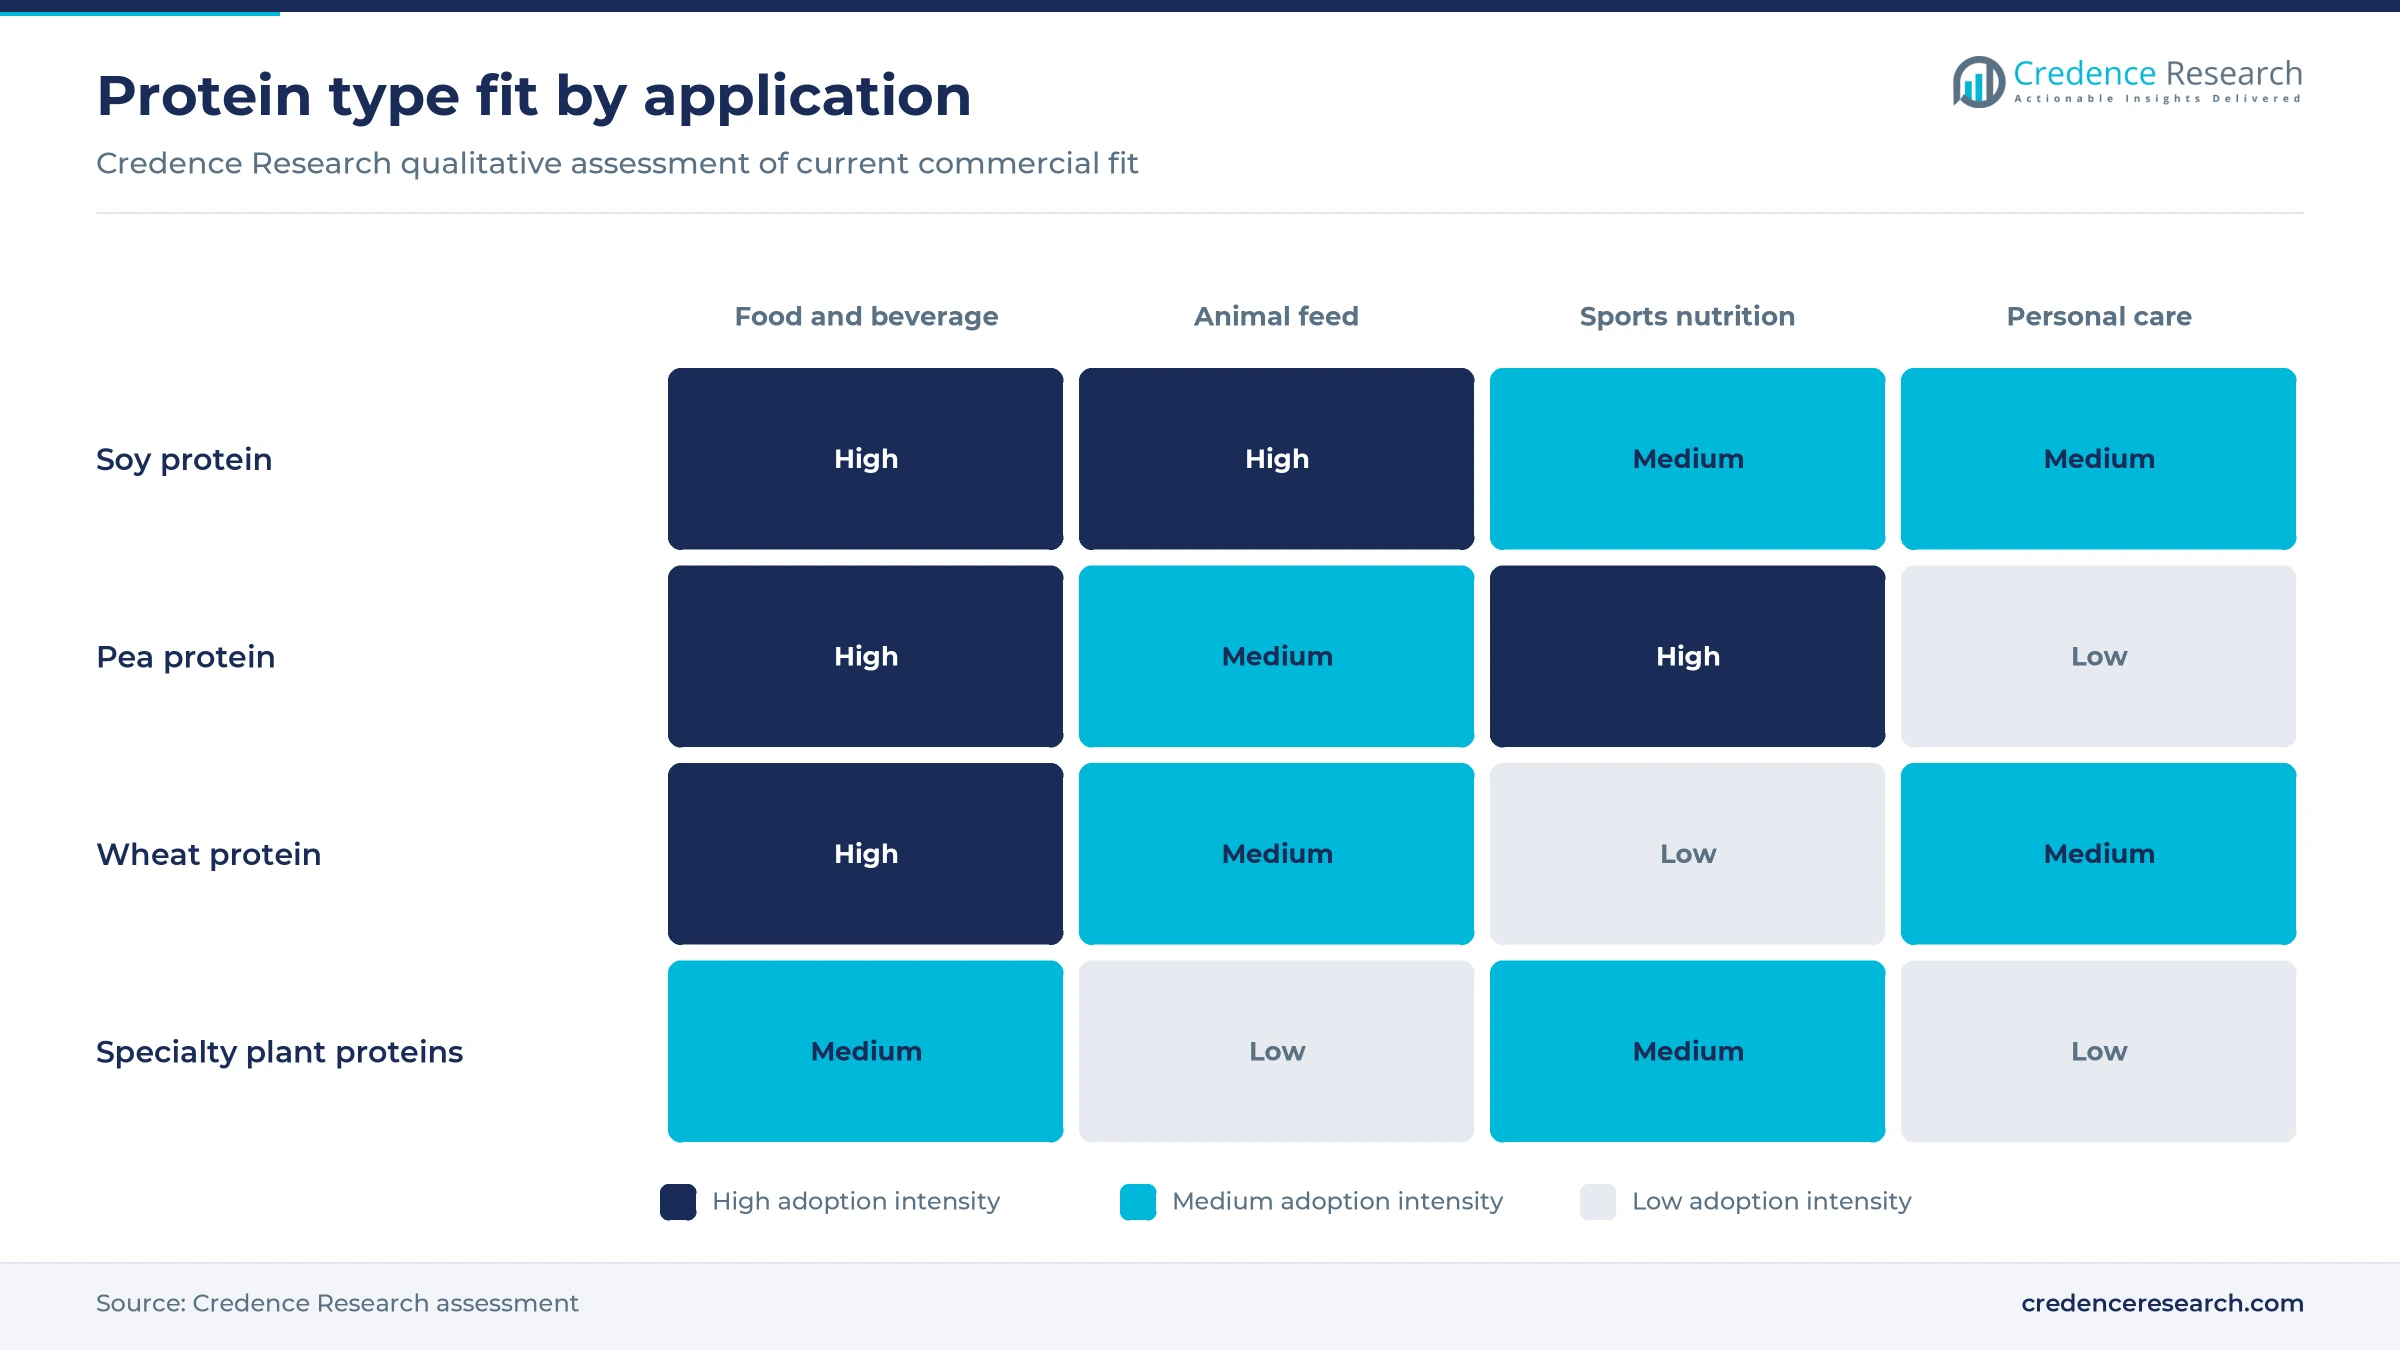
Based on product type, the market is categorized into soy protein, pea protein, wheat protein and specialty plant proteins. Soy Protein led with 61.0% of 2025 value because U.S. crushing gives it unmatched feedstock, and the American Soybean Association counted 68 solvent plants in April 2025. Pea Protein grows fastest at 5.49% a year as U.S. duties redirect sourcing, with the Commerce Department setting a 122.19% dumping rate for most listed Chinese exporters in 2024. Burcon added domestic volume in June 2025, when its Galesburg, Illinois, site completed a first commercial run of Peazazz C isolate.
How food leads while sports nutrition grows fastest
Based on application, the market is categorized into food and beverage formulation, animal feed formulation, sports nutrition and dietary supplementation, and personal care and technical formulation. Food and Beverage Formulation led with 56.0% of 2025 value because fortification now spans mainstream recipes, and ADM's May 2026 launch covered yogurt alternatives, deli meats and baked goods, Farms.com reported. Sports Nutrition and Dietary Supplementation grows fastest at 5.42% a year as the International Food Information Council found 23% of Americans on a high-protein diet in 2025. In turn, Cargill's PURIS 2.0 now supports up to 30 grams of protein per serving in sports drinks, according to Nutritional Outlook.
Why brand owners still write the specification
Based on customer type, the market is categorized into brand-owned manufacturing buyers, contract manufacturing buyers and feed and technical manufacturing buyers. Brand-Owned Manufacturing Buyers led with 58.0% of 2025 value because they set protein specifications, and Ingredion's Vitessence Pea 200 D, reported in October 2024, targets their ready-to-mix beverages with reduced sedimentation. Contract Manufacturing Buyers grows fastest at 5.21% a year as outsourced capacity expands, with Burcon reporting in August 2025 that it offers contract manufacturing at Galesburg. Feed buyers remain a separate block, since Mexico's feed association Conafab projected 41.883 million metric tons of feed output for 2025.
How processing route separates grades and buyers
Based on technology, the market is categorized into dry fractionation, wet extraction and post-extraction functionalization. Wet Extraction led with 63.0% of 2025 value because it yields the richest grades, and the U.S. International Trade Commission describes wet-milled pea protein typically containing 80% to 85% protein, against 50% to 55% for dry-milled product. Post-Extraction Functionalization grows fastest at 5.34% a year as plants add function after extraction. For example, AGT Foods and Sweet Nutrition's C$3.9 million project, announced March 31, 2026, tests heat-moisture treatment, blending and extrusion on Saskatchewan pulse ingredients.
| Segment Group | Leading Sub-segment | Share, 2025 | Fastest-growing Sub-segment | CAGR, 2026–2035 |
|---|---|---|---|---|
| By Product Type | Soy Protein | 61.0% | Pea Protein | 5.49% |
| By Application | Food and Beverage Formulation | 56.0% | Sports Nutrition and Dietary Supplementation | 5.42% |
| By Customer Type | Brand-Owned Manufacturing Buyers | 58.0% | Contract Manufacturing Buyers | 5.21% |
| By Technology | Wet Extraction | 63.0% | Post-Extraction Functionalization | 5.34% |
Request a Free Sample
Fill in your details and we'll send you a free sample report.
- Sample data tables & charts
- Research methodology
Fortification, duties and crush capacity lift demand
Protein fortification beyond meat alternatives
Protein fortification is now a mainstream grocery brief, which spreads ingredient demand well past burgers and sausages. The 2025–2030 Dietary Guidelines for Americans, released by HHS and USDA on Jan. 7, 2026, set a target of 1.2 to 1.6 grams per kilogram of body weight a day, and Morrison Foerster notes that they name beans, nuts and soy among protein sources. The International Food Information Council's 2025 survey, cited by Nutritional Outlook, found protein the most sought-after nutrient for a fifth straight year. ADM's May 2026 North American launch then reached yogurt alternatives, deli meats and cereals. This breadth helps explain why Food and Beverage Formulation holds 56.0% of 2025 value.
Regional pulse processing and qualified supply
Buyers increasingly favor North American pulses because duties raised the cost of Chinese supply and regional plants sit close to the crop. The Commerce Department announced final pea protein determinations on June 28, 2024, with a 122.19% dumping rate for most listed Chinese exporters, and orders applied from Aug. 26, 2024. Roquette's Portage la Prairie, Manitoba, plant takes 125,000 tons of yellow peas a year within a day's drive of Prairie supply, according to Provisioner. Canada's 2025 dry pea crop reached 3.934 million metric tons, up from 2.997 million metric tons a year earlier, DePutter Publishing reported for Syngenta Canada. Ingredion's $185 million South Sioux City, Nebraska, plant, unveiled in September 2020, adds isolate capacity for regional demand using North American pulses.
Traceability and protein-quality differentiation
Protein quality and lot-level records increasingly separate suppliers, because label claims depend on digestibility-corrected scores rather than on grams alone. A guide from Minnesota's Agricultural Utilization Research Institute explains that a good-source claim needs 10% to 19% of daily value, and 10 grams of pea protein scoring 0.80 delivers 16%. Blends are scored on the final mix, so complementary proteins can raise a claim. FDA has also moved its Food Traceability Rule compliance date to July 20, 2028, FoodNavigator reported on Feb. 26, 2026, while keeping the requirement to produce records within 24 hours. As a result, Ingredion promotes peas grown and produced in North America for Vitessence Pea 200 D, turning origin into a selling point.
Record soybean crush widens soy protein feedstock
Crush expansion strengthens the soy base that supports both food and feed grades. The American Soybean Association put practical U.S. capacity at about 2.55 billion bushels a year at the start of 2025, up 14% from 2023, with 114 million bushels due in 2026. DTN then reported that plants crushed 663 million bushels from September through November 2025, 8.2% more than a year earlier. Although biofuel policy is pulling that expansion, crushing yields roughly four parts meal to one part oil by the association's count, so protein feedstock grows alongside oil. Mexican feed demand alone is forecast to draw 2.3 million metric tons of imported soybean meal this marketing year, according to the Iowa Soybean Association, and Soy Protein holds 61.0% of 2025 value.
Textured, beverage and Prairie formats open new demand
Shift toward heat-stable and hybrid textured grades
Textured grades are shifting from simple extenders toward specific cuts and cooking conditions. Roquette added Nutralys T Wheat 600L, above 60% protein, and Nutralys T Pea 700XC, at 70%, on June 17, 2025, targeting poultry-style pieces and reheated stews, Protein Production Technology reported. The wheat grade serves both plant-based and hybrid recipes, which widens its use beyond meat substitutes alone. MGP Ingredients earlier committed $16.7 million in February 2022 to an extrusion plant at Atchison, Kansas, for its ProTerra pea and wheat pieces. AGT Foods is also raising throughput at its Regina extrusion site under the March 2026 Protein Industries Canada project. This activity supports Post-Extraction Functionalization, which is growing at 5.34% a year.
Rise of beverage-grade pea isolates
Beverage performance has become the main development target for pea isolates, because stability, off-notes and texture remain the listed barriers. Cargill built PURIS 2.0 specifically for beverages, supporting up to 30 grams of protein per serving, while PURIS HiLo targets stability in acidic drinks, according to Nutritional Outlook in June 2026. Ingredion's Vitessence Pea 200 D offers 80% protein on a dry basis with lower sedimentation in ready-to-mix formats, Food Business Middle East & Africa reported. Burcon also positions Peazazz C for beverages, dairy alternatives and bars. The U.S. International Trade Commission lists powders, shakes and bars among the main uses, which links this work to sports supplements and Sports Nutrition and Dietary Supplementation.
Opening in Mexican feed and dairy rations
Mexico offers a practical opening for soy concentrates and dry-milled pulse grades because its feed output is large and import-dependent. Conafab projected 41.883 million metric tons of feed in 2025 and estimated consumption of 9.316 million metric tons of protein co-products, S&P Global reported in August 2025. The Iowa Soybean Association reported that Nuplean, a Torreón cooperative, supports 125 dairy farms and more than 217,000 milking cows through four mills. Soybean meal makes up less than 10% of those dairy rations, and owners told a January 2026 delegation that they may raise it. Suppliers that pair protein grades with ration data could therefore win share as Mexico grows at 5.11% a year.
Opening in Prairie surplus crops and new pulses
Abundant Prairie crops create an opening for processors that can add protein value in Canada before export. Statistics Canada put 2025 canola output at 21.8 million metric tons, a record, while July 31, 2026, dry pea stocks reached 1.182 million metric tons, up 141.7%, DePutter Publishing reported. Protein Industries Canada committed C$1.4 million to the C$3.9 million AGT Foods project on peas, lentils and faba beans. Burcon reported first commercial FavaPro production after June 2025, which shows that newer sources can reach scale. ADM's May 2026 allergen-label-free pea flour also suggests that pulse flour can serve baked goods and cereals, supporting further Canadian processing growth.
Trade swings and formulation limits test suppliers
Pea trade swings distort Prairie supply planning
Export policy can swing pea supply quickly, which complicates long-term procurement. China imposed a 100% tariff on Canadian peas in March 2025, then announced its removal on Jan. 16, 2026, effective March 1, according to a Pulse Canada statement carried by Farms.com. Canadian stocks still closed July 2026 at a record 1.182 million metric tons. Processors gain cheap feedstock in such periods, although growers may reduce acreage after weak returns. Multi-year contracts with Prairie growers and dual origin qualification reduce that exposure for both processors and brand owners.
Low-priced imports pressure domestic pea margins
Import pricing has undercut domestic pea protein for years, leaving a narrow margin for new North American plants. The U.S. International Trade Commission found Chinese product undersold domestic product in all 52 quarterly comparisons, by 45.4% on average, in its preliminary report. Commerce Department data show 65.6 million kilograms of imports from China under the relevant tariff codes in 2022. Duty orders ease this pressure but can shift buying to other origins such as Brazil. Producers therefore need function or origin claims that justify higher prices.
Taste and digestibility still limit recipes
Formulation limits raise development cost because plant proteins rarely behave like dairy proteins in finished products. Nutritional Outlook listed stability, off-notes and texture as the main beverage barriers in June 2026, and pea protein at a 0.80 score needs more grams than a complete protein for the same claim. Where digestibility data are missing, the Agricultural Utilization Research Institute warns that a costly animal feeding study may be needed. Smaller brands feel this most, so supplier application labs and blended systems are the usual mitigation.
Import reliance exposes wheat protein buyers
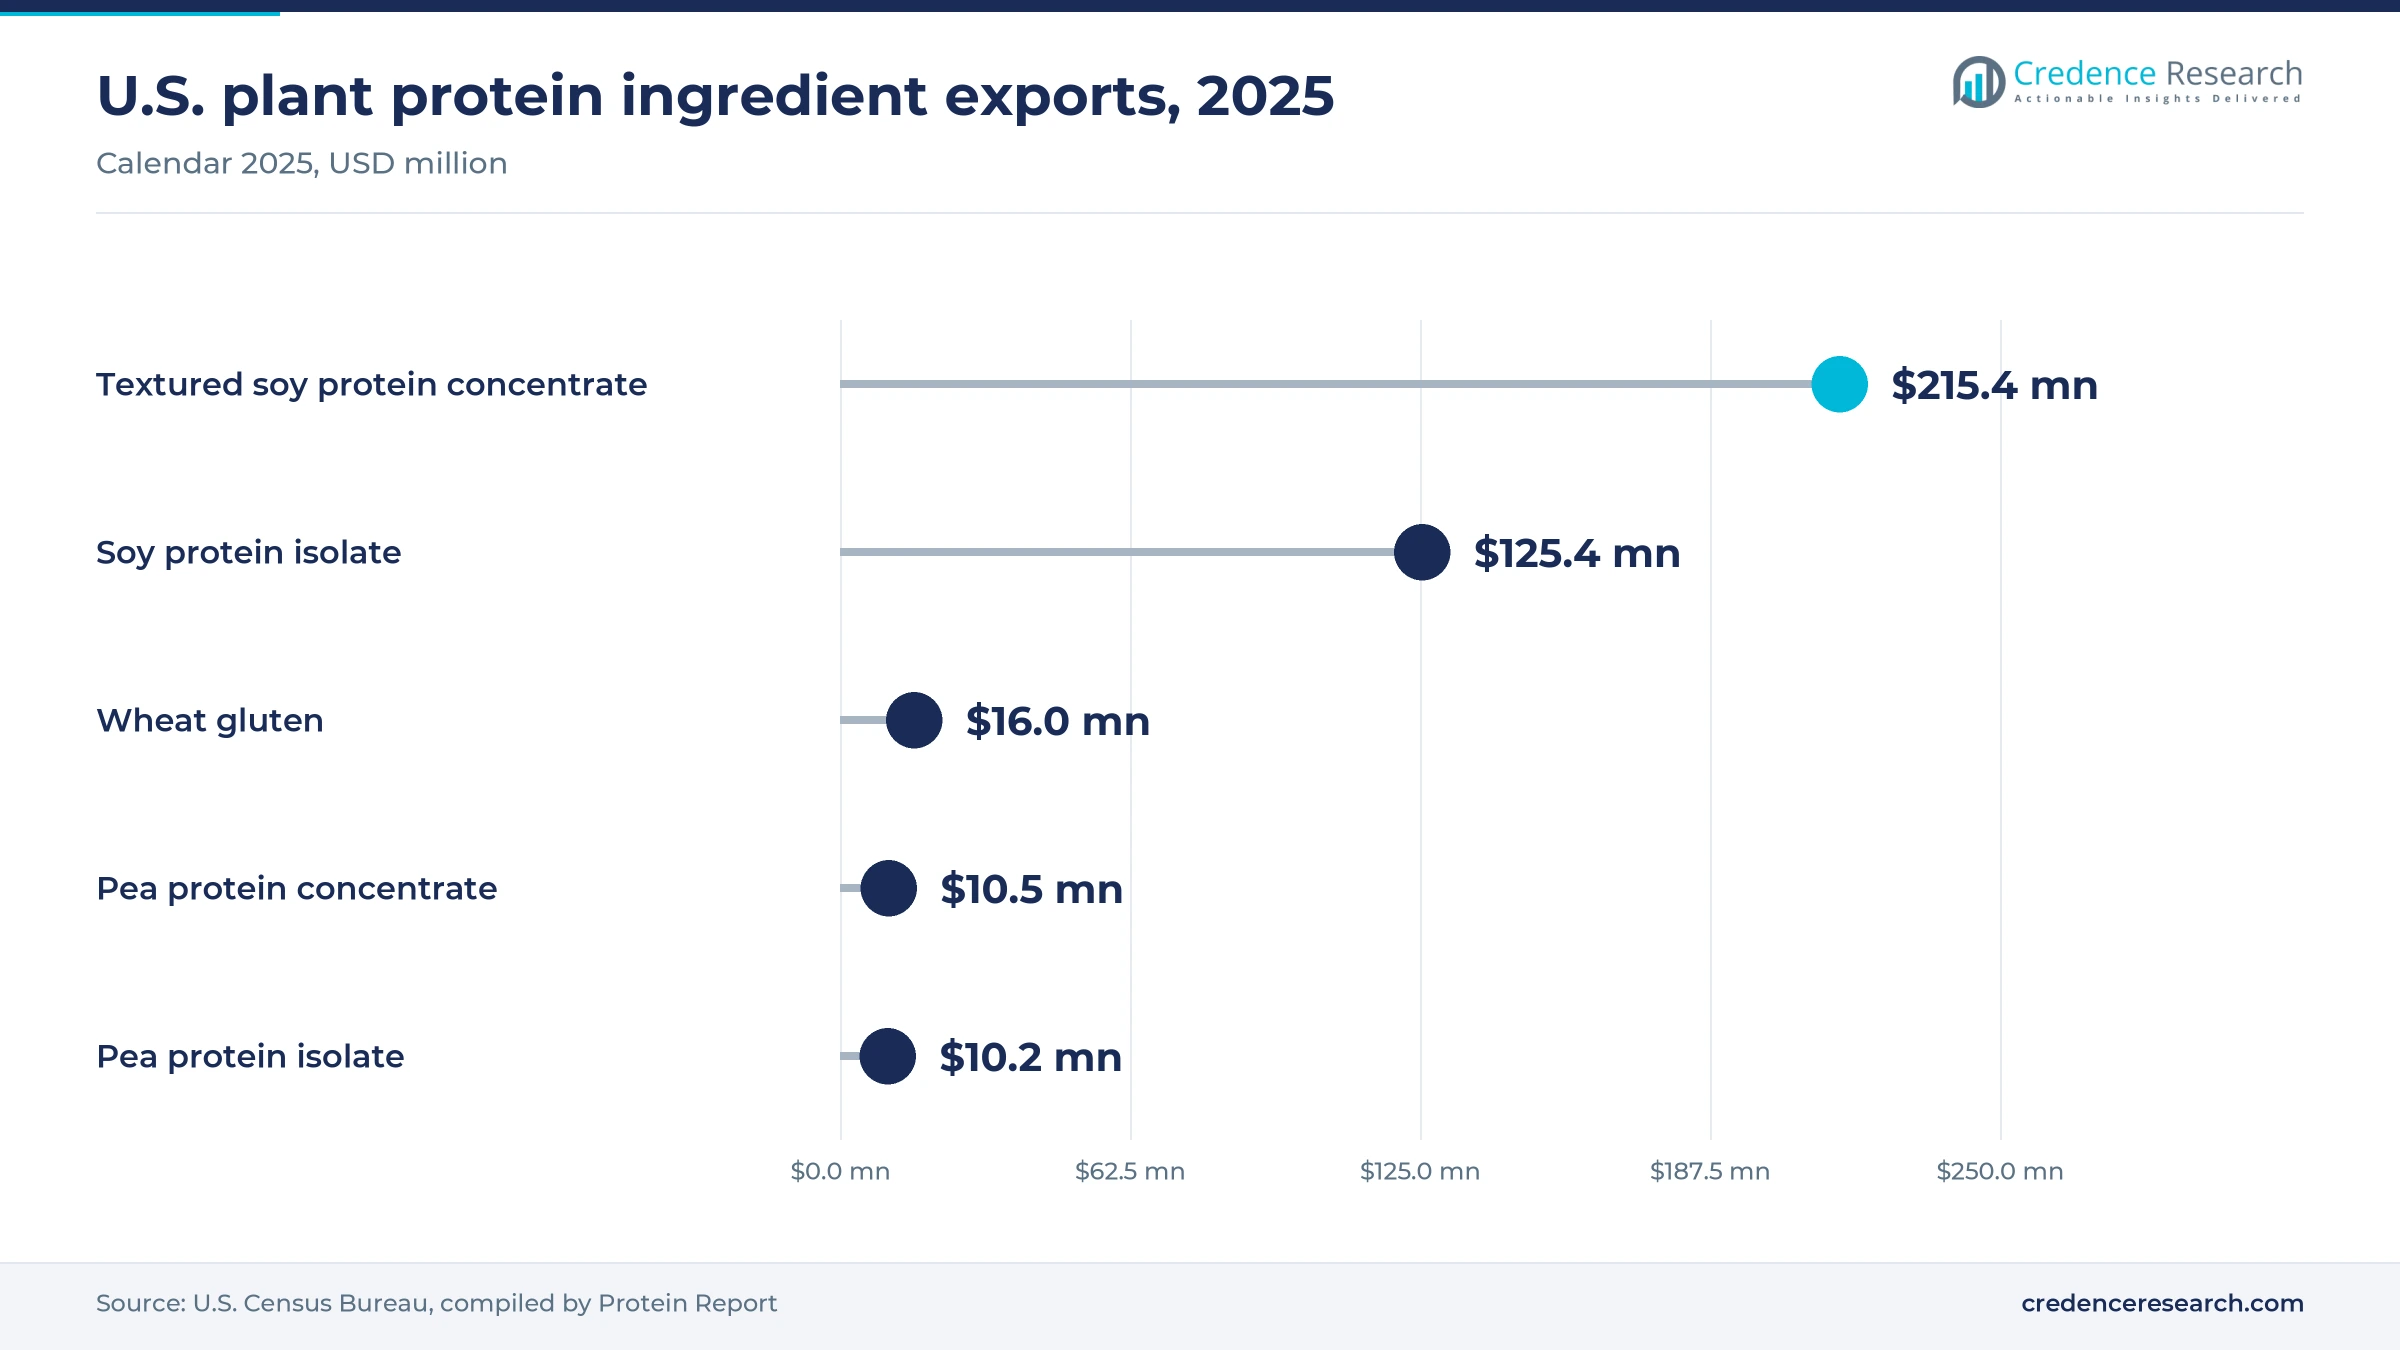
Wheat protein buyers carry more trade exposure than soy buyers because the United States imports far more wheat gluten than it ships. Census Bureau data compiled by Protein Report show about $237.1 million of imports in the 12 months through August 2026, against $16 million of exports in 2025. Bakers and textured-protein makers therefore face freight and tariff swings on a key input. Domestic extrusion and pea or soy substitution offer partial relief, although gluten's dough function is difficult to replace.
U.S. leads in value as Canada adds processing depth
| Country | Value, 2025 (USD billion) | Share, 2025 | CAGR, 2026–2035 |
|---|---|---|---|
| United States | 3.78 | 87.5% | 4.11% |
| Canada | 0.29 | 6.8% | 5.41% |
| Mexico | 0.25 | 5.7% | 5.11% |
United States anchors soy and pea processing
The United States held 87.5% of 2025 value and grows at 4.11% a year because soy crushing, isolate plants and large brand owners sit in one market. Census Bureau figures show U.S. plant protein ingredients exports led by textured soy concentrate at $215.4 million in 2025, which signals surplus processing depth. PURIS holds a retrofitted 200,000-square-foot site at Dawson, Minnesota, backed by $75 million from Cargill in 2019, while Ingredion runs South Sioux City. Growth stays near the regional rate because the base is already large.
Canada builds on Prairie pea and canola supply
Canada held 6.8% of 2025 value and is the fastest-growing country at 5.41% a year as processing moves closer to the Prairie crop. Roquette opened its 200,000-square-foot Portage la Prairie plant in November 2021, and Protein Industries Canada funded new pulse work with AGT Foods at Regina in March 2026. Record 2025 canola output of 21.8 million metric tons adds a further feedstock for Canadian plant protein ingredients demand. However, the domestic buyer base is small, so Canadian plants depend heavily on U.S. and export customers.
Mexico grows through feed and soybean imports
Mexico held 5.7% of 2025 value and grows at 5.11% a year, with feed mills accounting for much of the regional opportunity. The Iowa Soybean Association reports that the United States shipped $2.3 billion of soybeans and $859 million of soybean meal to Mexico in 2024. The association adds that soybean meal averages 28% of broiler feed and 20% of swine feed, which makes feed central to Mexican plant protein ingredients demand. Domestic oilseed output remains low, according to USDA, so Mexican buyers rely on U.S. supply under USMCA terms.
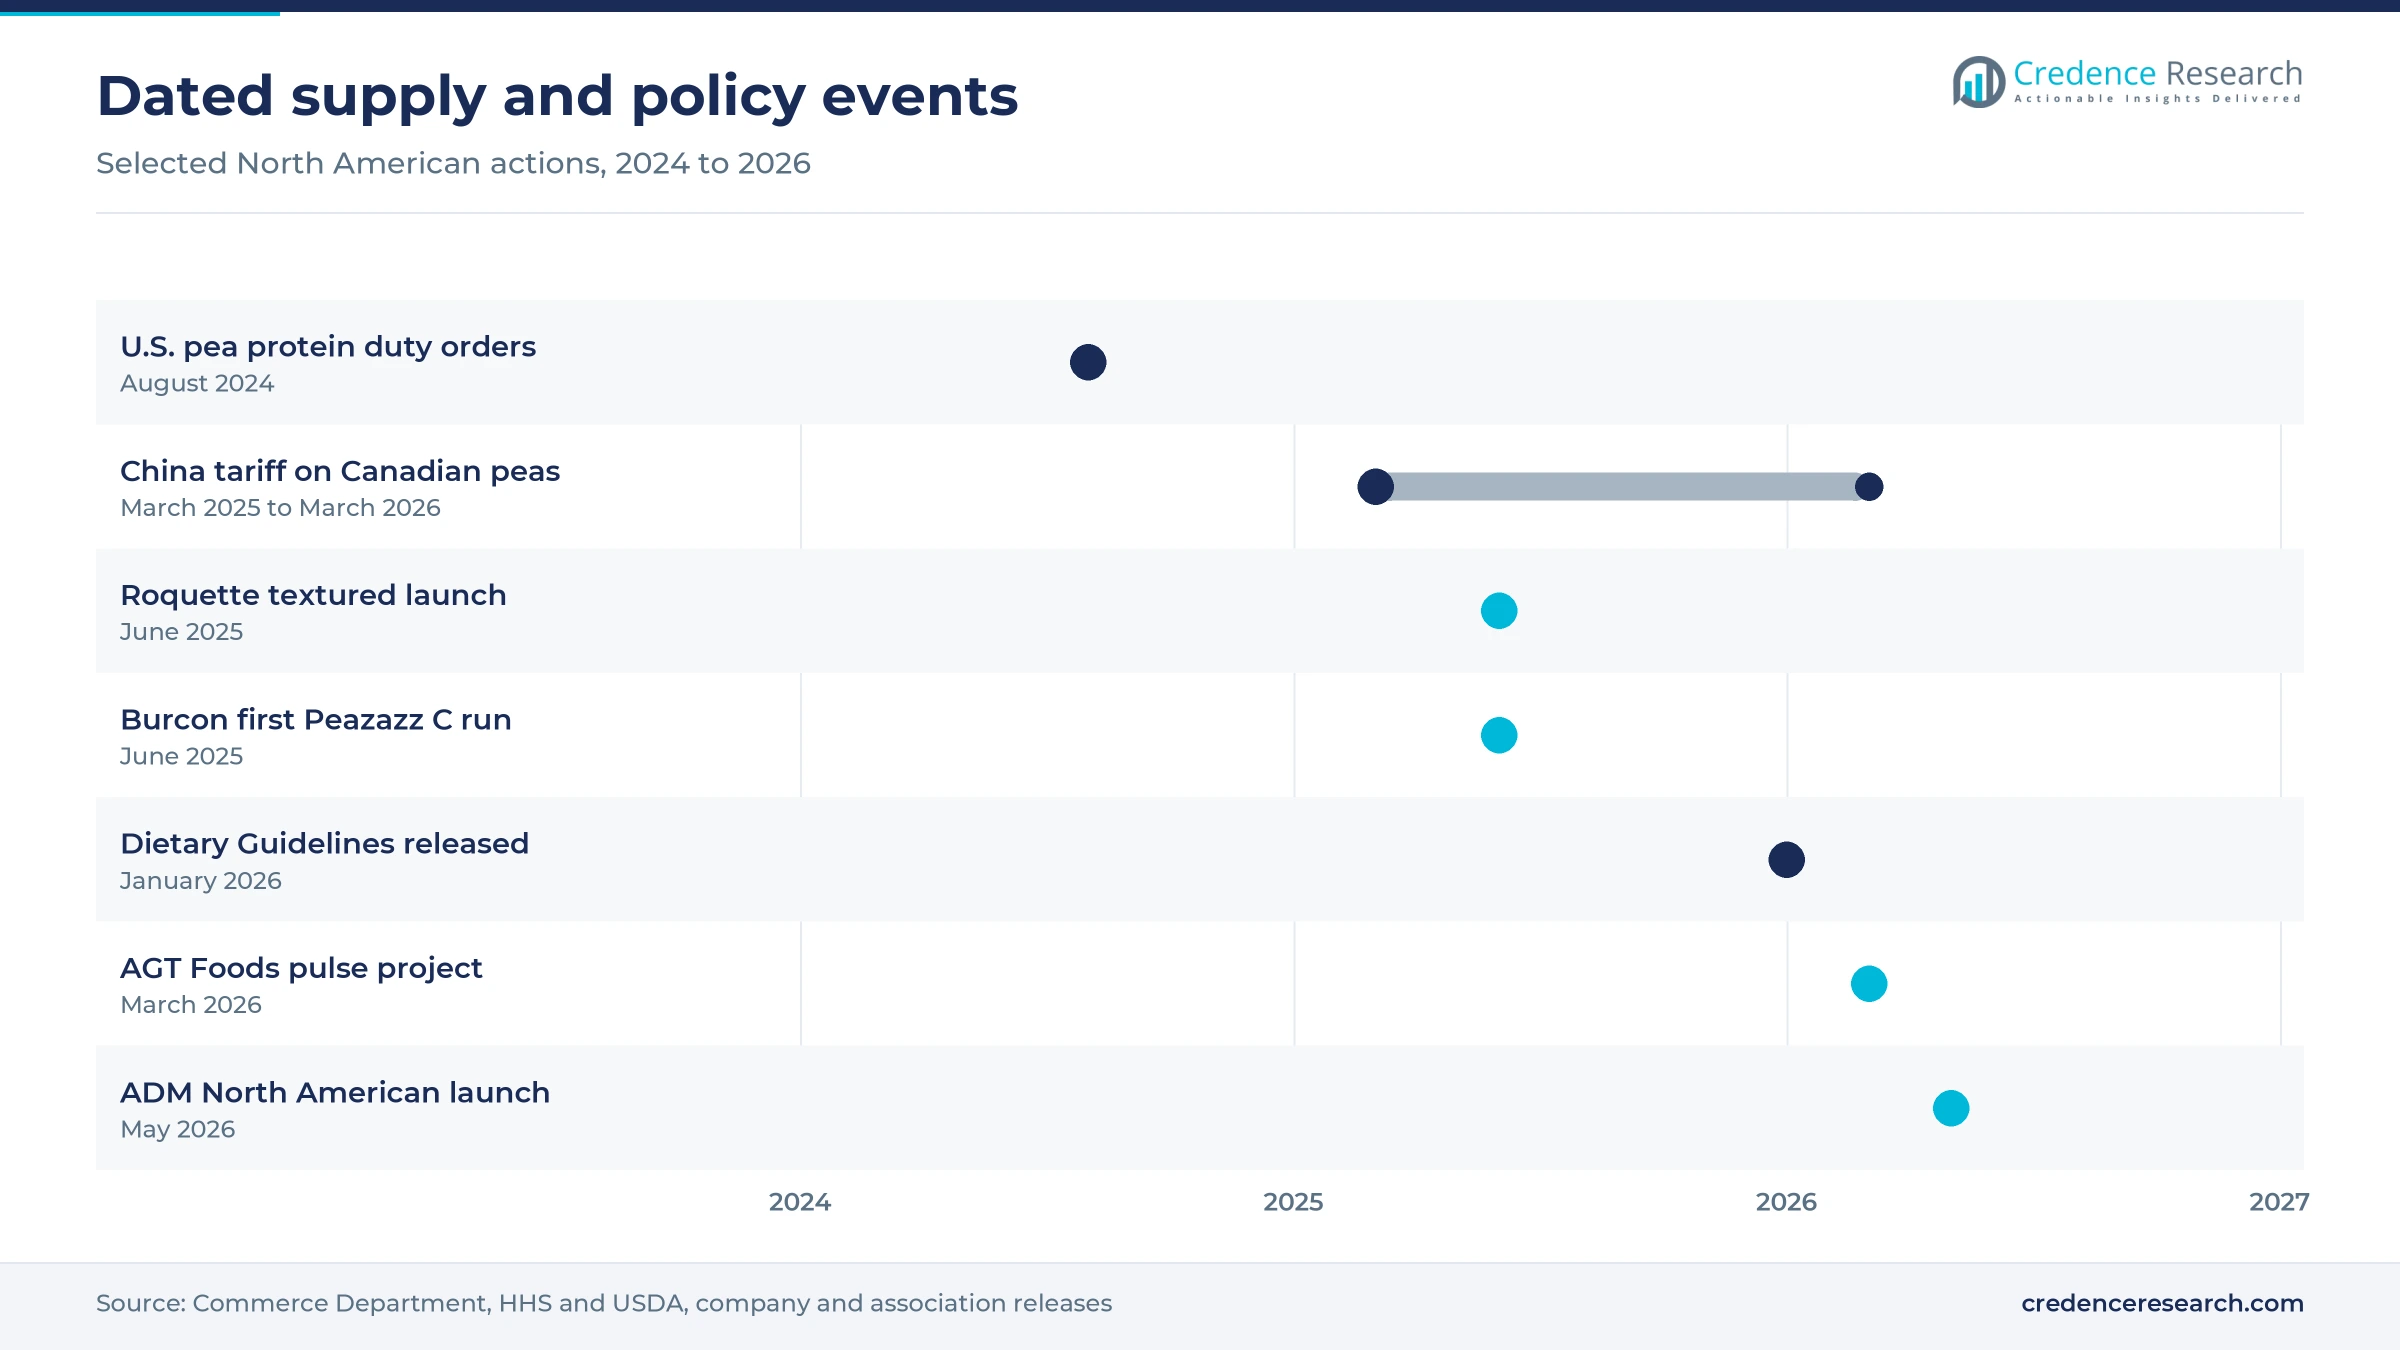
Duty orders and launches reset supply since 2024
| Development | Status and market relevance |
|---|---|
| In August 2024, the Commerce Department issued antidumping and countervailing duty orders on certain pea protein from China. | In force, and it raises the delivered cost of Chinese supply. |
| In June 2025, Roquette launched Nutralys T Wheat 600L and Nutralys T Pea 700XC textured proteins. | Launched, and it extends textured options for hybrid and heat-stable recipes. |
| In June 2025, Burcon completed its first commercial production run of Peazazz C at Galesburg, Illinois. | Ramping, and it adds a further domestic isolate source. |
| In March 2026, Protein Industries Canada and partners announced a C$3.9 million pulse ingredient project with AGT Foods and Sweet Nutrition. | Underway, and it tests heat-moisture treatment, blending and extrusion. |
| In May 2026, ADM expanded its North American range with ProFam isolates, Arcon concentrates and pea flour. | Launched, and it broadens soy and pea options for manufacturers. |
Processing route sets protein grade and end use
- Wet extraction separates starch and fiber from pea flour using water and isoelectric precipitation, yielding the 80% to 85% protein grades described by the U.S. International Trade Commission.
- Dry fractionation uses air, particle size and density to split protein from starch, giving 50% to 55% protein grades used primarily in animal feed and some processed foods.
- Extrusion turns pea and wheat proteins into textured pieces, as at MGP Ingredients in Atchison, Kansas and AGT Foods in Regina, Saskatchewan.
- Enzymatic hydrolysis breaks proteins into smaller fractions for hair and skin conditioning, and Croda lists Hydrosoy 2000 PE hydrolyzed soy protein for these uses.
Need a Custom Version of This Report?
Tailor the scope, geography, or segments to your exact requirements.
- Custom geography or segment scope
- Direct access to our analyst team
Five suppliers compete on function and origin
Competition centers on functional performance, documented origin and the reliability of annual supply rather than on list price alone. ADM and Cargill compete through breadth, pairing soy, pea and sweetening or formulation support for large manufacturers. Roquette relies on its Portage la Prairie pea plant and its expanding Nutralys range. Ingredion sells application-specific isolates, including grades for bars and ready-to-mix beverages, from South Sioux City. PURIS, the largest U.S. pea protein producer in 2022 according to the U.S. International Trade Commission, led the petition that produced the 2024 duty orders and works with Cargill. Smaller entrants such as Burcon and MGP Ingredients add contract, isolate and textured capacity that gives mid-sized brands another route to supply. Buyers therefore tend to qualify at least two sources for each grade, and they increasingly ask for digestibility data with every sample.
Companies profiled and their roles in this market
| Company | Type | Role in the market |
|---|---|---|
| ADM | Integrated processor | Launched ProFam soy isolates, Arcon concentrates and pea flour in North America in May 2026. |
| Cargill | Integrated processor and investor | Invested $75 million in PURIS in 2019 and markets PURIS 2.0 pea protein for beverages. |
| Roquette | Pea and wheat specialist | Operates the Portage la Prairie, Manitoba, pea plant and launched textured Nutralys grades in June 2025. |
| Ingredion | Specialty ingredient supplier | Runs South Sioux City, Nebraska and sells Vitessence pea isolates for bars and beverages. |
| PURIS | Pea protein producer | Largest U.S. producer in 2022, with a retrofitted site at Dawson, Minnesota and petitioner in the duty case. |
Function and origin now decide supplier selection
Credence Research's view is that supplier selection in this market now turns on function and origin more than on soy or pea as a category. Soy keeps scale because crushing keeps expanding, yet pea and functionalized grades will collect a disproportionate share of new formulation work. Buyers should qualify at least two sources per grade and request digestibility data early. Plant protein ingredients demand of USD 4.51 billion in 2026 rewards specialization more than bulk capacity. Investors should treat new pea capacity carefully, because import pricing and Prairie stock swings can compress margins quickly even with duty orders in place.
How Credence Research built this estimate
The report uses 2025 as the base year and 2035 as the forecast year, with market values from the Credence Research model. Country and segment splits are Credence Research estimates informed by public data, including Statistics Canada, U.S. Census Bureau trade series compiled by Protein Report, Commerce Department and U.S. International Trade Commission documents, American Soybean Association and Iowa Soybean Association analysis, company releases and named trade publications. No interviews or surveys were conducted for this edition of the report.
Pea and sports nutrition set the pace through 2035
The plant protein ingredients market is forecast to reach USD 6.57 billion by 2035, with Pea Protein and Sports Nutrition and Dietary Supplementation setting the pace. Soy should remain the largest type because crush capacity keeps adding feedstock, and Canada should narrow the processing gap as Prairie projects mature. The main risks are renewed pea trade disputes, weak isolate margins and slower reformulation among smaller brands. Suppliers that can document origin and digestibility, and that can deliver stable beverage and textured grades, should capture most of the added value through 2035.
Frequently Asked Questions
How big is the North America plant protein ingredients market?
Which country leads the North America plant protein ingredients market?
Which product type holds the largest share?
Which product type grows fastest?
How did U.S. trade action change pea protein sourcing?
Why does protein quality matter to ingredient buyers?
What role does Mexico play in this market?
Which companies are active in this market?
Table of Content
Chapter 1 Market Segmentation
- 1.1 Segmentation Framework
- 1.1.1 Product and Service Classification
- 1.1.2 Application and End-Use Classification
- 1.1.3 Technology and Solution Classification
- 1.1.4 Customer and Distribution Channel Classification
- 1.1.5 Geographic Segmentation
- 1.1.6 Market Segment Definitions and Boundaries
- 1.2 By Product Type
- 1.2.1 Soy Protein
- 1.2.2 Pea Protein
- 1.2.3 Wheat Protein
- 1.2.4 Specialty Plant Proteins
- 1.3 By Application
- 1.3.1 Food and Beverage Formulation
- 1.3.2 Animal Feed Formulation
- 1.3.3 Sports Nutrition and Dietary Supplementation
- 1.3.4 Personal Care and Technical Formulation
- 1.4 By Customer Type
- 1.4.1 Brand-Owned Manufacturing Buyers
- 1.4.2 Contract Manufacturing Buyers
- 1.4.3 Feed and Technical Manufacturing Buyers
- 1.5 By Technology
- 1.5.1 Wet Extraction
- 1.5.2 Dry Fractionation
- 1.5.3 Post-Extraction Functionalization
- 1.6 By Country
- 1.6.1 United States
- 1.6.2 Canada
- 1.6.3 Mexico
Chapter 2 Introduction
- 2.1 Report Objectives and Scope
- 2.2 Product Definition and Industry Terminology
- 2.3 Market Inclusions and Exclusions
- 2.4 Research Process
- 2.4.1 Primary Research and Expert Interviews
- 2.4.2 Secondary Research and Source Review
- 2.4.3 Top-Down and Bottom-Up Estimation
- 2.4.4 Data Triangulation and Verification
- 2.5 Market Size Measurement Basis
- 2.5.1 2025: USD 4.32 billion → 2035: USD 6.57 billion
- 2.6 Historical and Forecast Reference Periods
- 2.6.1 Historical Period: 2018-2025
- 2.6.2 Base Year: 2025
- 2.6.3 Forecast Period: 2025-2035
- 2.7 Research Assumptions and Limitations
Chapter 3 Executive Summary
- 3.1 Market Snapshot and Key Findings
- 3.2 Base-Year Market Size, 2025
- 3.3 Forecast Market Size, 2035
- 3.4 Revenue and Volume Growth Outlook
- 3.5 Key Demand and Supply Indicators
- 3.6 Leading Market Segments
- 3.7 Fastest-Growing Market Opportunities
- 3.8 Regional Performance Highlights
- 3.9 Technology and Industry Transformation
- 3.10 Competitive Landscape Summary
- 3.11 Analyst View and Strategic Implications
Chapter 4 North America Plant Protein Ingredients Market Trends and Developments
- 4.1 Historical Industry Development, 2018-2025
- 4.2 Recent Market Trends and Developments
- 4.3 Demand and Customer Behavior Trends
- 4.4 Technology and Product Innovation
- 4.5 Artificial Intelligence, Automation and Digitalization
- 4.6 Local Manufacturing and Supply Chain Realignment
- 4.7 Industry Partnerships, Mergers and Acquisitions
- 4.8 Sustainability and Circular Economy Developments
- 4.9 Government and Private Sector Investment Trends
- 4.10 Emerging Business Models and Commercialization
- 4.11 Industry Developments and Announcements
Chapter 5 North America Plant Protein Ingredients Market Production, Supply and Demand Analysis
- 5.1 Demand Trend and Consumption Analysis, 2018-2025
- 5.2 Demand Forecast, 2025-2035
- 5.3 Production and Output Trend, 2018-2025
- 5.4 Production and Output Forecast, 2025-2035
- 5.5 Installed Capacity and Capacity Utilization
- 5.6 Company-Wise Production Plants and Statistics
- 5.6.1 Installed Production Capacity
- 5.6.2 Actual Production
- 5.6.3 Planned Capacity and Expansion Targets
- 5.7 Supply Chain Structure and Procurement Trends
- 5.8 Supply-Demand Gap and Bottlenecks
- 5.9 Import Dependence and Sourcing Structure
- 5.10 Contract Manufacturing and Outsourcing
- 5.11 Regional Supply and Demand Concentration
Chapter 6 North America Plant Protein Ingredients Market Pricing Analysis
- 6.1 Pricing Structure and Measurement
- 6.2 Historical Pricing Trends, 2018-2025
- 6.3 Pricing Outlook, 2025-2035
- 6.4 Average Selling Price and Unit Economics
- 6.5 Pricing by Product and Market Segment
- 6.6 Geographic Pricing Differences
- 6.7 Key Input, Energy, Labor and Logistics Costs
- 6.8 Contract Pricing and Purchasing Models
- 6.9 Pricing Sensitivity and Competitive Positioning
- 6.10 Price, Margin and Profitability Implications
Chapter 7 North America Plant Protein Ingredients Market Dynamics
- 7.1 Market Growth Drivers
- 7.1.1 Demand-Side Drivers
- 7.1.2 Technology and Innovation Drivers
- 7.1.3 Infrastructure and Investment Drivers
- 7.1.4 Regulatory and Policy Drivers
- 7.2 Market Restraints
- 7.2.1 Cost and Affordability Constraints
- 7.2.2 Technology and Adoption Barriers
- 7.2.3 Supply Chain and Operational Constraints
- 7.3 Market Challenges
- 7.3.1 Competitive Pressure and Margin Erosion
- 7.3.2 Skills, Infrastructure and Implementation Gaps
- 7.4 Emerging Market Opportunities
- 7.5 Market Dynamics Impact and Time-Horizon Assessment
Chapter 8 North America Plant Protein Ingredients Value Chain Analysis
- 8.1 Industry Value Chain Overview
- 8.2 Upstream Suppliers and Critical Inputs
- 8.3 Technology and Component Providers
- 8.4 Manufacturing or Service Delivery
- 8.5 Distribution, Channel Partners and Integrators
- 8.6 Downstream Applications and End Users
- 8.7 Value Addition and Profit Pools
- 8.8 Vertical Integration and Outsourcing
- 8.9 Supplier Concentration and Risk
- 8.10 Supply Chain Localization and Resilience
Chapter 9 North America Plant Protein Ingredients Market Regulations and Policies
- 9.1 Relevant Laws, Standards and Compliance Frameworks
- 9.2 Product, Service, Safety and Quality Requirements
- 9.3 Government Policies, Incentives and Subsidies
- 9.4 Imports, Exports and Trade Barriers
- 9.5 Public Procurement and Local Content Requirements
- 9.6 Environmental and Sustainability Compliance
- 9.7 Upcoming Policy Changes and Market Implications
Chapter 10 North America Plant Protein Ingredients Market Hotspots and Opportunities
- 10.1 Market Opportunity Mapping and Growth Hotspots
- 10.2 High-Growth Applications and Customer Groups
- 10.3 Underserved Markets and White-Space Opportunities
- 10.4 Emerging Technology and Product Opportunities
- 10.5 New Capacity and Investment Hotspots
- 10.6 Market Entry and Expansion Opportunities
- 10.7 Distribution and Partnership Opportunities
- 10.8 Near-Term and Long-Term Commercial Potential
- 10.9 Opportunity Attractiveness and Execution Risks
Chapter 11 North America Plant Protein Ingredients Market Outlook, 2025-2035
- 11.1 Market Size and Analysis
- 11.1.1 Revenue (Market Measurement: 2025: USD 4.32 billion → 2035: USD 6.57 billion)
- 11.1.2 Market Volume and Quantity Sold
- 11.1.3 Historical Market Size, 2018-2025
- 11.1.4 Base-Year Market Size, 2025
- 11.2 Market Forecast, 2025-2035
- 11.2.1 Revenue Forecast to 2035
- 11.2.2 Volume Forecast to 2035
- 11.2.3 CAGR and Year-on-Year Growth
- 11.2.4 Incremental Revenue Opportunity
- 11.3 Forecast Assumptions and Scenario Analysis
- 11.3.1 Base-Case Forecast
- 11.3.2 Optimistic and Conservative Scenarios
- 11.3.3 Technology, Pricing and Policy Sensitivities
- 11.4 Market Attractiveness and Growth Outlook
Chapter 12 North America Plant Protein Ingredients Market Segmentation and Outlook
- 12.1 Segmentation Summary and Market Shares, 2025
- 12.2 Largest and Fastest-Growing Segments
- 12.3 By Product Type - Market Size and Forecast, 2025-2035
- 12.3.1 Segment Definition and Scope
- 12.3.2 Historical Market Size, 2018-2025
- 12.3.3 Revenue Forecast, 2025-2035
- 12.3.4 Volume Forecast, 2025-2035
- 12.3.5 Base-Year Market Share, 2025
- 12.3.6 Segment CAGR and Growth Drivers
- 12.3.7 Subsegment Market Size and Forecast
- 12.3.7.1 Soy Protein
- 12.3.7.2 Pea Protein
- 12.3.7.3 Wheat Protein
- 12.3.7.4 Specialty Plant Proteins
- 12.3.8 Subsegment Pricing and Adoption Trends
- 12.3.9 Leading Suppliers and Competition
- 12.3.10 Regional Demand and Opportunities
- 12.4 By Application - Market Size and Forecast, 2025-2035
- 12.4.1 Segment Definition and Scope
- 12.4.2 Historical Market Size, 2018-2025
- 12.4.3 Revenue Forecast, 2025-2035
- 12.4.4 Volume Forecast, 2025-2035
- 12.4.5 Base-Year Market Share, 2025
- 12.4.6 Segment CAGR and Growth Drivers
- 12.4.7 Subsegment Market Size and Forecast
- 12.4.7.1 Food and Beverage Formulation
- 12.4.7.2 Animal Feed Formulation
- 12.4.7.3 Sports Nutrition and Dietary Supplementation
- 12.4.7.4 Personal Care and Technical Formulation
- 12.4.8 Subsegment Pricing and Adoption Trends
- 12.4.9 Leading Suppliers and Competition
- 12.4.10 Regional Demand and Opportunities
- 12.5 By Customer Type - Market Size and Forecast, 2025-2035
- 12.5.1 Segment Definition and Scope
- 12.5.2 Historical Market Size, 2018-2025
- 12.5.3 Revenue Forecast, 2025-2035
- 12.5.4 Volume Forecast, 2025-2035
- 12.5.5 Base-Year Market Share, 2025
- 12.5.6 Segment CAGR and Growth Drivers
- 12.5.7 Subsegment Market Size and Forecast
- 12.5.7.1 Brand-Owned Manufacturing Buyers
- 12.5.7.2 Contract Manufacturing Buyers
- 12.5.7.3 Feed and Technical Manufacturing Buyers
- 12.5.8 Subsegment Pricing and Adoption Trends
- 12.5.9 Leading Suppliers and Competition
- 12.5.10 Regional Demand and Opportunities
- 12.6 By Technology - Market Size and Forecast, 2025-2035
- 12.6.1 Segment Definition and Scope
- 12.6.2 Historical Market Size, 2018-2025
- 12.6.3 Revenue Forecast, 2025-2035
- 12.6.4 Volume Forecast, 2025-2035
- 12.6.5 Base-Year Market Share, 2025
- 12.6.6 Segment CAGR and Growth Drivers
- 12.6.7 Subsegment Market Size and Forecast
- 12.6.7.1 Wet Extraction
- 12.6.7.2 Dry Fractionation
- 12.6.7.3 Post-Extraction Functionalization
- 12.6.8 Subsegment Pricing and Adoption Trends
- 12.6.9 Leading Suppliers and Competition
- 12.6.10 Regional Demand and Opportunities
- 12.7 By Country - Market Size and Forecast, 2025-2035
- 12.7.1 Segment Definition and Scope
- 12.7.2 Historical Market Size, 2018-2025
- 12.7.3 Revenue Forecast, 2025-2035
- 12.7.4 Volume Forecast, 2025-2035
- 12.7.5 Base-Year Market Share, 2025
- 12.7.6 Segment CAGR and Growth Drivers
- 12.7.7 Subsegment Market Size and Forecast
- 12.7.7.1 United States
- 12.7.7.2 Canada
- 12.7.7.3 Mexico
- 12.7.8 Subsegment Pricing and Adoption Trends
- 12.7.9 Leading Suppliers and Competition
- 12.7.10 Regional Demand and Opportunities
- 12.8 Segment Growth Comparison
- 12.9 Segment Attractiveness and Priority Matrix
Chapter 13 North America Plant Protein Ingredients End-Use and Application Market Outlook
- 13.1 End-Use Industry and Customer Demand Structure
- 13.2 Leading Applications and Customer Groups
- 13.3 End-Use Market Size, Share and Forecast
- 13.4 Major End-Use Industry Deep Dives
- 13.4.1 Customer Requirements and Use Cases
- 13.4.2 Demand and Replacement Cycles
- 13.4.3 Technical and Regulatory Considerations
- 13.4.4 Purchasing and Procurement Models
- 13.4.5 Leading Vendors and Distribution Channels
- 13.4.6 Forecast and Commercial Opportunities
- 13.5 Emerging Applications and Cross-Segment Demand
- 13.6 End-Use Industry Investment Priorities
Chapter 14 North America Plant Protein Ingredients Geographic Market Outlook, 2025-2035
- 14.1 Regional Market Size and Country-Level Shares, 2025
- 14.2 Country Market Size Comparison, 2025
- 14.3 Country Market Forecasts, 2025-2035
- 14.4 Subregional Industrial and Demand Clusters
- 14.5 Intra-Regional Pricing and Cost Differences
- 14.6 Cross-Border Trade and Supply Networks
- 14.7 Regional Supply and Demand Balances
- 14.8 Country Opportunity Comparison and Prioritization
Note: Every listed country is covered on the structure shown under the first country.
Chapter 15 North America Plant Protein Ingredients Technology, Innovation and Sustainability Outlook
- 15.1 Technology Landscape and Maturity
- 15.2 Product, Process and Service Innovation
- 15.3 AI, Automation and Digital Tools in the Industry
- 15.4 Technology Adoption and Performance Benchmarking
- 15.5 Innovation Pipeline and R&D Investment
- 15.6 Patent and Intellectual Property Trends
- 15.7 Energy Efficiency and Resource Management
- 15.8 Sustainability, Recycling and Circularity
- 15.9 Technology Roadmap, 2025-2035
- 15.10 Risks of Obsolescence and Technology Substitution
Chapter 16 North America Plant Protein Ingredients Market Key Strategic Imperatives
- 16.1 Growth and Market Entry Priorities
- 16.2 High-Return Products and Segments
- 16.3 Pricing, Profitability and Cost Optimization
- 16.4 Technology Investment and Product Differentiation
- 16.5 Supply Chain Localization and Resilience
- 16.6 Distribution and Customer Acquisition
- 16.7 Partnership, Acquisition and Capacity Strategy
- 16.8 Regional Expansion Priorities
- 16.9 Short-, Medium- and Long-Term Actions
Chapter 17 Competition Outlook
- 17.1 Industry Competition Characteristics
- 17.2 Market Structure and Concentration
- 17.3 Market Share and Competitive Positioning, 2025
- 17.4 Company-Wise Revenue and Product Benchmarking
- 17.5 Production and Service Capacity Benchmarking
- 17.6 Technology, Pricing and Differentiation
- 17.7 Regional Footprint and Distribution Strength
- 17.8 Mergers, Acquisitions and Strategic Alliances
- 17.9 New Entrants and Competitive Threats
- 17.10 Porter's Five Forces and Industry Attractiveness
- 17.11 Competitive Outlook, 2025-2035
Chapter 18 Company Profiles
- 18.1 Company Coverage and Selection Criteria
- 18.2 ADM
- 18.2.1 Business Description
- 18.2.2 Company Ownership and Geographic Presence
- 18.2.3 Product and Service Portfolio
- 18.2.4 Manufacturing and Operating Footprint
- 18.2.5 Production Capacity and Expansion Plans
- 18.2.6 Financial Performance and Investment
- 18.2.7 Market Share and Competitive Position
- 18.2.8 Technology and Innovation Capabilities
- 18.2.9 Strategic Alliances or Partnerships
- 18.2.10 Recent Developments
- 18.2.11 Growth Strategy and Outlook
- 18.3 Cargill
- 18.4 Roquette
- 18.5 Ingredion
- 18.6 PURIS
- 18.7 Other Relevant Market Participants
Note: Every listed company is profiled on the structure shown under the first company. The company list is preliminary and may change based on research findings, market developments, data availability and client requirements.
Chapter 19 Disclaimer
- 19.1 Research and Forecast Disclaimer
- 19.2 Data Source and Estimation Limitations
Note: The depth of individual sections depends on data availability for this market. Volume, capacity, trade and other unit-based metrics are included where applicable.

