
New U.S.-built ships are widening the inland voyage map
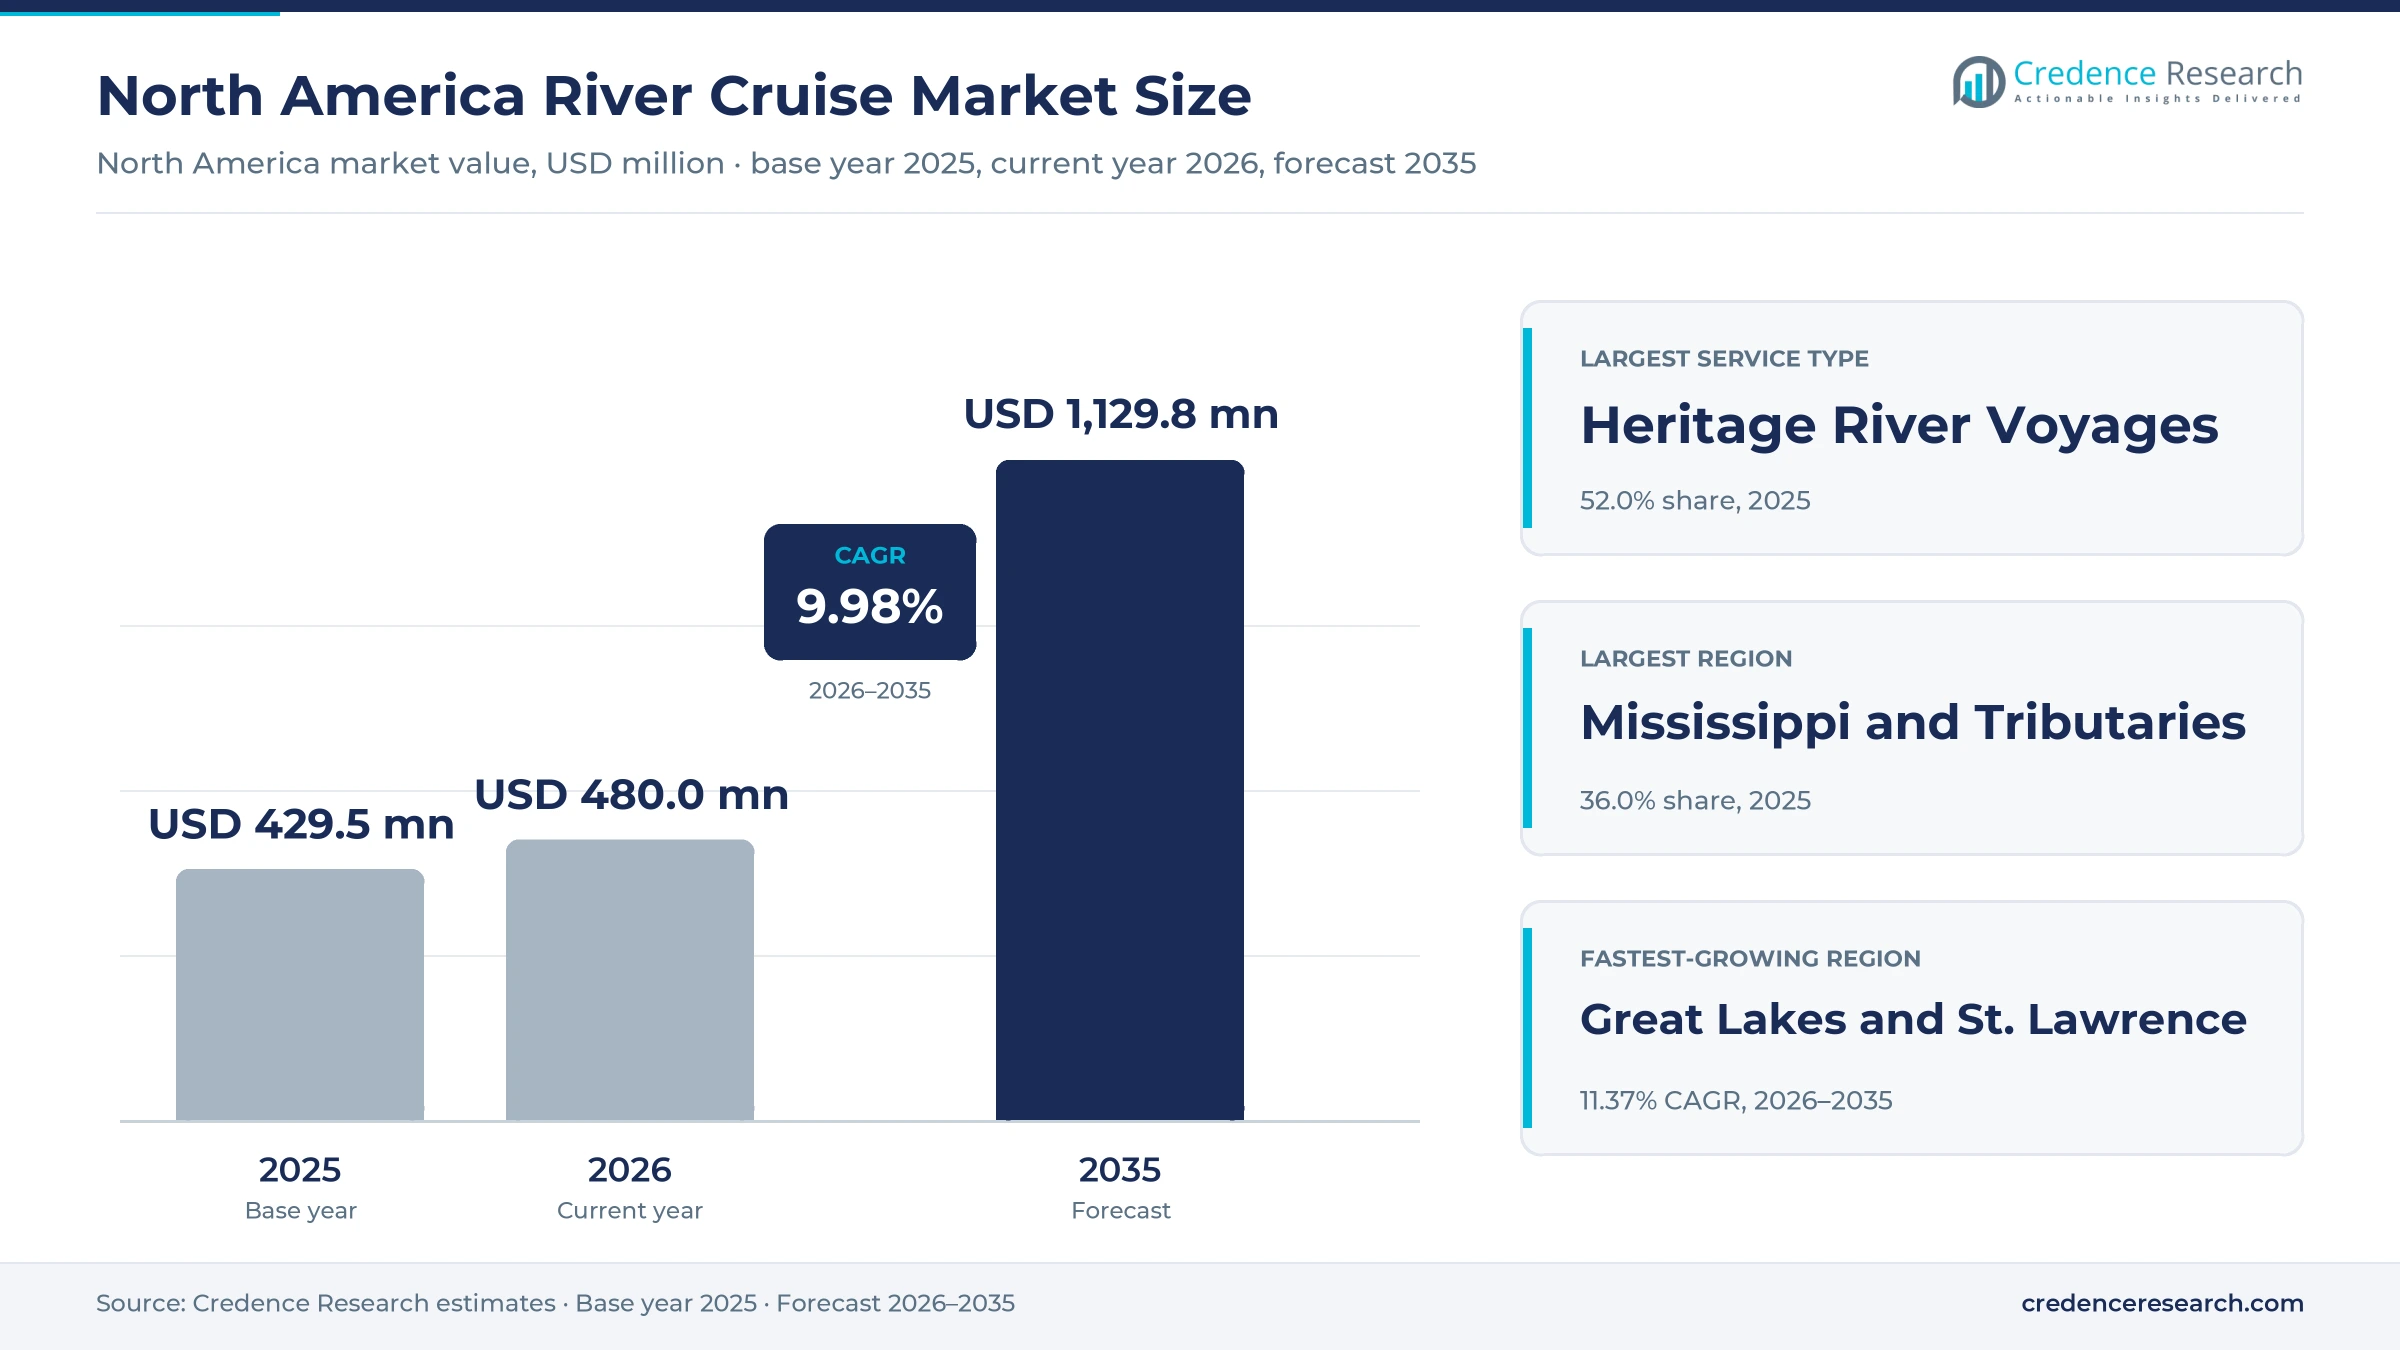
The North America river cruise market was valued at USD 429.5 million in 2025 and is projected to increase from USD 480.0 million in 2026 to USD 1.13 billion by 2035, registering a CAGR of 9.98% during 2026–2035. Demand rests on older travelers with time and budget for week-long voyages, on a domestic fleet that is expanding quickly, and on operators adding Great Lakes programs. Mississippi and Tributaries held the largest regional share, 33.0% in 2025, because the longest inland itineraries and the largest river vessel operate there. Great Lakes and St. Lawrence is the fastest-growing region at 11.24% a year, supported by seven lines scheduling 148 itineraries for the 2026 season. American Cruise Lines changed the supply outlook in October 2025 when it set out 10 new U.S.-built ships through 2028, so capacity on the Columbia, Snake and East Coast routes will rise well before the end of the decade.
Which voyages and waterways do these estimates count?
The market counts passenger fares for multi-night voyages on rivers, canals, connected lakes and sheltered coastal waterways in the United States and Canada. Buyers pay an inclusive fare that usually bundles the cabin, meals, shore excursions and often a pre-cruise hotel stay, and they book directly with the operator, through a specialist advisor or through an online agency.
Ocean itineraries on open seas, day sightseeing boats, dinner cruises, ferries and private yacht charters are excluded from the estimates. The value chain runs from U.S. and overseas shipyards and vessel owners to operators, port authorities, land-tour suppliers and the advisors who sell the voyages to older North American households.
North America River Cruise Market Insights
- The market is projected to grow from USD 429.5 million in 2025 to USD 1.13 billion by 2035, a 9.98% CAGR across 2026–2035, as new ships enter domestic service.
- Mississippi and Tributaries held 33.0% of 2025 value, while the Great Lakes and St. Lawrence region is projected to grow fastest at 11.24% a year.
- Heritage River Voyages led the service mix with 52.0% of 2025 value, supported by long itineraries linking New Orleans, Memphis and St. Paul.
- American Cruise Lines announced 10 new U.S.-built ships through 2028 on Oct. 27, 2025, with one vessel arriving about every four months across its order book.
- Competition centers on American Cruise Lines and Viking on the Mississippi, while Lindblad Expeditions will charter the 160-guest Greg Mortimer for Alaska from 2027.
Heritage voyages and direct bookings anchor market value
Why do heritage river voyages lead the service mix?
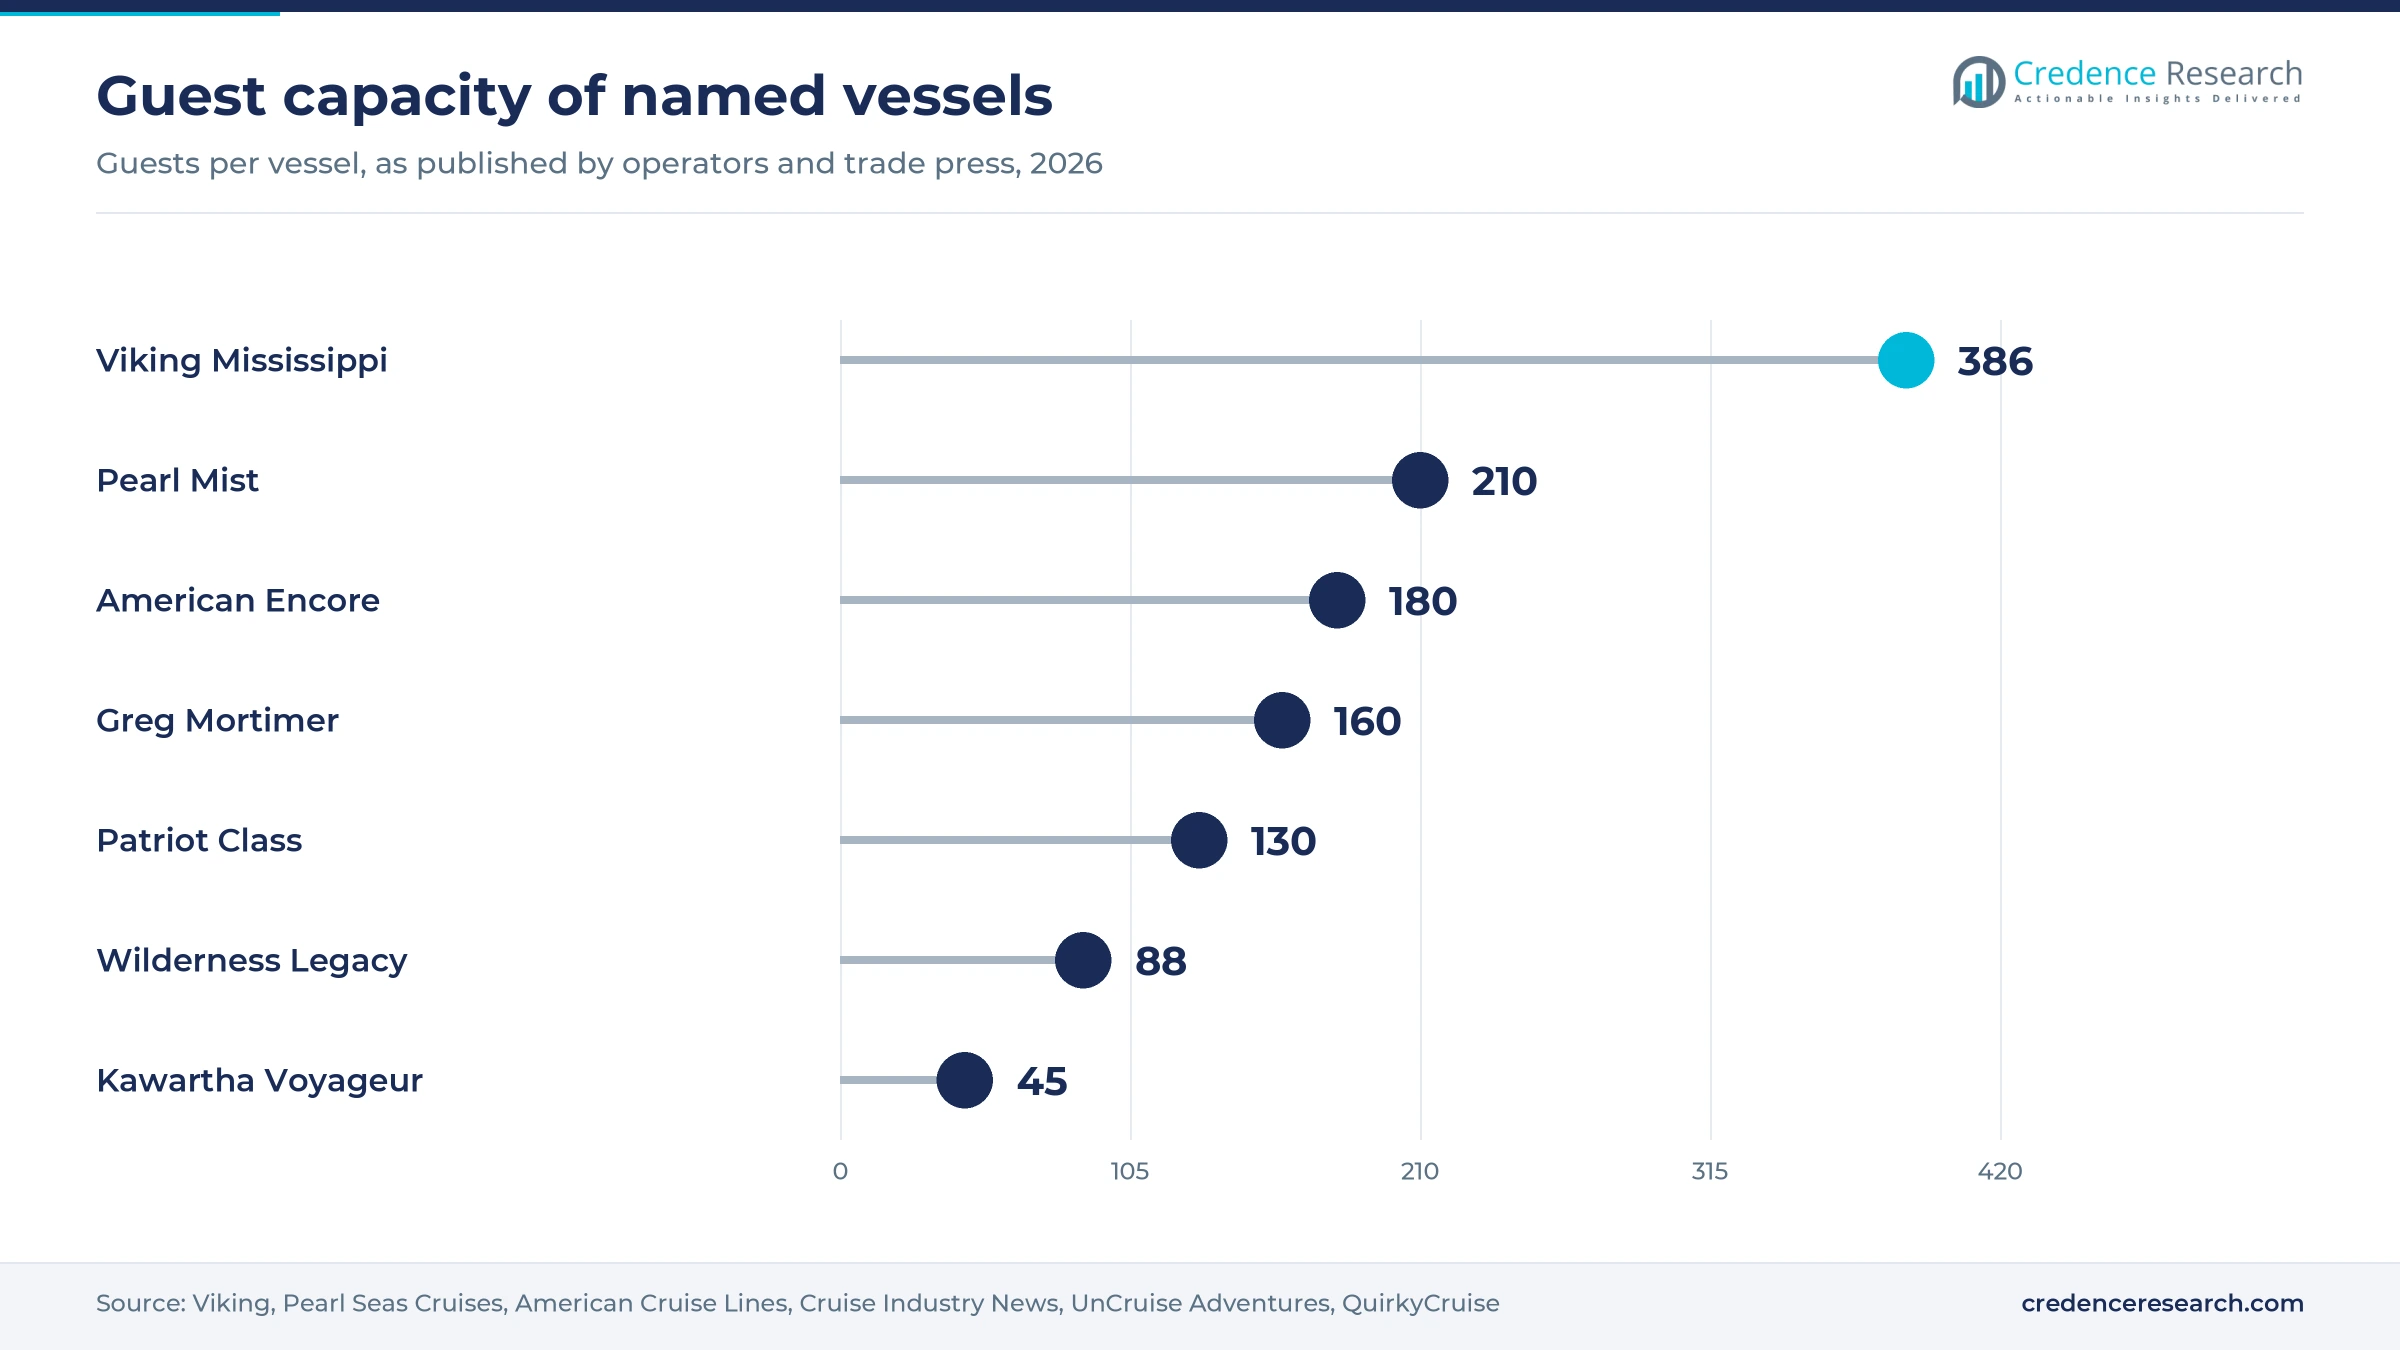
Based on service type, the market is categorized into heritage river voyages, nature expedition voyages and canal and connected-lake voyages. Heritage River Voyages led with 52.0% of 2025 value because history-themed Mississippi routes carry the largest vessel, the 386-guest Viking Mississippi, on sailings of up to 22 days, according to a Viking release dated Feb. 18, 2026. Canal and Connected-Lake Voyages is projected to grow fastest at 11.47% a year as Cruise the Great Lakes counted 148 itineraries and more than 800 port visits for 2026, with passenger visits up nearly 15%.
Which vessel types capture the most fare value?
Based on vessel type, the market is categorized into purpose-built river ships, paddlewheel riverboats, small expedition ships and canal cruise boats. Purpose-Built River Ships led with 45.0% of 2025 value because the 386-guest Viking Mississippi alone took a 35% share of Mississippi river capacity in the 2025 season, according to the Viking annual filing, which names American Cruise Lines as its competitor there. Small Expedition Ships is expected to grow fastest at 10.77% a year as Lindblad Expeditions replaces two 62-passenger ships with the 160-guest Greg Mortimer in Alaska from 2027, according to Cruise Industry News.
How do traveling parties shape cabin demand?
Based on customer type, the market is categorized into independent couples, solo travelers, families and multigenerational parties, and affinity groups. Independent Couples led with 58.0% of 2025 value because ship layouts favor double occupancy, with Viking Mississippi hosting 386 guests in 193 staterooms, according to Viking. Solo Travelers is forecast to grow fastest at 11.27% a year as American Cruise Lines said in a Dec. 1, 2025, release that suites and singles on its new ships carry no single supplement, which removes a long-standing cost penalty for this group.
Why does direct booking hold the largest channel share?
Based on booking channel, the market is categorized into operator direct booking, specialist travel advisors and online cruise agencies. Operator Direct Booking led with 46.0% of 2025 value because repeat guests return to brands they know, and Viking reported that past guests made over 60% of bookings for its inaugural Mississippi season, which began in 2022. Online Cruise Agencies is projected to grow fastest at 11.31% a year as 89% of adults 50 and older shop for bargains and their use of AI tools to find deals rose from 8% to 16%, according to AARP in March 2026.
| Segment Group | Leading Sub-segment | Share, 2025 | Fastest-growing Sub-segment | CAGR, 2026–2035 |
|---|---|---|---|---|
| By Service Type | Heritage River Voyages | 52.0% | Canal and Connected-Lake Voyages | 11.47% |
| By Vessel Type | Purpose-Built River Ships | 45.0% | Small Expedition Ships | 10.77% |
| By Customer Type | Independent Couples | 58.0% | Solo Travelers | 11.27% |
| By Booking Channel | Operator Direct Booking | 46.0% | Online Cruise Agencies | 11.31% |
Request a Free Sample
Fill in your details and we'll send you a free sample report.
- Sample data tables & charts
- Research methodology
Fleet orders and older travelers are lifting demand
Domestic fleet investment adds capacity on three coasts
Domestic fleet investment is the clearest source of new supply, because inland itineraries depend on vessels that can transit shallow channels and locks. American Cruise Lines announced 10 new U.S.-built ships through 2028 on Oct. 27, 2025, with a new vessel arriving about every four months, adding to the 28 small ships it already runs. The plan is one of the most visible commitments in the domestic shipbuilding pipeline for small passenger vessels. American Encore carries 180 guests on the Columbia and Snake Rivers from May 2026, while each Patriot Class ship carries 130 guests on East Coast routes. As a result, Small Expedition Ships and Purpose-Built River Ships both gain deployable berths during the early forecast years.
Older travelers keep trips high on their spending lists
Older-traveler spending priorities support premium fares, since most inland voyages are sold to retirees with flexible calendars. The U.S. Census Bureau reported in June 2025 that the population age 65 and older rose 3.1% to 61.2 million in 2024, widening the core buyer base. AARP reported in March 2026 that adults 50 and older took an average of 4.2 trips in 2025 and that 86% rank travel as a top discretionary priority. The same study found older Americans spend more than USD 236 billion a year on leisure travel, which underpins demand for premium fares. In turn, Independent Couples remains the core buyer group, and more than half of 2026 trips were booked or planned by the end of 2025, which favors operators that open departures early.
Great Lakes operators return with larger programs
The Great Lakes operator return is widening the map beyond rivers, and the region now offers a different product to repeat guests. Cruise the Great Lakes forecast more than 23,000 passengers in 2026, up 5%, on 10 ships from seven lines, and an economic impact above USD 300 million, about 25% above 2025. Victory Cruise Lines began service with Victory I on April 17, 2025, and scheduled 40 voyages for 2026, 34 of them covering all five lakes, according to Cruise Industry News. Pearl Seas Cruises opened its 2026 season on May 7 with the 210-passenger Pearl Mist, while American Cruise Lines entered with American Patriot. These programs give the region the fastest growth rate in the model, as well as a broader base of competing operators.
National brands are lengthening Mississippi itineraries
Longer Mississippi programs lift the average fare per guest and also spread demand across more river towns. Viking launched its Mississippi product in September 2022 and said on Feb. 18, 2026, that it would add a 15-day Bayous, Blues & Bluegrass route from New Orleans to Louisville for 2027. An eight-day Mississippi & Ohio River Explorer from Memphis to Louisville joins it, beside the existing 22-day Mississippi River Odyssey. River Cruise Advisor lists 2026 fares of about USD 4,300 to USD 6,500 for seven nights on the Lower Mississippi and USD 15,000 or more for the full 22-day transit. Because these voyages hold guests for longer, Heritage River Voyages retains 52.0% of 2025 value in the model.
Park packages and longer voyages are reshaping itineraries
Shift toward national park cruise and land packages
Operators are shifting from cruise-only fares toward packages that join a voyage with guided time in national parks. American Cruise Lines lists a 16-day Alaska National Parks program with a nine-day cruise and a 19-day version with a 12-day cruise, each adding seven days around Denali and Kenai Fjords, in its Dec. 1, 2025, release. It also launches a 15-day Northwest National Parks voyage from Tacoma in September 2026, and American Grace is planned around National Parks cruises from 2028. This format lifts revenue per guest because hotels, transfers and excursions sit inside a single inclusive fare. As a result, Alaska keeps a meaningful share of market value in the model despite its summer-only season.
Rise of multi-week domestic voyages
Multi-week voyages are emerging as a distinct product for retirees who have already completed the standard one-week routes. American Cruise Lines scheduled a 52-day Great United States Cruise from Portland to Boston and a 55-day Great American Fall Foliage voyage from Juneau to Washington, D.C., for 2026. It also added a 36-day Civil War Battlefields route between New Orleans and Gettysburg. Viking keeps its 22-day Mississippi River Odyssey on sale for demand at the top of the market, and Pearl Seas sells 15-night Canadian Maritimes and St. Lawrence Seaway sailings on Pearl Mist. This shift raises the value of each cabin sold, although it also ties up vessels for weeks, so operators must fill long departures early through past-guest lists and advisors.
Opening for operators on canals and connected lakes
Canals and connected lakes offer an opening because few vessels can pass their locks and few operators sell them. QuirkyCruise describes Ontario Waterway Cruises as a single 45-passenger vessel, the Kawartha Voyageur, sailing five-day routes through the 35-lock Rideau Canal and the Trent-Severn Waterway from mid-May to mid-October. QuirkyCruise put American guests at about 10% in a profile last updated in February 2022, which suggests untapped demand among U.S. retirees for these routes. Erie, Pennsylvania, is also set to join the Great Lakes cruise map in 2028, according to Great Lakes St. Lawrence Governors & Premiers. For operators with suitable boats, Canal and Connected-Lake Voyages at 11.47% a year offers a route to growth without competing head-on on the Mississippi.
Opportunity in family, solo and adults-only sailings
Party-specific departures present an opportunity to reach buyers who do not fit the traditional retired couple profile. AARP found in March 2026 that 57% of adults 50 and older travel to spend time with loved ones and that one in four trips includes three generations. UnCruise Adventures already sells family sailings in Alaska, along with a seven-night Adult Escape from Juneau through Glacier Bay to Sitka, which links small-ship voyages to adventure tourism buyers. American Cruise Lines has dropped single supplements on suites and singles on its new ships. Together these moves support Solo Travelers at 11.27% a year and give operators a way to fill shoulder-season cabins with younger parties.
Water levels, fares and operator exits test the market
Low water can close long stretches of the Mississippi
River levels remain the largest operating risk on the Mississippi, because a closed channel stops an entire itinerary. Seatrade Cruise reported in October 2022 that a 184-mile stretch from Tunica to Vicksburg closed to all traffic, forcing Viking to cancel a sailing and bus guests to Memphis. American Cruise Lines kept five riverboats on schedule with smaller, shallow-draft vessels. As a result, deeper ships carry greater disruption risk, and American Queen Voyages had to turn its ships at Memphis instead of New Orleans.
An operator exit left ports with stranded investment
Thin operator economics can damage ports as well as guests, as the failure of American Queen Voyages showed. MinnPost reported in February 2024 that the line closed after parent Hornblower Group filed for bankruptcy, with 500 layoffs. Memphis expected to lose 10,000 hotel room nights a year and scrapped a planned USD 35 million dock expansion. Because only two main Mississippi operators remained, cities now have less bargaining power and take on more risk when funding new landings.
High fares limit the pool of first-time buyers
Price is the main barrier to widening the buyer base, particularly among households outside the top income bands. AARP found in March 2026 that 39% of older travelers cite cost overall, rising to 49% among those earning under USD 100,000. River Cruise Advisor lists 2026 eight-day Columbia and Snake fares of USD 4,900 to USD 6,500, which limits demand beyond affluent retirees. Operators respond with promotions, including Viking offers of up to 35% off in February 2026, which narrows realized fare growth.
Lock dimensions and cabotage rules restrict vessel choice
Physical limits and cabotage rules narrow the vessels that can serve canal routes, which slows new entry into the smallest waterways. Maritime Executive reported in January 2018 that the Rideau Canal takes vessels only up to 110 feet long and 6.5 feet in draft. It also noted that Canadian cabotage rules hinder cruise operations on the Ottawa River. As a result, canal operators work with very small boats, so fixed costs fall on few guests and fares stay high.
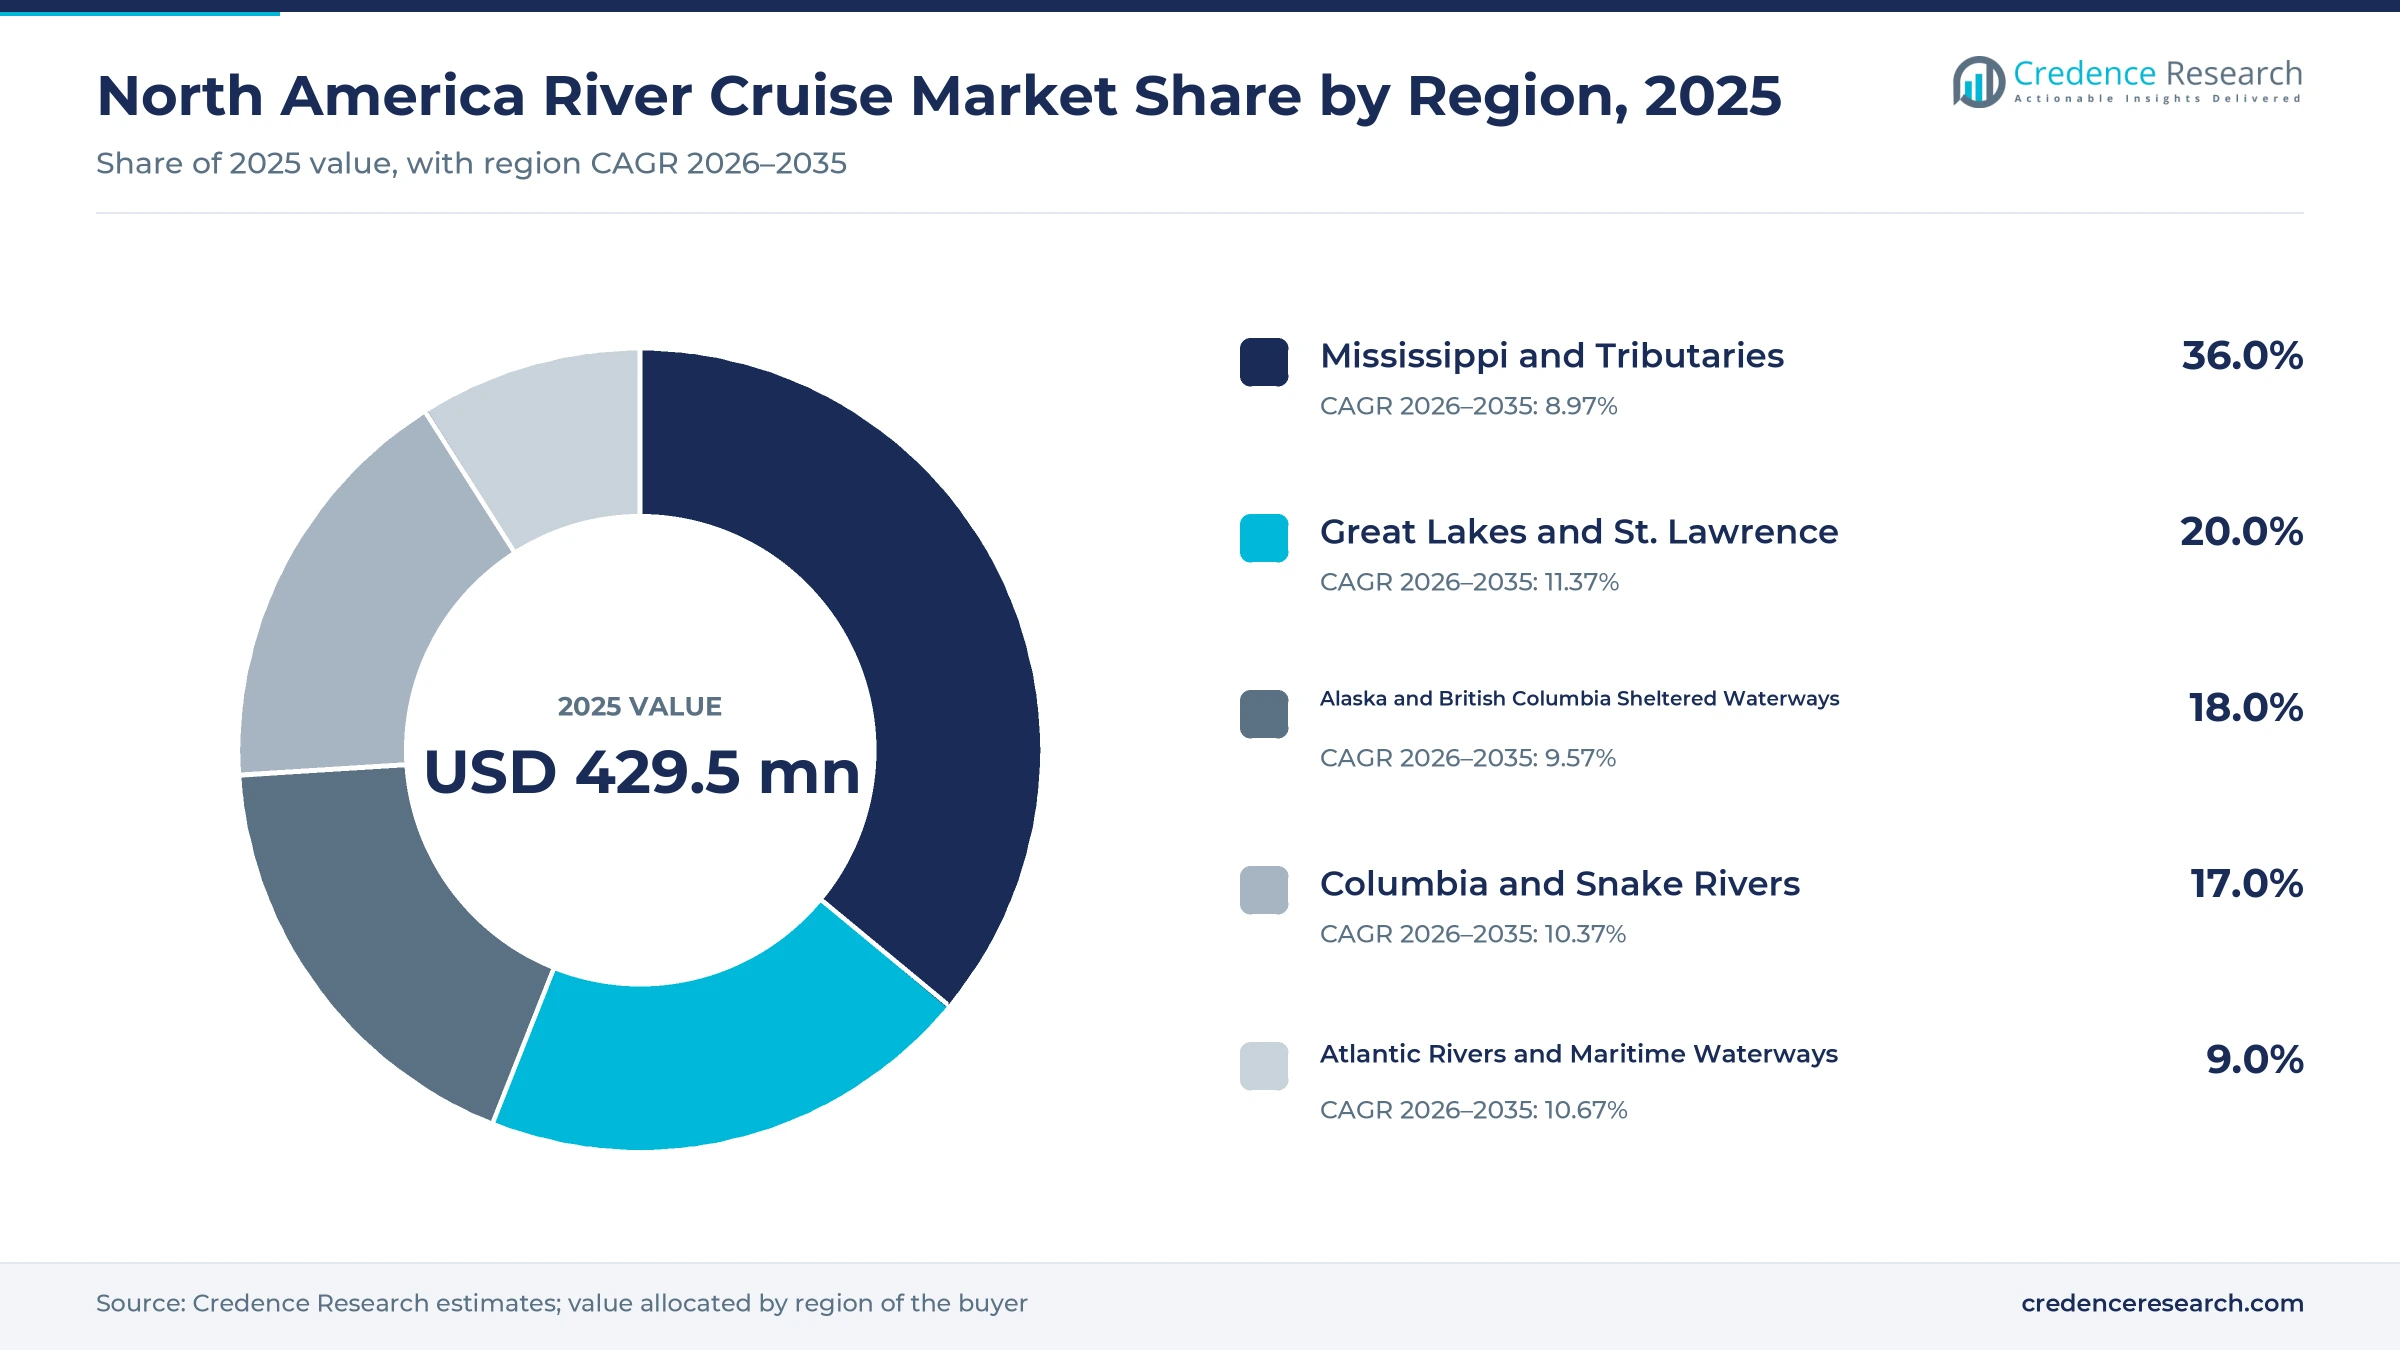
The Mississippi leads while the Great Lakes grow fastest
| Region | Value, 2025 (USD million) | Share, 2025 | CAGR, 2026–2035 |
|---|---|---|---|
| Mississippi and Tributaries | 141.7 | 33.0% | 8.84% |
| Great Lakes and St. Lawrence | 116.0 | 27.0% | 11.24% |
| Alaska and British Columbia Sheltered Waterways | 73.0 | 17.0% | 9.44% |
| Columbia and Snake Rivers | 55.8 | 13.0% | 10.24% |
| Atlantic Rivers and Maritime Waterways | 43.0 | 10.0% | 10.54% |
Mississippi and tributaries hold the largest share of value
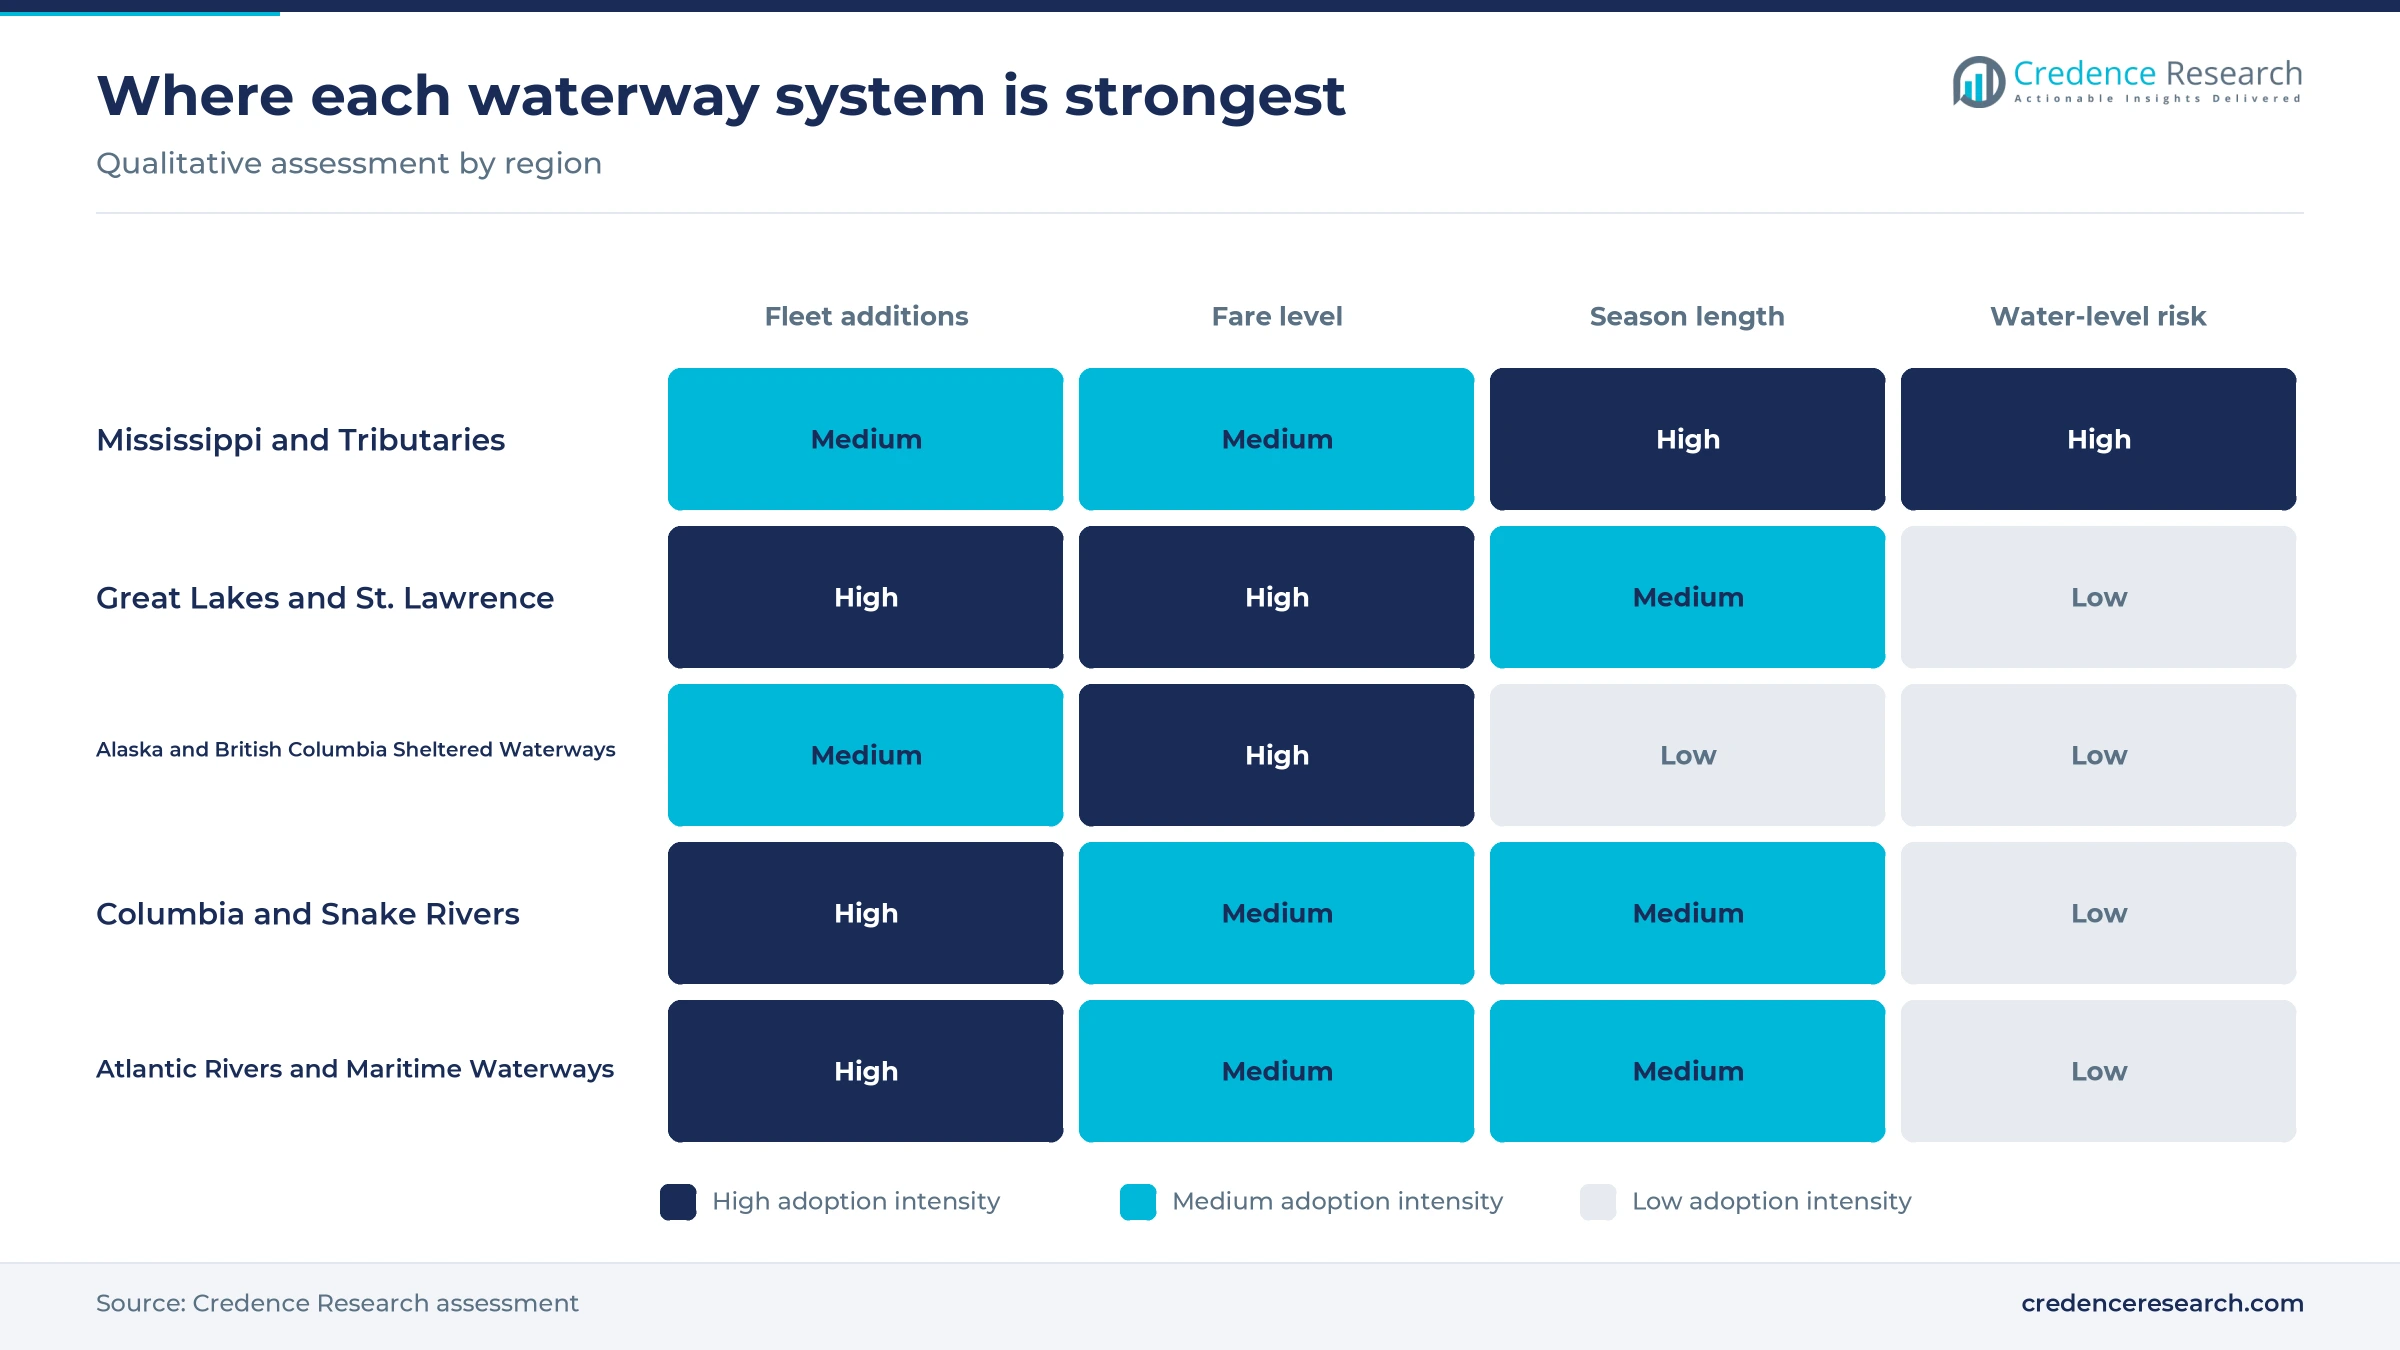
Mississippi and Tributaries held 33.0% of 2025 value and grows at 8.84% a year, the slowest rate because new orders are going elsewhere. Viking Mississippi and American Cruise Lines riverboats dominate after the 2024 exit of American Queen Voyages, and Memphis earlier estimated an annual cruise impact of USD 100 million, according to MinnPost. American Cruise Lines also added a nine-day Arkansas River route from Memphis to Tulsa for 2026, which extends the system into tributaries.
Great Lakes and St. Lawrence gain the most new operators
Great Lakes and St. Lawrence held 27.0% of 2025 value and grows fastest at 11.24% a year. Cruise the Great Lakes projected nearly 175,000 passenger visits in 2026 on ships including Pearl Mist, Viking Octantis and Polaris, Canadian Empress and Victory 1 and 2. American Cruise Lines added a 14-day American Great Lakes route covering about 800 miles between Buffalo and Milwaukee. With Ponant and Hapag-Lloyd also scheduled, this is the most international waterway system in the market.
Alaska and British Columbia reward small expedition ships
Alaska and British Columbia Sheltered Waterways held 17.0% of 2025 value and grows at 9.44% a year. Small ships serve Inside Passage and Glacier Bay routes, and Lindblad Expeditions chartered the 160-guest Greg Mortimer for three summers from 2027, adding about 30 berths. Juneau also approved daily visitor caps of 16,000, and 12,000 on Saturdays, from 2026, according to Travel Market Report in June 2024, which restrains large-ship port days.
Columbia and Snake Rivers gain a new class of riverboat
Columbia and Snake Rivers held 13.0% of 2025 value and grows at 10.24% a year as capacity arrives. American Cruise Lines has planned American Encore, American Anthem and American Grace for these rivers through 2028. River Cruise Advisor also lists UnCruise Adventures on the route, and Lindblad Expeditions makes farewell sailings there in 2026 according to Cruise Industry News, with balcony cabins on modern ships priced at USD 7,000 to USD 9,500 in 2026. Owner suites above USD 12,000 put the top tier in competition with luxury travel products.
Atlantic rivers and Maritime Waterways start from a small base
Atlantic Rivers and Maritime Waterways held 10.0% of 2025 value and grows at 10.54% a year as new ships open East Coast programs. American Maverick starts in June 2026 and American Ranger in September 2026, with two more Patriot Class ships following in 2027. American Cruise Lines also sells a 32-day historical voyage from Albany to Washington, D.C. Pearl Seas plans an eight-night Prince Edward Island and Maine Coast route beginning in 2028.
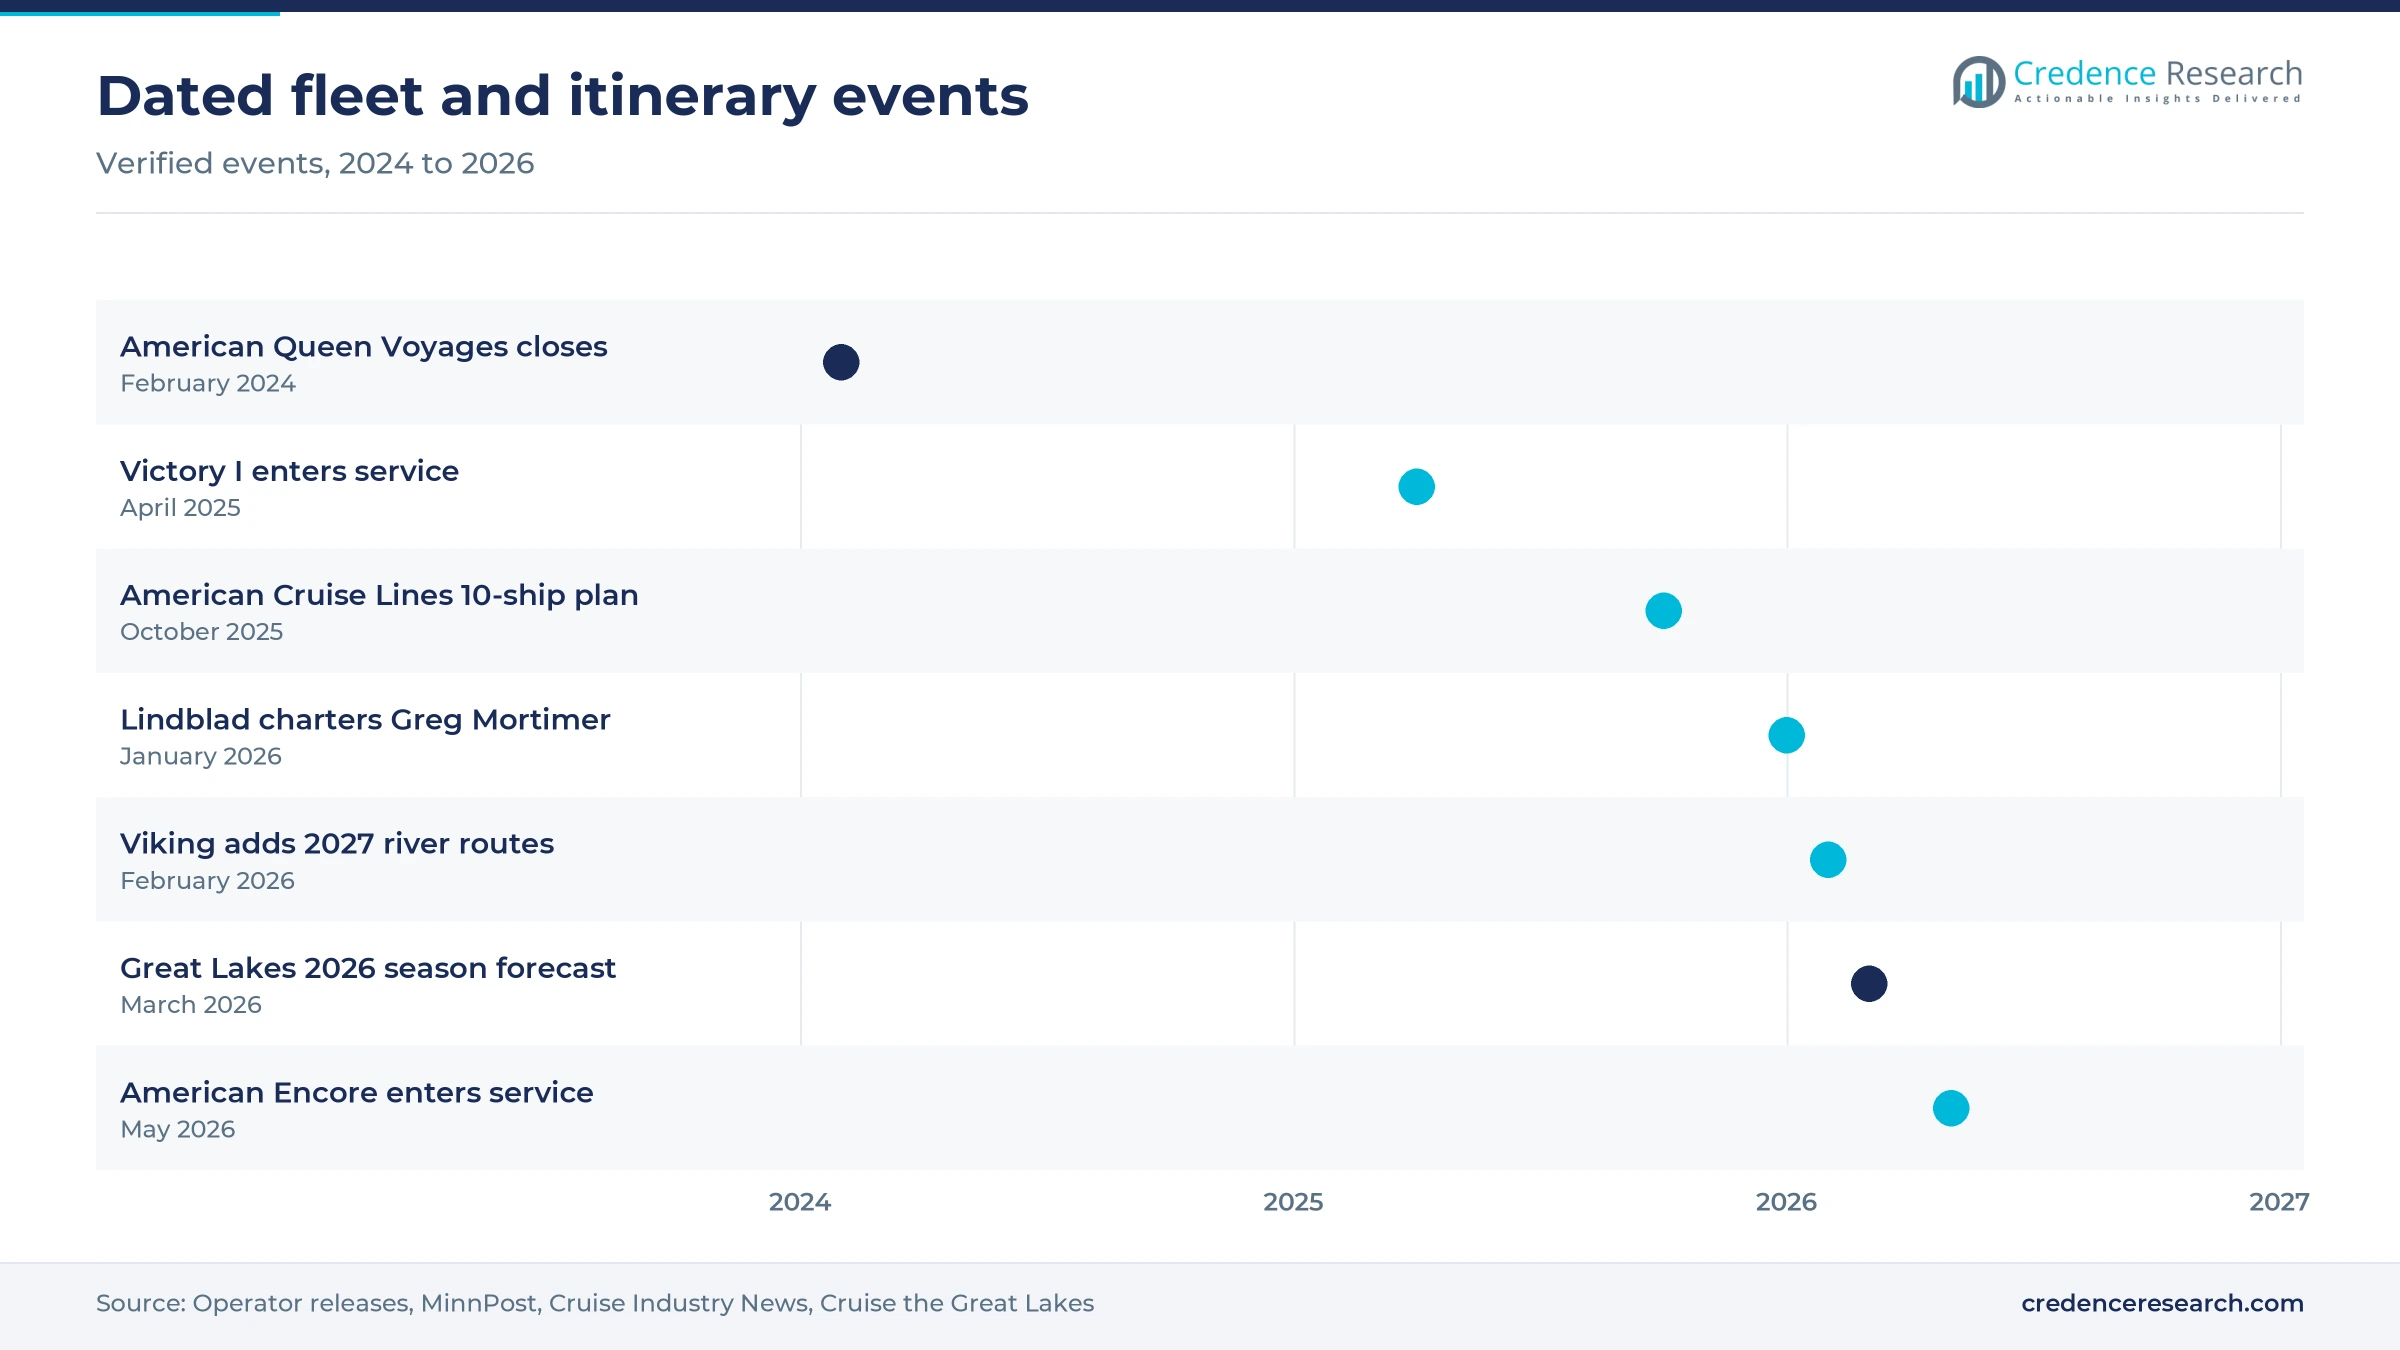
Dated fleet and itinerary moves from 2024 through 2026
| Development | Status and market relevance |
|---|---|
| In February 2024, American Queen Voyages ceased operations after parent Hornblower Group filed for bankruptcy. | Left Viking and American Cruise Lines as the main Mississippi operators |
| In April 2025, Victory Cruise Lines began its inaugural Great Lakes season with Victory I sailing from Portland to Toronto. | Scheduled 40 voyages for 2026 |
| In October 2025, American Cruise Lines announced 10 new U.S.-built ships through 2028. | American Encore, American Maverick and American Ranger scheduled for 2026 |
| In January 2026, Lindblad Expeditions chartered the Greg Mortimer for three Alaska summers starting in 2027. | Replaces two retiring 62-passenger ships |
| In February 2026, Viking announced 15-day and eight-day Mississippi and Ohio River itineraries for 2027. | Open for booking |
Shallow drafts and new hull designs extend the routes
- Shallow-draft riverboats allowed American Cruise Lines to keep five Mississippi vessels on schedule during the October 2022 low-water closures, according to Seatrade Cruise.
- X-Bow hull forms appear on the Greg Mortimer, and Cruise Industry News says the design improves efficiency and stability for Alaska and polar service.
- Patriot Class coastal ships carry 130 guests and let American Cruise Lines run East Coast programs that join rivers and sheltered coastal waters.
- Starlink connectivity is included in American Cruise Lines fares under its Dec. 1, 2025, release, alongside tips and port charges.
Need a Custom Version of This Report?
Tailor the scope, geography, or segments to your exact requirements.
- Custom geography or segment scope
- Direct access to our analyst team
American Cruise Lines sets the pace on domestic capacity
American Cruise Lines holds the broadest domestic position, with 28 small ships, more than 50 itineraries and 10 ships on order through 2028, which lets it appear on almost every waterway in this report. Viking competes through a single large ship on the Mississippi and two expedition ships on the Great Lakes, and it names American Cruise Lines as its Mississippi competitor in its annual filing. Lindblad Expeditions and UnCruise Adventures concentrate on nature-led sailings in Alaska, with UnCruise also on the Columbia and Snake Rivers and Lindblad there on farewell sailings in 2026, and naturalist staff and shore activity matter more than vessel size on those routes. Pearl Seas Cruises focuses on Pearl Mist, a 210-passenger ship working the Great Lakes, the St. Lawrence and the Canadian Maritimes. Competition therefore turns on route access, inclusive fare design and repeat guests rather than on headline price alone, and ecotourism lodges compete for the same Alaska buyers.
Companies profiled and their roles in this market
| Company | Type | Role in the market |
|---|---|---|
| American Cruise Lines | Domestic operator | Runs riverboats and Patriot Class ships on the Mississippi, Columbia, Snake, Alaska, Great Lakes and East Coast routes |
| Viking | River and expedition operator | Sells the 386-guest Viking Mississippi and runs Octantis and Polaris on the Great Lakes |
| Lindblad Expeditions | Expedition operator | Serves Alaska, with the Columbia and Snake Rivers on farewell sailings of National Geographic Sea Lion and Sea Bird in 2026, and charters Greg Mortimer from 2027 |
| UnCruise Adventures | Small-ship operator | Runs vessels of 22 to 88 guests in Alaska, with Wilderness Legacy on the Columbia and Snake Rivers |
| Pearl Seas Cruises | Small-ship operator | Runs the 210-passenger Pearl Mist on the Great Lakes, St. Lawrence and Canadian Maritimes |
Capacity is arriving faster than the buyer base expands
Credence Research's view is that the market's main risk has moved from finding demand to filling new ships at current fares. American Cruise Lines alone plans a vessel about every four months, and older Americans also told AARP that they expect fewer trips in 2026 than the 4.2 they took in 2025. Operators with past-guest lists should absorb that capacity first, while newer entrants may need to discount. The Great Lakes region looks attractive, although 10 ships from seven lines already compete for about 23,000 passengers there. Buyers should watch realized fares more closely than announced berth counts.
How Credence Research built the estimates
The report uses 2025 as the base year and 2026 to 2035 as the forecast period. Market values come from the Credence Research model and were checked against a bottom-up estimate of published vessel capacity, sailing programs and fares. Regional and segment splits are Credence Research estimates drawn from those same inputs. Sources used are operator press releases, a U.S. securities filing, U.S. Census Bureau population estimates, AARP research, the Cruise the Great Lakes season forecast and named trade publications. No interviews or surveys were conducted for this report, and vessel utilization remains the most assumption-heavy input in the estimates.
New waterways should carry growth through 2035
Through 2035, growth should come less from the Mississippi and more from waterways that were thinly served before 2025. The market is forecast to reach USD 1.13 billion as American Cruise Lines completes its order book through 2028 and Great Lakes programs mature, with that region expanding fastest. The U.S. population age 65 and older should remain a dependable source of guests, although fare discipline will be tested as berths arrive. Operators that hold shallow-draft vessels and strong past-guest lists are best placed, and low-water seasons remain the main risk to individual years.
Frequently Asked Questions
How big is the North America river cruise market?
Which region leads the North America river cruise market?
Which region grows fastest?
Which service type is the largest?
What is driving fleet growth in the market?
Who buys North America river cruises?
What are the main risks for operators?
Which companies operate in this market?
Table of Content
Chapter 1 Market Segmentation
- 1.1 Segmentation Framework
- 1.1.1 Product and Service Classification
- 1.1.2 Application and End-Use Classification
- 1.1.3 Technology and Solution Classification
- 1.1.4 Customer and Distribution Channel Classification
- 1.1.5 Geographic Segmentation
- 1.1.6 Market Segment Definitions and Boundaries
- 1.2 By Service Type
- 1.2.1 Heritage River Voyages
- 1.2.2 Nature Expedition Voyages
- 1.2.3 Canal and Connected-Lake Voyages
- 1.3 By Vessel Type
- 1.3.1 Purpose-Built River Ships
- 1.3.2 Small Expedition Ships
- 1.3.3 Paddlewheel Riverboats
- 1.3.4 Canal Cruise Boats
- 1.4 By Customer Type
- 1.4.1 Independent Couples
- 1.4.2 Affinity Groups
- 1.4.3 Families and Multigenerational Parties
- 1.4.4 Solo Travelers
- 1.5 By Booking Channel
- 1.5.1 Operator Direct Booking
- 1.5.2 Specialist Travel Advisors
- 1.5.3 Online Cruise Agencies
Chapter 2 Introduction
- 2.1 Report Objectives and Scope
- 2.2 Product Definition and Industry Terminology
- 2.3 Market Inclusions and Exclusions
- 2.4 Research Process
- 2.4.1 Primary Research and Expert Interviews
- 2.4.2 Secondary Research and Source Review
- 2.4.3 Top-Down and Bottom-Up Estimation
- 2.4.4 Data Triangulation and Verification
- 2.5 Market Size Measurement Basis
- 2.5.1 2025: USD 429.5 million → 2035: USD 1.13 billion
- 2.6 Historical and Forecast Reference Periods
- 2.6.1 Historical Period: 2018-2025
- 2.6.2 Base Year: 2025
- 2.6.3 Forecast Period: 2025-2035
- 2.7 Research Assumptions and Limitations
Chapter 3 Executive Summary
- 3.1 Market Snapshot and Key Findings
- 3.2 Base-Year Market Size, 2025
- 3.3 Forecast Market Size, 2035
- 3.4 Revenue and Volume Growth Outlook
- 3.5 Key Demand and Supply Indicators
- 3.6 Leading Market Segments
- 3.7 Fastest-Growing Market Opportunities
- 3.8 Regional Performance Highlights
- 3.9 Technology and Industry Transformation
- 3.10 Competitive Landscape Summary
- 3.11 Analyst View and Strategic Implications
Chapter 4 North America River Cruise Market Trends and Developments
- 4.1 Historical Industry Development, 2018-2025
- 4.2 Recent Market Trends and Developments
- 4.3 Demand and Customer Behavior Trends
- 4.4 Technology and Product Innovation
- 4.5 Artificial Intelligence, Automation and Digitalization
- 4.6 Local Manufacturing and Supply Chain Realignment
- 4.7 Industry Partnerships, Mergers and Acquisitions
- 4.8 Sustainability and Circular Economy Developments
- 4.9 Government and Private Sector Investment Trends
- 4.10 Emerging Business Models and Commercialization
- 4.11 Industry Developments and Announcements
Chapter 5 North America River Cruise Market Supply and Demand Analysis
- 5.1 Demand Trend and Consumption Analysis, 2018-2025
- 5.2 Demand Forecast, 2025-2035
- 5.3 Supply Chain Structure and Procurement Trends
- 5.4 Supply-Demand Gap and Bottlenecks
- 5.5 Import Dependence and Sourcing Structure
- 5.6 Regional Supply and Demand Concentration
Chapter 6 North America River Cruise Market Pricing Analysis
- 6.1 Pricing Structure and Measurement
- 6.2 Historical Pricing Trends, 2018-2025
- 6.3 Pricing Outlook, 2025-2035
- 6.4 Pricing by Product and Market Segment
- 6.5 Geographic Pricing Differences
- 6.6 Key Input, Energy, Labor and Logistics Costs
- 6.7 Contract Pricing and Purchasing Models
- 6.8 Pricing Sensitivity and Competitive Positioning
- 6.9 Price, Margin and Profitability Implications
Chapter 7 North America River Cruise Market Dynamics
- 7.1 Market Growth Drivers
- 7.1.1 Demand-Side Drivers
- 7.1.2 Technology and Innovation Drivers
- 7.1.3 Infrastructure and Investment Drivers
- 7.1.4 Regulatory and Policy Drivers
- 7.2 Market Restraints
- 7.2.1 Cost and Affordability Constraints
- 7.2.2 Technology and Adoption Barriers
- 7.2.3 Supply Chain and Operational Constraints
- 7.3 Market Challenges
- 7.3.1 Competitive Pressure and Margin Erosion
- 7.3.2 Skills, Infrastructure and Implementation Gaps
- 7.4 Emerging Market Opportunities
- 7.5 Market Dynamics Impact and Time-Horizon Assessment
Chapter 8 North America River Cruise Value Chain Analysis
- 8.1 Industry Value Chain Overview
- 8.2 Upstream Suppliers and Critical Inputs
- 8.3 Technology and Component Providers
- 8.4 Manufacturing or Service Delivery
- 8.5 Distribution, Channel Partners and Integrators
- 8.6 Downstream Applications and End Users
- 8.7 Value Addition and Profit Pools
- 8.8 Vertical Integration and Outsourcing
- 8.9 Supplier Concentration and Risk
- 8.10 Supply Chain Localization and Resilience
Chapter 9 North America River Cruise Market Regulations and Policies
- 9.1 Relevant Laws, Standards and Compliance Frameworks
- 9.2 Product, Service, Safety and Quality Requirements
- 9.3 Government Policies, Incentives and Subsidies
- 9.4 Imports, Exports and Trade Barriers
- 9.5 Public Procurement and Local Content Requirements
- 9.6 Data Protection, AI and Cybersecurity Compliance
- 9.7 Upcoming Policy Changes and Market Implications
Chapter 10 North America River Cruise Market Hotspots and Opportunities
- 10.1 Market Opportunity Mapping and Growth Hotspots
- 10.2 High-Growth Applications and Customer Groups
- 10.3 Underserved Markets and White-Space Opportunities
- 10.4 Emerging Technology and Product Opportunities
- 10.5 New Capacity and Investment Hotspots
- 10.6 Market Entry and Expansion Opportunities
- 10.7 Distribution and Partnership Opportunities
- 10.8 Near-Term and Long-Term Commercial Potential
- 10.9 Opportunity Attractiveness and Execution Risks
Chapter 11 North America River Cruise Market Outlook, 2025-2035
- 11.1 Market Size and Analysis
- 11.1.1 Revenue (Market Measurement: 2025: USD 429.5 million → 2035: USD 1.13 billion)
- 11.1.2 Historical Market Size, 2018-2025
- 11.1.3 Base-Year Market Size, 2025
- 11.2 Market Forecast, 2025-2035
- 11.2.1 Revenue Forecast to 2035
- 11.2.2 CAGR and Year-on-Year Growth
- 11.2.3 Incremental Revenue Opportunity
- 11.3 Forecast Assumptions and Scenario Analysis
- 11.3.1 Base-Case Forecast
- 11.3.2 Optimistic and Conservative Scenarios
- 11.3.3 Technology, Pricing and Policy Sensitivities
- 11.4 Market Attractiveness and Growth Outlook
Chapter 12 North America River Cruise Market Segmentation and Outlook
- 12.1 Segmentation Summary and Market Shares, 2025
- 12.2 Largest and Fastest-Growing Segments
- 12.3 By Service Type - Market Size and Forecast, 2025-2035
- 12.3.1 Segment Definition and Scope
- 12.3.2 Historical Market Size, 2018-2025
- 12.3.3 Revenue Forecast, 2025-2035
- 12.3.4 Base-Year Market Share, 2025
- 12.3.5 Segment CAGR and Growth Drivers
- 12.3.6 Subsegment Market Size and Forecast
- 12.3.6.1 Heritage River Voyages
- 12.3.6.2 Nature Expedition Voyages
- 12.3.6.3 Canal and Connected-Lake Voyages
- 12.3.7 Subsegment Pricing and Adoption Trends
- 12.3.8 Leading Suppliers and Competition
- 12.3.9 Regional Demand and Opportunities
- 12.4 By Vessel Type - Market Size and Forecast, 2025-2035
- 12.4.1 Segment Definition and Scope
- 12.4.2 Historical Market Size, 2018-2025
- 12.4.3 Revenue Forecast, 2025-2035
- 12.4.4 Base-Year Market Share, 2025
- 12.4.5 Segment CAGR and Growth Drivers
- 12.4.6 Subsegment Market Size and Forecast
- 12.4.6.1 Purpose-Built River Ships
- 12.4.6.2 Small Expedition Ships
- 12.4.6.3 Paddlewheel Riverboats
- 12.4.6.4 Canal Cruise Boats
- 12.4.7 Subsegment Pricing and Adoption Trends
- 12.4.8 Leading Suppliers and Competition
- 12.4.9 Regional Demand and Opportunities
- 12.5 By Customer Type - Market Size and Forecast, 2025-2035
- 12.5.1 Segment Definition and Scope
- 12.5.2 Historical Market Size, 2018-2025
- 12.5.3 Revenue Forecast, 2025-2035
- 12.5.4 Base-Year Market Share, 2025
- 12.5.5 Segment CAGR and Growth Drivers
- 12.5.6 Subsegment Market Size and Forecast
- 12.5.6.1 Independent Couples
- 12.5.6.2 Affinity Groups
- 12.5.6.3 Families and Multigenerational Parties
- 12.5.6.4 Solo Travelers
- 12.5.7 Subsegment Pricing and Adoption Trends
- 12.5.8 Leading Suppliers and Competition
- 12.5.9 Regional Demand and Opportunities
- 12.6 By Booking Channel - Market Size and Forecast, 2025-2035
- 12.6.1 Segment Definition and Scope
- 12.6.2 Historical Market Size, 2018-2025
- 12.6.3 Revenue Forecast, 2025-2035
- 12.6.4 Base-Year Market Share, 2025
- 12.6.5 Segment CAGR and Growth Drivers
- 12.6.6 Subsegment Market Size and Forecast
- 12.6.6.1 Operator Direct Booking
- 12.6.6.2 Specialist Travel Advisors
- 12.6.6.3 Online Cruise Agencies
- 12.6.7 Subsegment Pricing and Adoption Trends
- 12.6.8 Leading Suppliers and Competition
- 12.6.9 Regional Demand and Opportunities
- 12.7 Segment Growth Comparison
- 12.8 Segment Attractiveness and Priority Matrix
Chapter 13 North America River Cruise End-Use and Application Market Outlook
- 13.1 End-Use Industry and Customer Demand Structure
- 13.2 Leading Applications and Customer Groups
- 13.3 End-Use Market Size, Share and Forecast
- 13.4 Major End-Use Industry Deep Dives
- 13.4.1 Customer Requirements and Use Cases
- 13.4.2 Demand and Replacement Cycles
- 13.4.3 Technical and Regulatory Considerations
- 13.4.4 Purchasing and Procurement Models
- 13.4.5 Leading Vendors and Distribution Channels
- 13.4.6 Forecast and Commercial Opportunities
- 13.5 Emerging Applications and Cross-Segment Demand
- 13.6 End-Use Industry Investment Priorities
Chapter 14 North America River Cruise Geographic Market Outlook, 2025-2035
- 14.1 Regional Market Size and Country-Level Shares, 2025
- 14.2 Country Market Size Comparison, 2025
- 14.3 Country Market Forecasts, 2025-2035
- 14.4 Subregional Industrial and Demand Clusters
- 14.5 Intra-Regional Pricing and Cost Differences
- 14.6 Cross-Border Trade and Supply Networks
- 14.7 Regional Supply and Demand Balances
- 14.8 Country Opportunity Comparison and Prioritization
Note: Every listed country is covered on the structure shown under the first country.
Chapter 15 North America River Cruise Technology, Innovation and Sustainability Outlook
- 15.1 Technology Landscape and Maturity
- 15.2 Product, Process and Service Innovation
- 15.3 AI, Automation and Digital Tools in the Industry
- 15.4 Technology Adoption and Performance Benchmarking
- 15.5 Innovation Pipeline and R&D Investment
- 15.6 Energy Efficiency and Resource Management
- 15.7 Sustainability, Recycling and Circularity
- 15.8 Technology Roadmap, 2025-2035
- 15.9 Risks of Obsolescence and Technology Substitution
Chapter 16 North America River Cruise Market Key Strategic Imperatives
- 16.1 Growth and Market Entry Priorities
- 16.2 High-Return Products and Segments
- 16.3 Pricing, Profitability and Cost Optimization
- 16.4 Technology Investment and Product Differentiation
- 16.5 Supply Chain Localization and Resilience
- 16.6 Distribution and Customer Acquisition
- 16.7 Partnership, Acquisition and Capacity Strategy
- 16.8 Regional Expansion Priorities
- 16.9 Short-, Medium- and Long-Term Actions
Chapter 17 Competition Outlook
- 17.1 Industry Competition Characteristics
- 17.2 Market Structure and Concentration
- 17.3 Market Share and Competitive Positioning, 2025
- 17.4 Company-Wise Revenue and Product Benchmarking
- 17.5 Production and Service Capacity Benchmarking
- 17.6 Technology, Pricing and Differentiation
- 17.7 Regional Footprint and Distribution Strength
- 17.8 Mergers, Acquisitions and Strategic Alliances
- 17.9 New Entrants and Competitive Threats
- 17.10 Porter's Five Forces and Industry Attractiveness
- 17.11 Competitive Outlook, 2025-2035
Chapter 18 Company Profiles
- 18.1 Company Coverage and Selection Criteria
- 18.2 American Cruise Lines
- 18.2.1 Business Description
- 18.2.2 Company Ownership and Geographic Presence
- 18.2.3 Product and Service Portfolio
- 18.2.4 Manufacturing and Operating Footprint
- 18.2.5 Financial Performance and Investment
- 18.2.6 Market Share and Competitive Position
- 18.2.7 Technology and Innovation Capabilities
- 18.2.8 Strategic Alliances or Partnerships
- 18.2.9 Recent Developments
- 18.2.10 Growth Strategy and Outlook
- 18.3 Viking
- 18.4 Lindblad Expeditions
- 18.5 UnCruise Adventures
- 18.6 Pearl Seas Cruises
- 18.7 Other Relevant Market Participants
Note: Every listed company is profiled on the structure shown under the first company. The company list is preliminary and may change based on research findings, market developments, data availability and client requirements.
Chapter 19 Disclaimer
- 19.1 Research and Forecast Disclaimer
- 19.2 Data Source and Estimation Limitations
Note: The depth of individual sections depends on data availability for this market. Volume, capacity, trade and other unit-based metrics are included where applicable.

