
Courses, simulators and new players widen golf spending
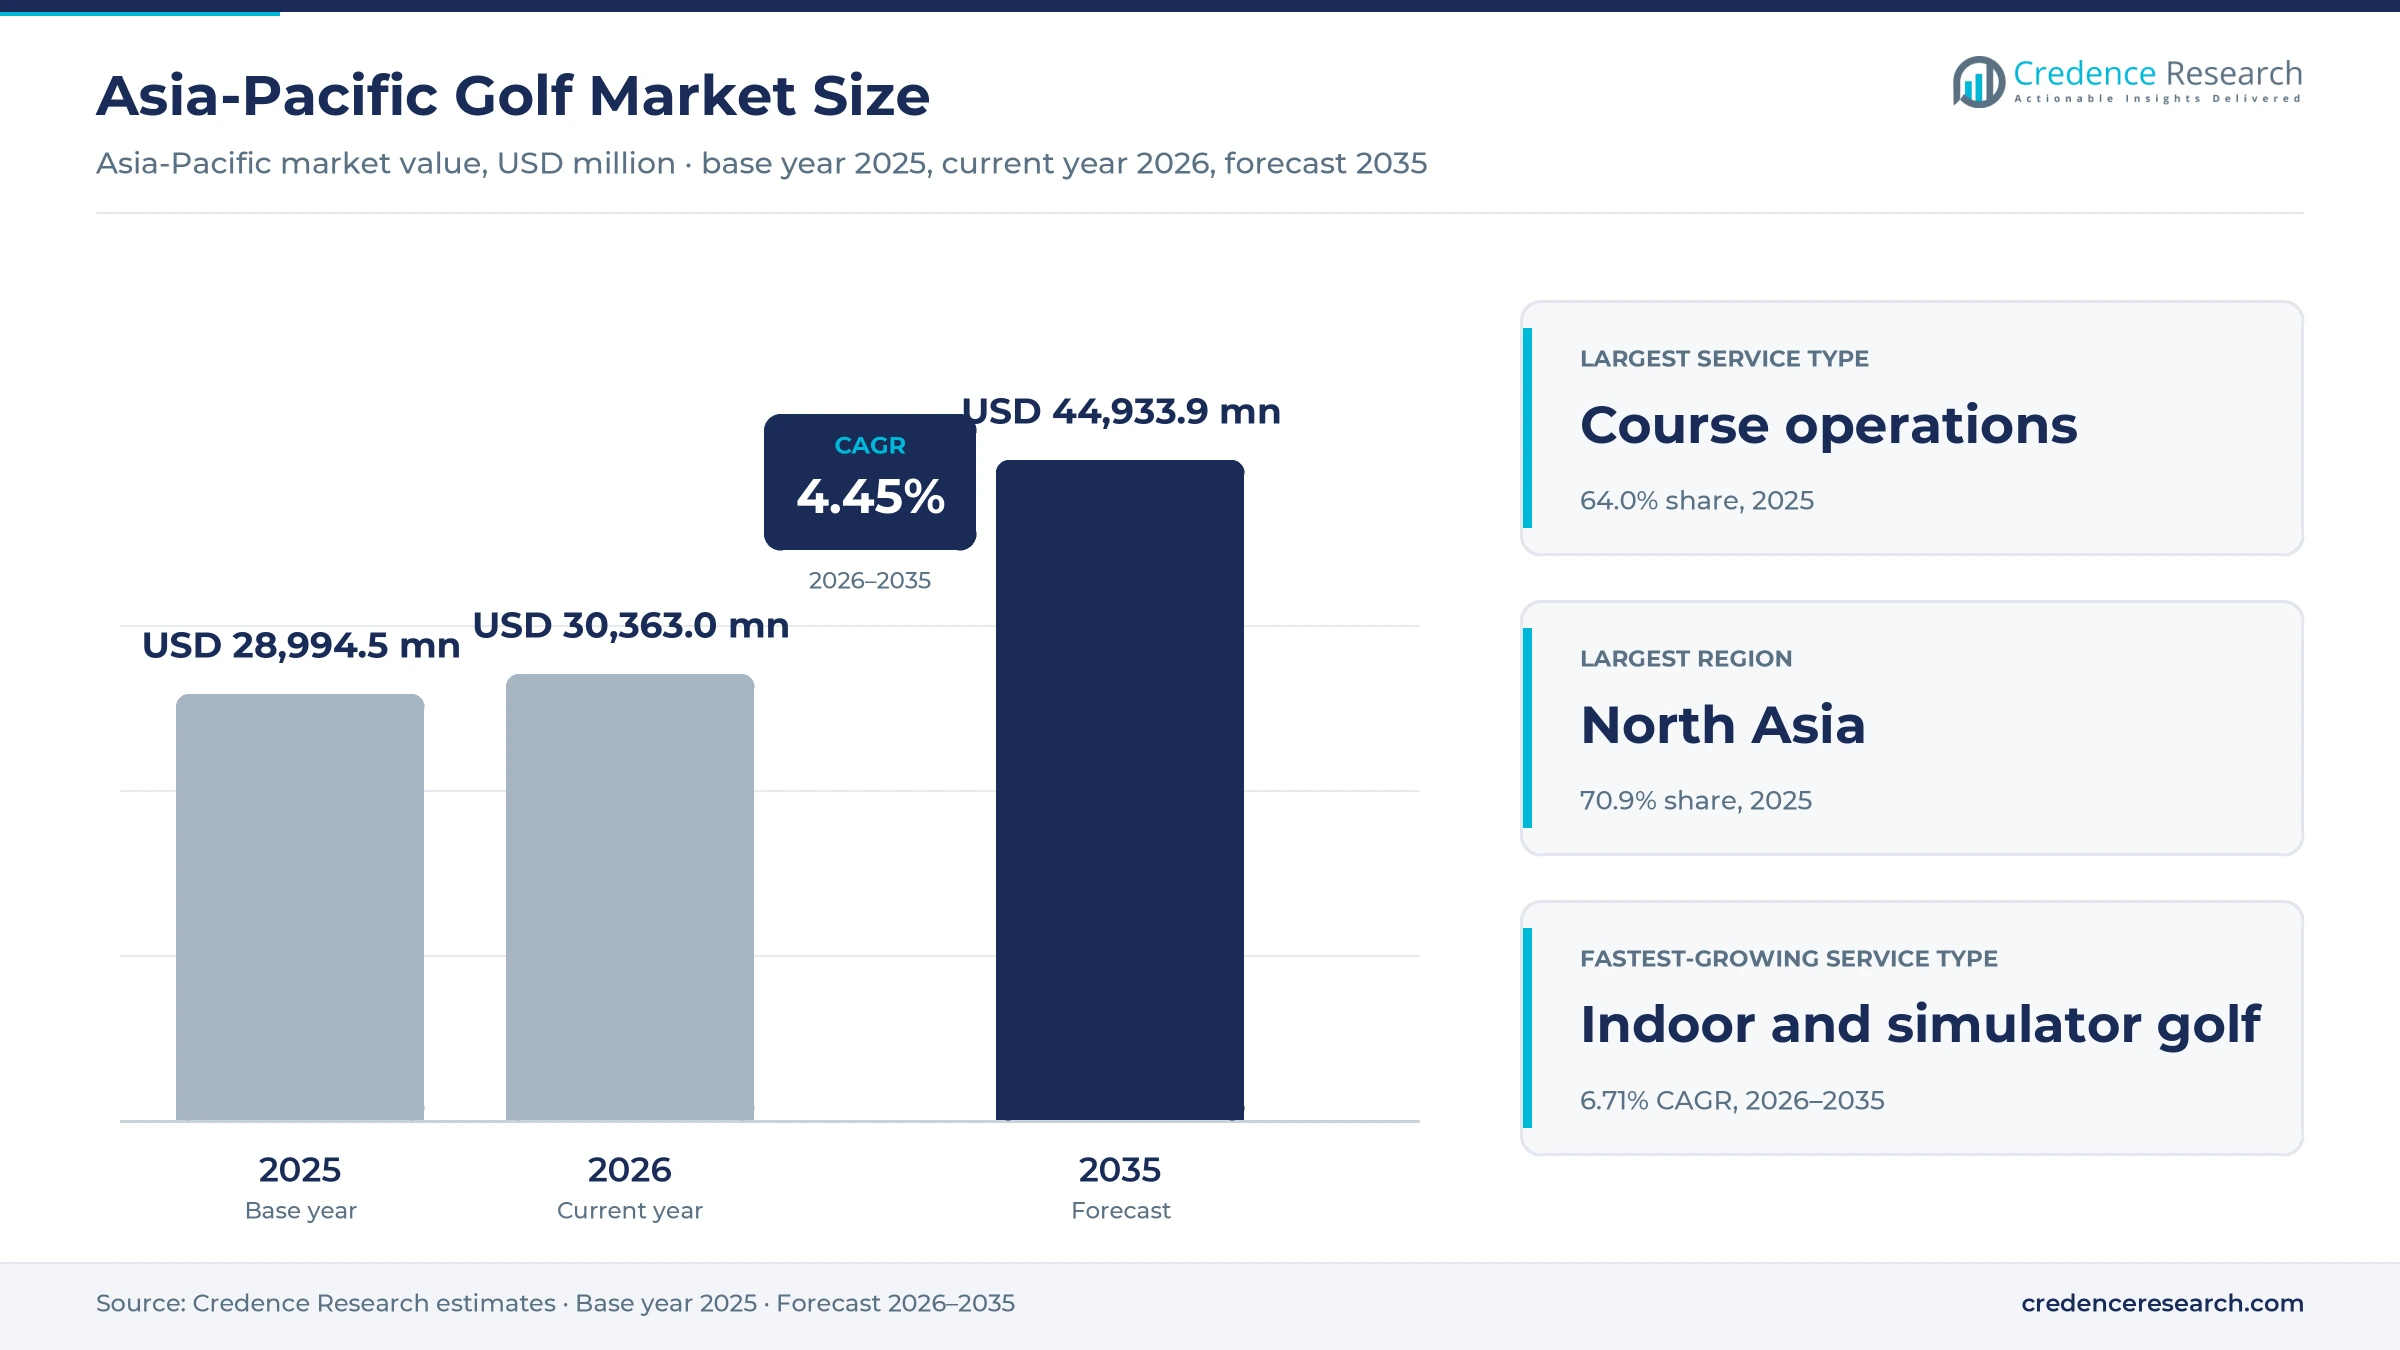
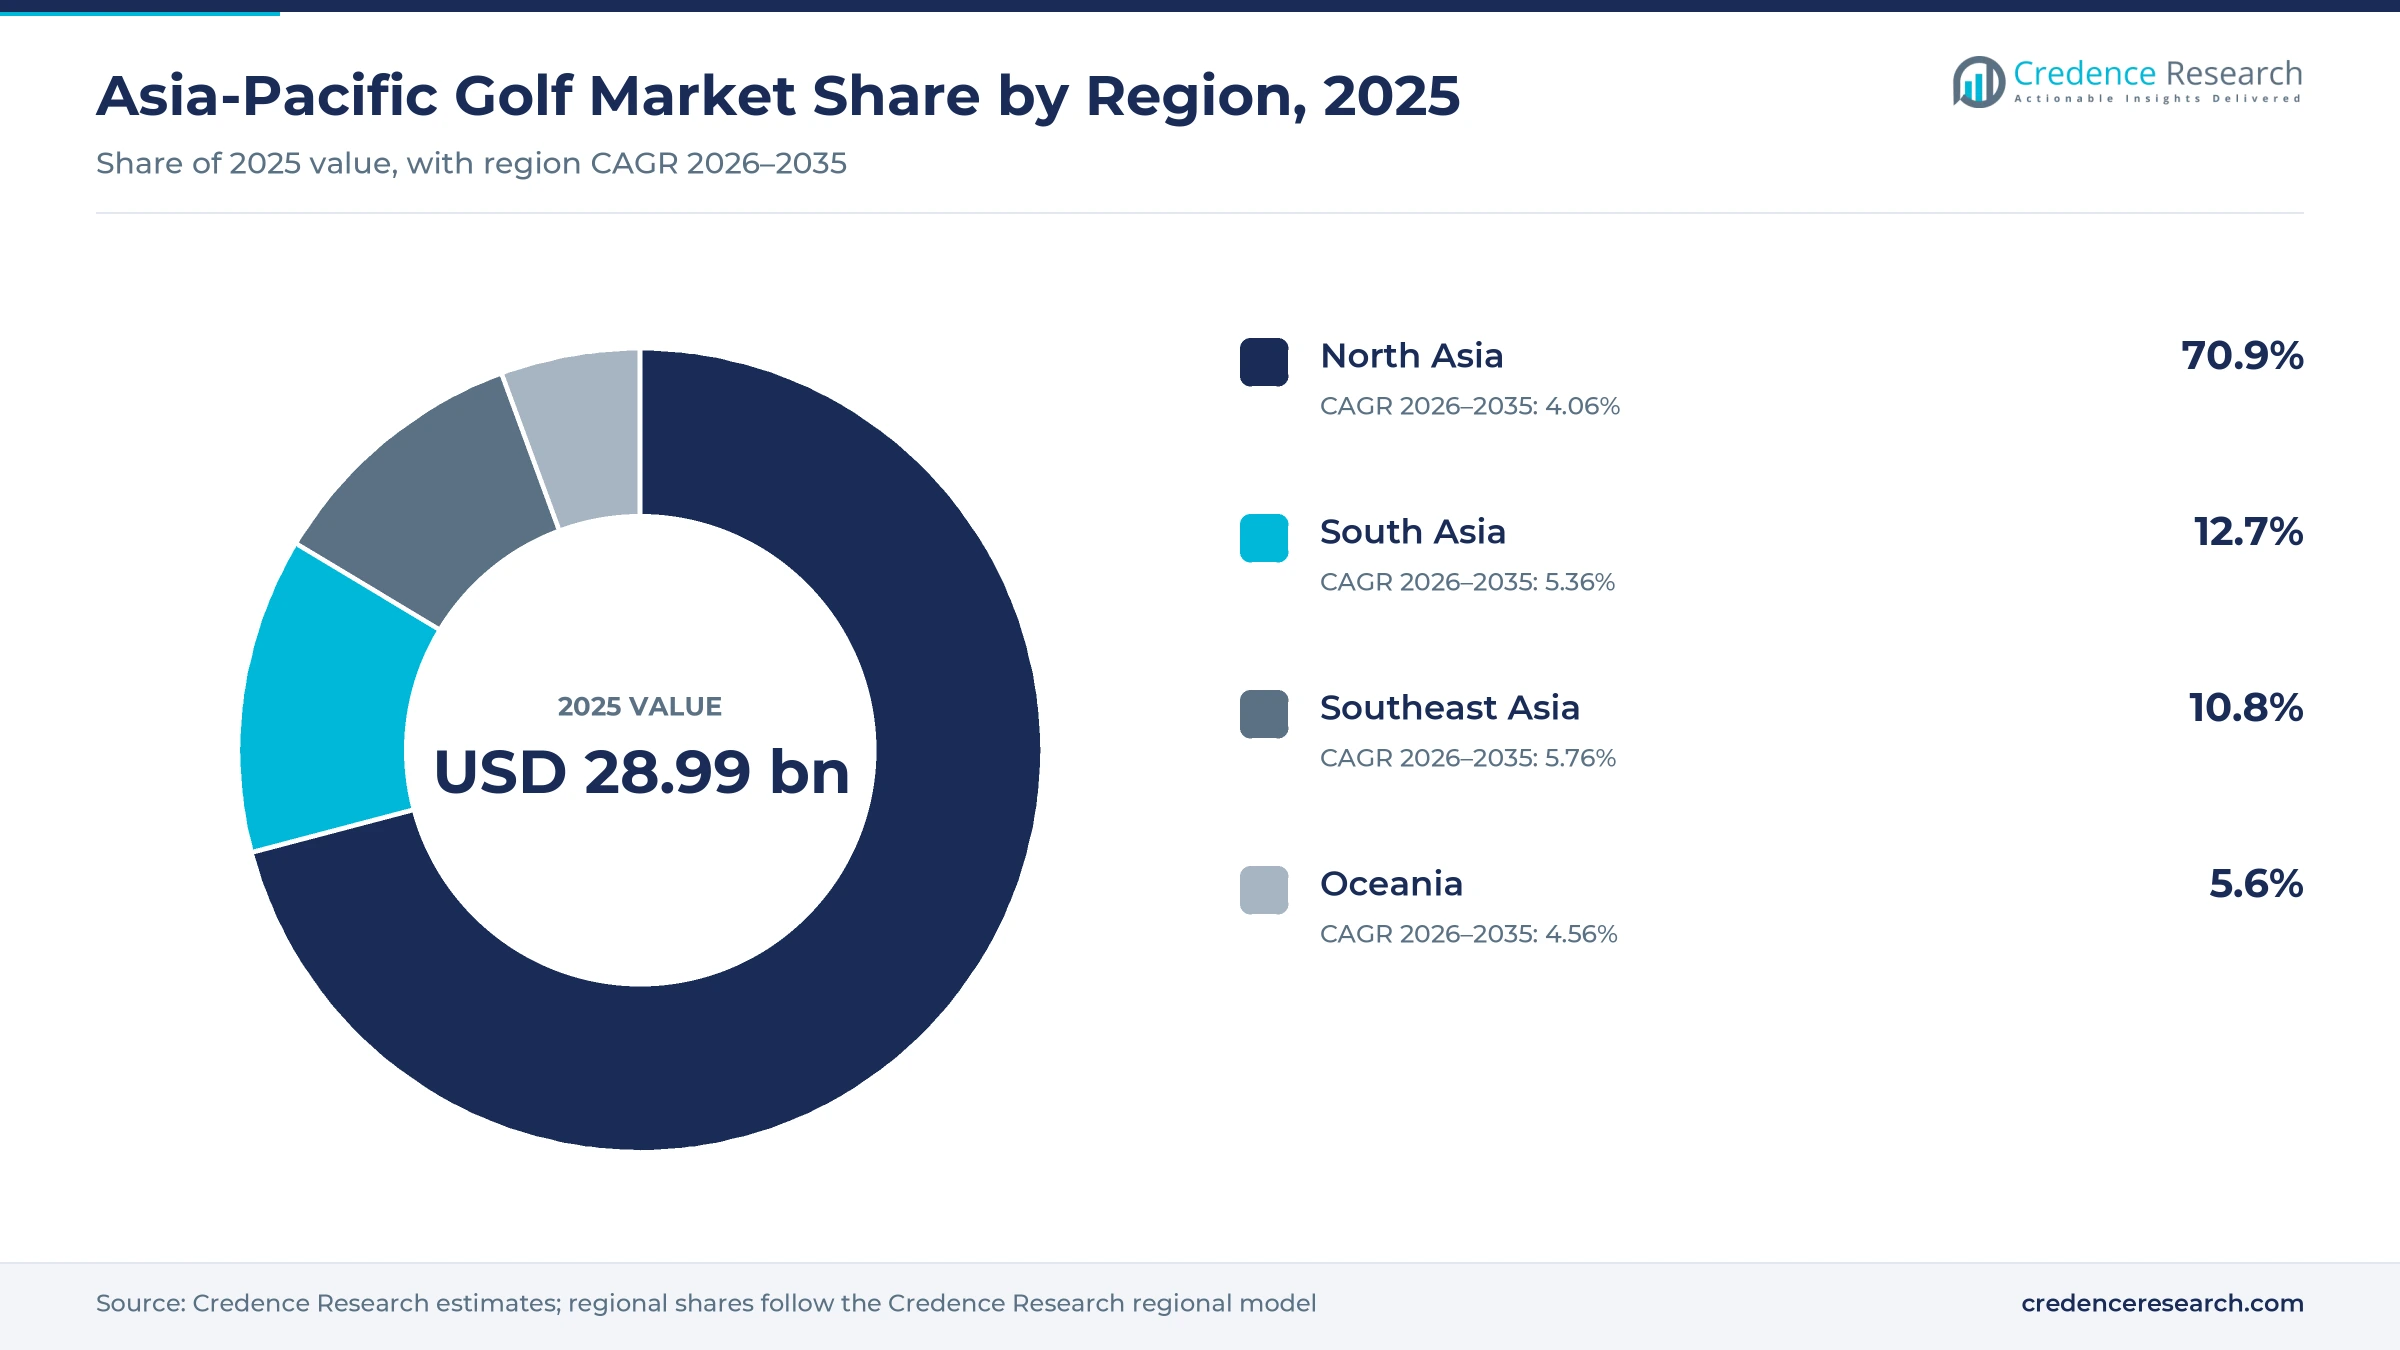
The Asia-Pacific golf market was valued at USD 28.99 billion in 2025 and is projected to increase from USD 30.36 billion in 2026 to USD 44.93 billion by 2035, registering a CAGR of 4.45% during 2026–2035. Spending comes from green fees and memberships, driving ranges, screen golf rooms, golf travel and the equipment that players replace as they improve. North Asia held the largest regional share, 70.9% in 2025, because Japan, South Korea and China combine thousands of courses with a deep base of regular players. Southeast Asia is the fastest-growing region at 5.76% a year, as Vietnam and Thailand build courses and court foreign golfers. In turn, simulator venues and flexible memberships are drawing younger and newer players who once found the game too costly or slow.
Which golf services, players and channels does the estimate cover?
The estimate measures spending on course operations and memberships, practice and driving range services, indoor and simulator golf, and golf tourism and event services across North Asia, Oceania, Southeast Asia and South Asia. It counts fees paid by avid, recreational, corporate and visiting golfers through clubs, booking apps, pro shops and travel agents.
The estimate excludes professional tour prize money, broadcasting rights and real estate sold around courses. The value chain runs from course owners, simulator makers and equipment brands through booking platforms and pro shops to players, companies and tour operators in each country.
Asia-Pacific Golf Market Insights
- The Asia-Pacific golf market was valued at USD 28.99 billion in 2025 and is projected to reach USD 44.93 billion by 2035, registering a CAGR of 4.45% during 2026–2035.
- North Asia held a 70.9% share of 2025 value, because Japan, South Korea and China have the largest player bases and course networks.
- Course operations and memberships led with a 64.0% share of 2025 value, because green fees and club dues remain the core of spending.
- South Korea had more than 8,700 screen golf venues in 2025, and GOLFZON recorded about 94 million simulator rounds in 2024.
- Indoor and simulator golf grows fastest at 6.71% a year during 2026–2035, as screen golf rooms and entertainment venues spread.
Course operations lead while simulator play grows fastest
Why do course operations hold the largest share?
Based on service type, the market is categorized into course operations and memberships, practice and driving range services, indoor and simulator golf, and golf tourism and event services. Course Operations and Memberships led with a 64.0% share of 2025 value, because green fees, dues and carts drive most player spending. Indoor and Simulator Golf grows fastest at 6.71% a year, as screen rooms fit city schedules.
How do avid players and visitors split spending?
Based on customer type, the market is categorized into core and avid golfers, recreational golfers, corporate and group buyers, and tourists and destination golfers. Core and Avid Golfers led with a 44.0% share of 2025 value, because frequent players pay dues and replace equipment. Tourists and Destination Golfers grow fastest at 6.02% a year, as Vietnam, Thailand and Japan court golf travelers.
Why does pay-per-use outweigh memberships?
Based on business model, the market is categorized into membership and subscription, pay-per-use, package and bundle, and ancillary monetization. Pay-Per-Use led with 40.0% of 2025 value, because most players book single rounds, range buckets or simulator hours. Package and Bundle grows fastest at 5.29% a year, as resorts sell rounds with rooms, transfers and lessons.
How do clubs and booking apps reach players?
Based on channel, the market is categorized into direct course and club booking, online tee-time and marketplace platforms, specialist retail and pro shops, and travel and corporate intermediaries. Direct Course and Club Booking led with 52.0% of 2025 value, because members and regulars book with their clubs. Online Tee-Time and Marketplace Platforms grow fastest at 6.32% a year, as players compare tee times and prices on phones.
| Segment Group | Leading Sub-segment | Share, 2025 | Fastest-growing Sub-segment | CAGR, 2026–2035 |
|---|---|---|---|---|
| By Service Type | Course Operations and Memberships | 64.0% | Indoor and Simulator Golf | 6.71% |
| By Customer Type | Core and Avid Golfers | 44.0% | Tourists and Destination Golfers | 6.02% |
| By Business Model | Pay-Per-Use | 40.0% | Package and Bundle | 5.29% |
| By Channel | Direct Course and Club Booking | 52.0% | Online Tee-Time and Marketplace Platforms | 6.32% |
Request a Free Sample
Fill in your details and we'll send you a free sample report.
- Sample data tables & charts
- Research methodology
Wider participation and indoor play lift spending
How does broader participation across ages lift spending?
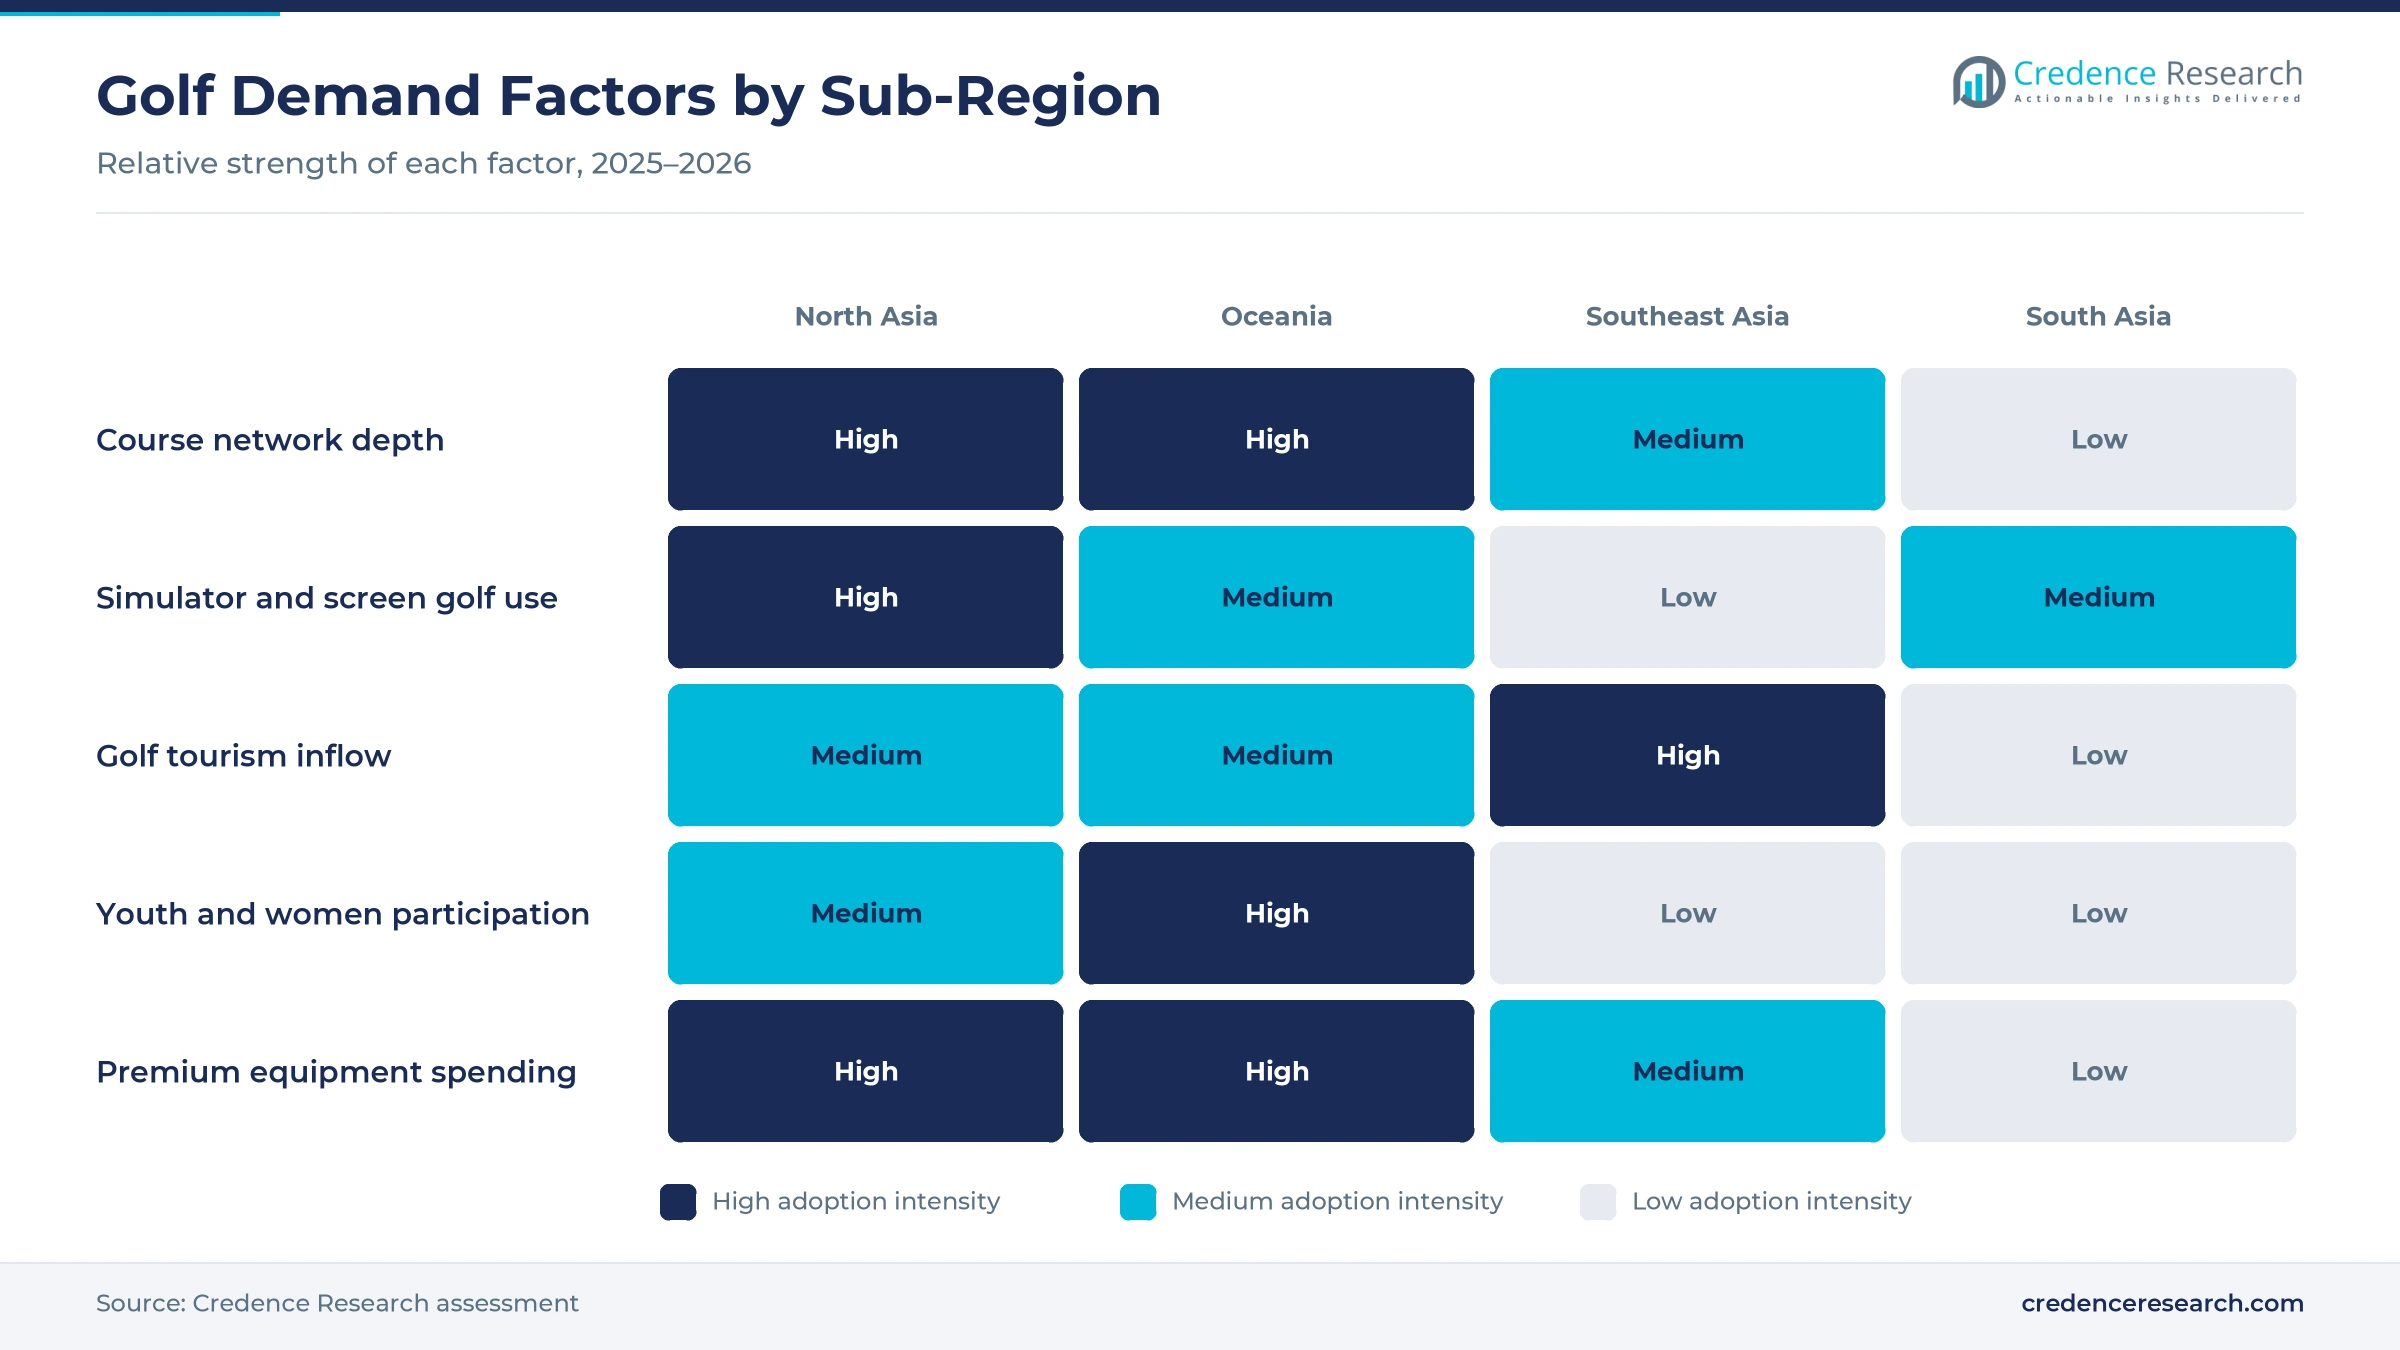
Broader participation across ages lifts spending, because younger players, women and social golfers add new green fees, lessons and equipment purchases. Adult participation in Australia passed 4 million in 2024-25, up 5.2% year on year, according to Australian Golf Digest reporting the national participation report. Of new club members, 41.6% were under 35, while junior membership rose 17.9%. Japan recorded 87.9 million golf club visits in 2024, above the 86.5 million recorded in 2019. As a result, recreational golfers grow faster than core players, and demand for older players remains steady as younger groups join the game across the region.
Why do simulator and off-course formats expand the market?
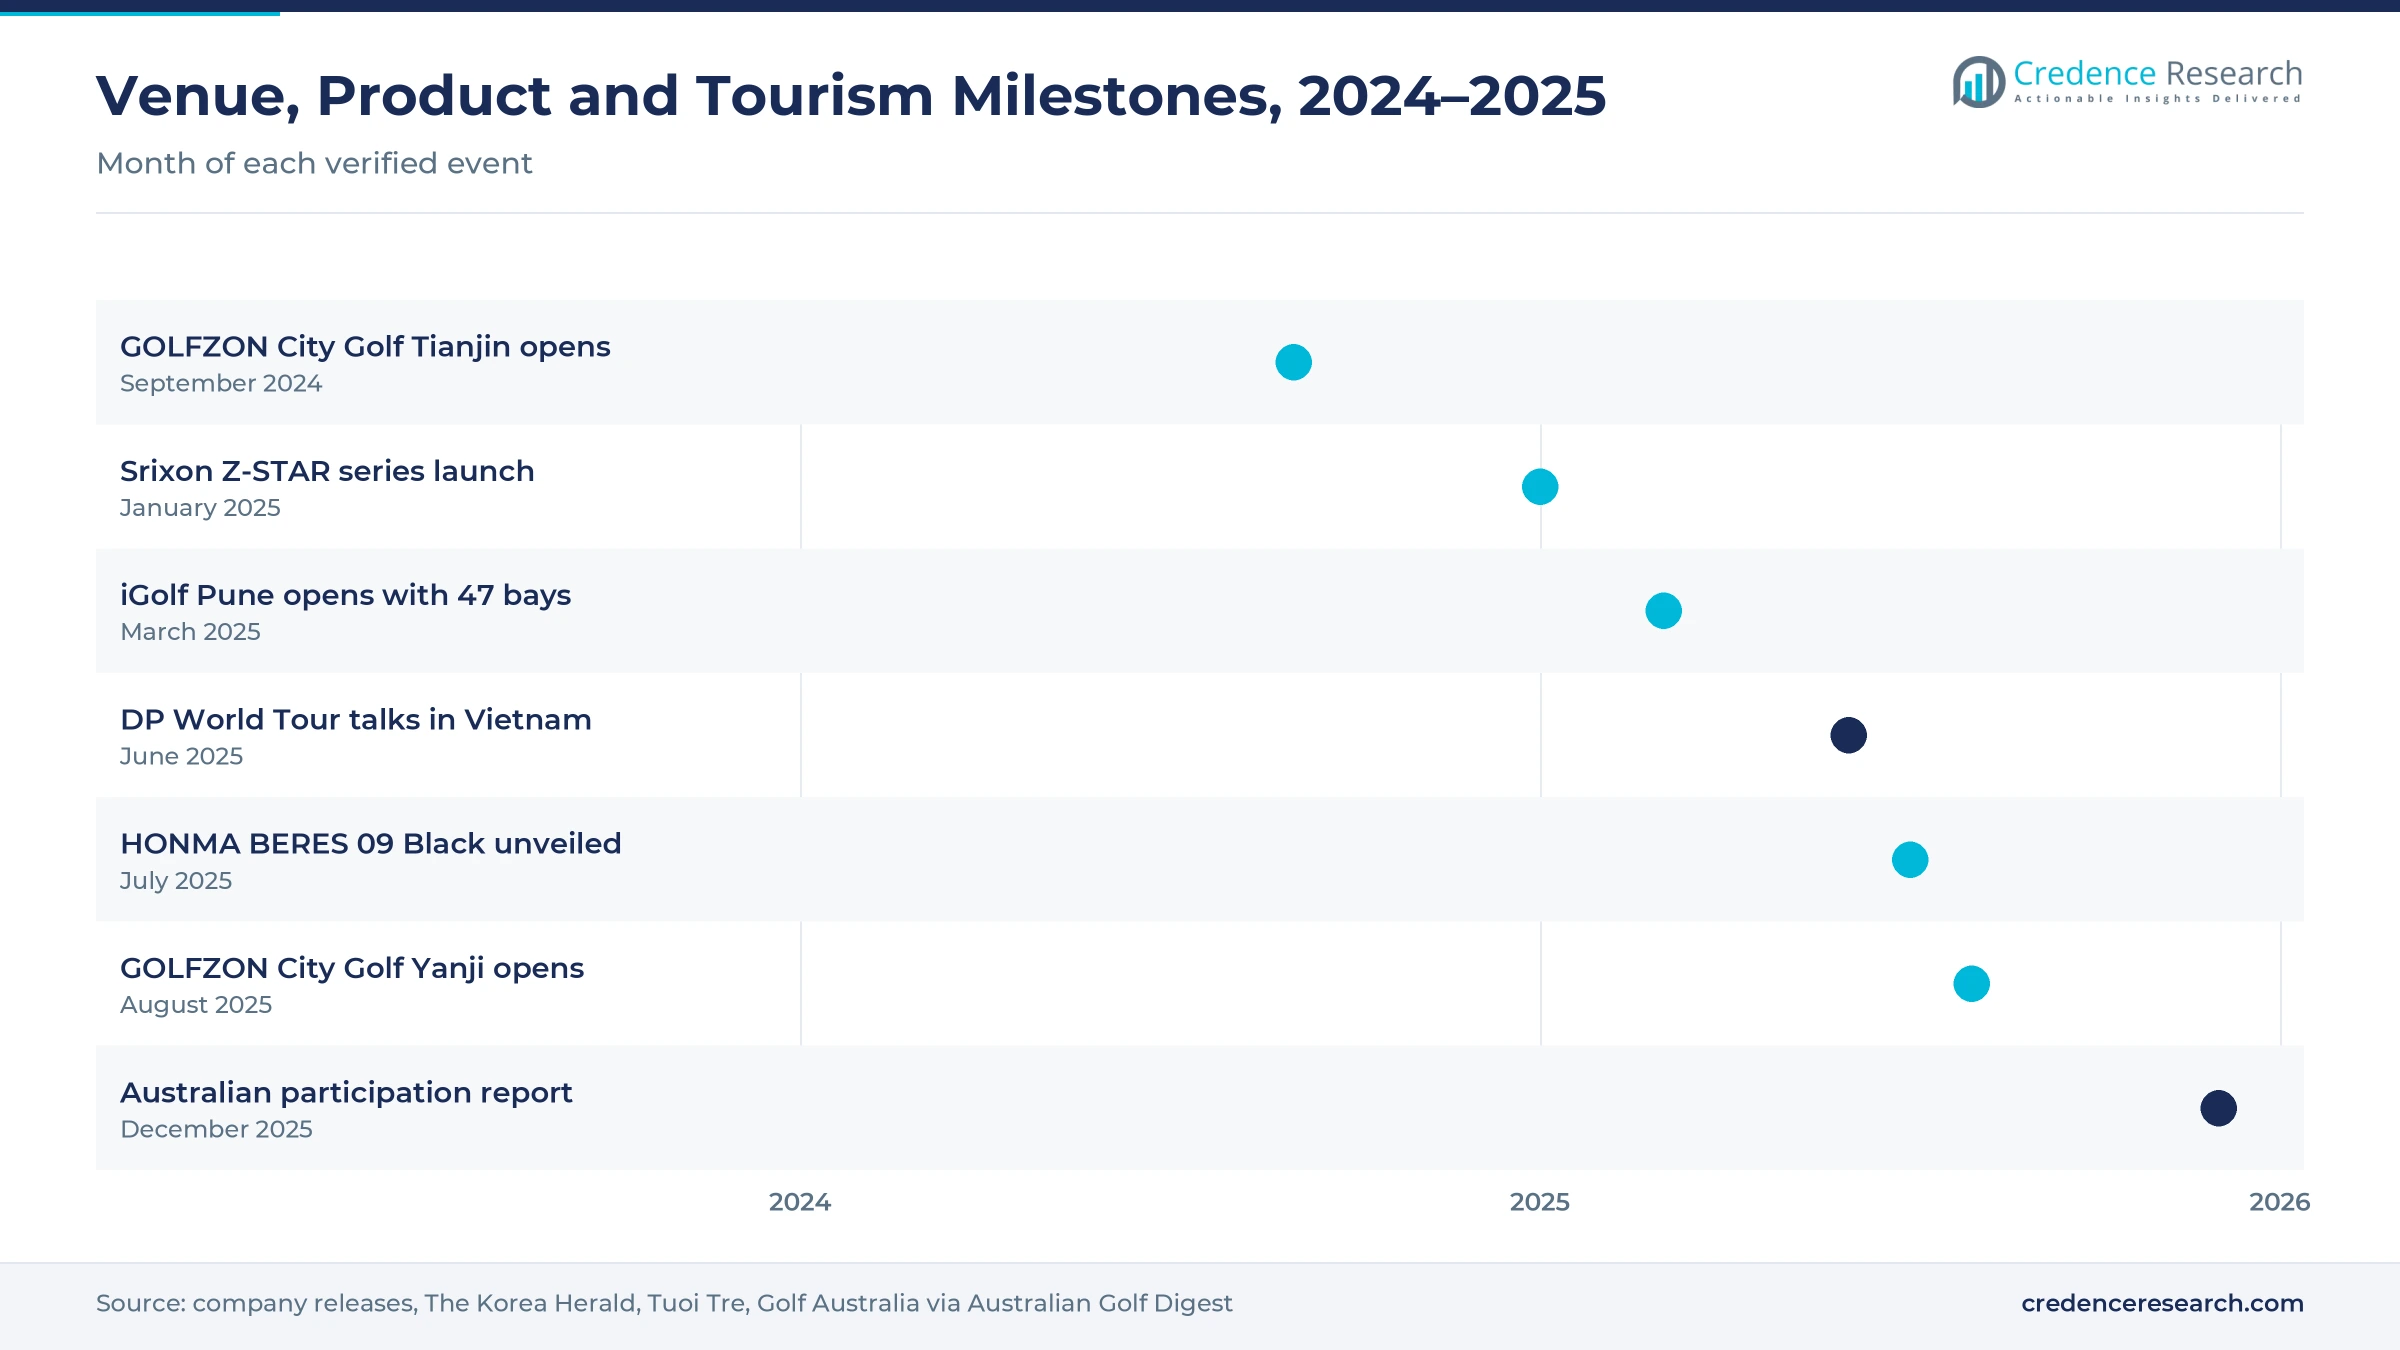
Simulator and off-course formats expand the market, because they let people play at night, in bad weather and near home without a full round. South Korea had more than 8,700 screen golf venues in 2025, and GOLFZON recorded about 94 million simulator rounds in 2024. GOLFZON opened its first City Golf site in Tianjin in September 2024 and a second in Yanji in August 2025, according to The Korea Herald. In India, the iGolf venue in Pune opened in March 2025 with 47 touchscreen bays. In turn, indoor and simulator golf grows at 6.71% a year, the fastest service rate, and lifts demand for simulator systems.
How does equipment premiumization support replacement demand?
Equipment premiumization supports replacement demand, because players who move into the game buy fitted clubs, tour balls and new bags every few seasons. HONMA GOLF unveiled its BERES 09 Black drivers, woods, hybrids and irons in July 2025, with drivers starting at USD 900 and all products built in Sakata, Japan. Srixon launched an all-new Z-STAR ball series on Jan. 24, 2025, with a biomass urethane cover and three core formulas. Private club membership at 150 leading Kanto courses averaged 2.98 million yen in 2025, the highest level in 15 years. As a result, core and avid golfers keep 44.0% of 2025 value and spend more per player on swing measurement devices and premium gear.
Why does golf tourism investment add new spending?
Golf tourism investment adds new spending, because resort courses sell rounds, rooms, caddies and transfers to visitors from richer economies. Vietnam had more than 90 operational 18-hole courses in 2025 and expects 200 by 2030, according to Travel Weekly Asia. The country drew 17.6 million international visitors in 2024 and 9.2 million from January to May 2025, up 21.3%. Accordia Golf Co., Ltd. launched a Korean-language booking site for its 172 courses in May 2024, according to a company release. In turn, tourists and destination golfers grow at 6.02% a year, the fastest customer rate, while resort courses add caddie and transfer income.
Flexible memberships and venues reshape how people play
How is the rise of flexible memberships changing club models?
The rise of flexible memberships is changing club models, because many regular players want handicaps and perks without paying full annual dues. Social and virtual memberships in Australia grew 14.8% in 2024-25, about four times the growth of traditional club membership. About 1.8 million Australians play regularly without belonging to a club, and about 250,000 of them play at least monthly. Golf Australia also launched a handicap subscription that includes insurance and app access. As a result, membership and subscription models hold 40.0% of 2025 value only as part of the mix, while package and bundle offers grow at 5.29% a year.
Why is the shift to golf entertainment venues notable?
The shift to golf entertainment venues is notable, because these sites mix hitting bays, food and music for groups who may never book a course or join a club. Topgolf Megacity in Bangkok opened on Aug. 17, 2022, with 102 hitting bays, an 18-hole mini-golf course and 400 staff. Its Singapore franchise partner plans venues in Singapore, Thailand, Malaysia, Vietnam, the Philippines and Indonesia. Inrange, which supplies radar for the Pune venue, is also involved in four more new venues across India. In turn, practice and driving range services gain visits, and entertainment-led formats bring corporate groups into the game.
Can women and junior programs open a new player base?
Women and junior programs can open a new player base, because the region still has low participation among girls and young adults outside Japan and South Korea. Women made up almost 88% of participants in Golf Australia's Get Into Golf program, which grew 10% in 2024-25. MyGolf junior registrations passed 40,000, up 11%, while under-18 club members rose 112% over five years. Japanese women held 17 places in the top 100 of the women's world ranking in 2025, and Miyu Yamashita won the 2025 AIG Women's Open. As a result, lessons, beginner packages and junior gear gain buyers, and recreational golfers grow at a steady rate across the region.
Is there room to grow through tournaments and golf events?
Tournaments and golf events offer room to grow, because televised events attract travelers, sponsors and new local players to host destinations. DP World Tour Group discussed hosting a tournament in Vietnam with the national tourism authority in June 2025, when its schedule covered 42 tournaments in 26 countries. Accordia Golf has hosted a PGA TOUR tournament at Accordia Golf Narashino Country Club since 2019. Vietnam has been named the world's best golf destination twice and Asia's best eight times by the World Golf Awards. Vietnam earned about USD 460 million from golf tourism in 2022 and aims to pass USD 1 billion. In turn, golf tourism and event services grow faster than course operations, and travel and corporate intermediaries win more group bookings.
Land costs, time pressure and weather test operators
How do land and upkeep costs limit new courses?
Land and upkeep costs limit new courses, because courses need large plots, water and staff near crowded cities. Japan has about 2,200 operating courses, down from a peak of 2,800, and development has been largely flat since 2020. As a result, green fees stay high in big cities. Operators respond by upgrading existing courses, adding ranges and opening simulator rooms that need far less land. This approach keeps existing members while drawing beginners at lower cost.
Why does time pressure keep younger adults away?
Time pressure keeps many younger adults away, because an 18-hole round with travel can take most of a day. Long working hours in Japan, South Korea and China leave little time for full rounds. In turn, many would-be golfers stay with short formats only. Operators respond with nine-hole rates, night play, short courses and simulator leagues that fit a lunch break or an evening. These shorter formats often lead beginners toward full rounds later.
How do heat and monsoon weather disrupt play?
Heat and monsoon weather disrupt play, because tropical courses lose rounds during rainy seasons and extreme summer heat. Southeast Asian and South Asian courses therefore see sharp seasonal swings in bookings. As a result, revenue per course becomes less predictable for owners. Operators respond with covered ranges, floodlights for evening rounds and indoor simulators that keep players active in any weather. Some resorts also shift tournaments and packages into drier months.
Why do high entry costs slow new player growth?
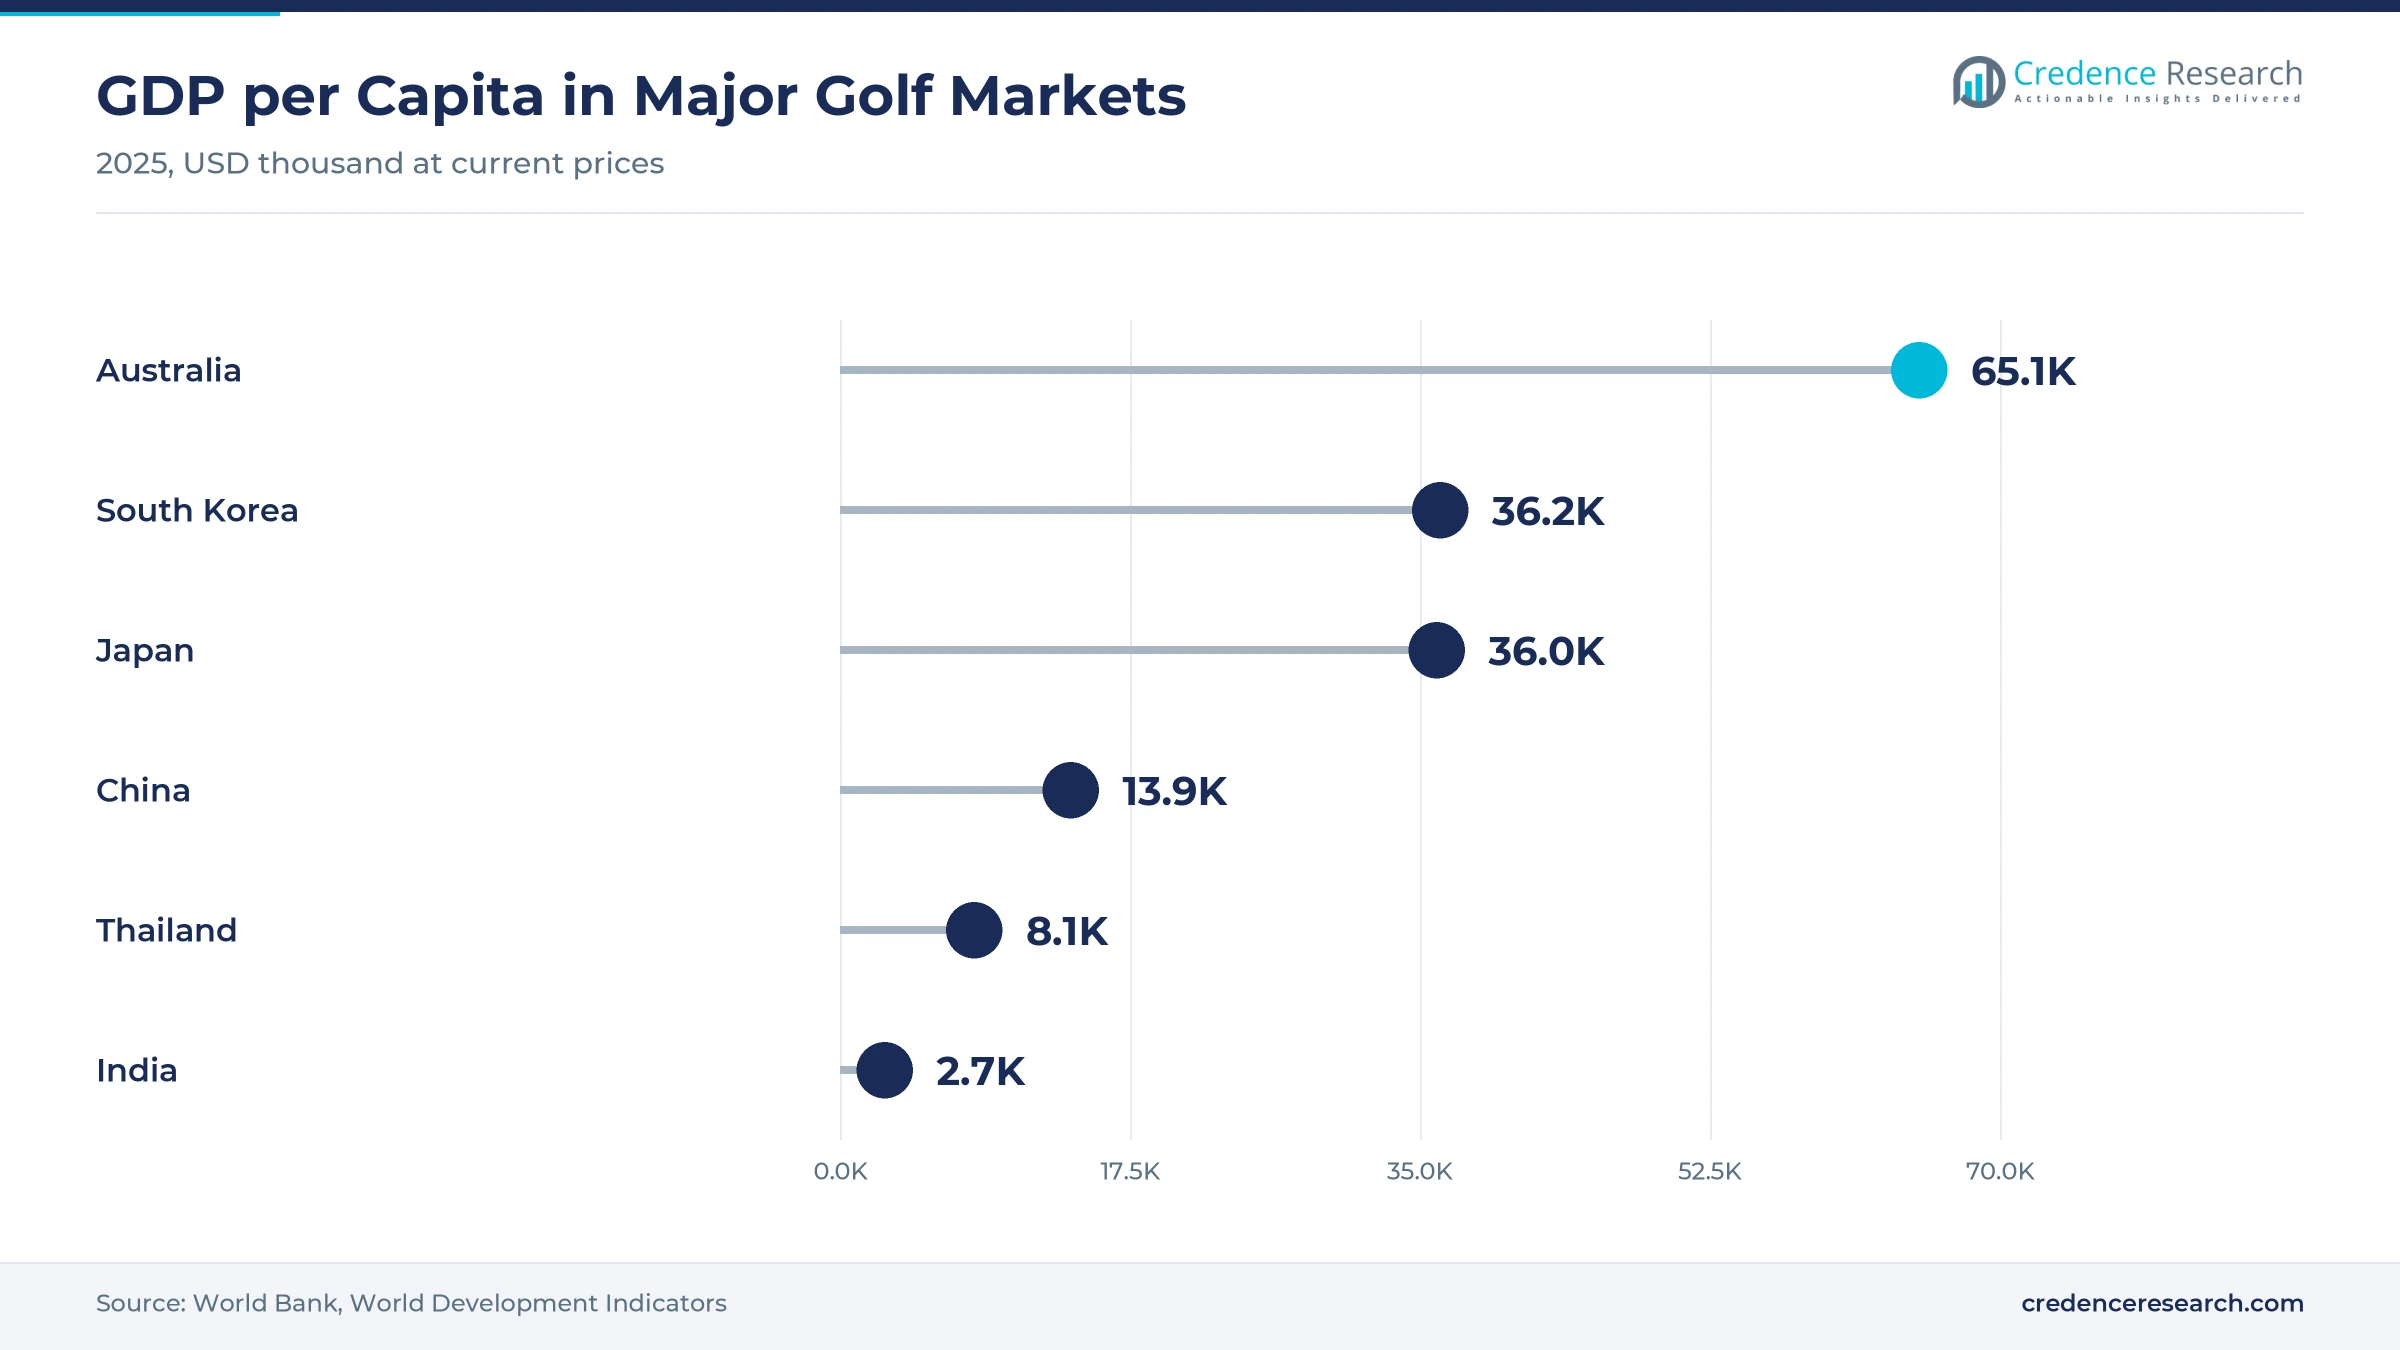
High entry costs slow new player growth, because clubs, lessons and memberships cost more than many other sports in lower-income countries. Gross domestic product per person was about USD 2,702 in India and USD 8,057 in Thailand in 2025, according to the World Bank. In turn, golf remains a premium pastime in much of South and Southeast Asia. Operators respond with rental sets, beginner bundles and pay-per-use ranges that cut the cost of trying the game.
North Asia leads as Southeast Asia grows fastest
| Region | Value, 2025 (USD billion) | Share, 2025 | CAGR, 2026–2035 |
|---|---|---|---|
| North Asia | 20.56 | 70.9% | 4.06% |
| South Asia | 3.68 | 12.7% | 5.36% |
| Southeast Asia | 3.13 | 10.8% | 5.76% |
| Oceania | 1.62 | 5.6% | 4.56% |
Why does North Asia hold most regional golf spending?
North Asia held a 70.9% share of 2025 value and grows at 4.06% a year, because Japan, South Korea and China have the largest player bases. Japan recorded 87.9 million golf club visits in 2024, while South Korea had more than 8,700 screen golf venues in 2025. Accordia Golf operates 172 courses and 26 practice ranges across 36 prefectures. As a result, North Asia leads both course and simulator spending.
How does South Asia build a larger golf base?
South Asia held a 12.7% share of 2025 value and grows at 5.36% a year, because India is adding urban practice venues and corporate events. The iGolf venue in Pune opened in March 2025 with 47 touchscreen bays and a nine-hole mini-golf course. Its radar supplier is also involved in four more new venues across India. In turn, city players can learn the game without joining a private club.
What makes Southeast Asia the fastest-growing golf area?
Southeast Asia held a 10.8% share of 2025 value and grows fastest at 5.76% a year, because Vietnam and Thailand are building courses and attracting golf travelers. Vietnam had more than 90 operational 18-hole courses in 2025 and targets 200 by 2030. Topgolf opened a 102-bay entertainment venue in Bangkok in August 2022. As a result, tourists and destination golfers lead new demand in the area.
How does Oceania keep golf participation at record levels?
Oceania held a 5.6% share of 2025 value and grows at 4.56% a year, because Australia recorded more than 4 million adult participants in 2024-25, the highest on record. Club membership reached 477,220, the fifth straight year of growth, while more than 1.5 million people used ranges, simulators and entertainment venues. In turn, the area combines club golf with fast-growing social formats.
Venue, product and tourism milestones, 2024–2025
| Development | Status and market relevance |
|---|---|
| In September 2024, GOLFZON opened its first City Golf indoor course in Tianjin, China. | Brings Korean screen golf formats into mainland China |
| In January 2025, Srixon launched an all-new Z-STAR golf ball series with a biomass urethane cover. | Refreshes premium ball supply for avid players |
| In March 2025, the iGolf venue opened in Pune, India, with 47 touchscreen bays. | Adds an urban entertainment format in South Asia |
| In July 2025, HONMA GOLF unveiled its BERES 09 Black clubs, built in Sakata, Japan. | Extends the premium club range for high-spending players |
| In August 2025, GOLFZON opened a second City Golf site in Yanji, Jilin Province. | Shows continued simulator expansion in China |
Launch radar, booking apps and sensors change play
- Radar and camera tracking measures ball speed, launch and spin in simulator rooms and range bays, which turns practice into a game and supports coaching.
- Online booking platforms show tee times, prices and course details on phones, which helps players fill quiet slots and helps operators manage demand.
- Handicap and scoring apps record rounds, track progress and link players to clubs, which supports flexible memberships and handicap subscriptions.
Need a Custom Version of This Report?
Tailor the scope, geography, or segments to your exact requirements.
- Custom geography or segment scope
- Direct access to our analyst team
Course groups, simulator makers and brands compete
Competition is split between course owners, simulator makers, entertainment venue operators and equipment brands. Accordia Golf Co., Ltd. operates 172 courses and 26 practice ranges across 36 prefectures, which the company describes as the largest network in Japan by facilities, and it markets rounds to Korean visitors through a dedicated website. GOLFZON Co., Ltd. is a major screen golf supplier in South Korea and opened City Golf sites in Tianjin and Yanji in China. HONMA GOLF designs and builds its clubs in Sakata, Japan and sells in about 50 countries. Topgolf and its regional franchise partner run entertainment venues such as Topgolf Megacity in Bangkok. Rivals compete on course quality, location, price, booking ease, simulator realism and brand appeal. Because new players often start indoors, operators that link simulator play to course rounds and lessons are gaining loyal customers.
Which operators and brands shape golf in Asia-Pacific?
| Company | Type | Role in the market |
|---|---|---|
| Accordia Golf Co., Ltd. | Course operator | Runs 172 courses and 26 practice ranges across 36 Japanese prefectures |
| GOLFZON Co., Ltd. | Simulator maker and operator | Opened City Golf sites in Tianjin in 2024 and Yanji in 2025 |
| HONMA GOLF | Premium club maker | Builds clubs in Sakata, Japan and launched BERES 09 Black in 2025 |
| Topgolf | Entertainment venue operator | Opened a 102-bay venue in Bangkok in August 2022 |
| iGolf | Urban golf venue | Opened a 47-bay venue in Pune, India, in March 2025 |
Credence Research view on regional golf spending
Credence Research's view is that Asia-Pacific golf spending will grow steadily because new formats make the game easier to try and richer economies keep a deep base of regular players. Course operations remain the largest value pool, while simulator play adds the fastest growth. Southeast Asia benefits most from golf travel and new courses. Operators that connect indoor play, lessons and course rounds should gain share fastest across the Asia-Pacific golf base over the next decade.
How the regional golf spending estimate was built
The report uses 2025 as the base year on a calendar basis, and market values come from the Credence Research model. That model combines World Bank income data, national participation reports, tourism statistics, course counts and company announcements. Segment splits and sub-region growth rates are Credence Research estimates, while sub-region shares follow the Credence Research regional model. Sources used are official statistics, industry body reports, trade press and company releases, and no interviews or surveys were used.
Indoor play and golf travel carry growth to 2035
Golf spending in the region is expected to reach USD 44.93 billion by 2035, a 4.45% CAGR during 2026–2035, as more people try the game through simulators, ranges and social memberships. Growth should come from indoor play, golf travel and online booking. New courses in Vietnam and venues in India would add players, while land costs, heat and slower income growth could limit new courses. Operators that blend indoor and outdoor play are expected to gain the most as Asia-Pacific golf demand shifts toward flexible formats.
Frequently Asked Questions
How big is the Asia-Pacific golf market?
Which service type leads regional golf spending?
Which sub-region leads the Asia-Pacific market?
How popular is screen golf in South Korea?
How fast is golf participation growing in Australia?
Why is Southeast Asia growing fastest?
Which companies are active in Asia-Pacific golf?
What are the main challenges for golf operators?
Table of Content
Chapter 1 Market Segmentation
- 1.1 Segmentation Framework
- 1.1.1 Product and Service Classification
- 1.1.2 Application and End-Use Classification
- 1.1.3 Technology and Solution Classification
- 1.1.4 Customer and Distribution Channel Classification
- 1.1.5 Geographic Segmentation
- 1.1.6 Market Segment Definitions and Boundaries
- 1.2 By Service Type
- 1.2.1 Course Operations and Memberships
- 1.2.2 Practice and Driving Range Services
- 1.2.3 Indoor and Simulator Golf
- 1.2.4 Golf Tourism and Event Services
- 1.3 By Customer Type
- 1.3.1 Core and Avid Golfers
- 1.3.2 Recreational Golfers
- 1.3.3 Corporate and Group Buyers
- 1.3.4 Tourists and Destination Golfers
- 1.4 By Business Model
- 1.4.1 Membership and Subscription
- 1.4.2 Pay-Per-Use
- 1.4.3 Package and Bundle
- 1.4.4 Ancillary Monetization
- 1.5 By Channel
- 1.5.1 Direct Course and Club Booking
- 1.5.2 Online Tee-Time and Marketplace Platforms
- 1.5.3 Specialist Retail and Pro Shops
- 1.5.4 Travel and Corporate Intermediaries
Chapter 2 Introduction
- 2.1 Report Objectives and Scope
- 2.2 Product Definition and Industry Terminology
- 2.3 Market Inclusions and Exclusions
- 2.4 Research Process
- 2.4.1 Primary Research and Expert Interviews
- 2.4.2 Secondary Research and Source Review
- 2.4.3 Top-Down and Bottom-Up Estimation
- 2.4.4 Data Triangulation and Verification
- 2.5 Market Size Measurement Basis
- 2.5.1 2025: USD 28.99 billion → 2035: USD 44.93 billion
- 2.6 Historical and Forecast Reference Periods
- 2.6.1 Historical Period: 2018-2025
- 2.6.2 Base Year: 2025
- 2.6.3 Forecast Period: 2025-2035
- 2.7 Research Assumptions and Limitations
Chapter 3 Executive Summary
- 3.1 Market Snapshot and Key Findings
- 3.2 Base-Year Market Size, 2025
- 3.3 Forecast Market Size, 2035
- 3.4 Revenue and Volume Growth Outlook
- 3.5 Key Demand and Supply Indicators
- 3.6 Leading Market Segments
- 3.7 Fastest-Growing Market Opportunities
- 3.8 Regional Performance Highlights
- 3.9 Technology and Industry Transformation
- 3.10 Competitive Landscape Summary
- 3.11 Analyst View and Strategic Implications
Chapter 4 Asia-Pacific Golf Market Trends and Developments
- 4.1 Historical Industry Development, 2018-2025
- 4.2 Recent Market Trends and Developments
- 4.3 Demand and Customer Behavior Trends
- 4.4 Technology and Product Innovation
- 4.5 Artificial Intelligence, Automation and Digitalization
- 4.6 Local Manufacturing and Supply Chain Realignment
- 4.7 Industry Partnerships, Mergers and Acquisitions
- 4.8 Sustainability and Circular Economy Developments
- 4.9 Government and Private Sector Investment Trends
- 4.10 Emerging Business Models and Commercialization
- 4.11 Industry Developments and Announcements
Chapter 5 Asia-Pacific Golf Market Supply and Demand Analysis
- 5.1 Demand Trend and Consumption Analysis, 2018-2025
- 5.2 Demand Forecast, 2025-2035
- 5.3 Supply Chain Structure and Procurement Trends
- 5.4 Supply-Demand Gap and Bottlenecks
- 5.5 Import Dependence and Sourcing Structure
- 5.6 Regional Supply and Demand Concentration
Chapter 6 Asia-Pacific Golf Market Pricing Analysis
- 6.1 Pricing Structure and Measurement
- 6.2 Historical Pricing Trends, 2018-2025
- 6.3 Pricing Outlook, 2025-2035
- 6.4 Pricing by Product and Market Segment
- 6.5 Geographic Pricing Differences
- 6.6 Key Input, Energy, Labor and Logistics Costs
- 6.7 Contract Pricing and Purchasing Models
- 6.8 Pricing Sensitivity and Competitive Positioning
- 6.9 Price, Margin and Profitability Implications
Chapter 7 Asia-Pacific Golf Market Dynamics
- 7.1 Market Growth Drivers
- 7.1.1 Demand-Side Drivers
- 7.1.2 Technology and Innovation Drivers
- 7.1.3 Infrastructure and Investment Drivers
- 7.1.4 Regulatory and Policy Drivers
- 7.2 Market Restraints
- 7.2.1 Cost and Affordability Constraints
- 7.2.2 Technology and Adoption Barriers
- 7.2.3 Supply Chain and Operational Constraints
- 7.3 Market Challenges
- 7.3.1 Competitive Pressure and Margin Erosion
- 7.3.2 Skills, Infrastructure and Implementation Gaps
- 7.4 Emerging Market Opportunities
- 7.5 Market Dynamics Impact and Time-Horizon Assessment
Chapter 8 Asia-Pacific Golf Value Chain Analysis
- 8.1 Industry Value Chain Overview
- 8.2 Upstream Suppliers and Critical Inputs
- 8.3 Technology and Component Providers
- 8.4 Manufacturing or Service Delivery
- 8.5 Distribution, Channel Partners and Integrators
- 8.6 Downstream Applications and End Users
- 8.7 Value Addition and Profit Pools
- 8.8 Vertical Integration and Outsourcing
- 8.9 Supplier Concentration and Risk
- 8.10 Supply Chain Localization and Resilience
Chapter 9 Asia-Pacific Golf Market Regulations and Policies
- 9.1 Relevant Laws, Standards and Compliance Frameworks
- 9.2 Product, Service, Safety and Quality Requirements
- 9.3 Government Policies, Incentives and Subsidies
- 9.4 Imports, Exports and Trade Barriers
- 9.5 Public Procurement and Local Content Requirements
- 9.6 Data Protection, AI and Cybersecurity Compliance
- 9.7 Upcoming Policy Changes and Market Implications
Chapter 10 Asia-Pacific Golf Market Hotspots and Opportunities
- 10.1 Market Opportunity Mapping and Growth Hotspots
- 10.2 High-Growth Applications and Customer Groups
- 10.3 Underserved Markets and White-Space Opportunities
- 10.4 Emerging Technology and Product Opportunities
- 10.5 New Capacity and Investment Hotspots
- 10.6 Market Entry and Expansion Opportunities
- 10.7 Distribution and Partnership Opportunities
- 10.8 Near-Term and Long-Term Commercial Potential
- 10.9 Opportunity Attractiveness and Execution Risks
Chapter 11 Asia-Pacific Golf Market Outlook, 2025-2035
- 11.1 Market Size and Analysis
- 11.1.1 Revenue (Market Measurement: 2025: USD 28.99 billion → 2035: USD 44.93 billion)
- 11.1.2 Historical Market Size, 2018-2025
- 11.1.3 Base-Year Market Size, 2025
- 11.2 Market Forecast, 2025-2035
- 11.2.1 Revenue Forecast to 2035
- 11.2.2 CAGR and Year-on-Year Growth
- 11.2.3 Incremental Revenue Opportunity
- 11.3 Forecast Assumptions and Scenario Analysis
- 11.3.1 Base-Case Forecast
- 11.3.2 Optimistic and Conservative Scenarios
- 11.3.3 Technology, Pricing and Policy Sensitivities
- 11.4 Market Attractiveness and Growth Outlook
Chapter 12 Asia-Pacific Golf Market Segmentation and Outlook
- 12.1 Segmentation Summary and Market Shares, 2025
- 12.2 Largest and Fastest-Growing Segments
- 12.3 By Service Type - Market Size and Forecast, 2025-2035
- 12.3.1 Segment Definition and Scope
- 12.3.2 Historical Market Size, 2018-2025
- 12.3.3 Revenue Forecast, 2025-2035
- 12.3.4 Base-Year Market Share, 2025
- 12.3.5 Segment CAGR and Growth Drivers
- 12.3.6 Subsegment Market Size and Forecast
- 12.3.6.1 Course Operations and Memberships
- 12.3.6.2 Practice and Driving Range Services
- 12.3.6.3 Indoor and Simulator Golf
- 12.3.6.4 Golf Tourism and Event Services
- 12.3.7 Subsegment Pricing and Adoption Trends
- 12.3.8 Leading Suppliers and Competition
- 12.3.9 Regional Demand and Opportunities
- 12.4 By Customer Type - Market Size and Forecast, 2025-2035
- 12.4.1 Segment Definition and Scope
- 12.4.2 Historical Market Size, 2018-2025
- 12.4.3 Revenue Forecast, 2025-2035
- 12.4.4 Base-Year Market Share, 2025
- 12.4.5 Segment CAGR and Growth Drivers
- 12.4.6 Subsegment Market Size and Forecast
- 12.4.6.1 Core and Avid Golfers
- 12.4.6.2 Recreational Golfers
- 12.4.6.3 Corporate and Group Buyers
- 12.4.6.4 Tourists and Destination Golfers
- 12.4.7 Subsegment Pricing and Adoption Trends
- 12.4.8 Leading Suppliers and Competition
- 12.4.9 Regional Demand and Opportunities
- 12.5 By Business Model - Market Size and Forecast, 2025-2035
- 12.5.1 Segment Definition and Scope
- 12.5.2 Historical Market Size, 2018-2025
- 12.5.3 Revenue Forecast, 2025-2035
- 12.5.4 Base-Year Market Share, 2025
- 12.5.5 Segment CAGR and Growth Drivers
- 12.5.6 Subsegment Market Size and Forecast
- 12.5.6.1 Membership and Subscription
- 12.5.6.2 Pay-Per-Use
- 12.5.6.3 Package and Bundle
- 12.5.6.4 Ancillary Monetization
- 12.5.7 Subsegment Pricing and Adoption Trends
- 12.5.8 Leading Suppliers and Competition
- 12.5.9 Regional Demand and Opportunities
- 12.6 By Channel - Market Size and Forecast, 2025-2035
- 12.6.1 Segment Definition and Scope
- 12.6.2 Historical Market Size, 2018-2025
- 12.6.3 Revenue Forecast, 2025-2035
- 12.6.4 Base-Year Market Share, 2025
- 12.6.5 Segment CAGR and Growth Drivers
- 12.6.6 Subsegment Market Size and Forecast
- 12.6.6.1 Direct Course and Club Booking
- 12.6.6.2 Online Tee-Time and Marketplace Platforms
- 12.6.6.3 Specialist Retail and Pro Shops
- 12.6.6.4 Travel and Corporate Intermediaries
- 12.6.7 Subsegment Pricing and Adoption Trends
- 12.6.8 Leading Suppliers and Competition
- 12.6.9 Regional Demand and Opportunities
- 12.7 Segment Growth Comparison
- 12.8 Segment Attractiveness and Priority Matrix
Chapter 13 Asia-Pacific Golf End-Use and Application Market Outlook
- 13.1 End-Use Industry and Customer Demand Structure
- 13.2 Leading Applications and Customer Groups
- 13.3 End-Use Market Size, Share and Forecast
- 13.4 Major End-Use Industry Deep Dives
- 13.4.1 Customer Requirements and Use Cases
- 13.4.2 Demand and Replacement Cycles
- 13.4.3 Technical and Regulatory Considerations
- 13.4.4 Purchasing and Procurement Models
- 13.4.5 Leading Vendors and Distribution Channels
- 13.4.6 Forecast and Commercial Opportunities
- 13.5 Emerging Applications and Cross-Segment Demand
- 13.6 End-Use Industry Investment Priorities
Chapter 14 Asia-Pacific Golf Geographic Market Outlook, 2025-2035
- 14.1 Regional Market Size and Country-Level Shares, 2025
- 14.2 Country Market Size Comparison, 2025
- 14.3 Country Market Forecasts, 2025-2035
- 14.4 Subregional Industrial and Demand Clusters
- 14.5 Intra-Regional Pricing and Cost Differences
- 14.6 Cross-Border Trade and Supply Networks
- 14.7 Regional Supply and Demand Balances
- 14.8 Country Opportunity Comparison and Prioritization
Note: Every listed country is covered on the structure shown under the first country.
Chapter 15 Asia-Pacific Golf Technology, Innovation and Sustainability Outlook
- 15.1 Technology Landscape and Maturity
- 15.2 Product, Process and Service Innovation
- 15.3 AI, Automation and Digital Tools in the Industry
- 15.4 Technology Adoption and Performance Benchmarking
- 15.5 Innovation Pipeline and R&D Investment
- 15.6 Energy Efficiency and Resource Management
- 15.7 Sustainability, Recycling and Circularity
- 15.8 Technology Roadmap, 2025-2035
- 15.9 Risks of Obsolescence and Technology Substitution
Chapter 16 Asia-Pacific Golf Market Key Strategic Imperatives
- 16.1 Growth and Market Entry Priorities
- 16.2 High-Return Products and Segments
- 16.3 Pricing, Profitability and Cost Optimization
- 16.4 Technology Investment and Product Differentiation
- 16.5 Supply Chain Localization and Resilience
- 16.6 Distribution and Customer Acquisition
- 16.7 Partnership, Acquisition and Capacity Strategy
- 16.8 Regional Expansion Priorities
- 16.9 Short-, Medium- and Long-Term Actions
Chapter 17 Competition Outlook
- 17.1 Industry Competition Characteristics
- 17.2 Market Structure and Concentration
- 17.3 Market Share and Competitive Positioning, 2025
- 17.4 Company-Wise Revenue and Product Benchmarking
- 17.5 Production and Service Capacity Benchmarking
- 17.6 Technology, Pricing and Differentiation
- 17.7 Regional Footprint and Distribution Strength
- 17.8 Mergers, Acquisitions and Strategic Alliances
- 17.9 New Entrants and Competitive Threats
- 17.10 Porter's Five Forces and Industry Attractiveness
- 17.11 Competitive Outlook, 2025-2035
Chapter 18 Company Profiles
- 18.1 Company Coverage and Selection Criteria
- 18.2 Accordia Golf Co., Ltd.
- 18.2.1 Business Description
- 18.2.2 Company Ownership and Geographic Presence
- 18.2.3 Product and Service Portfolio
- 18.2.4 Manufacturing and Operating Footprint
- 18.2.5 Financial Performance and Investment
- 18.2.6 Market Share and Competitive Position
- 18.2.7 Technology and Innovation Capabilities
- 18.2.8 Strategic Alliances or Partnerships
- 18.2.9 Recent Developments
- 18.2.10 Growth Strategy and Outlook
- 18.3 GOLFZON Co., Ltd.
- 18.4 Sumitomo Rubber Industries, Ltd.
- 18.5 Acushnet Holdings Corp.
- 18.6 TaylorMade Golf Company
- 18.7 Callaway Golf Company
- 18.8 Bridgestone Sports Co., Ltd.
- 18.9 Mizuno Corporation
- 18.10 Yonex Co., Ltd.
- 18.11 HONMA GOLF
- 18.12 Other Relevant Market Participants
Note: Every listed company is profiled on the structure shown under the first company. The company list is preliminary and may change based on research findings, market developments, data availability and client requirements.
Chapter 19 Disclaimer
- 19.1 Research and Forecast Disclaimer
- 19.2 Data Source and Estimation Limitations
Note: The depth of individual sections depends on data availability for this market. Volume, capacity, trade and other unit-based metrics are included where applicable.

