
Desert, mountain and sea experiences draw record visitors
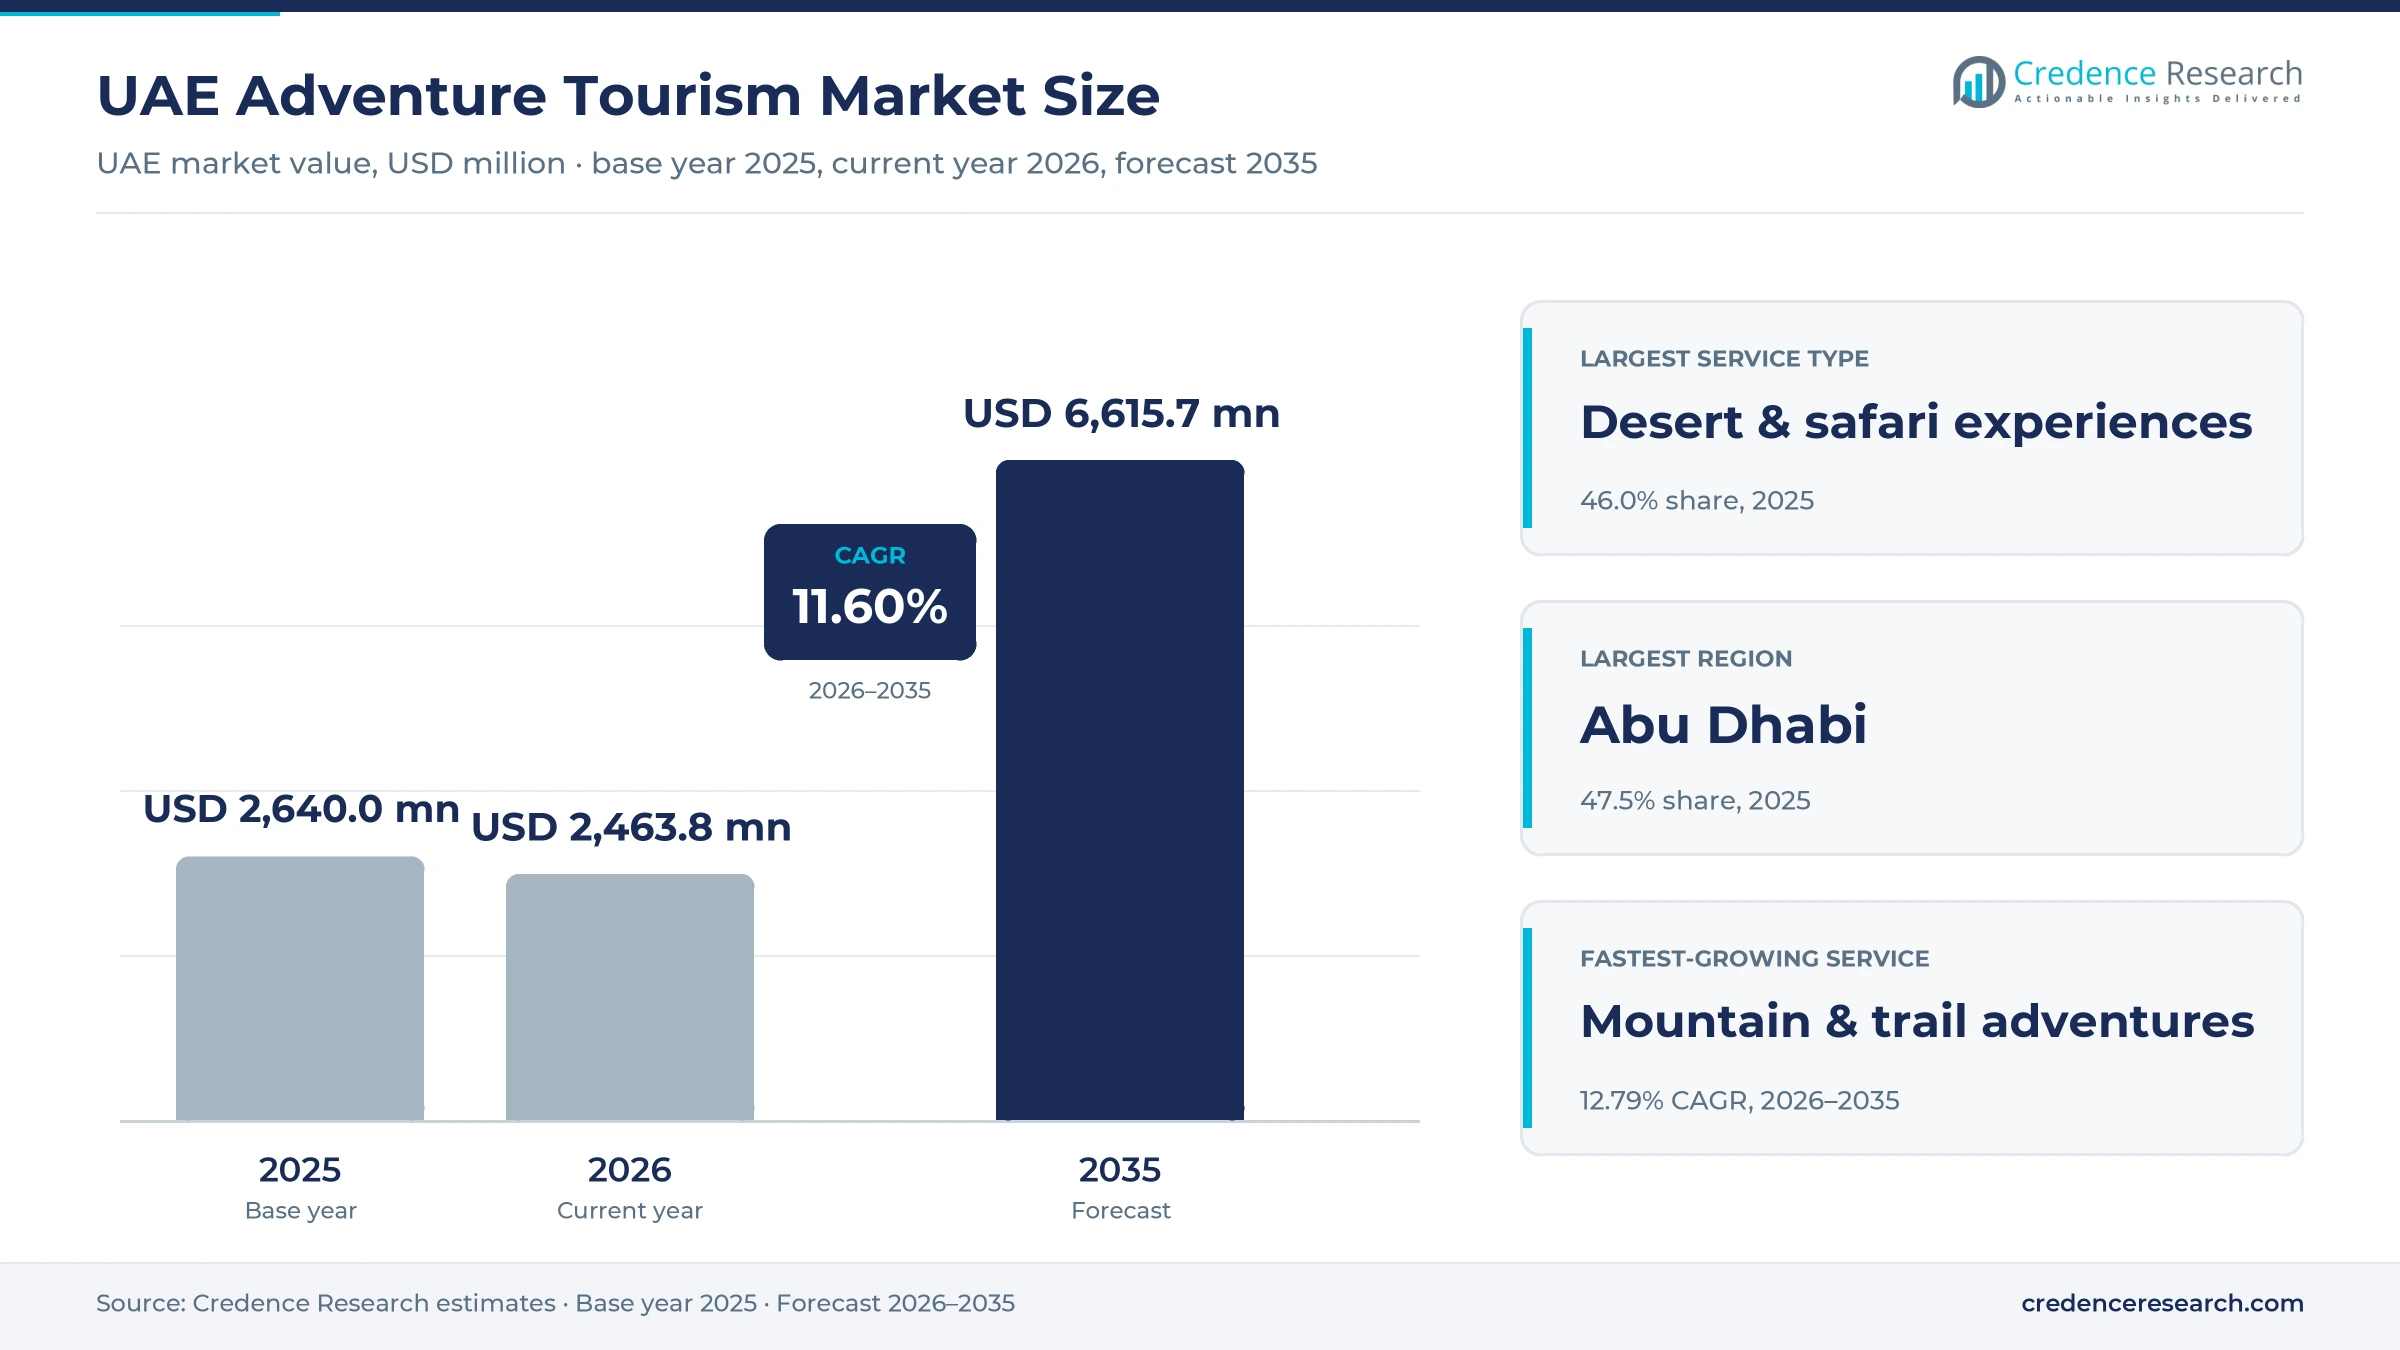
The UAE adventure tourism market was valued at USD 2.64 billion in 2025 and is projected to increase from USD 2.46 billion in 2026 to USD 6.62 billion by 2035, registering a CAGR of 11.60% during 2026–2035. Demand comes from international holidaymakers, residents, families and corporate groups that book desert safaris, mountain trails, water sports and aerial rides across the seven emirates. Abu Dhabi held the largest regional share, 47.5% in 2025, because desert camps, island attractions and large events draw long-stay visitors. Ras Al Khaimah is the fastest-growing region at 13.18% a year, as Jebel Jais adds ziplines, camps and trail events. However, value dips in 2026 because the regional war that began on Feb. 28, 2026, cut flights and hotel stays, and Dubai hotel occupancy fell to 33.1% in March 2026.
Which desert, mountain, sea and air experiences does the estimate count?
The estimate measures spending by visitors and residents on paid outdoor experiences in the UAE, including desert safaris and camps, mountain hikes and ziplines, kayaking, diving and other water activities, and skydiving, balloon and aerial rides. It covers guided tours, private trips, self-guided access and experiences bundled with resort stays.
The estimate excludes flights, hotel rooms sold on their own, theme park tickets and shopping. The value chain runs from destination authorities and land or site owners through licensed operators, guides and vehicle fleets to booking channels such as operator apps, online agencies, hotel desks and travel agents.
UAE Adventure Tourism Market Insights
- The UAE adventure tourism market was valued at USD 2.64 billion in 2025 and is projected to reach USD 6.62 billion by 2035, registering a CAGR of 11.60% during 2026–2035.
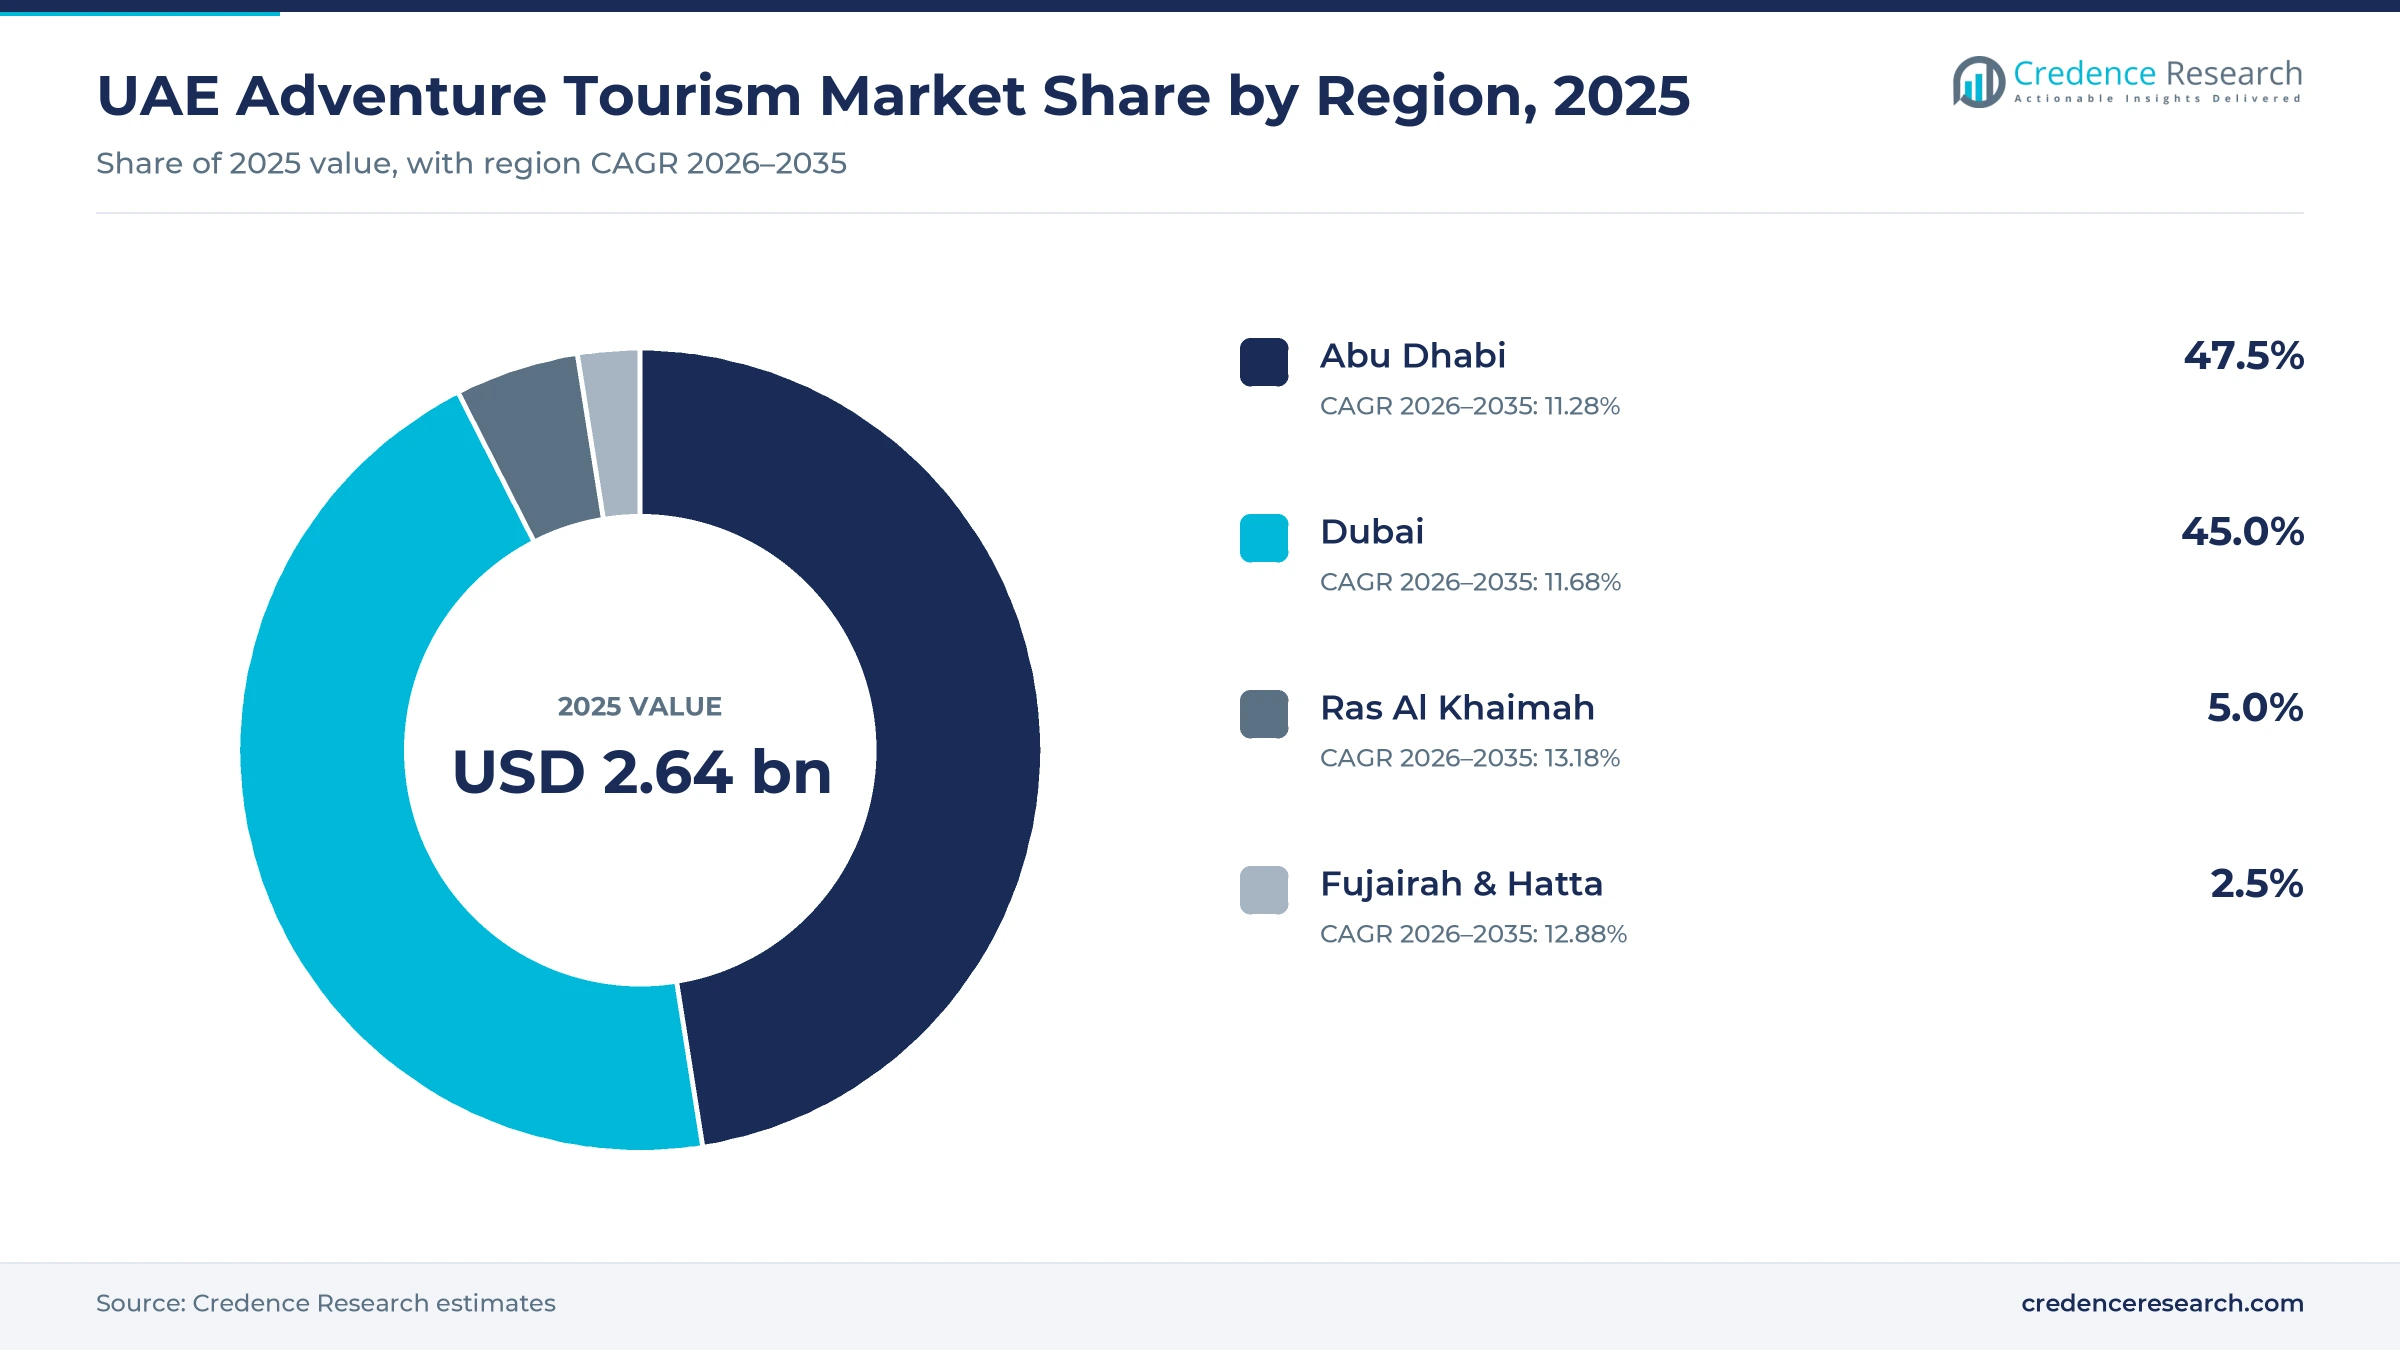
- Abu Dhabi held a 47.5% share of 2025 value, because desert camps, island attractions and a busy event calendar draw long-stay visitors.
- Desert and safari experiences led with a 46.0% share of 2025 value, because almost every holiday itinerary in the UAE includes a desert trip.
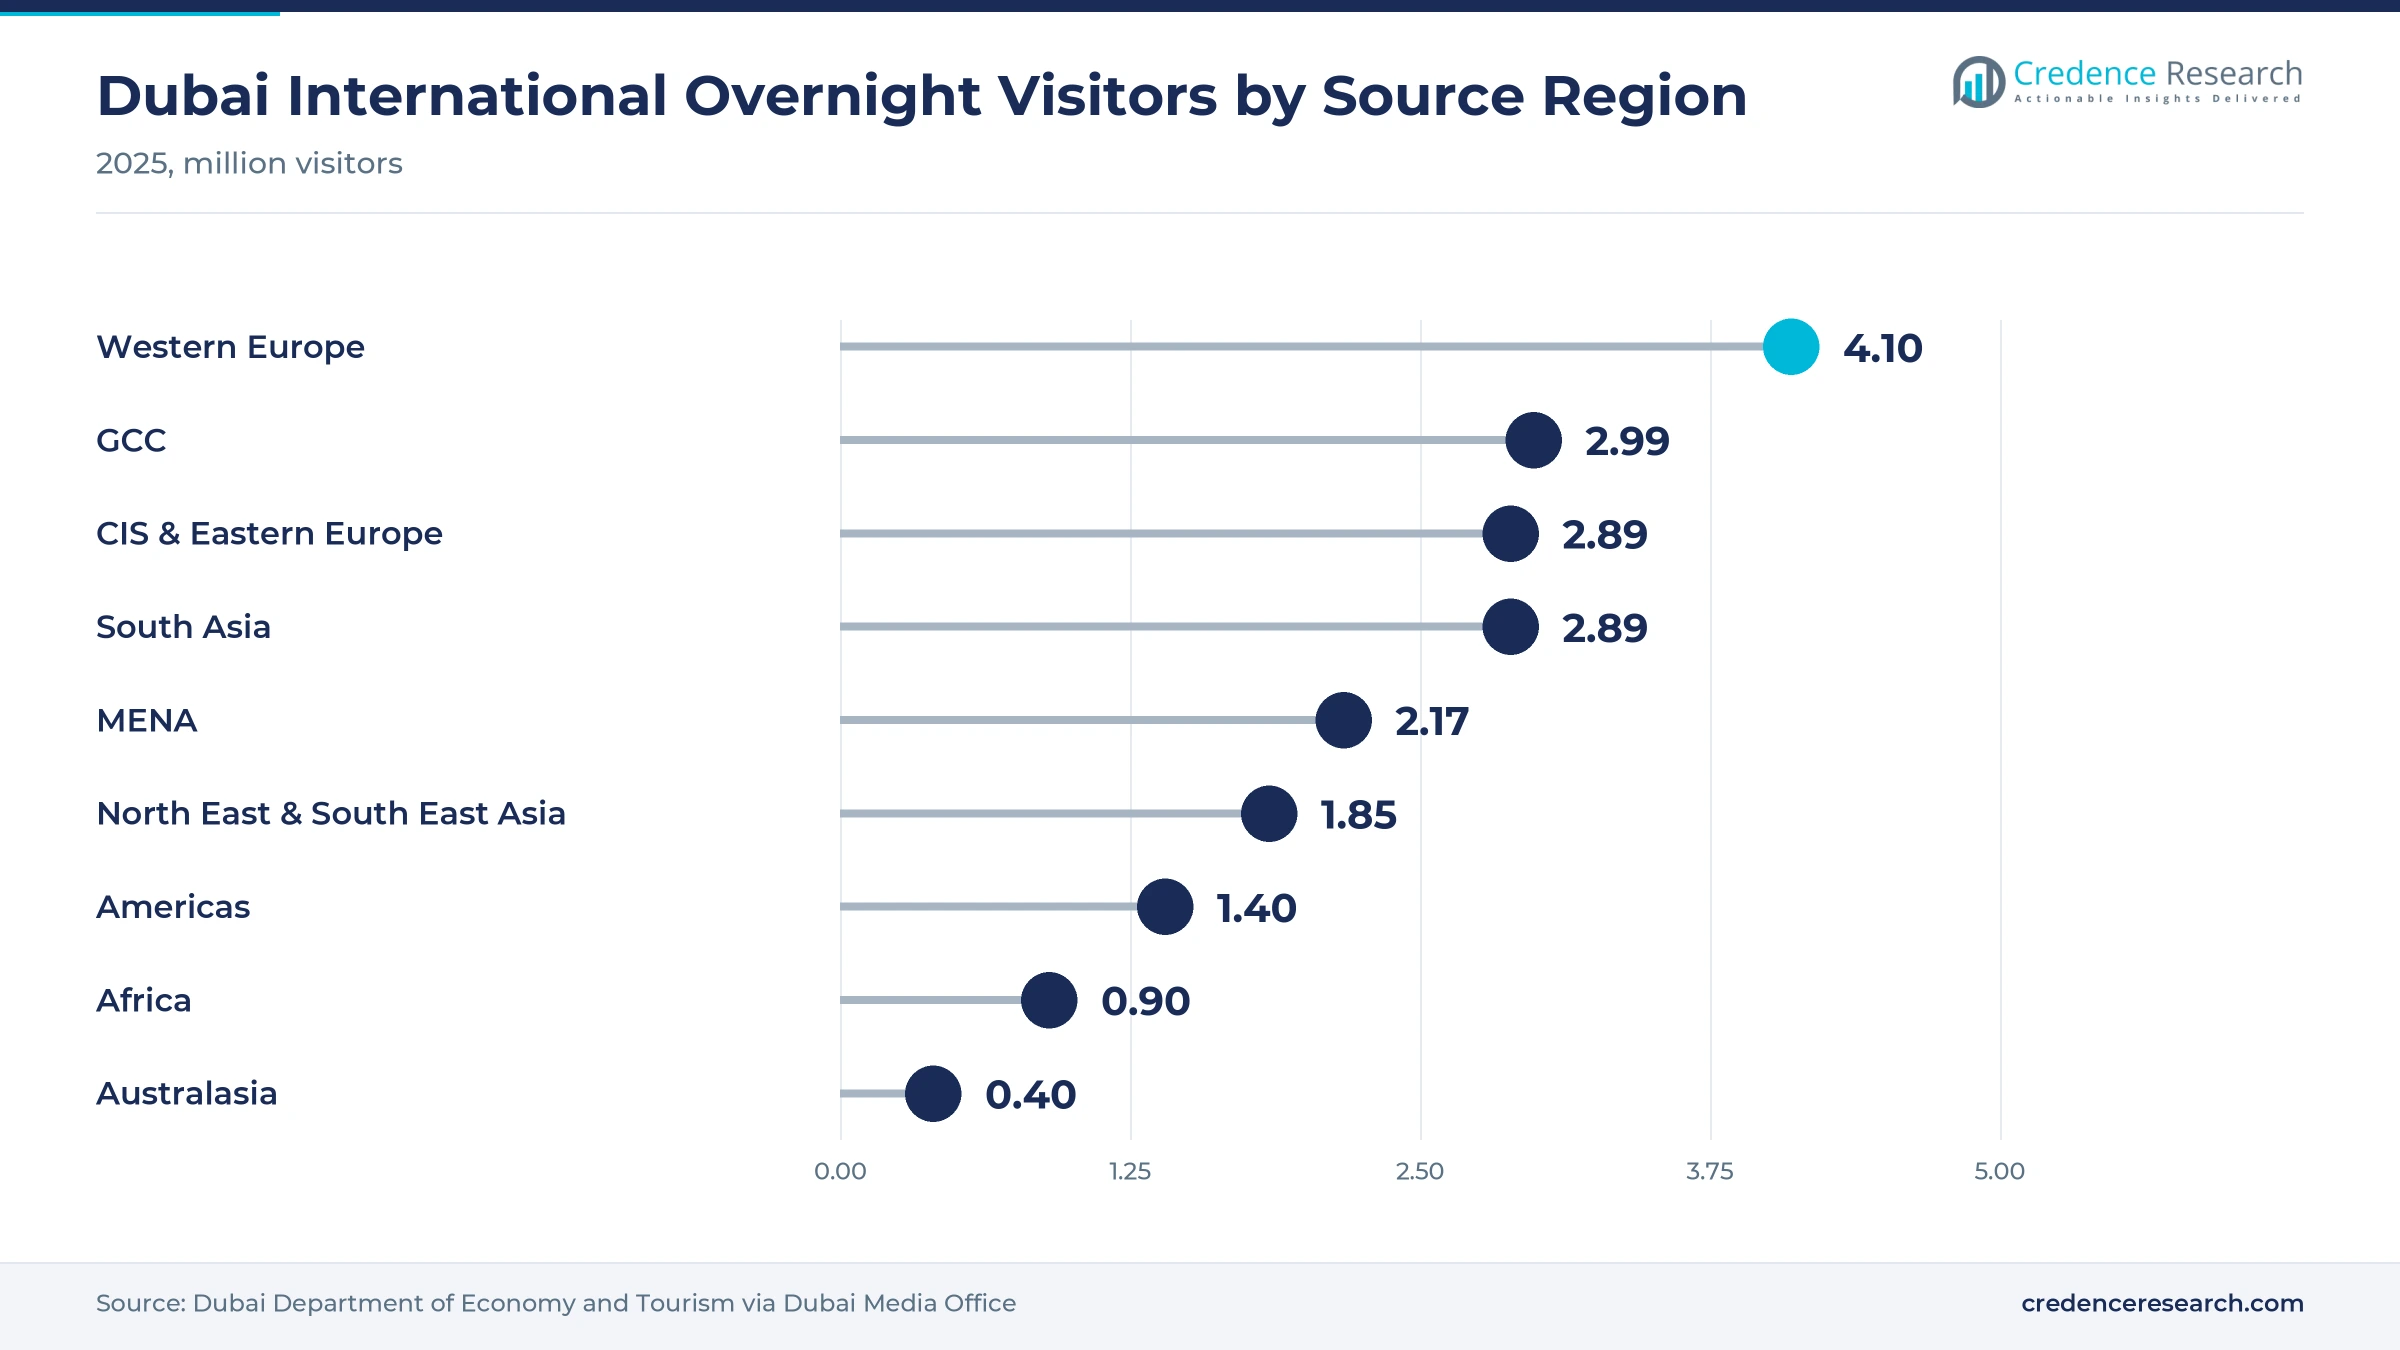
- Dubai welcomed 19.59 million international overnight visitors in 2025, up 5% from 18.72 million in 2024, and hotel occupancy reached 80.7%.
- Mountain and trail adventures grow fastest at 12.79% a year during 2026–2035, as Jebel Jais and Hatta add ziplines, camps, trails and events.
Desert safaris lead as mountain trails gain pace
Why do desert and safari experiences take the largest share?
Based on service type, the market is categorized into desert and safari experiences, mountain and trail adventures, water-based adventures and air and aerial adventures. Desert & Safari Experiences led with a 46.0% share of 2025 value, because dune drives and desert camps appear in most holiday packages. Mountain & Trail Adventures grows fastest at 12.79% a year, as Jebel Jais and Hatta add ziplines, trails and camps.
Which travelers buy the most outdoor experiences?
Based on customer type, the market is categorized into international leisure travelers, UAE residents, families and multi-generational groups, and corporate and institutional groups. International Leisure Travelers led with a 58.0% share of 2025 value, because record visitor numbers fill desert and sea tours. UAE Residents grow fastest at 12.16% a year, as residents take more weekend trips to the mountains during the cooler months.
How do guided, private and resort-based trips compare?
Based on delivery model, the market is categorized into guided small-group tours, private customized tours, self-guided activity access and resort-integrated experiences. Guided Small-Group Tours led with a 44.0% share of 2025 value, because shared desert trips keep prices low per guest. Resort-Integrated Experiences grow fastest at 12.38% a year, as new resorts in Ras Al Khaimah bundle outdoor activities with stays.
Which booking channels sell the most experiences?
Based on channel, the market is categorized into operator websites and apps, online travel agencies, hotel and concierge desks, and travel agencies and DMCs. Online Travel Agencies led with a 32.0% share of 2025 value, because foreign visitors compare and book trips before they arrive. Operator Websites & Apps grow fastest at 12.10% a year, as operators push direct mobile booking with instant confirmation.
| Segment Group | Leading Sub-segment | Share, 2025 | Fastest-growing Sub-segment | CAGR, 2026–2035 |
|---|---|---|---|---|
| By Service Type | Desert & Safari Experiences | 46.0% | Mountain & Trail Adventures | 12.79% |
| By Customer Type | International Leisure Travelers | 58.0% | UAE Residents | 12.16% |
| By Delivery Model | Guided Small-Group Tours | 44.0% | Resort-Integrated Experiences | 12.38% |
| By Channel | Online Travel Agencies | 32.0% | Operator Websites & Apps | 12.10% |
Request a Free Sample
Fill in your details and we'll send you a free sample report.
- Sample data tables & charts
- Research methodology
Visitors, flights and new destinations drive bookings
How does record tourism demand expand the customer pool?
More visitors mean more bookings for desert, sea and mountain trips, so record arrivals widen the pool of adventure buyers. Dubai welcomed 19.59 million international overnight visitors in 2025, up 5% from 18.72 million in 2024, and hotel occupancy reached 80.7%, according to the Dubai Media Office. Abu Dhabi recorded 26.6 million visitors in 2025, including 5.9 million hotel guests, while hotel occupancy rose 3 points to 81%. Ras Al Khaimah received 1.35 million overnight visitors in 2025, up 6% from the year before. As a result, international leisure travelers hold 58.0% of 2025 value, because most visitors book at least one outdoor experience during their stay.
Why does world-scale aviation connectivity support frequent trips?
Direct flights from many cities bring a steady flow of short-stay visitors, which supports frequent half-day bookings. Dubai International handled a record 95.2 million passengers in 2025, up 3.1%, with 108 airlines serving 291 destinations, according to TravelDailyNews. India was the airport's largest country market with 11.9 million passengers, ahead of Saudi Arabia and the United Kingdom. Abu Dhabi's five airports handled more than 33 million passengers in 2025, and Zayed International added 39 routes and seven airlines. In turn, short stopover and weekend visitors book half-day desert, sea and aerial trips, which keeps guided small-group tours at 44.0% of 2025 value.
How does destination diversification expand adventure supply?
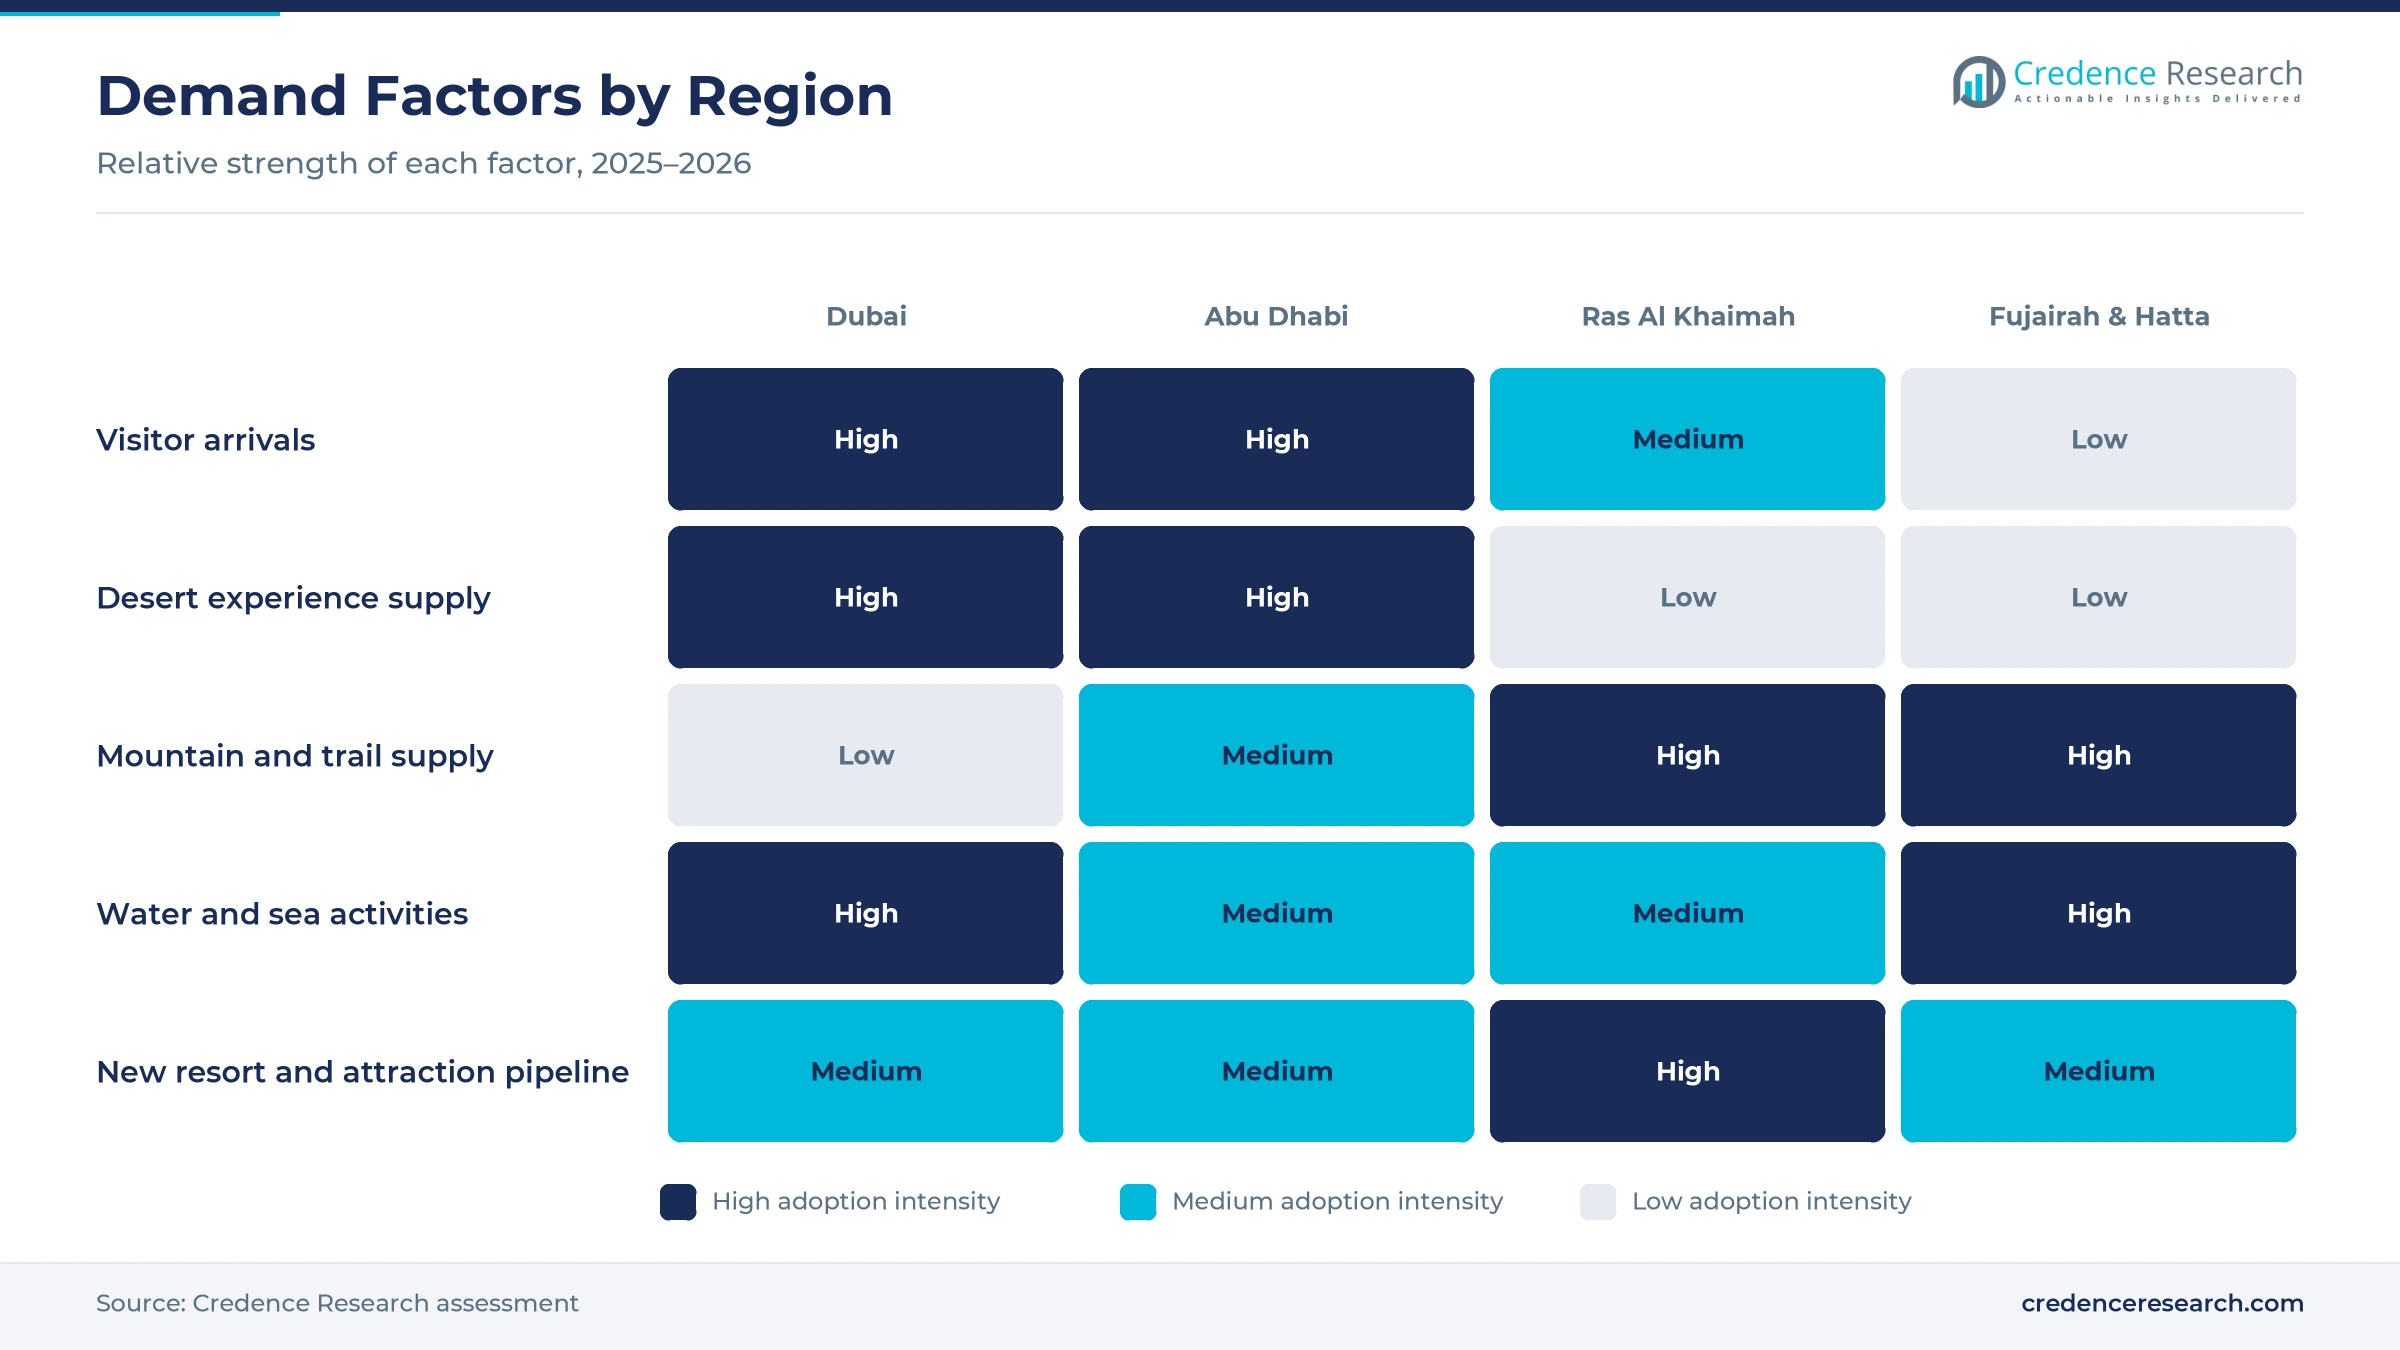
Emirates are opening mountain, heritage and coastal areas beyond the main city beaches, which widens the range of outdoor trips on sale. The UAE Tourism Strategy 2031, launched on Nov. 11, 2022, targets AED 450 billion in tourism GDP, 40 million hotel guests and AED 100 billion of new investment through 25 initiatives. Hatta Winter drew more than 870,000 visitors to its festivals in its first edition, and a second edition ran from Dec. 5, 2025, to Jan. 31, 2026. Ras Al Khaimah aims to welcome more than 3.5 million visitors by 2030 and to double its hotel keys. As a result, mountain and trail adventures grow at 12.79% a year during 2026–2035.
Why do events and corporate groups add outdoor demand?
Festivals, races and conferences bring guests who book team trips and extra activities, which lifts weekday and off-peak bookings. Abu Dhabi hosted 252 culture and leisure events with more than 4.2 million attendees in 2025, up 20%, while Liwa Village drew more than 159,000 visitors. The emirate also hosted 6,600 MICE events with 2.2 million delegates in 2025, up 40% from 2024. Jebel Jais scheduled an Ultra Trail Running Competition in January 2026, a Night Trail Race in March 2026 and Jais Ride in April 2026. In turn, corporate and institutional groups add steady weekday bookings for desert camps and team-building programs across Abu Dhabi and Dubai.
Premium desert trips, mountain parks and Indian demand
How is the rise of premium private desert trips changing offers?
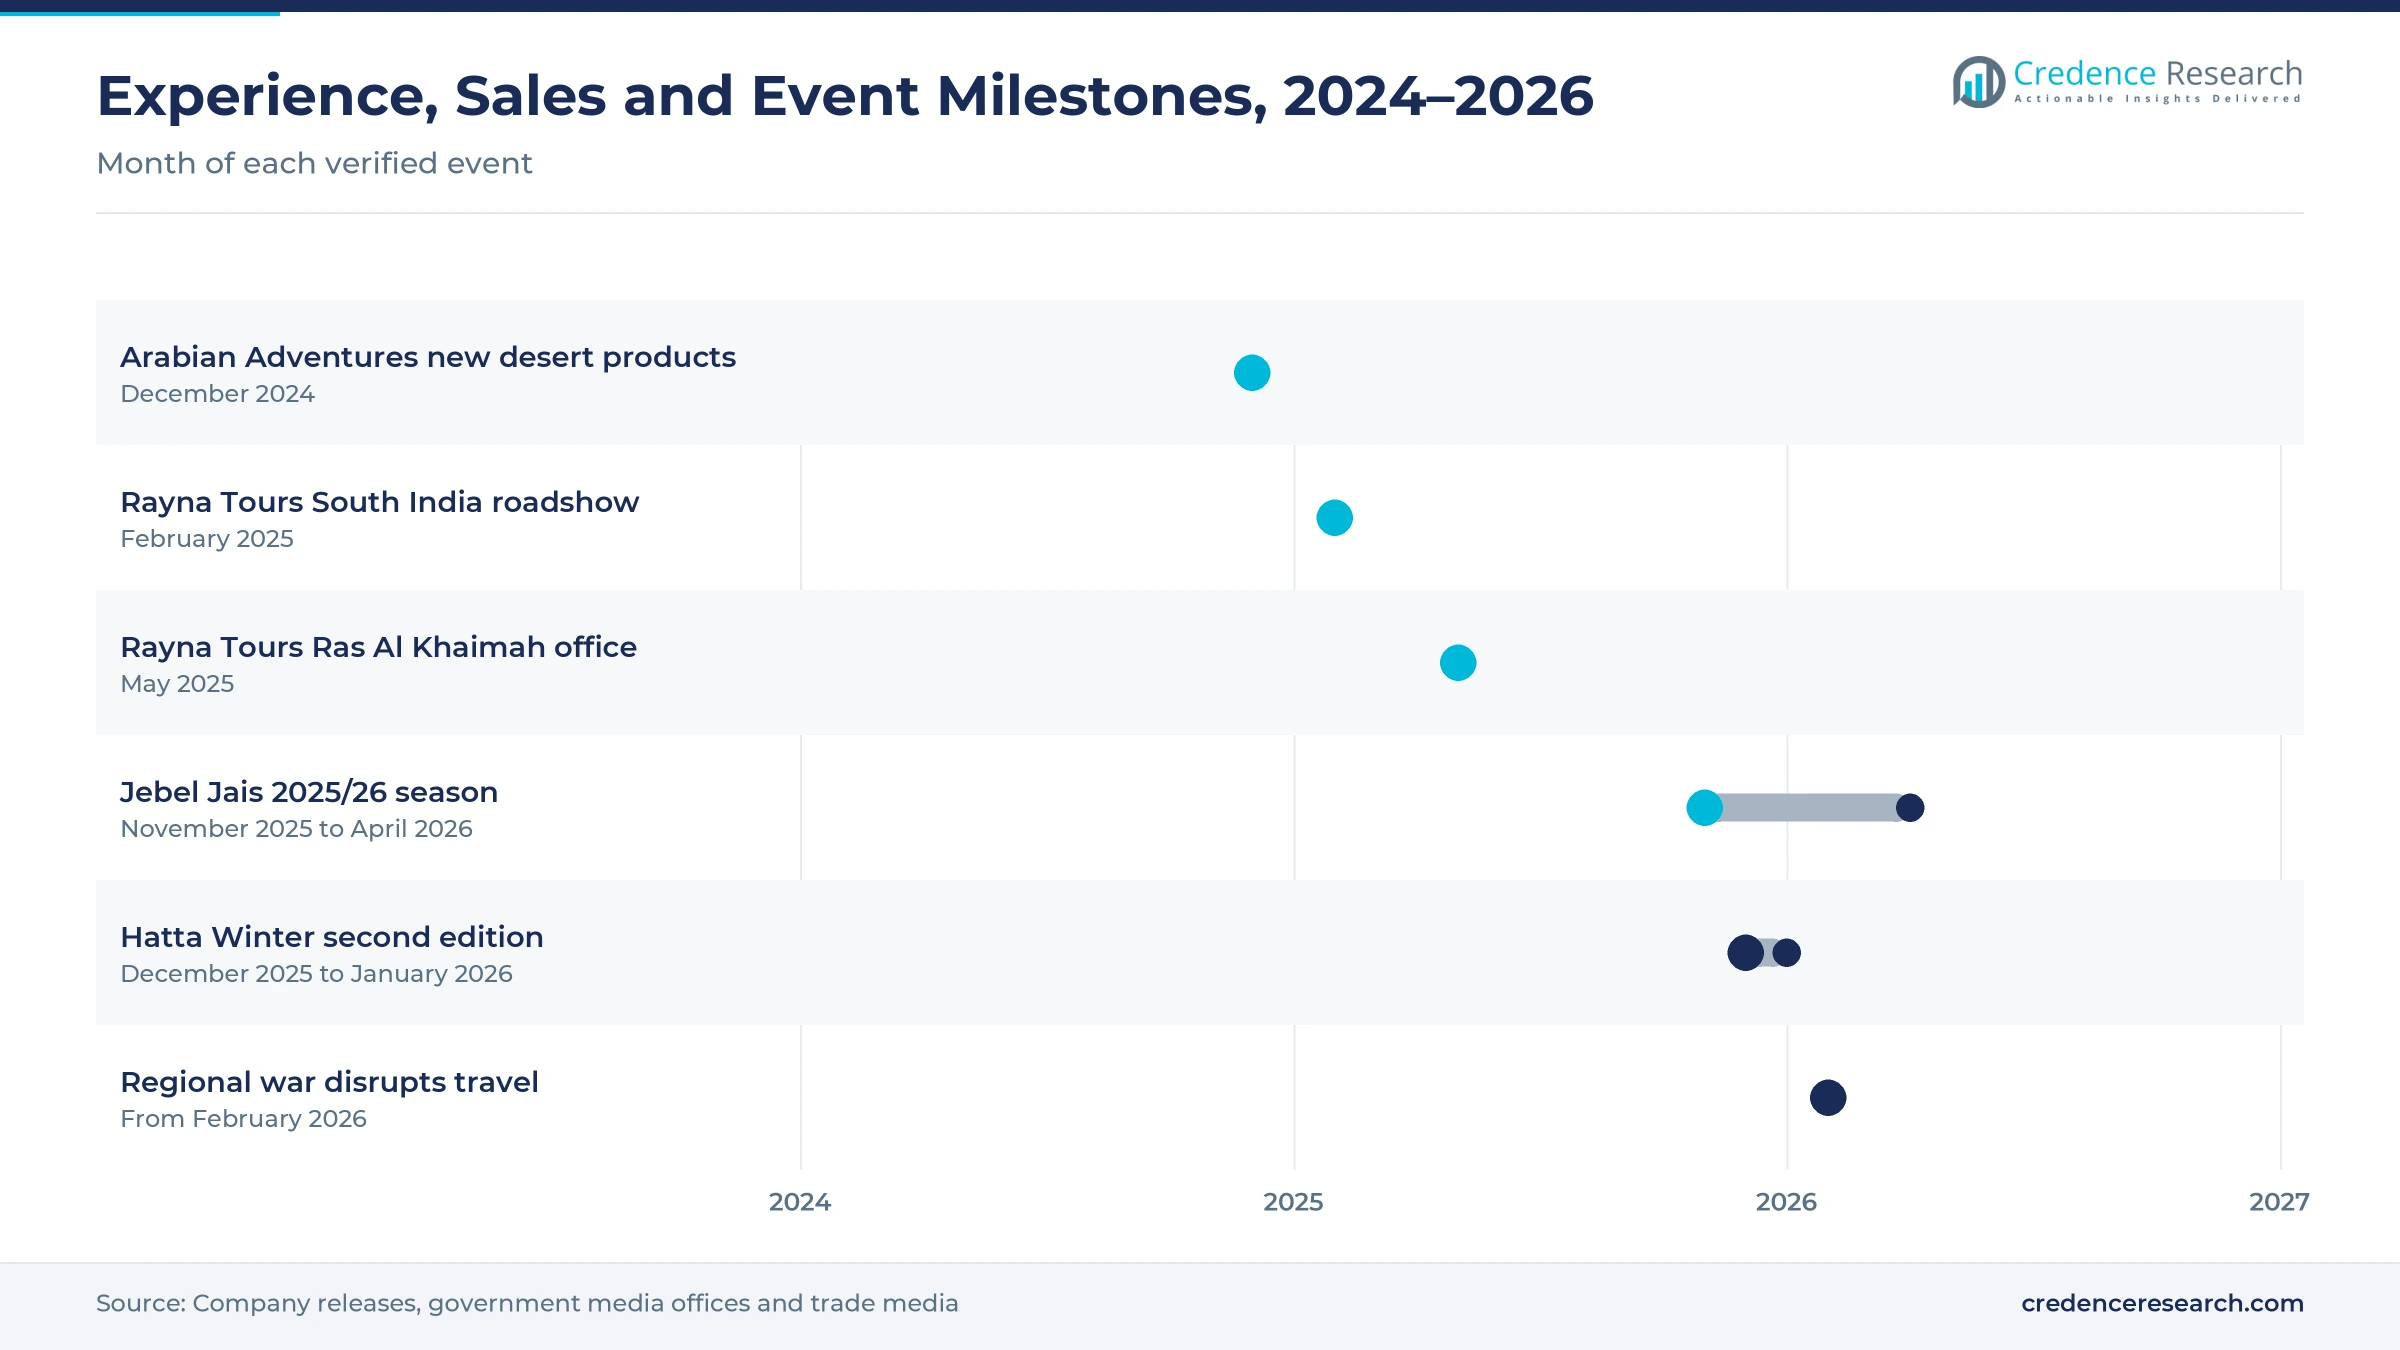
High-spending visitors want exclusive camps and fine dining, so operators are building more expensive desert products. Arabian Adventures, part of the Emirates Group, launched The Fort at Lisaili and a private Veuve Clicquot desert dining experience on Dec. 11, 2024. The Fort sits about a 45-minute drive from Downtown Dubai, while the private lounge format hosts two to eight guests inside the Dubai Desert Conservation Reserve. The company also sold a VIP Dubai World Cup package with a five-night stay from April 4 to April 9, 2025. Platinum Heritage added six new Range Rover vehicles to its Platinum Collection safari. As a result, private customized tours gain share in each desert safari program, because premium guests pay several times the price of a shared trip.
Why is the shift to mountain parks in the north significant?
Jebel Jais and Hatta offer cooler weather, trails and thrill rides that city beaches cannot match, which draws visitors north. The Jebel Jais 2025/26 season opened in November 2025 and runs through April 2026, with Jais Flight billed as the world's longest zipline. The mountain also offers the six-platform Jais Sky Tour and overnight cabins at the Bear Grylls Explorers Camp. A weekend shuttle bus from Jebel Jais to Al Marjan Island and Al Hamra started in late November 2025. In turn, demand for glamping and guided hikes rises, and Ras Al Khaimah gains share faster than the larger emirates.
Can Indian and Asian source markets open new agent sales?
Travelers from India and other Asian countries often book packages through agents and DMCs, which keeps agent sales growing. India sent 11.9 million passengers through Dubai International in 2025, and Indian hotel guests in Abu Dhabi rose 22% to 436,124. Rayna Tours held a UAE leisure roadshow in Hyderabad, Bengaluru and Chennai from Feb. 24 to Feb. 28, 2025, which drew about 200 travel agents. The company opened its third UAE office in Ras Al Khaimah on May 29, 2025, after Dubai and Abu Dhabi. As a result, travel agencies and DMCs remain important for package sales, even as direct booking apps grow at 12.10% a year.
Is new resort supply in Ras Al Khaimah an opening for bundles?
Large resorts sell activities alongside rooms and dining, and Ras Al Khaimah is adding many such properties for bundled experiences. The Wynn Al Marjan Island tower has topped out at 70 stories and will open in 2027 with 1,530 rooms and suites, according to Fast Company Middle East. The Marjan Beach master plan covers 85 million square feet and includes 12,000 hotel keys. Ras Al Khaimah also plans to double its hotel keys by 2030 to host more visitors. In turn, resort-integrated experiences grow at 12.38% a year, as resorts package mountain, sea and desert trips with their room and dining offers for longer stays.
Regional conflict, summer heat and price pressure
How did the 2026 regional conflict cut bookings?
The regional conflict that began on Feb. 28, 2026, cut bookings, because flight disruptions and weaker traveler confidence kept many visitors away. Dubai International handled 18.6 million passengers in the first quarter of 2026, down from 23.4 million a year earlier, according to AltexSoft. As a result, operators cut tours and fleets during the spring. The IMF projects UAE real GDP to fall 3.9% in 2026 before rising 7.7% in 2027.
Why does summer heat limit outdoor operations?
High temperatures make long desert drives, hikes and bike rides unsafe during the middle of the day for much of the year. As a result, many operators shorten trips, move them to early morning or evening and cut prices from June to September. In turn, revenue is concentrated in the cooler months, which raises staffing and fleet pressure in winter. Operators respond with night tours, water activities and indoor alternatives.
How do safety and licensing rules raise costs?
Operators need trained guides, insured vehicles and approved sites for dune driving, diving and aerial rides, which adds fixed costs. As a result, small operators face higher fixed costs than larger firms with their own fleets. Authorities also inspect camps, vehicles and equipment to protect guests. In turn, licensed operators with strong safety records win more hotel and agent contracts, while unlicensed sellers lose access to large channels.
Why does price competition squeeze desert tour margins?
Many operators sell similar safari packages through the same online agencies and hotel desks, which pushes prices down. As a result, commissions and discounts reduce the amount operators keep from each guest. Operators respond with premium private trips, direct booking apps and heritage or conservation themes. In turn, firms that build strong brands can raise prices, while smaller sellers compete mainly on cost.
Abu Dhabi and Dubai lead as northern peaks expand
| Region | Value, 2025 (USD billion) | Share, 2025 | CAGR, 2026–2035 |
|---|---|---|---|
| Abu Dhabi | 1.25 | 47.5% | 11.28% |
| Dubai | 1.19 | 45.0% | 11.68% |
| Ras Al Khaimah | 0.13 | 5.0% | 13.18% |
| Fujairah & Hatta | 0.07 | 2.5% | 12.88% |
Why do Abu Dhabi deserts and events lead spending?
Abu Dhabi held a 47.5% share of 2025 value and grows at 11.28% a year, because the emirate combines large desert areas, island attractions and a busy event calendar. The emirate recorded 26.6 million visitors in 2025, and Liwa Village drew more than 159,000 guests. Al Dhafra Region hosted 147,900 hotel guests, while Al Ain hosted 473,100. As a result, Abu Dhabi keeps the largest share of desert camp and event-linked spending.
How does Dubai turn record arrivals into bookings?
Dubai held a 45.0% share of 2025 value and grows at 11.68% a year, because record arrivals feed desert safaris, skydiving, ziplines and sea trips. Dubai welcomed 19.59 million international overnight visitors in 2025, with Western Europe the largest source region. Skydive Dubai runs tandem jumps over the Palm Drop Zone, and the XLine at Dubai Marina is billed as the longest urban zipline. In turn, yacht charters and water sports add sea-based demand.
Why is Ras Al Khaimah the fastest-growing region?
Ras Al Khaimah held a 5.0% share of 2025 value and grows fastest at 13.18% a year, because Jebel Jais offers mountain rides, trails and camps that are rare elsewhere in the UAE. The emirate received 1.35 million overnight visitors in 2025, up 6%, and aims for more than 3.5 million by 2030. New resorts on Al Marjan Island will also bundle activities with stays. As a result, the region gains share from a small base.
How do Fujairah and Hatta add mountain and sea trips?
Fujairah and Hatta held a 2.5% share of 2025 value and grow at 12.88% a year, because the Hajar Mountains and the east coast offer hiking, kayaking and diving. Hatta Winter drew more than 870,000 visitors to its festivals in its first edition, and a second edition ran into January 2026. Fujairah adds coral reefs and beaches on the Gulf of Oman. In turn, the region attracts many residents on short weekend trips.
Experience launches, roadshows and events in 2024–2026
| Development | Status and market relevance |
|---|---|
| In December 2024, Arabian Adventures launched The Fort at Lisaili and a private Veuve Clicquot desert dining experience in the Dubai Desert Conservation Reserve. | Adds premium desert products |
| In February 2025, Rayna Tours held a UAE leisure roadshow in Hyderabad, Bengaluru and Chennai that drew about 200 travel agents. | Builds Indian agent sales |
| In May 2025, Rayna Tours opened its third UAE office in Ras Al Khaimah, after its Dubai and Abu Dhabi branches. | Extends agent reach to the north |
| In November 2025, the Jebel Jais 2025/26 season opened with guided hikes, a wellness series and a weekend shuttle to Al Marjan Island. | Runs through April 2026 |
| In December 2025, the second edition of Hatta Winter began, running to Jan. 31, 2026. | Extends mountain festival season in Hatta |
Booking apps, safety systems and fleets shape trips
- Mobile booking apps let guests compare, book and pay for trips with instant confirmation, which helps operators sell directly and cut commission costs.
- Vehicle tracking systems show the location of desert fleets and guides in real time, which improves safety and lets camps plan arrivals.
- Safety and rescue equipment such as harness systems, helmets and radios supports ziplines, climbs and dune drives, which meets licensing rules and builds guest trust.
- Dynamic pricing tools adjust prices by season, weekday and group size, which helps operators fill trips during slow summer months.
Need a Custom Version of This Report?
Tailor the scope, geography, or segments to your exact requirements.
- Custom geography or segment scope
- Direct access to our analyst team
Desert operators, aggregators and attraction firms compete
Competition is shaped by long-established desert operators, premium safari brands, attraction operators and booking platforms that sell many products. Arabian Adventures, part of the Emirates Group, sells desert, city and event packages and added new desert products for the 2024/25 season. Platinum Heritage competes in premium heritage safaris with vintage Land Rovers and new Range Rovers. Skydive Dubai runs tandem jumps over the Palm, while the XLine at Dubai Marina sells urban zipline rides. Rayna Tours competes as an agent and DMC with offices in Dubai, Abu Dhabi and Ras Al Khaimah. Rivals compete on safety, guest reviews, price, exclusivity and access to hotel and agent channels. Because many visitors book on review platforms, operators with strong ratings and direct booking tools usually win repeat business.
Which operators run desert, aerial and package trips in the UAE?
| Company | Type | Role in the market |
|---|---|---|
| Arabian Adventures | Desert and destination operator | Launched The Fort at Lisaili and a private desert dining experience in December 2024 |
| Platinum Heritage | Premium safari operator | Added six Range Rovers to its Platinum Collection safari |
| Skydive Dubai | Aerial adventure operator | Runs tandem skydives over the Palm Drop Zone |
| Rayna Tours | Tour operator and DMC | Opened its third UAE office in Ras Al Khaimah in May 2025 |
Credence Research view on Emirati outdoor experiences
Credence Research's view is that Emirati outdoor experiences will recover quickly after the 2026 dip, because the UAE keeps strong flight links, a large hotel base and a growing list of mountain and coastal attractions. Desert and safari experiences remain the largest value pool, while mountain and trail adventures, resort-integrated trips and direct booking apps add the fastest growth. Ras Al Khaimah and Hatta will gain share as new resorts and trails open. Operators that combine strong safety records, premium products and direct digital sales should gain the most.
How the Emirati outdoor experience estimate was built
The report uses 2025 as the base year on a calendar basis, and market values come from the Credence Research model. That model combines visitor and hotel statistics, airport traffic data, IMF growth data and company releases on new experiences and offices. Regional shares follow the Credence Research regional model, while segment splits and growth rates are Credence Research estimates. Sources used are government media office releases, airport statistics, IMF data and company releases reported in trade media, and no interviews or surveys were used.
Recovery and new northern supply carry growth to 2035
The UAE adventure tourism market is expected to reach USD 6.62 billion by 2035, an 11.60% CAGR during 2026–2035, as visitor numbers recover from the 2026 conflict and new attractions open. Growth should be strongest in mountain and trail adventures, resort-integrated trips, direct booking apps and Ras Al Khaimah, because these areas gain most from new supply in the northern emirates. Premium desert products and Indian source markets will lift value, while summer heat and price competition could slow some operators.
Frequently Asked Questions
How big is the UAE adventure tourism market?
Why does market value dip in 2026?
Which service type leads Emirati outdoor spending?
Which region leads the UAE market?
How many visitors did Dubai welcome in 2025?
Which booking channel is growing fastest?
Who are the leading companies in the UAE market?
What are the main challenges for operators in the UAE?
Table of Content
Chapter 1 Market Segmentation
- 1.1 Segmentation Framework
- 1.1.1 Product and Service Classification
- 1.1.2 Application and End-Use Classification
- 1.1.3 Technology and Solution Classification
- 1.1.4 Customer and Distribution Channel Classification
- 1.1.5 Geographic Segmentation
- 1.1.6 Market Segment Definitions and Boundaries
- 1.2 By Service Type
- 1.2.1 Desert & Safari Experiences
- 1.2.2 Mountain & Trail Adventures
- 1.2.3 Water-Based Adventures
- 1.2.4 Air & Aerial Adventures
- 1.3 By Customer Type
- 1.3.1 International Leisure Travelers
- 1.3.2 UAE Residents
- 1.3.3 Families & Multi-Generational Groups
- 1.3.4 Corporate & Institutional Groups
- 1.4 By Delivery Model
- 1.4.1 Guided Small-Group Tours
- 1.4.2 Private Customized Tours
- 1.4.3 Self-Guided Activity Access
- 1.4.4 Resort-Integrated Experiences
- 1.5 By Channel
- 1.5.1 Operator Websites & Apps
- 1.5.2 Online Travel Agencies
- 1.5.3 Hotel & Concierge Desks
- 1.5.4 Travel Agencies & DMCs
Chapter 2 Introduction
- 2.1 Report Objectives and Scope
- 2.2 Product Definition and Industry Terminology
- 2.3 Market Inclusions and Exclusions
- 2.4 Research Process
- 2.4.1 Primary Research and Expert Interviews
- 2.4.2 Secondary Research and Source Review
- 2.4.3 Top-Down and Bottom-Up Estimation
- 2.4.4 Data Triangulation and Verification
- 2.5 Market Size Measurement Basis
- 2.5.1 2025: USD 2.64 billion → 2035: USD 6.62 billion
- 2.6 Historical and Forecast Reference Periods
- 2.6.1 Historical Period: 2018-2025
- 2.6.2 Base Year: 2025
- 2.6.3 Forecast Period: 2025-2035
- 2.7 Research Assumptions and Limitations
Chapter 3 Executive Summary
- 3.1 Market Snapshot and Key Findings
- 3.2 Base-Year Market Size, 2025
- 3.3 Forecast Market Size, 2035
- 3.4 Revenue and Volume Growth Outlook
- 3.5 Key Demand and Supply Indicators
- 3.6 Leading Market Segments
- 3.7 Fastest-Growing Market Opportunities
- 3.8 Regional Performance Highlights
- 3.9 Technology and Industry Transformation
- 3.10 Competitive Landscape Summary
- 3.11 Analyst View and Strategic Implications
Chapter 4 UAE Adventure Tourism Market Trends and Developments
- 4.1 Historical Industry Development, 2018-2025
- 4.2 Recent Market Trends and Developments
- 4.3 Demand and Customer Behavior Trends
- 4.4 Technology and Product Innovation
- 4.5 Artificial Intelligence, Automation and Digitalization
- 4.6 Local Manufacturing and Supply Chain Realignment
- 4.7 Industry Partnerships, Mergers and Acquisitions
- 4.8 Sustainability and Circular Economy Developments
- 4.9 Government and Private Sector Investment Trends
- 4.10 Emerging Business Models and Commercialization
- 4.11 Industry Developments and Announcements
Chapter 5 UAE Adventure Tourism Market Supply and Demand Analysis
- 5.1 Demand Trend and Consumption Analysis, 2018-2025
- 5.2 Demand Forecast, 2025-2035
- 5.3 Supply Chain Structure and Procurement Trends
- 5.4 Supply-Demand Gap and Bottlenecks
- 5.5 Import Dependence and Sourcing Structure
- 5.6 Regional Supply and Demand Concentration
Chapter 6 UAE Adventure Tourism Market Pricing Analysis
- 6.1 Pricing Structure and Measurement
- 6.2 Historical Pricing Trends, 2018-2025
- 6.3 Pricing Outlook, 2025-2035
- 6.4 Pricing by Product and Market Segment
- 6.5 Geographic Pricing Differences
- 6.6 Key Input, Energy, Labor and Logistics Costs
- 6.7 Contract Pricing and Purchasing Models
- 6.8 Pricing Sensitivity and Competitive Positioning
- 6.9 Price, Margin and Profitability Implications
Chapter 7 UAE Adventure Tourism Market Dynamics
- 7.1 Market Growth Drivers
- 7.1.1 Demand-Side Drivers
- 7.1.2 Technology and Innovation Drivers
- 7.1.3 Infrastructure and Investment Drivers
- 7.1.4 Regulatory and Policy Drivers
- 7.2 Market Restraints
- 7.2.1 Cost and Affordability Constraints
- 7.2.2 Technology and Adoption Barriers
- 7.2.3 Supply Chain and Operational Constraints
- 7.3 Market Challenges
- 7.3.1 Competitive Pressure and Margin Erosion
- 7.3.2 Skills, Infrastructure and Implementation Gaps
- 7.4 Emerging Market Opportunities
- 7.5 Market Dynamics Impact and Time-Horizon Assessment
Chapter 8 UAE Adventure Tourism Value Chain Analysis
- 8.1 Industry Value Chain Overview
- 8.2 Upstream Suppliers and Critical Inputs
- 8.3 Technology and Component Providers
- 8.4 Manufacturing or Service Delivery
- 8.5 Distribution, Channel Partners and Integrators
- 8.6 Downstream Applications and End Users
- 8.7 Value Addition and Profit Pools
- 8.8 Vertical Integration and Outsourcing
- 8.9 Supplier Concentration and Risk
- 8.10 Supply Chain Localization and Resilience
Chapter 9 UAE Adventure Tourism Market Regulations and Policies
- 9.1 Relevant Laws, Standards and Compliance Frameworks
- 9.2 Product, Service, Safety and Quality Requirements
- 9.3 Government Policies, Incentives and Subsidies
- 9.4 Imports, Exports and Trade Barriers
- 9.5 Public Procurement and Local Content Requirements
- 9.6 Data Protection, AI and Cybersecurity Compliance
- 9.7 Upcoming Policy Changes and Market Implications
Chapter 10 UAE Adventure Tourism Market Hotspots and Opportunities
- 10.1 Market Opportunity Mapping and Growth Hotspots
- 10.2 High-Growth Applications and Customer Groups
- 10.3 Underserved Markets and White-Space Opportunities
- 10.4 Emerging Technology and Product Opportunities
- 10.5 New Capacity and Investment Hotspots
- 10.6 Market Entry and Expansion Opportunities
- 10.7 Distribution and Partnership Opportunities
- 10.8 Near-Term and Long-Term Commercial Potential
- 10.9 Opportunity Attractiveness and Execution Risks
Chapter 11 UAE Adventure Tourism Market Outlook, 2025-2035
- 11.1 Market Size and Analysis
- 11.1.1 Revenue (Market Measurement: 2025: USD 2.64 billion → 2035: USD 6.62 billion)
- 11.1.2 Historical Market Size, 2018-2025
- 11.1.3 Base-Year Market Size, 2025
- 11.2 Market Forecast, 2025-2035
- 11.2.1 Revenue Forecast to 2035
- 11.2.2 CAGR and Year-on-Year Growth
- 11.2.3 Incremental Revenue Opportunity
- 11.3 Forecast Assumptions and Scenario Analysis
- 11.3.1 Base-Case Forecast
- 11.3.2 Optimistic and Conservative Scenarios
- 11.3.3 Technology, Pricing and Policy Sensitivities
- 11.4 Market Attractiveness and Growth Outlook
Chapter 12 UAE Adventure Tourism Market Segmentation and Outlook
- 12.1 Segmentation Summary and Market Shares, 2025
- 12.2 Largest and Fastest-Growing Segments
- 12.3 By Service Type - Market Size and Forecast, 2025-2035
- 12.3.1 Segment Definition and Scope
- 12.3.2 Historical Market Size, 2018-2025
- 12.3.3 Revenue Forecast, 2025-2035
- 12.3.4 Base-Year Market Share, 2025
- 12.3.5 Segment CAGR and Growth Drivers
- 12.3.6 Subsegment Market Size and Forecast
- 12.3.6.1 Desert & Safari Experiences
- 12.3.6.2 Mountain & Trail Adventures
- 12.3.6.3 Water-Based Adventures
- 12.3.6.4 Air & Aerial Adventures
- 12.3.7 Subsegment Pricing and Adoption Trends
- 12.3.8 Leading Suppliers and Competition
- 12.3.9 Regional Demand and Opportunities
- 12.4 By Customer Type - Market Size and Forecast, 2025-2035
- 12.4.1 Segment Definition and Scope
- 12.4.2 Historical Market Size, 2018-2025
- 12.4.3 Revenue Forecast, 2025-2035
- 12.4.4 Base-Year Market Share, 2025
- 12.4.5 Segment CAGR and Growth Drivers
- 12.4.6 Subsegment Market Size and Forecast
- 12.4.6.1 International Leisure Travelers
- 12.4.6.2 UAE Residents
- 12.4.6.3 Families & Multi-Generational Groups
- 12.4.6.4 Corporate & Institutional Groups
- 12.4.7 Subsegment Pricing and Adoption Trends
- 12.4.8 Leading Suppliers and Competition
- 12.4.9 Regional Demand and Opportunities
- 12.5 By Delivery Model - Market Size and Forecast, 2025-2035
- 12.5.1 Segment Definition and Scope
- 12.5.2 Historical Market Size, 2018-2025
- 12.5.3 Revenue Forecast, 2025-2035
- 12.5.4 Base-Year Market Share, 2025
- 12.5.5 Segment CAGR and Growth Drivers
- 12.5.6 Subsegment Market Size and Forecast
- 12.5.6.1 Guided Small-Group Tours
- 12.5.6.2 Private Customized Tours
- 12.5.6.3 Self-Guided Activity Access
- 12.5.6.4 Resort-Integrated Experiences
- 12.5.7 Subsegment Pricing and Adoption Trends
- 12.5.8 Leading Suppliers and Competition
- 12.5.9 Regional Demand and Opportunities
- 12.6 By Channel - Market Size and Forecast, 2025-2035
- 12.6.1 Segment Definition and Scope
- 12.6.2 Historical Market Size, 2018-2025
- 12.6.3 Revenue Forecast, 2025-2035
- 12.6.4 Base-Year Market Share, 2025
- 12.6.5 Segment CAGR and Growth Drivers
- 12.6.6 Subsegment Market Size and Forecast
- 12.6.6.1 Operator Websites & Apps
- 12.6.6.2 Online Travel Agencies
- 12.6.6.3 Hotel & Concierge Desks
- 12.6.6.4 Travel Agencies & DMCs
- 12.6.7 Subsegment Pricing and Adoption Trends
- 12.6.8 Leading Suppliers and Competition
- 12.6.9 Regional Demand and Opportunities
- 12.7 Segment Growth Comparison
- 12.8 Segment Attractiveness and Priority Matrix
Chapter 13 UAE Adventure Tourism End-Use and Application Market Outlook
- 13.1 End-Use Industry and Customer Demand Structure
- 13.2 Leading Applications and Customer Groups
- 13.3 End-Use Market Size, Share and Forecast
- 13.4 Major End-Use Industry Deep Dives
- 13.4.1 Customer Requirements and Use Cases
- 13.4.2 Demand and Replacement Cycles
- 13.4.3 Technical and Regulatory Considerations
- 13.4.4 Purchasing and Procurement Models
- 13.4.5 Leading Vendors and Distribution Channels
- 13.4.6 Forecast and Commercial Opportunities
- 13.5 Emerging Applications and Cross-Segment Demand
- 13.6 End-Use Industry Investment Priorities
Chapter 14 UAE Adventure Tourism Geographic Market Outlook, 2025-2035
- 14.1 Domestic Market Distribution and Demand Clusters
- 14.2 State- or Province-Wise Market Size and Forecast, 2025-2035
- 14.3 City and Metropolitan Market Outlook
- 14.4 Industrial, Manufacturing and Commercial Clusters
- 14.5 Geographic Concentration of Key End Users
- 14.6 Local Pricing and Purchasing Differences
- 14.7 Domestic Production Facilities and Capacity Map
- 14.8 Local Infrastructure and Project Pipeline
- 14.9 State-Level Policy and Incentive Differences
- 14.10 Subnational Investment Hotspots and Opportunities
- 14.11 Distribution and Logistics Networks
- 14.12 Domestic Competitive Footprint
Chapter 15 UAE Adventure Tourism Technology, Innovation and Sustainability Outlook
- 15.1 Technology Landscape and Maturity
- 15.2 Product, Process and Service Innovation
- 15.3 AI, Automation and Digital Tools in the Industry
- 15.4 Technology Adoption and Performance Benchmarking
- 15.5 Innovation Pipeline and R&D Investment
- 15.6 Energy Efficiency and Resource Management
- 15.7 Sustainability, Recycling and Circularity
- 15.8 Technology Roadmap, 2025-2035
- 15.9 Risks of Obsolescence and Technology Substitution
Chapter 16 UAE Adventure Tourism Market Key Strategic Imperatives
- 16.1 Growth and Market Entry Priorities
- 16.2 High-Return Products and Segments
- 16.3 Pricing, Profitability and Cost Optimization
- 16.4 Technology Investment and Product Differentiation
- 16.5 Supply Chain Localization and Resilience
- 16.6 Distribution and Customer Acquisition
- 16.7 Partnership, Acquisition and Capacity Strategy
- 16.8 Regional Expansion Priorities
- 16.9 Short-, Medium- and Long-Term Actions
Chapter 17 Competition Outlook
- 17.1 Industry Competition Characteristics
- 17.2 Market Structure and Concentration
- 17.3 Market Share and Competitive Positioning, 2025
- 17.4 Company-Wise Revenue and Product Benchmarking
- 17.5 Production and Service Capacity Benchmarking
- 17.6 Technology, Pricing and Differentiation
- 17.7 Regional Footprint and Distribution Strength
- 17.8 Mergers, Acquisitions and Strategic Alliances
- 17.9 New Entrants and Competitive Threats
- 17.10 Porter's Five Forces and Industry Attractiveness
- 17.11 Competitive Outlook, 2025-2035
Chapter 18 Company Profiles
- 18.1 Company Coverage and Selection Criteria
- 18.2 Arabian Adventures
- 18.2.1 Business Description
- 18.2.2 Company Ownership and Geographic Presence
- 18.2.3 Product and Service Portfolio
- 18.2.4 Manufacturing and Operating Footprint
- 18.2.5 Financial Performance and Investment
- 18.2.6 Market Share and Competitive Position
- 18.2.7 Technology and Innovation Capabilities
- 18.2.8 Strategic Alliances or Partnerships
- 18.2.9 Recent Developments
- 18.2.10 Growth Strategy and Outlook
- 18.3 Desert Adventures Tourism
- 18.4 Platinum Heritage
- 18.5 OceanAir Travels
- 18.6 Rayna Tours
- 18.7 Skydive Dubai
- 18.8 XDubai
- 18.9 Arabian Expedition
- 18.10 Big Red Adventure Tours
- 18.11 Hatta Outdoor
- 18.12 Other Relevant Market Participants
Note: Every listed company is profiled on the structure shown under the first company. The company list is preliminary and may change based on research findings, market developments, data availability and client requirements.
Chapter 19 Disclaimer
- 19.1 Research and Forecast Disclaimer
- 19.2 Data Source and Estimation Limitations
Note: The depth of individual sections depends on data availability for this market. Volume, capacity, trade and other unit-based metrics are included where applicable.

