
Theme parks and social venues draw growing city crowds
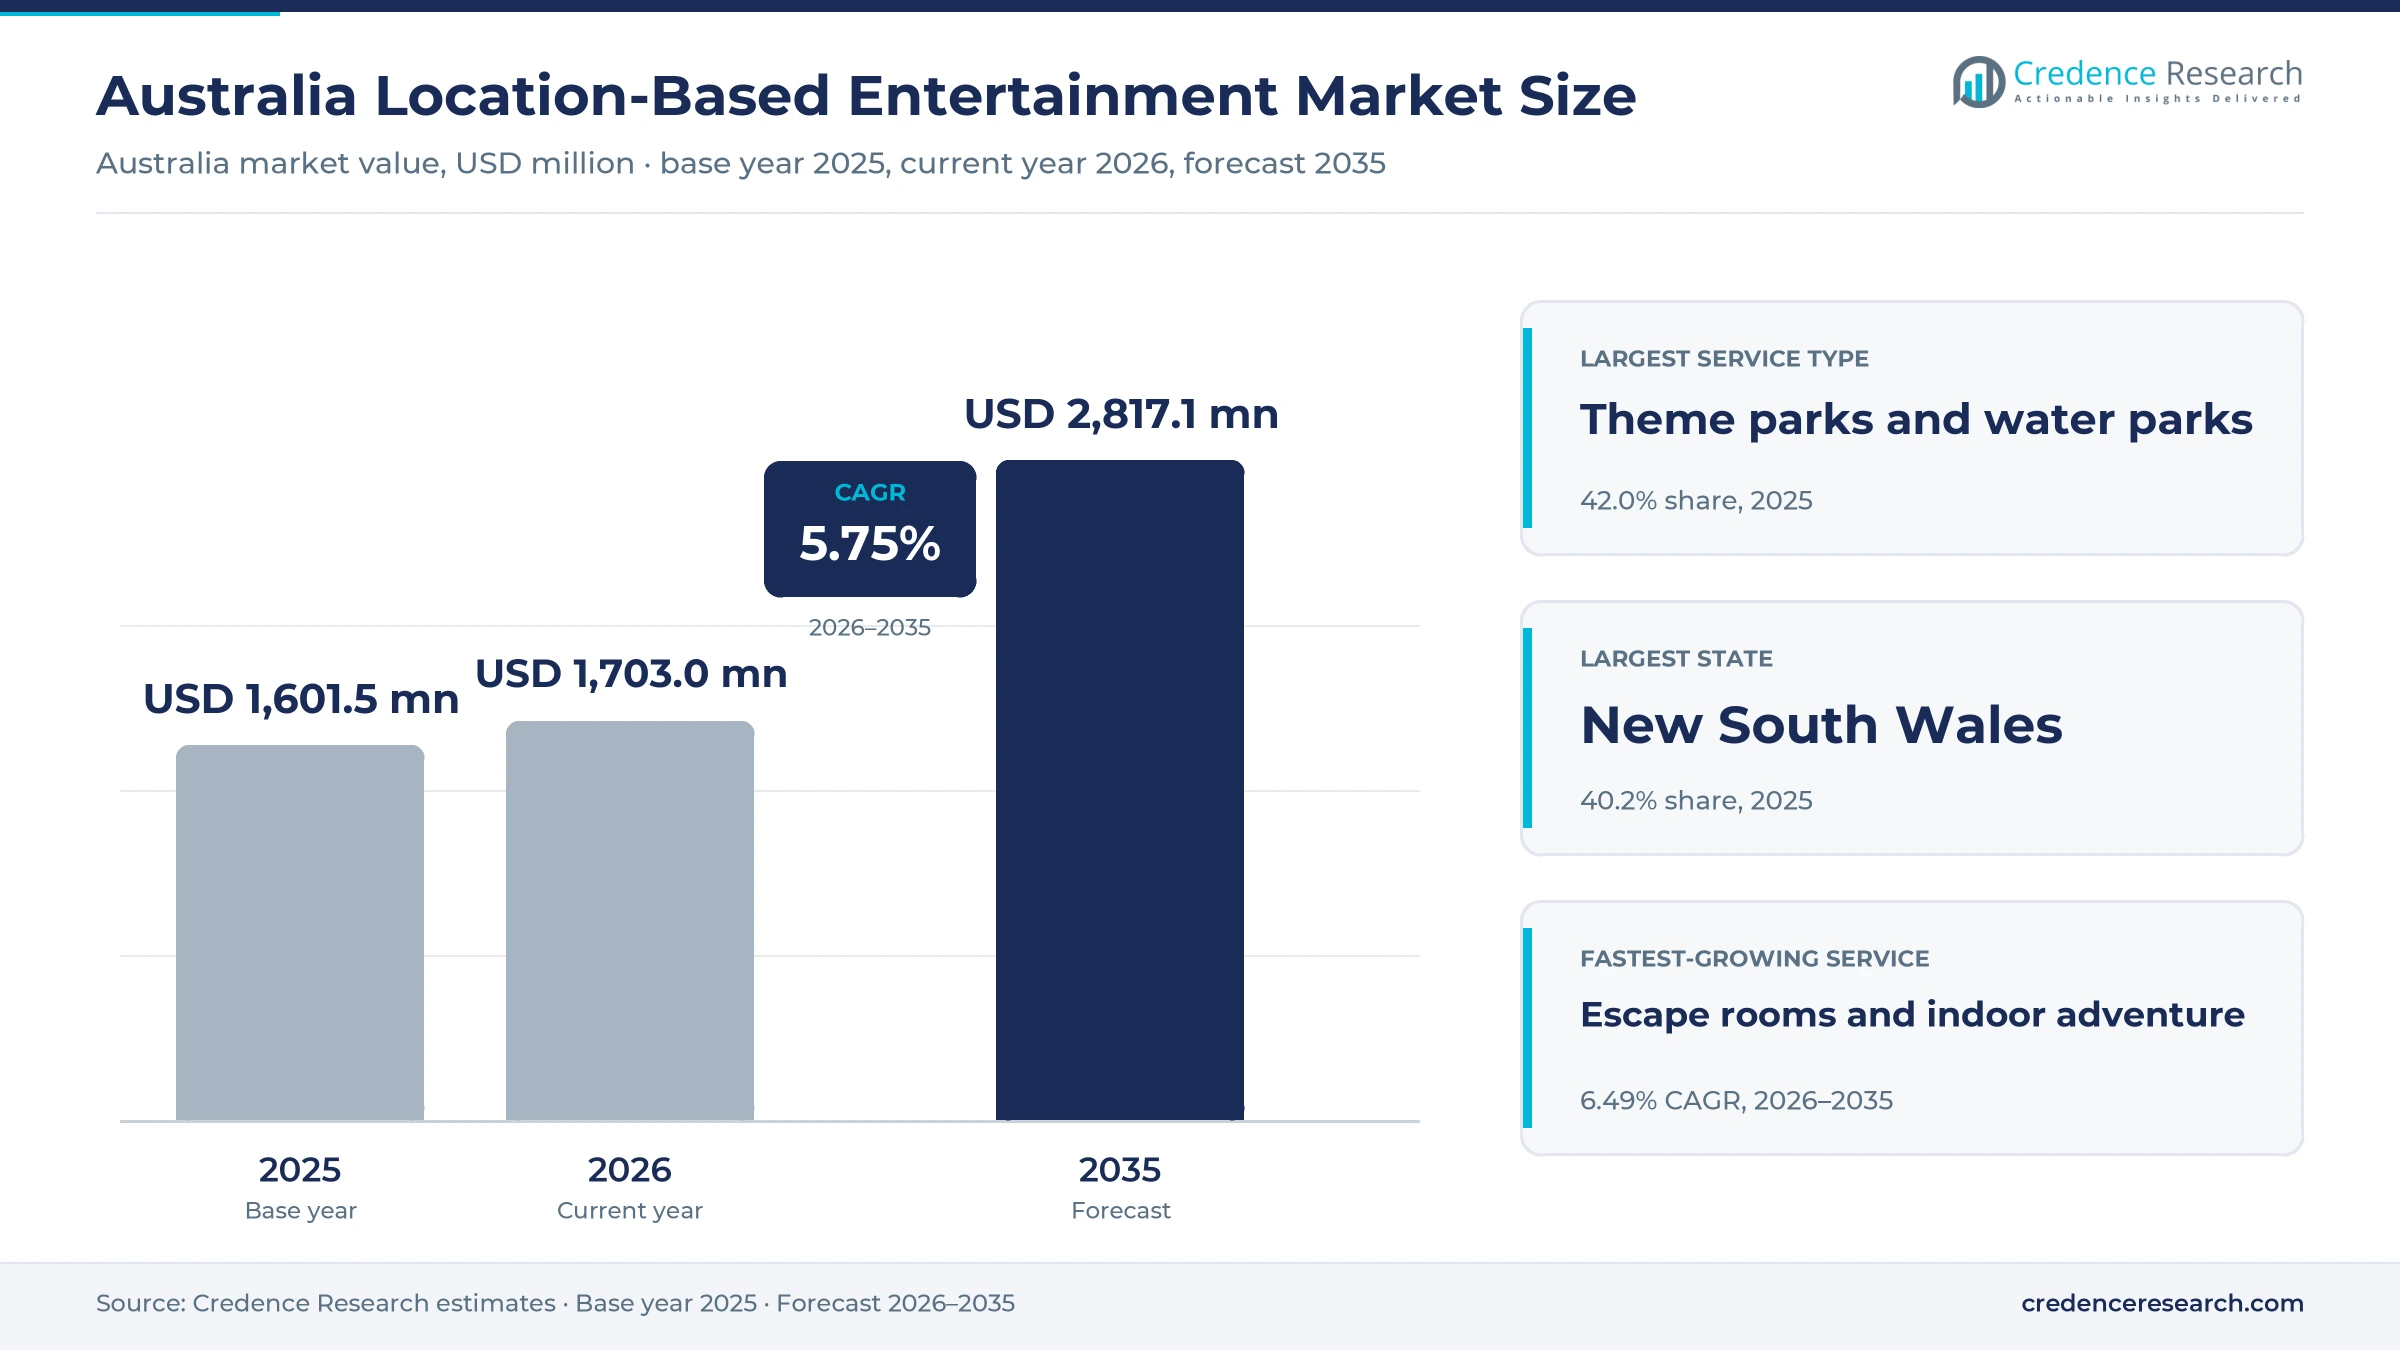
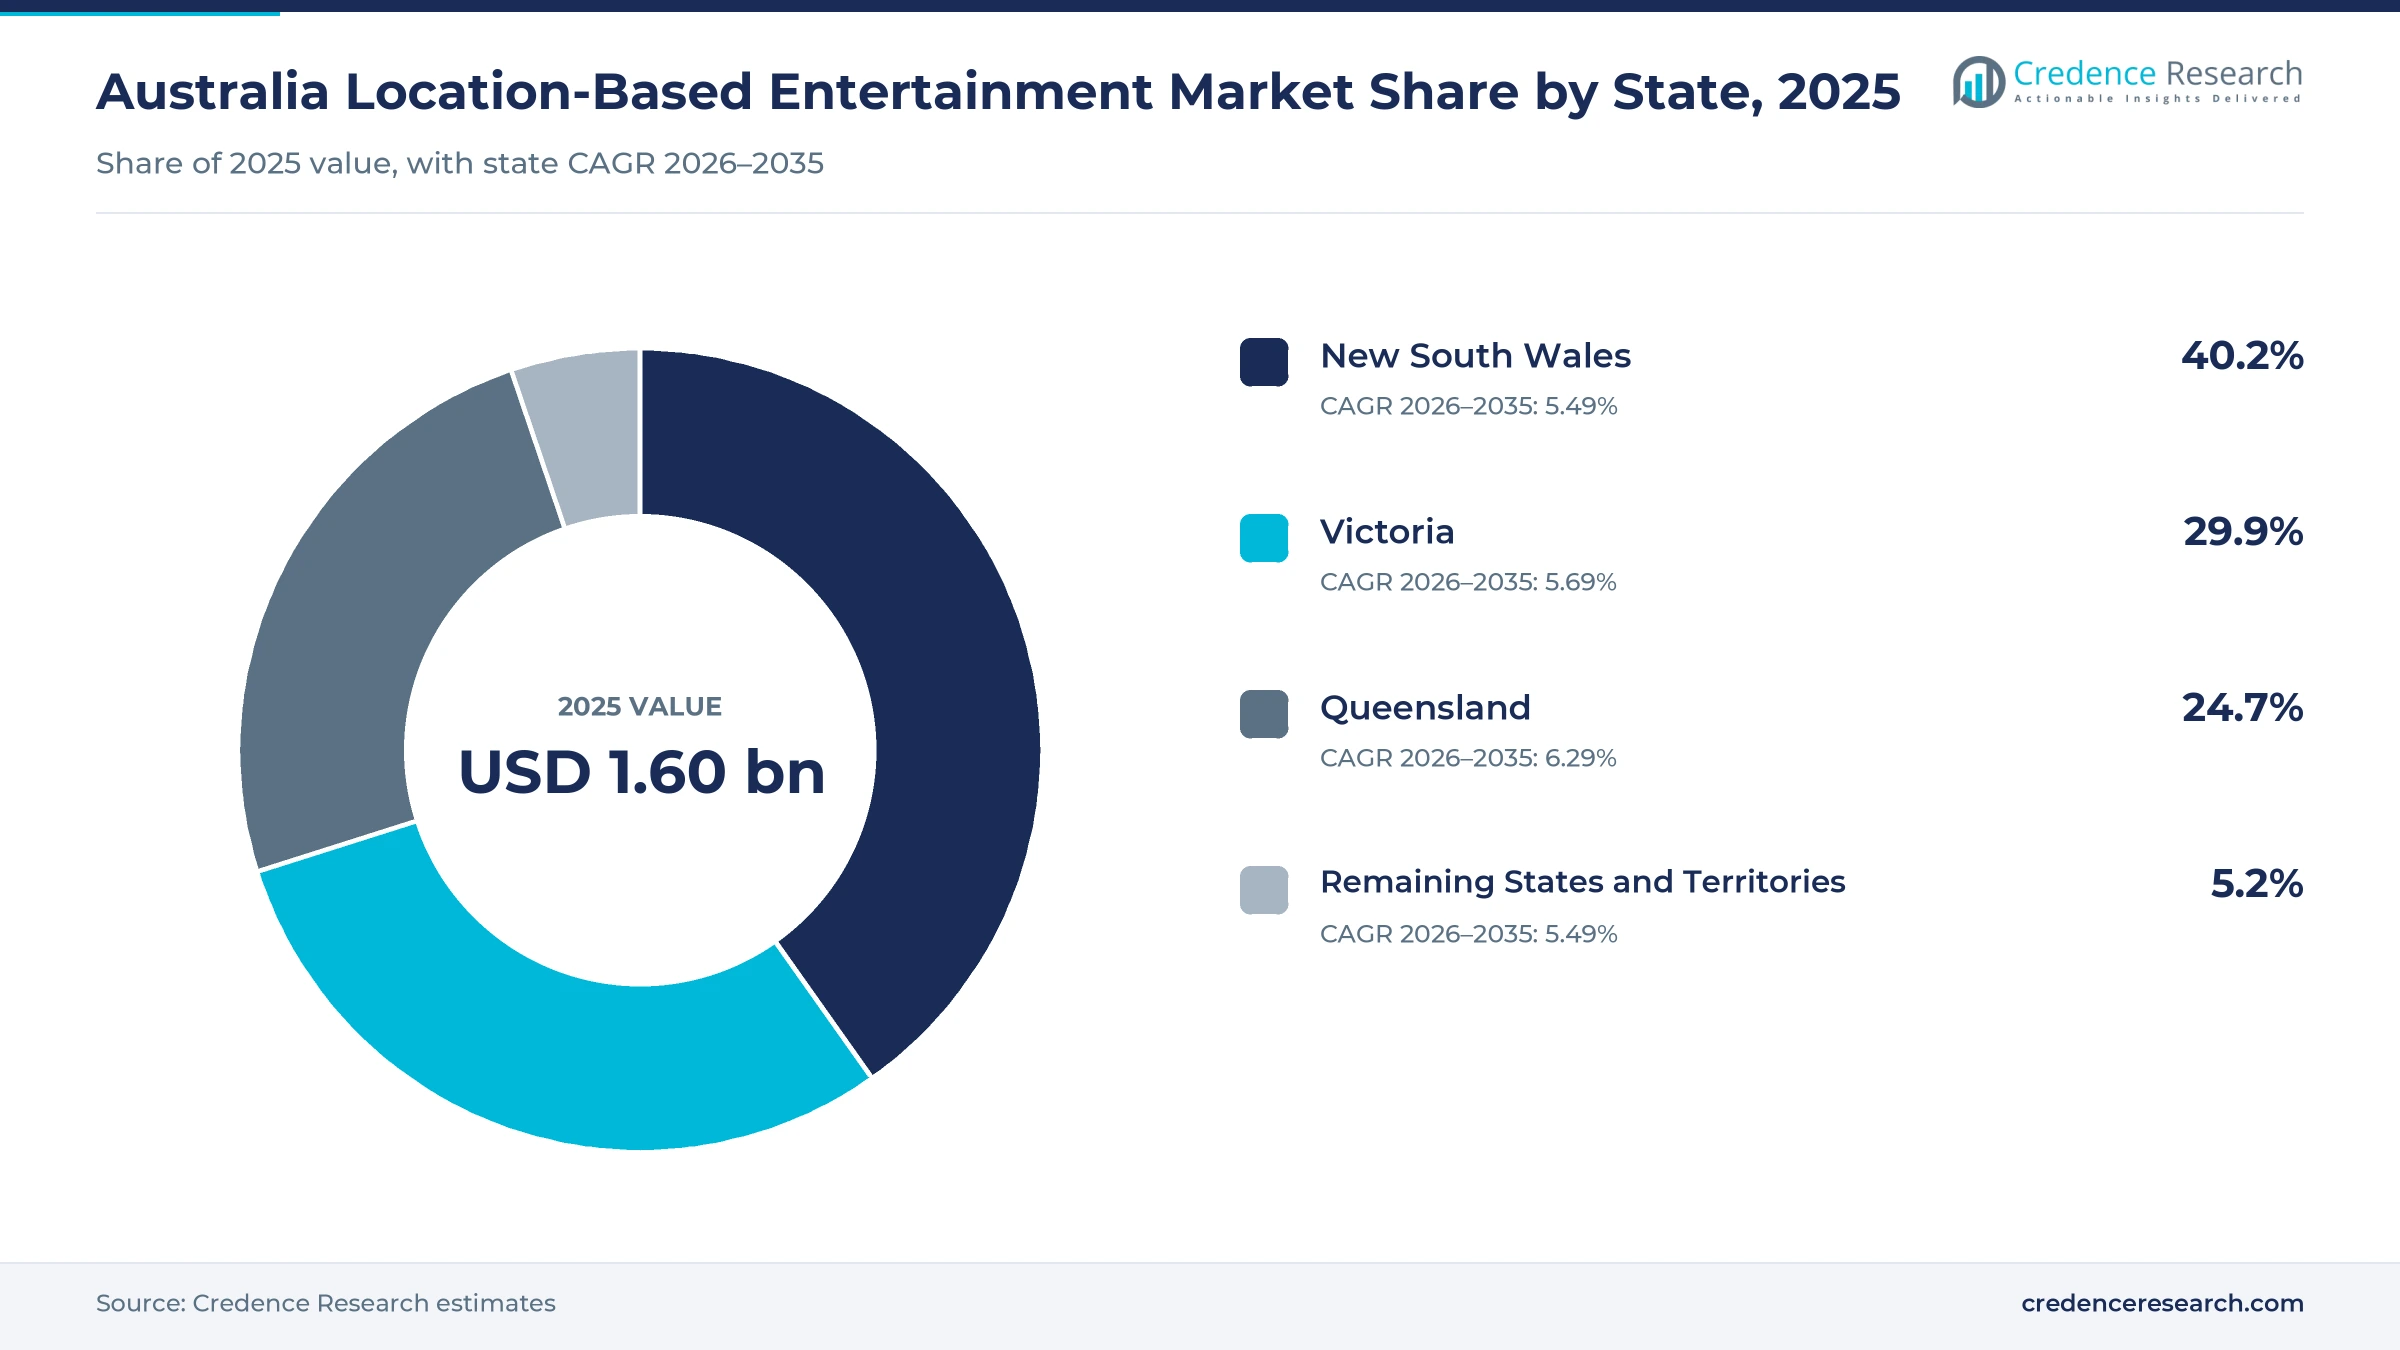
The Australia location-based entertainment market was valued at USD 1.60 billion in 2025 and is projected to increase from USD 1.70 billion in 2026 to USD 2.82 billion by 2035, registering a CAGR of 5.75% during 2026–2035. Demand comes from families, young adults, tourists, schools and corporate groups that pay for theme parks, water parks, arcades, bowling, mini golf, escape rooms and immersive attractions. New South Wales held the largest state share, 40.2% in 2025, because Sydney has the largest resident catchment and the most international arrivals. Queensland is the fastest-growing state at 6.29% a year, as Gold Coast theme parks add rides and international holiday spending recovers. In turn, operators are moving toward online booking, timed sessions and adult-focused social venues that combine games with food and drinks.
Which parks, venues and attractions are counted?
The estimate measures consumer and group spending in Australia on admission, play credits, sessions, passes and packages at theme parks, water parks, family entertainment centers, escape rooms, indoor adventure venues and immersive or specialist attractions. It counts sales made online, at the venue and through travel and group intermediaries.
The estimate excludes cinemas, casinos, live concerts, sports stadiums, museums run as public institutions and food and drink sold separately from entertainment packages. The value chain runs from ride, game and content suppliers through corporate, franchise and independent operators to residents, tourists, schools and companies.
Australia Location-Based Entertainment Market Insights
- The Australia location-based entertainment market was valued at USD 1.60 billion in 2025 and is projected to reach USD 2.82 billion by 2035, at a 5.75% CAGR during 2026–2035.
- New South Wales held a 40.2% share of 2025 value, as Sydney combines the largest resident catchment with the most international visitors.
- Theme parks and water parks led service types with a 42.0% share of 2025 value, because large Gold Coast and Sydney parks draw high spend per visit.
- Coast Entertainment attractions drew about two million visits in the year to June 2026, up 29.3% on the previous year.
- Escape rooms and indoor adventure grow fastest at 6.49% a year during 2026–2035, as adults book timed group sessions online.
Theme parks lead while escape rooms grow fastest
Why do theme parks and water parks lead spending?
Based on service type, the market is categorized into theme parks and water parks, family entertainment centres, escape rooms and indoor adventure, and immersive and specialist attractions. Theme Parks and Water Parks led with a 42.0% share of 2025 value, because day tickets and annual passes carry the highest spend per visit. Escape Rooms and Indoor Adventure grow fastest at 6.49% a year, as small groups book themed sessions in city venues.
Do families or tourists drive more visits?
Based on customer type, the market is categorized into resident families, resident adults, international visitors and institutional buyers. Resident Families led with a 46.0% share of 2025 value, because school holidays, weekends and birthday parties fill parks and family centers. International Visitors grow fastest at 6.50% a year, as holiday arrivals return to Gold Coast and Sydney attractions.
Why do corporate operators hold most venues?
Based on operating model, the market is categorized into corporate operated, franchise operated and independent operated venues. Corporate Operated led with a 62.0% share of 2025 value, because large park owners and multi-brand venue groups run most high-traffic sites. Franchise Operated venues grow fastest at 6.33% a year, as smaller operators license proven formats in suburban centers.
How fast is online booking replacing gate sales?
Based on channel, the market is categorized into direct digital, direct onsite and intermediaries. Direct Digital led with a 51.0% share of 2025 value, because parks and venues push online tickets, timed sessions and passes. Direct Digital also grows fastest at 6.35% a year, as operators use dynamic pricing and app-based play credits to manage crowds and lift spending per visit.
| Segment Group | Leading Sub-segment | Share, 2025 | Fastest-growing Sub-segment | CAGR, 2026–2035 |
|---|---|---|---|---|
| By Service Type | Theme Parks and Water Parks | 42.0% | Escape Rooms and Indoor Adventure | 6.49% |
| By Customer Type | Resident Families | 46.0% | International Visitors | 6.50% |
| By Operating Model | Corporate Operated | 62.0% | Franchise Operated | 6.33% |
| By Channel | Direct Digital | 51.0% | Direct Digital | 6.35% |
Request a Free Sample
Fill in your details and we'll send you a free sample report.
- Sample data tables & charts
- Research methodology
Population, returning tourists and new formats lift visits
How does resident catchment expansion lift visits?
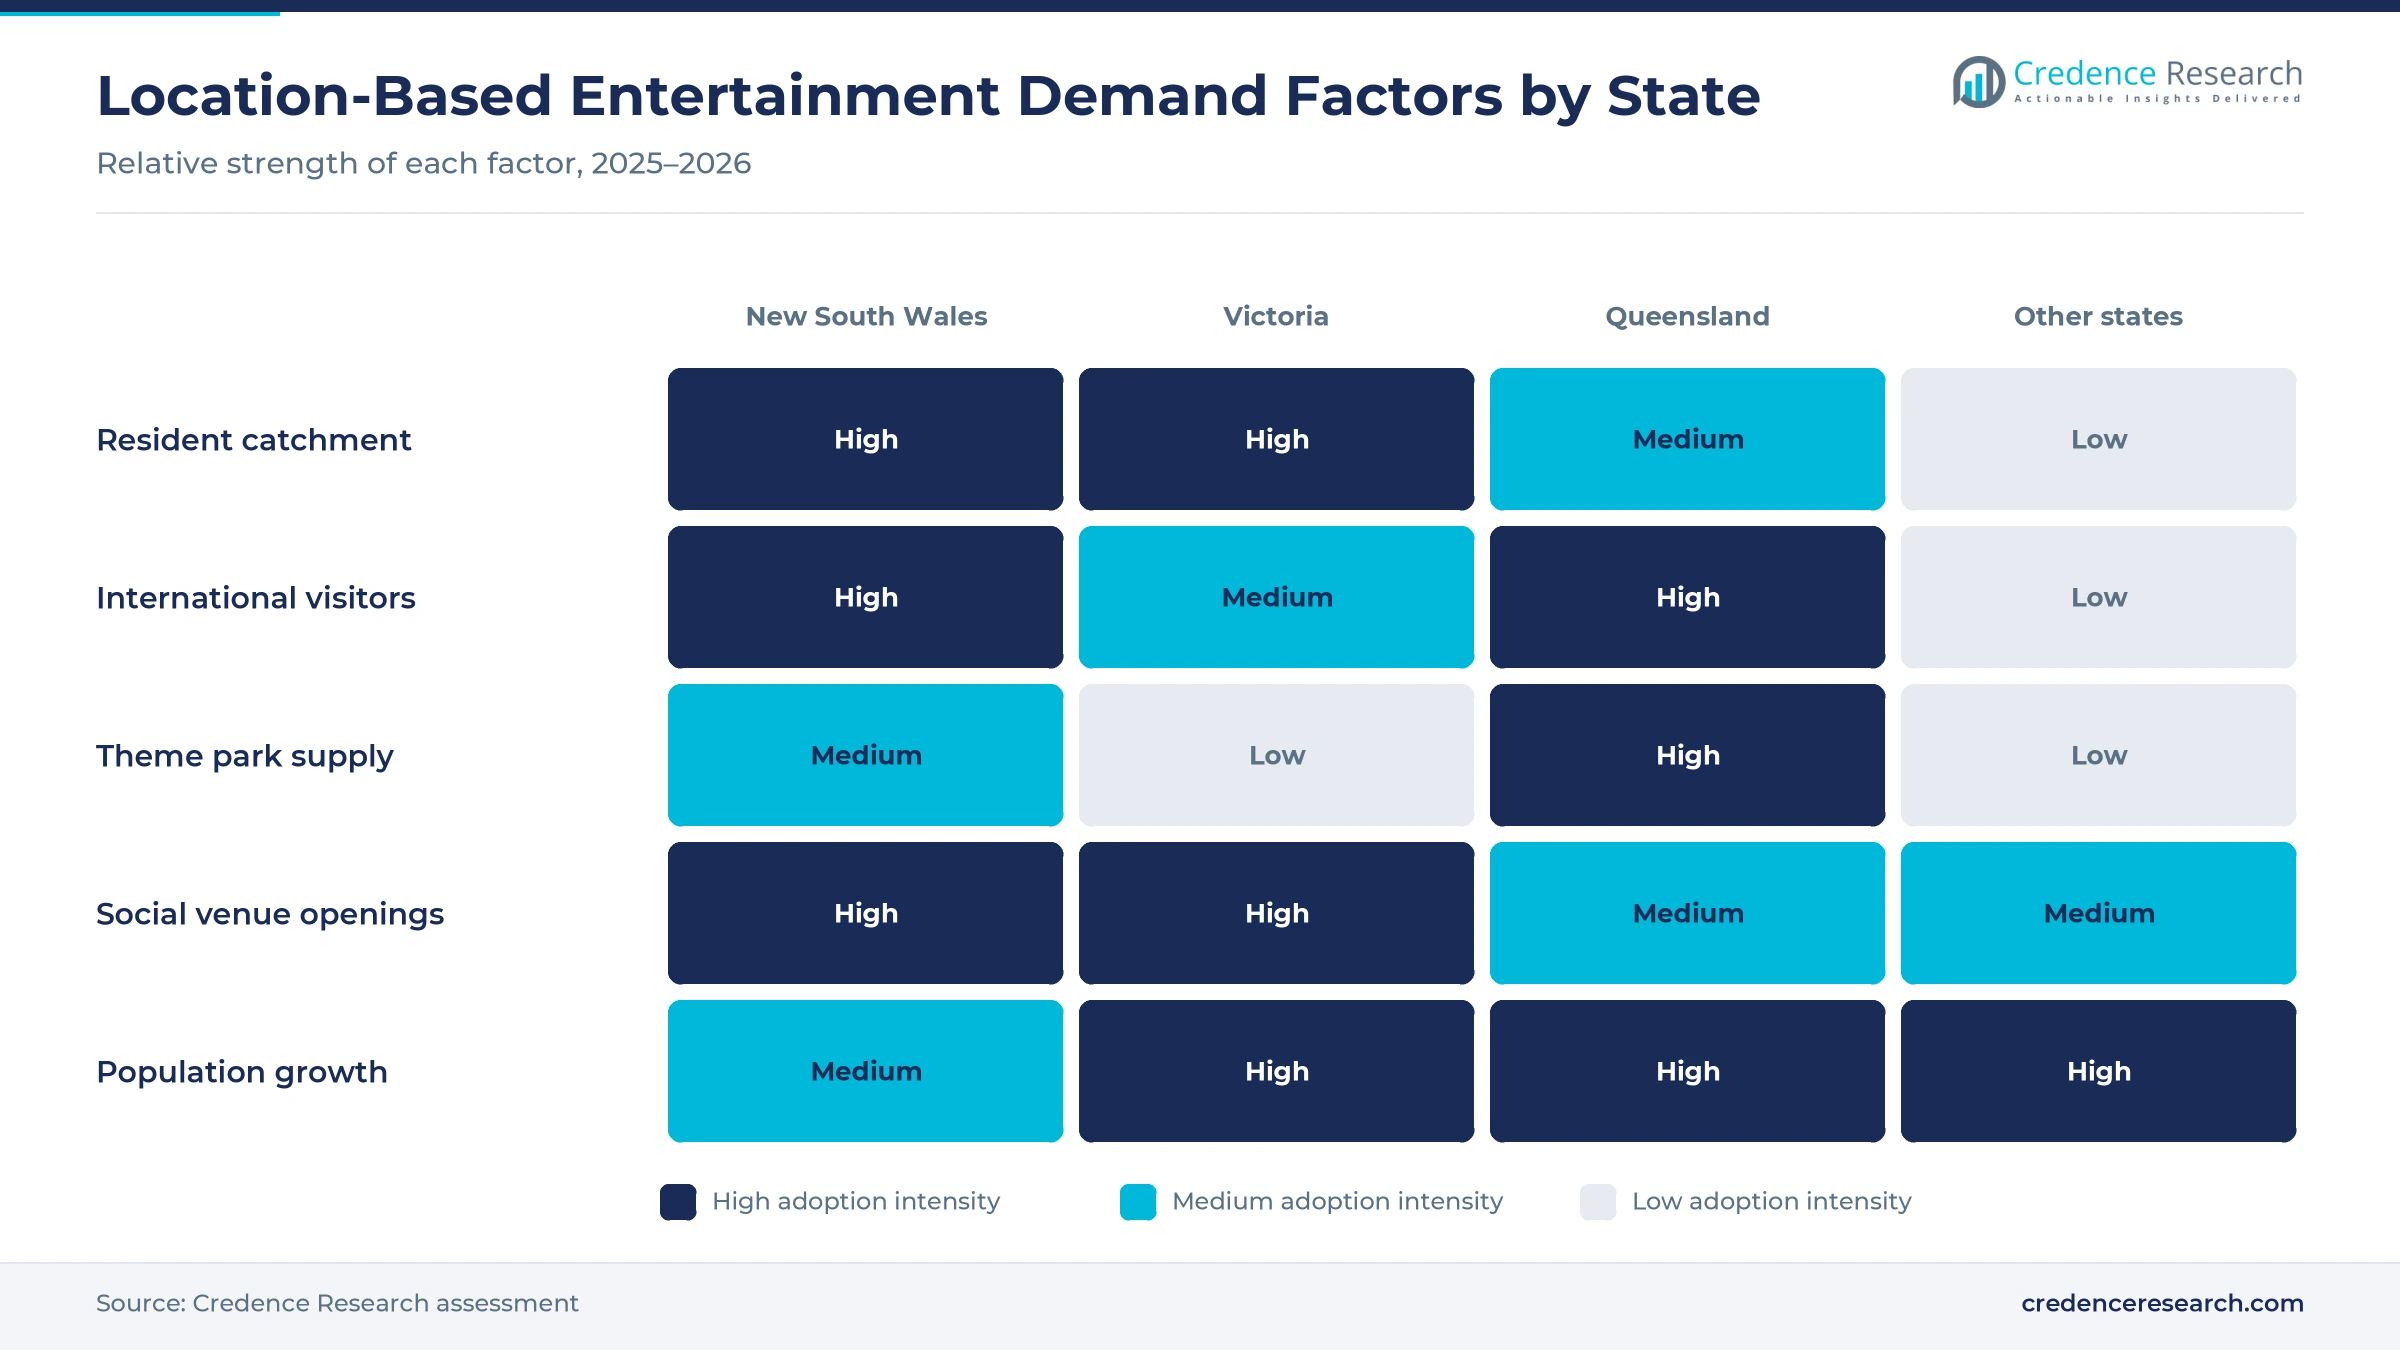
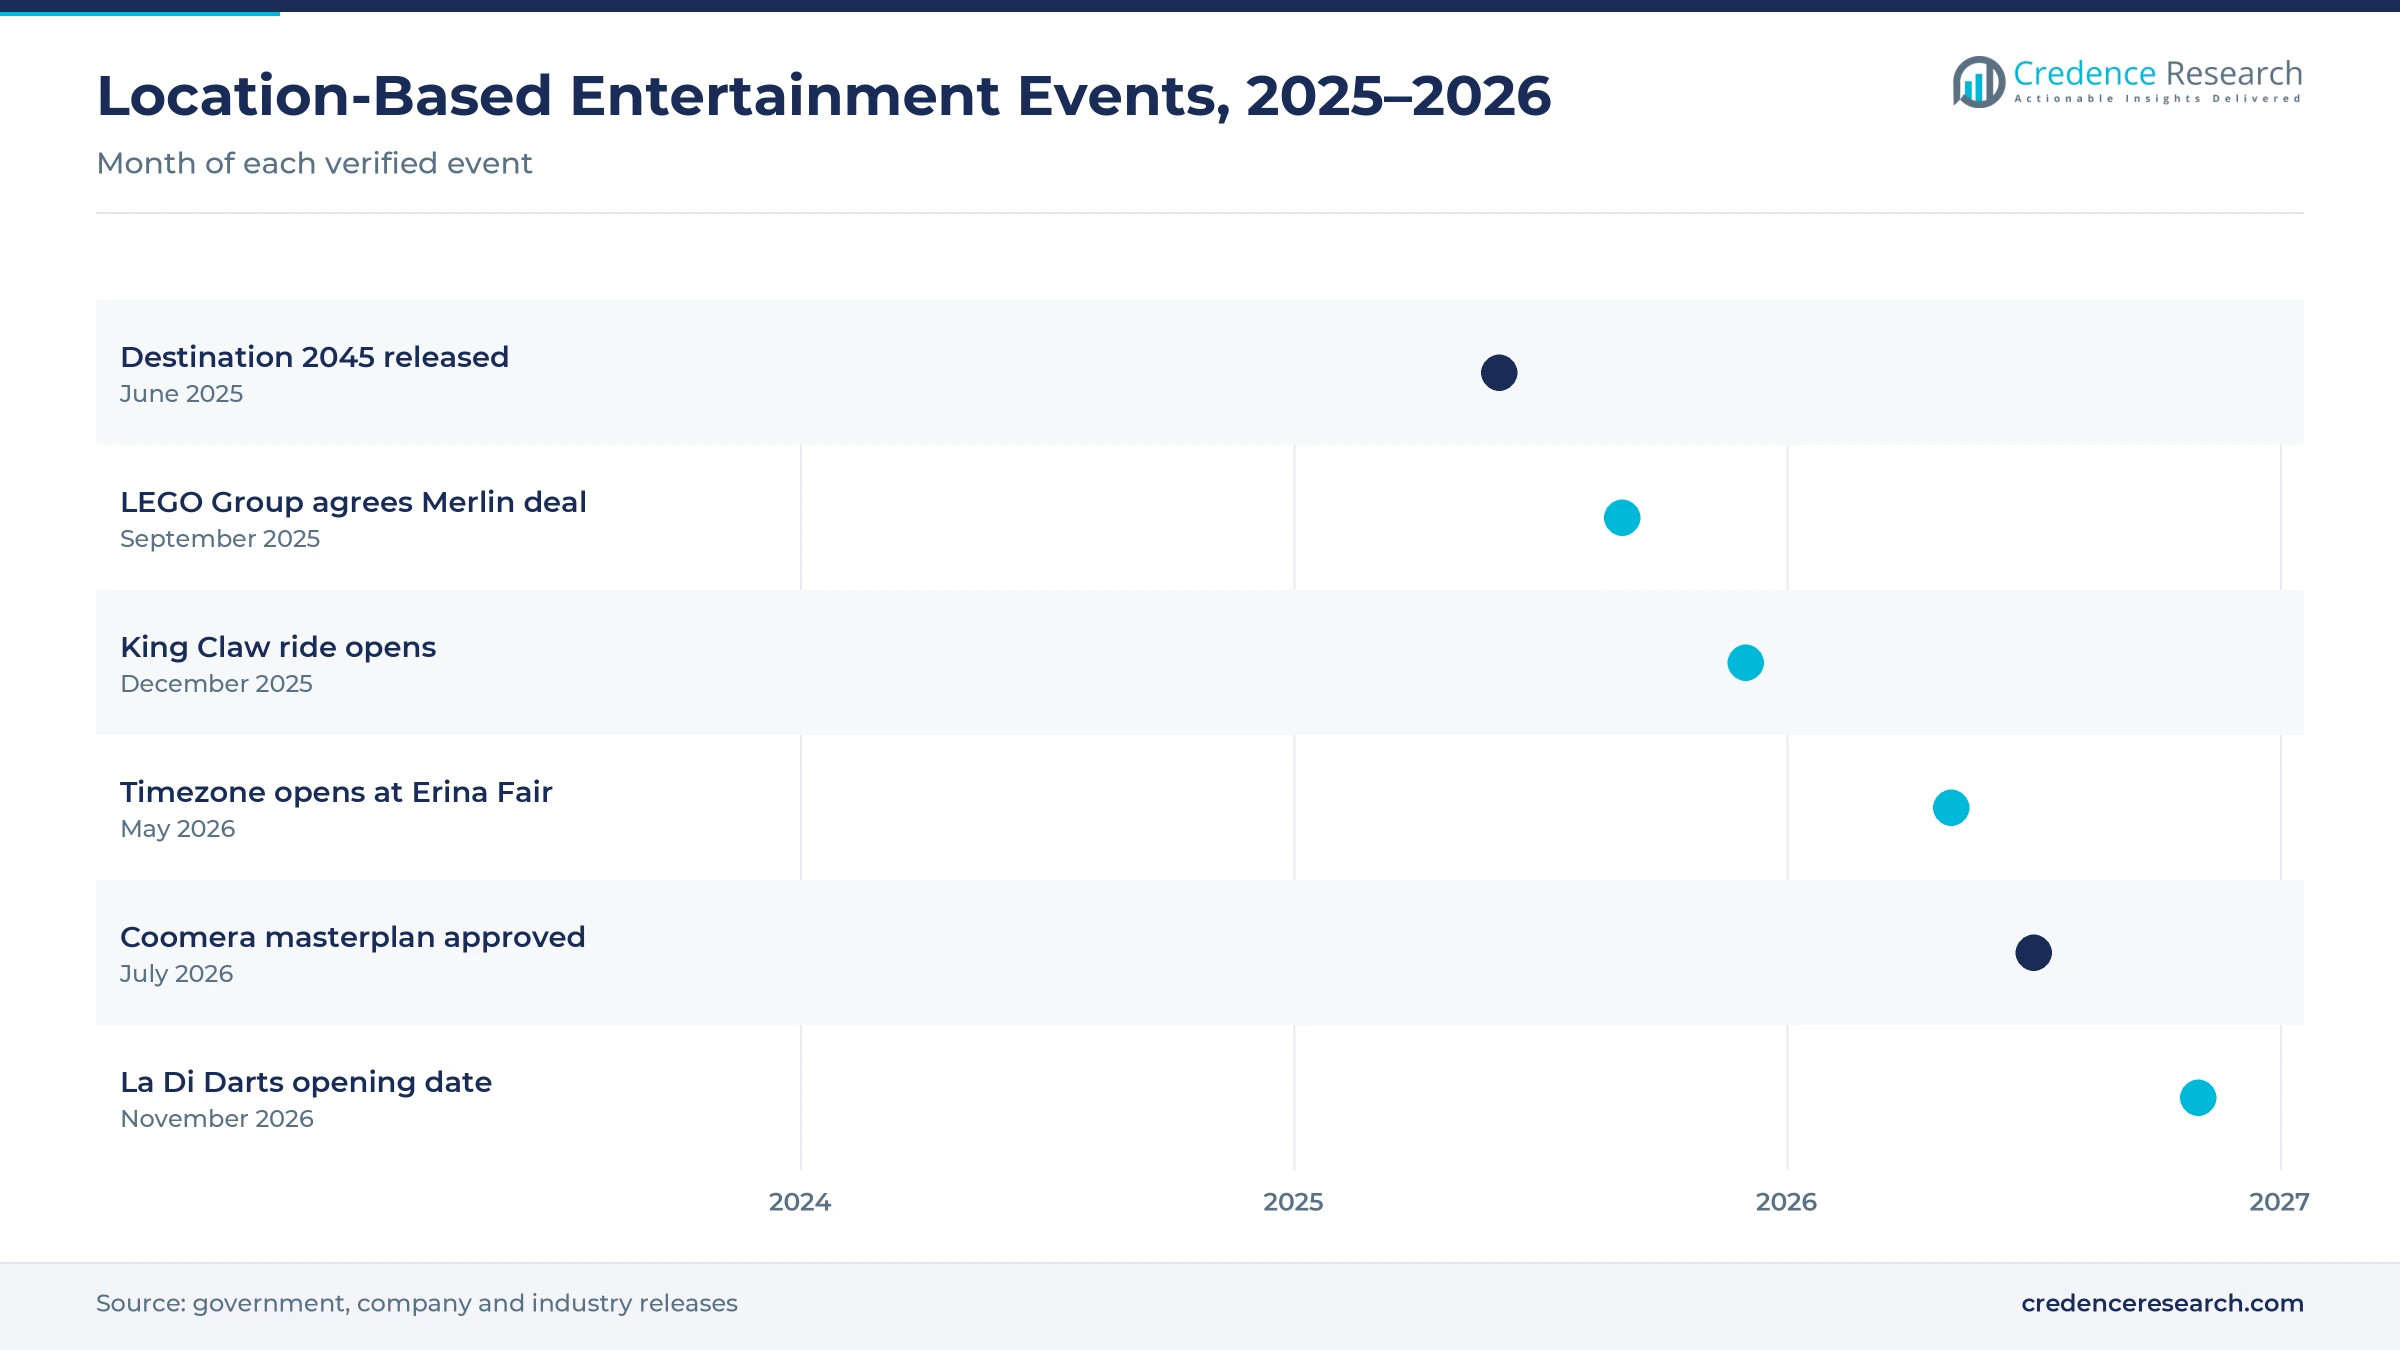
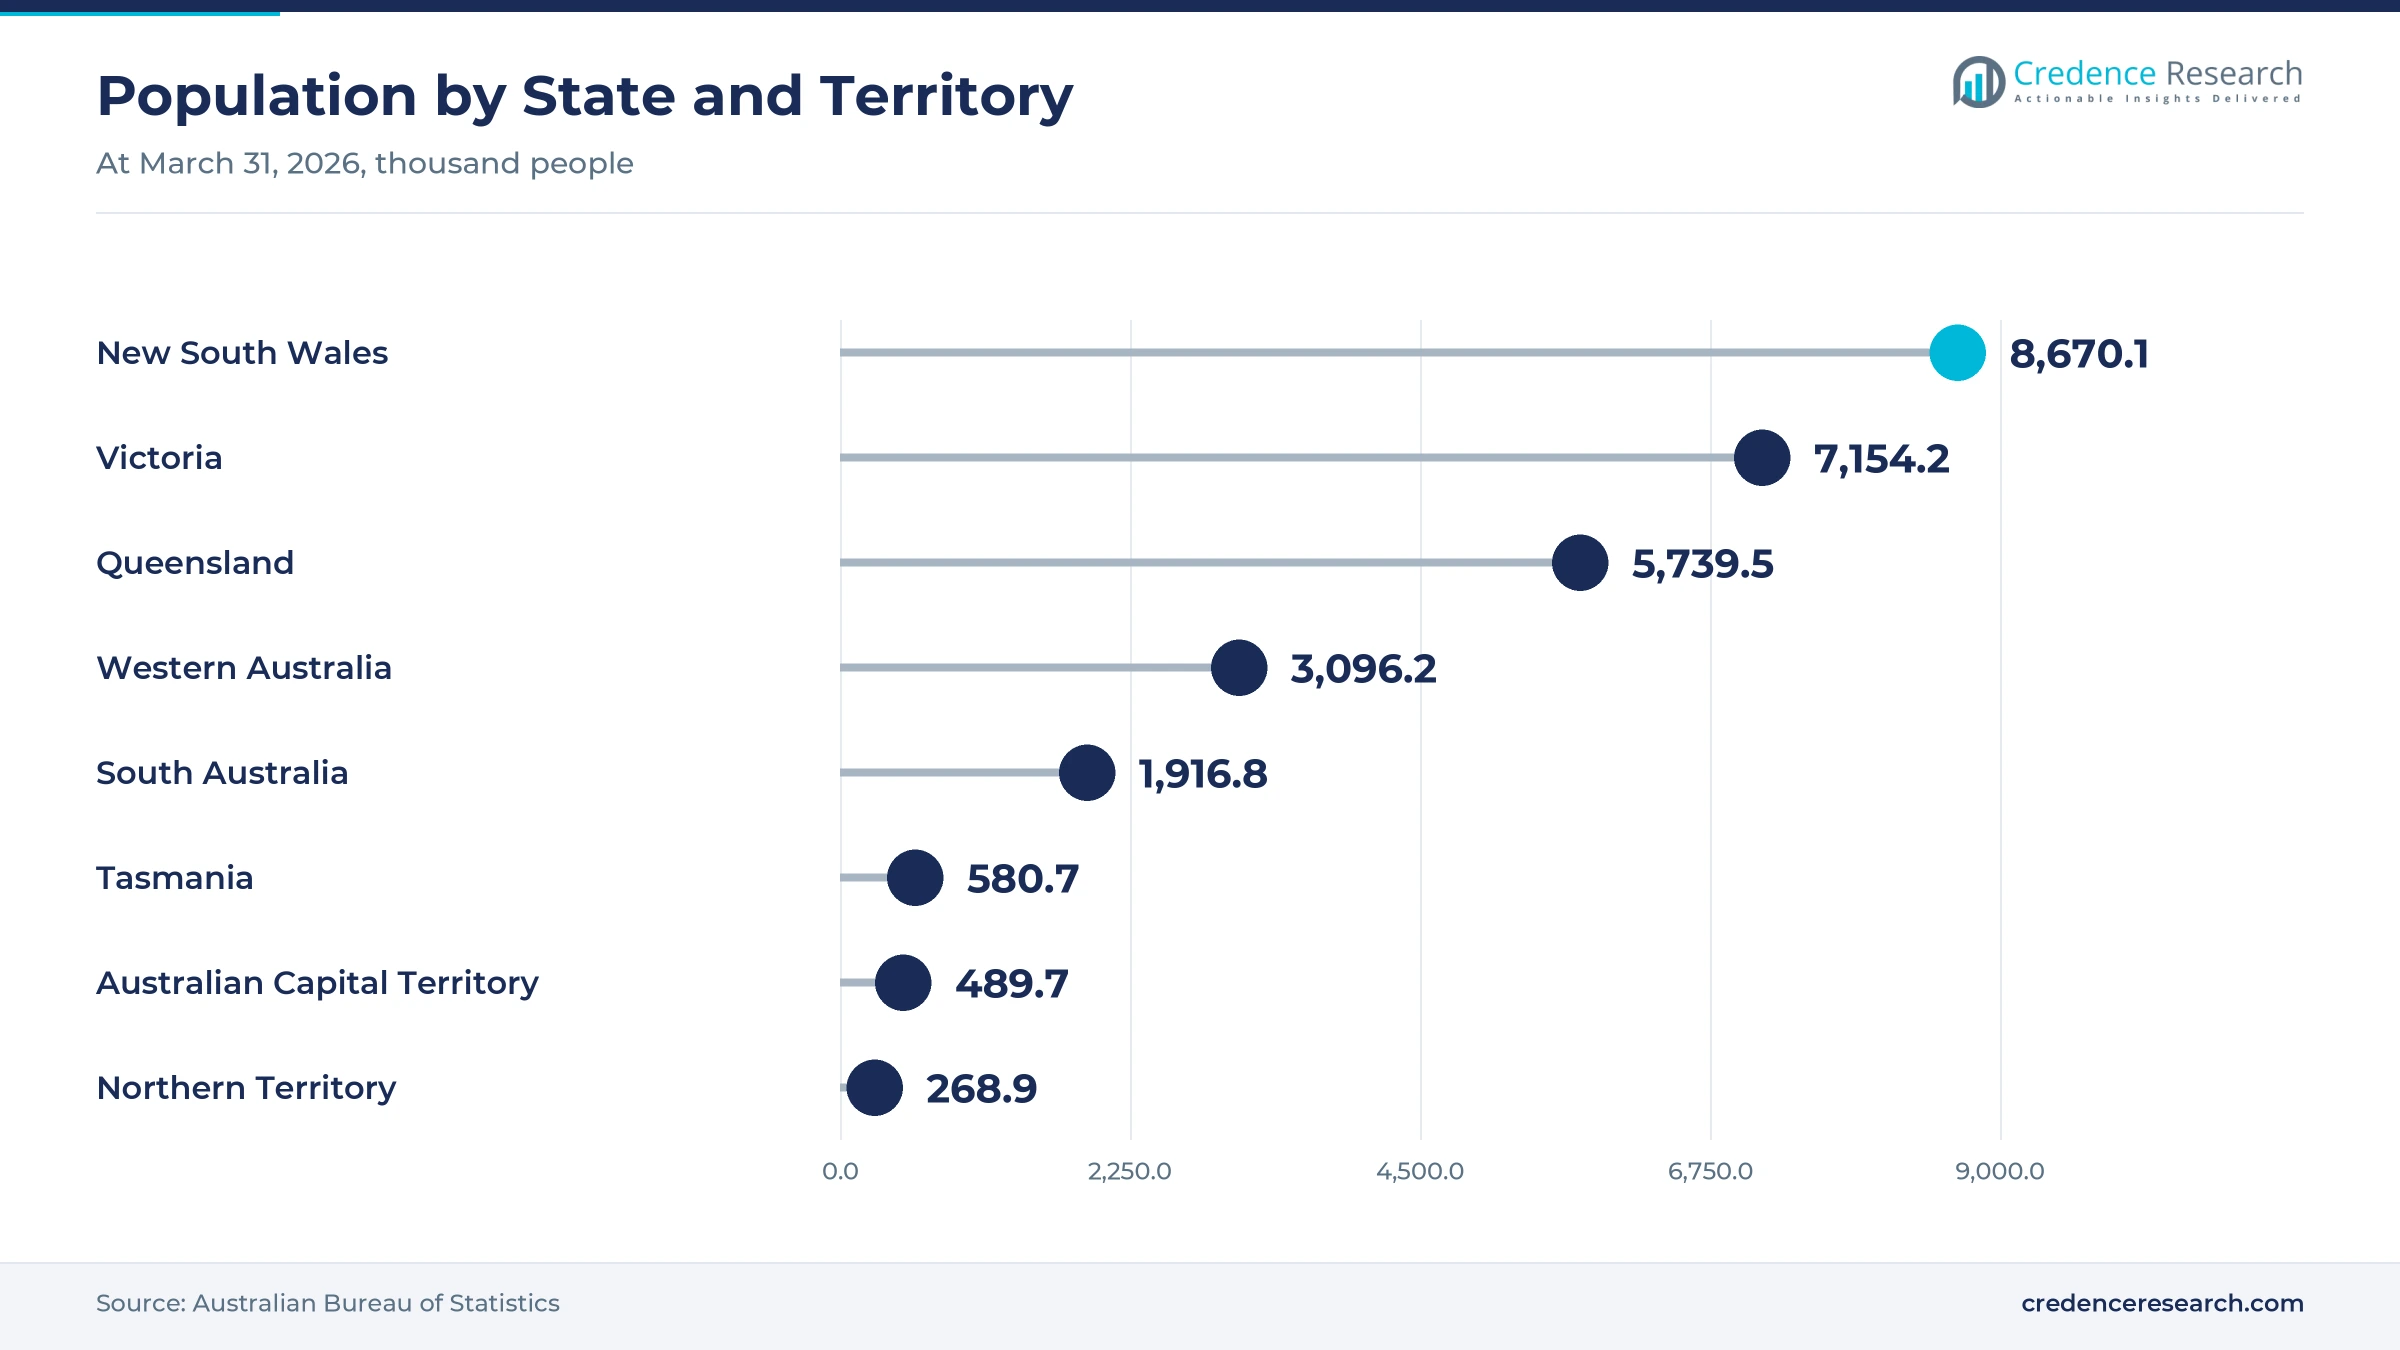
Resident catchment expansion lifts visits, because every new suburb and apartment cluster adds families and young adults within a short drive of parks and venues. Australia's population reached about 27.9 million at March 31, 2026, up 392,700 people or 1.4% in a year. Children aged 0 to 14 made up 17.7% of the population in 2025, according to the World Bank, which sustains birthday and holiday demand. TEEG opened a Timezone venue of more than 1,500 square meters at Erina Fair on the New South Wales Central Coast in May 2026. As a result, resident families lead customer types with a 46.0% share, while suburban centers add arcade machines, bowling and laser tag.
Why does inbound leisure recovery support spending?
Inbound leisure recovery supports spending, because overseas visitors buy multiday park passes and premium attraction tickets. Short-term visitor arrivals reached 1,036,660 in December 2025, up 9.7% on a year earlier, according to national statistics. That month was still 3.8% below December 2019, which leaves room for further recovery. New Zealand was the largest source with 142,420 trips, ahead of the United Kingdom and the United States. International holiday spending also rose 17% in the March quarter 2026 on a year earlier. Consequently, international visitors grow fastest among customer types at 6.50% a year, and Gold Coast and Sydney attractions benefit most.
How do format refresh and digital convenience add demand?
Format refresh and digital convenience add demand, because new venue concepts and online booking turn single visits into regular nights out. TEEG announced in December 2025 a $13 million, 3,500 square meter Kingpin venue in Collins Arcade, Melbourne, expected to draw more than one million visitors a year, according to its venue news. Funlab plans to open La Di Darts in Melbourne on Nov. 19, 2026, with augmented play, automatic scoring and bookable sessions from $23. Funlab runs more than 80 venues across eight brands with more than 2,500 staff. In turn, direct digital sales lead channels with a 51.0% share, helped by off-course golf venues and darts bars.
Why does Queensland tourism policy and park investment matter?
Queensland tourism policy and park investment matter, because the state hosts the largest cluster of theme parks and water parks in the country. The Queensland Government released its Destination 2045 plan on June 25, 2025, aiming to double visitor spending to $84 billion a year, according to the state government. The plan includes $446 million over four years for a new major events fund. Coast Entertainment drew about two million visits in the year to June 2026, up 29.3%, according to an industry report. As a result, Queensland grows fastest among states, supported by new rides, water slides and large precinct plans on the Gold Coast.
Social venues, park precincts and events gain momentum
Why is the rise of adult social venues reshaping demand?
The rise of adult social venues is reshaping demand, because young adults want games, food and drinks in one booking rather than a single activity. Funlab runs Holey Moley, Strike Bowling, Archie Brothers, Hijinx Hotel and La Di Darts among its eight brands. La Di Darts offers private event packages from $52 per person that combine darts with mini golf upstairs. Kingpin's Collins Arcade venue in Melbourne targets more than one million visitors a year in a 3,500 square meter space. La Di Darts is scheduled to open on Nov. 19, 2026, beneath Holey Moley on Little Bourke Street. Consequently, resident adults gain share among customer types, while venue groups add bars, karaoke and themed rooms to lengthen stays and raise spending per head.
How is the shift to park precincts changing investment?
The shift to park precincts is changing investment, because owners want hotels, dining and housing around rides to raise visits and length of stay. The Queensland Government approved Coast Entertainment's 55.3 hectare Coomera masterplan on July 20, 2026, with four precincts that include hotels, entertainment and nature-based tourism. The company has invested more than $180 million in Dreamworld over the past four years and supports more than 1,000 direct jobs. Dreamworld opened the King Claw ride in December 2025 and plans Lost Mine Mayhem for late 2027. As a result, theme parks and water parks keep a 42.0% share of 2025 value.
Can major events open new visitor demand?
Major events open a clear opportunity, because concerts, sports and festivals bring visitors who add a park or attraction to their trip. Queensland set aside $446 million over four years for a dedicated events fund under Destination 2045. International visitors spent a record $6.3 billion in Queensland in the year to March 2025, including a record $3.1 billion by holiday visitors. International visitor spending in Queensland then rose 35% in the year to March 2026, with trips up 13%. Consequently, operators that package tickets with travel partners and hotels can capture more spending from domestic and overseas visitors during event periods.
Is there room for branded and immersive attractions?
Branded and immersive attractions offer room to grow, because well-known characters and toy brands draw families who want indoor, weatherproof outings. The LEGO Group agreed in September 2025 to buy 29 LEGO Discovery Centres and LEGOLAND Discovery Centres in nine countries from Merlin Entertainments for about GBP 200 million. Merlin opened LEGOLAND Discovery Centre Melbourne in April 2017 and also runs the Sydney aquarium and Sydney Tower. Village Roadshow Theme Parks opened the $50 million Atlantis precinct at Sea World with the Leviathan wooden coaster. In turn, immersive and specialist attractions grow quickly, supported by immersive virtual reality content and themed rooms.
Cost pressure, weak China travel and weather slow growth
Why does cost pressure weigh on discretionary visits?
Cost pressure weighs on discretionary visits, because tickets, food and travel for a family day out add up quickly. Coast Entertainment reported that July 2026 ticket sales were slightly below the prior period, while like-for-like earnings fell 7% that month. As a result, operators lean on discounts, annual passes and bundles to hold attendance. Venues respond with shorter sessions, off-peak deals and lower entry prices that keep visits affordable for families and students.
How does weak China travel slow park recovery?
Weak China travel slows park recovery, because Chinese tour groups were once a large source of Gold Coast theme park visits. Coast Entertainment reported that international visitation recovered but remained below historical levels, particularly from China. Consequently, parks rely more on domestic families and visitors from New Zealand, the United Kingdom and the United States. Operators respond with new air route marketing and tour partnerships that target new and growing source markets across Asia and beyond.
Can outdoor parks manage weather and season swings?
Weather and season swings are a risk for outdoor parks, because rain, heat and storms cut attendance on peak days. In turn, theme parks and water parks depend heavily on school holidays and summer weekends. As a result, a wet holiday period can reduce annual visits sharply. Operators respond with indoor rides, covered queues, flexible tickets and evening events that spread demand across the year and protect revenue in poor weather.
Why do high build costs limit new venues?
High build costs limit new venues, because rides, fit-outs and lease commitments require large upfront spending. Kingpin's new Melbourne venue alone costs $13 million for a 3,500 square meter space. As a result, smaller operators struggle to match the formats of large groups. Many respond with franchises, shopping center leases and shared spaces that lower capital needs, cut fit-out time and speed openings in new and growing suburbs.
Sydney leads while Queensland parks grow fastest
| State | Value, 2025 (USD billion) | Share, 2025 | CAGR, 2026–2035 |
|---|---|---|---|
| New South Wales | 0.64 | 40.2% | 5.49% |
| Victoria | 0.48 | 29.9% | 5.69% |
| Queensland | 0.40 | 24.7% | 6.29% |
| Remaining States and Territories | 0.08 | 5.2% | 5.49% |
Sydney catchment and tourists keep New South Wales ahead
New South Wales held a 40.2% share of 2025 value and grows at 5.49% a year. The state had 8,670,100 residents at March 31, 2026, the largest population in the country, up 1.1% in a year. International visitor spending in New South Wales also rose 18% in the year to March 2026. As a result, Sydney attractions, Central Coast family centers and city social venues hold the largest share of tickets, sessions and passes, alongside casino tourism in the harbor city.
Melbourne social venues anchor Victoria
Victoria held a 29.9% share of 2025 value and grows at 5.69% a year. The state had 7,154,200 residents at March 31, 2026, up 1.6% in a year, and international visitor spending rose 17% in the year to March 2026. Kingpin plans a 3,500 square meter venue in Collins Arcade, and Funlab will open La Di Darts in the city in November 2026. Consequently, Melbourne leads growth in adult social venues, bowling, darts and mini golf.
Why does Queensland gain theme park visits fastest?
Queensland held a 24.7% share of 2025 value and grows fastest at 6.29% a year. The state had 5,739,500 residents at March 31, 2026, up 1.6% in a year. International visitor spending in Queensland rose 35% in the year to March 2026, with trips up 13%. In turn, Gold Coast amusement parks, water parks and new precincts keep Queensland the fastest-growing state for ticketed attractions.
Western Australia leads growth among smaller states
The remaining states and territories held a 5.2% share of 2025 value and grow at 5.49% a year. Western Australia had the fastest population growth at 2.1% in the year to March 2026. Funlab also runs multi-brand venues in Fremantle and Karrinyup in Perth. As a result, Perth suburbs add family and social venues, while smaller states rely on local centers and tourism.
Venue openings, precinct approval and tourism plans
| Development | Status and market relevance |
|---|---|
| In June 2025, the Queensland Government released Destination 2045, aiming to double visitor spending to $84 billion a year. | Supports park and event demand |
| In September 2025, the LEGO Group agreed to buy 29 Discovery Centres from Merlin Entertainments. | Reshapes branded indoor attractions |
| In December 2025, TEEG announced a $13 million Kingpin venue in Collins Arcade, Melbourne. | Expands adult social venue supply |
| In May 2026, Timezone opened a venue of more than 1,500 square meters at Erina Fair in New South Wales. | Adds suburban family venue capacity |
| In July 2026, the Queensland Government approved Coast Entertainment's 55.3 hectare Coomera masterplan. | Enables a theme park precinct |
Booking, scoring, ride and immersive systems compete
- Online booking and pass systems sell timed tickets, sessions and annual passes, which let operators price peaks and manage crowds.
- Card and app-based play credits replace coins in arcades and family centers, giving operators data on games and guest spending.
- Ride and slide systems deliver coasters, water slides and family rides that anchor park visits and multiday passes.
- Immersive and augmented systems add projection, scoring and interactive storylines to darts, escape rooms and themed attractions.
Need a Custom Version of This Report?
Tailor the scope, geography, or segments to your exact requirements.
- Custom geography or segment scope
- Direct access to our analyst team
Park owners and venue groups compete on fresh formats
Competition combines large theme park owners with multi-brand venue groups and many independent operators. Village Roadshow Theme Parks runs Sea World, Movie World and Wet'n'Wild on the Gold Coast and opened the $50 million Atlantis precinct at Sea World. Coast Entertainment Holdings owns Dreamworld and WhiteWater World and drew about two million visits in the year to June 2026. TEEG runs Timezone family centers and announced a new Kingpin venue in Melbourne. Funlab operates more than 80 venues across eight brands, including Holey Moley and Strike Bowling. Merlin Entertainments runs Sydney attractions and agreed to sell its Discovery Centres to the LEGO Group. Companies compete on new rides, venue formats, location, pricing, online booking and group packages.
Companies profiled and their roles in this market
| Company | Type | Role in the market |
|---|---|---|
| Village Roadshow Theme Parks | Theme park owner | Sea World, Movie World and Wet'n'Wild on the Gold Coast |
| Coast Entertainment Holdings | Theme park owner | Dreamworld and WhiteWater World; Coomera precinct |
| TEEG Australia | Venue group | Timezone family centers and Kingpin venues |
| Funlab | Venue group | Holey Moley, Strike Bowling, Archie Brothers and La Di Darts |
| Merlin Entertainments Australia | Attraction operator | Sydney aquarium and Sydney Tower attractions |
Credence Research sees Queensland and adults set pace
Credence Research's view is that Australian spending on location-based entertainment will grow strongly through 2035, as population growth, returning tourists and new venue formats keep visits rising. Theme parks and water parks should keep the largest service share, while escape rooms and indoor adventure gain most. New South Wales will remain the largest state, although Queensland adds demand fastest. However, cost pressure, weak China travel and high build costs will reward operators with fresh formats, strong online sales and flexible pricing.
Visits, spend per visit and venue counts anchor the model
The report uses 2025 as the base year for every value, share and growth rate. Market values come from the Credence Research model, which combines visits, spending per visit, venue counts and price tiers. The four state groups and their 2025 shares follow the Credence Research regional model, while state growth and segment splits by service type, customer type, operating model and channel are Credence Research estimates. Sources used are official statistics, government releases, company announcements, industry press and venue pages, and no interviews or surveys were used.
New venues and tourist return shape demand to 2035
The market is expected to reach USD 2.82 billion by 2035, a 5.75% CAGR during 2026–2035, as population growth, tourism and new venues keep demand rising. Spending is projected to rise from USD 1.70 billion in 2026 as operators open new sites and parks add rides. Growth should be strongest in escape rooms and indoor adventure, international visitors and Queensland, while New South Wales keeps the largest share. In contrast, cost pressure and weather could slow visits in some years.
Frequently Asked Questions
How big is the Australia location-based entertainment market?
Which state leads demand?
Which state grows fastest?
Which service type holds the largest share?
Which service type grows fastest?
How are international visitors affecting the market?
Who are the leading companies in this market?
What are the main risks to growth?
Table of Content
Chapter 1 Market Segmentation
- 1.1 Segmentation Framework
- 1.1.1 Product and Service Classification
- 1.1.2 Application and End-Use Classification
- 1.1.3 Technology and Solution Classification
- 1.1.4 Customer and Distribution Channel Classification
- 1.1.5 Geographic Segmentation
- 1.1.6 Market Segment Definitions and Boundaries
- 1.2 By Service Type
- 1.2.1 Theme Parks and Water Parks
- 1.2.2 Family Entertainment Centres
- 1.2.3 Escape Rooms and Indoor Adventure
- 1.2.4 Immersive and Specialist Attractions
- 1.3 By Customer Type
- 1.3.1 Resident Families
- 1.3.2 Resident Adults
- 1.3.3 International Visitors
- 1.3.4 Institutional Buyers
- 1.4 By Operating Model
- 1.4.1 Corporate Operated
- 1.4.2 Franchise Operated
- 1.4.3 Independent Operated
- 1.5 By Channel
- 1.5.1 Direct Digital
- 1.5.2 Direct Onsite
- 1.5.3 Intermediaries
- 1.6 By State
- 1.6.1 Queensland
- 1.6.2 New South Wales
- 1.6.3 Victoria
- 1.6.4 Remaining States and Territories
Chapter 2 Introduction
- 2.1 Report Objectives and Scope
- 2.2 Product Definition and Industry Terminology
- 2.3 Market Inclusions and Exclusions
- 2.4 Research Process
- 2.4.1 Primary Research and Expert Interviews
- 2.4.2 Secondary Research and Source Review
- 2.4.3 Top-Down and Bottom-Up Estimation
- 2.4.4 Data Triangulation and Verification
- 2.5 Market Size Measurement Basis
- 2.5.1 2025: USD 1.60 billion → 2035: USD 2.82 billion
- 2.6 Historical and Forecast Reference Periods
- 2.6.1 Historical Period: 2018-2025
- 2.6.2 Base Year: 2025
- 2.6.3 Forecast Period: 2025-2035
- 2.7 Research Assumptions and Limitations
Chapter 3 Executive Summary
- 3.1 Market Snapshot and Key Findings
- 3.2 Base-Year Market Size, 2025
- 3.3 Forecast Market Size, 2035
- 3.4 Revenue and Volume Growth Outlook
- 3.5 Key Demand and Supply Indicators
- 3.6 Leading Market Segments
- 3.7 Fastest-Growing Market Opportunities
- 3.8 Regional Performance Highlights
- 3.9 Technology and Industry Transformation
- 3.10 Competitive Landscape Summary
- 3.11 Analyst View and Strategic Implications
Chapter 4 Australia Location-Based Entertainment Market Trends and Developments
- 4.1 Historical Industry Development, 2018-2025
- 4.2 Recent Market Trends and Developments
- 4.3 Demand and Customer Behavior Trends
- 4.4 Technology and Product Innovation
- 4.5 Artificial Intelligence, Automation and Digitalization
- 4.6 Local Manufacturing and Supply Chain Realignment
- 4.7 Industry Partnerships, Mergers and Acquisitions
- 4.8 Sustainability and Circular Economy Developments
- 4.9 Government and Private Sector Investment Trends
- 4.10 Emerging Business Models and Commercialization
- 4.11 Industry Developments and Announcements
Chapter 5 Australia Location-Based Entertainment Market Supply and Demand Analysis
- 5.1 Demand Trend and Consumption Analysis, 2018-2025
- 5.2 Demand Forecast, 2025-2035
- 5.3 Supply Chain Structure and Procurement Trends
- 5.4 Supply-Demand Gap and Bottlenecks
- 5.5 Import Dependence and Sourcing Structure
- 5.6 Regional Supply and Demand Concentration
Chapter 6 Australia Location-Based Entertainment Market Pricing Analysis
- 6.1 Pricing Structure and Measurement
- 6.2 Historical Pricing Trends, 2018-2025
- 6.3 Pricing Outlook, 2025-2035
- 6.4 Pricing by Product and Market Segment
- 6.5 Geographic Pricing Differences
- 6.6 Key Input, Energy, Labor and Logistics Costs
- 6.7 Contract Pricing and Purchasing Models
- 6.8 Pricing Sensitivity and Competitive Positioning
- 6.9 Price, Margin and Profitability Implications
Chapter 7 Australia Location-Based Entertainment Market Dynamics
- 7.1 Market Growth Drivers
- 7.1.1 Demand-Side Drivers
- 7.1.2 Technology and Innovation Drivers
- 7.1.3 Infrastructure and Investment Drivers
- 7.1.4 Regulatory and Policy Drivers
- 7.2 Market Restraints
- 7.2.1 Cost and Affordability Constraints
- 7.2.2 Technology and Adoption Barriers
- 7.2.3 Supply Chain and Operational Constraints
- 7.3 Market Challenges
- 7.3.1 Competitive Pressure and Margin Erosion
- 7.3.2 Skills, Infrastructure and Implementation Gaps
- 7.4 Emerging Market Opportunities
- 7.5 Market Dynamics Impact and Time-Horizon Assessment
Chapter 8 Australia Location-Based Entertainment Value Chain Analysis
- 8.1 Industry Value Chain Overview
- 8.2 Upstream Suppliers and Critical Inputs
- 8.3 Technology and Component Providers
- 8.4 Manufacturing or Service Delivery
- 8.5 Distribution, Channel Partners and Integrators
- 8.6 Downstream Applications and End Users
- 8.7 Value Addition and Profit Pools
- 8.8 Vertical Integration and Outsourcing
- 8.9 Supplier Concentration and Risk
- 8.10 Supply Chain Localization and Resilience
Chapter 9 Australia Location-Based Entertainment Market Regulations and Policies
- 9.1 Relevant Laws, Standards and Compliance Frameworks
- 9.2 Product, Service, Safety and Quality Requirements
- 9.3 Government Policies, Incentives and Subsidies
- 9.4 Imports, Exports and Trade Barriers
- 9.5 Public Procurement and Local Content Requirements
- 9.6 Data Protection, AI and Cybersecurity Compliance
- 9.7 Upcoming Policy Changes and Market Implications
Chapter 10 Australia Location-Based Entertainment Market Hotspots and Opportunities
- 10.1 Market Opportunity Mapping and Growth Hotspots
- 10.2 High-Growth Applications and Customer Groups
- 10.3 Underserved Markets and White-Space Opportunities
- 10.4 Emerging Technology and Product Opportunities
- 10.5 New Capacity and Investment Hotspots
- 10.6 Market Entry and Expansion Opportunities
- 10.7 Distribution and Partnership Opportunities
- 10.8 Near-Term and Long-Term Commercial Potential
- 10.9 Opportunity Attractiveness and Execution Risks
Chapter 11 Australia Location-Based Entertainment Market Outlook, 2025-2035
- 11.1 Market Size and Analysis
- 11.1.1 Revenue (Market Measurement: 2025: USD 1.60 billion → 2035: USD 2.82 billion)
- 11.1.2 Historical Market Size, 2018-2025
- 11.1.3 Base-Year Market Size, 2025
- 11.2 Market Forecast, 2025-2035
- 11.2.1 Revenue Forecast to 2035
- 11.2.2 CAGR and Year-on-Year Growth
- 11.2.3 Incremental Revenue Opportunity
- 11.3 Forecast Assumptions and Scenario Analysis
- 11.3.1 Base-Case Forecast
- 11.3.2 Optimistic and Conservative Scenarios
- 11.3.3 Technology, Pricing and Policy Sensitivities
- 11.4 Market Attractiveness and Growth Outlook
Chapter 12 Australia Location-Based Entertainment Market Segmentation and Outlook
- 12.1 Segmentation Summary and Market Shares, 2025
- 12.2 Largest and Fastest-Growing Segments
- 12.3 By Service Type - Market Size and Forecast, 2025-2035
- 12.3.1 Segment Definition and Scope
- 12.3.2 Historical Market Size, 2018-2025
- 12.3.3 Revenue Forecast, 2025-2035
- 12.3.4 Base-Year Market Share, 2025
- 12.3.5 Segment CAGR and Growth Drivers
- 12.3.6 Subsegment Market Size and Forecast
- 12.3.6.1 Theme Parks and Water Parks
- 12.3.6.2 Family Entertainment Centres
- 12.3.6.3 Escape Rooms and Indoor Adventure
- 12.3.6.4 Immersive and Specialist Attractions
- 12.3.7 Subsegment Pricing and Adoption Trends
- 12.3.8 Leading Suppliers and Competition
- 12.3.9 Regional Demand and Opportunities
- 12.4 By Customer Type - Market Size and Forecast, 2025-2035
- 12.4.1 Segment Definition and Scope
- 12.4.2 Historical Market Size, 2018-2025
- 12.4.3 Revenue Forecast, 2025-2035
- 12.4.4 Base-Year Market Share, 2025
- 12.4.5 Segment CAGR and Growth Drivers
- 12.4.6 Subsegment Market Size and Forecast
- 12.4.6.1 Resident Families
- 12.4.6.2 Resident Adults
- 12.4.6.3 International Visitors
- 12.4.6.4 Institutional Buyers
- 12.4.7 Subsegment Pricing and Adoption Trends
- 12.4.8 Leading Suppliers and Competition
- 12.4.9 Regional Demand and Opportunities
- 12.5 By Operating Model - Market Size and Forecast, 2025-2035
- 12.5.1 Segment Definition and Scope
- 12.5.2 Historical Market Size, 2018-2025
- 12.5.3 Revenue Forecast, 2025-2035
- 12.5.4 Base-Year Market Share, 2025
- 12.5.5 Segment CAGR and Growth Drivers
- 12.5.6 Subsegment Market Size and Forecast
- 12.5.6.1 Corporate Operated
- 12.5.6.2 Franchise Operated
- 12.5.6.3 Independent Operated
- 12.5.7 Subsegment Pricing and Adoption Trends
- 12.5.8 Leading Suppliers and Competition
- 12.5.9 Regional Demand and Opportunities
- 12.6 By Channel - Market Size and Forecast, 2025-2035
- 12.6.1 Segment Definition and Scope
- 12.6.2 Historical Market Size, 2018-2025
- 12.6.3 Revenue Forecast, 2025-2035
- 12.6.4 Base-Year Market Share, 2025
- 12.6.5 Segment CAGR and Growth Drivers
- 12.6.6 Subsegment Market Size and Forecast
- 12.6.6.1 Direct Digital
- 12.6.6.2 Direct Onsite
- 12.6.6.3 Intermediaries
- 12.6.7 Subsegment Pricing and Adoption Trends
- 12.6.8 Leading Suppliers and Competition
- 12.6.9 Regional Demand and Opportunities
- 12.7 By State - Market Size and Forecast, 2025-2035
- 12.7.1 Segment Definition and Scope
- 12.7.2 Historical Market Size, 2018-2025
- 12.7.3 Revenue Forecast, 2025-2035
- 12.7.4 Base-Year Market Share, 2025
- 12.7.5 Segment CAGR and Growth Drivers
- 12.7.6 Subsegment Market Size and Forecast
- 12.7.6.1 Queensland
- 12.7.6.2 New South Wales
- 12.7.6.3 Victoria
- 12.7.6.4 Remaining States and Territories
- 12.7.7 Subsegment Pricing and Adoption Trends
- 12.7.8 Leading Suppliers and Competition
- 12.7.9 Regional Demand and Opportunities
- 12.8 Segment Growth Comparison
- 12.9 Segment Attractiveness and Priority Matrix
Chapter 13 Australia Location-Based Entertainment End-Use and Application Market Outlook
- 13.1 End-Use Industry and Customer Demand Structure
- 13.2 Leading Applications and Customer Groups
- 13.3 End-Use Market Size, Share and Forecast
- 13.4 Major End-Use Industry Deep Dives
- 13.4.1 Customer Requirements and Use Cases
- 13.4.2 Demand and Replacement Cycles
- 13.4.3 Technical and Regulatory Considerations
- 13.4.4 Purchasing and Procurement Models
- 13.4.5 Leading Vendors and Distribution Channels
- 13.4.6 Forecast and Commercial Opportunities
- 13.5 Emerging Applications and Cross-Segment Demand
- 13.6 End-Use Industry Investment Priorities
Chapter 14 Australia Location-Based Entertainment Geographic Market Outlook, 2025-2035
- 14.1 Domestic Market Distribution and Demand Clusters
- 14.2 State- or Province-Wise Market Size and Forecast, 2025-2035
- 14.3 City and Metropolitan Market Outlook
- 14.4 Industrial, Manufacturing and Commercial Clusters
- 14.5 Geographic Concentration of Key End Users
- 14.6 Local Pricing and Purchasing Differences
- 14.7 Domestic Production Facilities and Capacity Map
- 14.8 Local Infrastructure and Project Pipeline
- 14.9 State-Level Policy and Incentive Differences
- 14.10 Subnational Investment Hotspots and Opportunities
- 14.11 Distribution and Logistics Networks
- 14.12 Domestic Competitive Footprint
Chapter 15 Australia Location-Based Entertainment Technology, Innovation and Sustainability Outlook
- 15.1 Technology Landscape and Maturity
- 15.2 Product, Process and Service Innovation
- 15.3 AI, Automation and Digital Tools in the Industry
- 15.4 Technology Adoption and Performance Benchmarking
- 15.5 Innovation Pipeline and R&D Investment
- 15.6 Energy Efficiency and Resource Management
- 15.7 Sustainability, Recycling and Circularity
- 15.8 Technology Roadmap, 2025-2035
- 15.9 Risks of Obsolescence and Technology Substitution
Chapter 16 Australia Location-Based Entertainment Market Key Strategic Imperatives
- 16.1 Growth and Market Entry Priorities
- 16.2 High-Return Products and Segments
- 16.3 Pricing, Profitability and Cost Optimization
- 16.4 Technology Investment and Product Differentiation
- 16.5 Supply Chain Localization and Resilience
- 16.6 Distribution and Customer Acquisition
- 16.7 Partnership, Acquisition and Capacity Strategy
- 16.8 Regional Expansion Priorities
- 16.9 Short-, Medium- and Long-Term Actions
Chapter 17 Competition Outlook
- 17.1 Industry Competition Characteristics
- 17.2 Market Structure and Concentration
- 17.3 Market Share and Competitive Positioning, 2025
- 17.4 Company-Wise Revenue and Product Benchmarking
- 17.5 Production and Service Capacity Benchmarking
- 17.6 Technology, Pricing and Differentiation
- 17.7 Regional Footprint and Distribution Strength
- 17.8 Mergers, Acquisitions and Strategic Alliances
- 17.9 New Entrants and Competitive Threats
- 17.10 Porter's Five Forces and Industry Attractiveness
- 17.11 Competitive Outlook, 2025-2035
Chapter 18 Company Profiles
- 18.1 Company Coverage and Selection Criteria
- 18.2 TEEG Australia
- 18.2.1 Business Description
- 18.2.2 Company Ownership and Geographic Presence
- 18.2.3 Product and Service Portfolio
- 18.2.4 Manufacturing and Operating Footprint
- 18.2.5 Financial Performance and Investment
- 18.2.6 Market Share and Competitive Position
- 18.2.7 Technology and Innovation Capabilities
- 18.2.8 Strategic Alliances or Partnerships
- 18.2.9 Recent Developments
- 18.2.10 Growth Strategy and Outlook
- 18.3 Village Roadshow Theme Parks
- 18.4 Merlin Entertainments Australia
- 18.5 Coast Entertainment Holdings
- 18.6 Funlab
- 18.7 Other Relevant Market Participants
Note: Every listed company is profiled on the structure shown under the first company. The company list is preliminary and may change based on research findings, market developments, data availability and client requirements.
Chapter 19 Disclaimer
- 19.1 Research and Forecast Disclaimer
- 19.2 Data Source and Estimation Limitations
Note: The depth of individual sections depends on data availability for this market. Volume, capacity, trade and other unit-based metrics are included where applicable.

