
Thin kitchen margins are pulling AI into daily operations
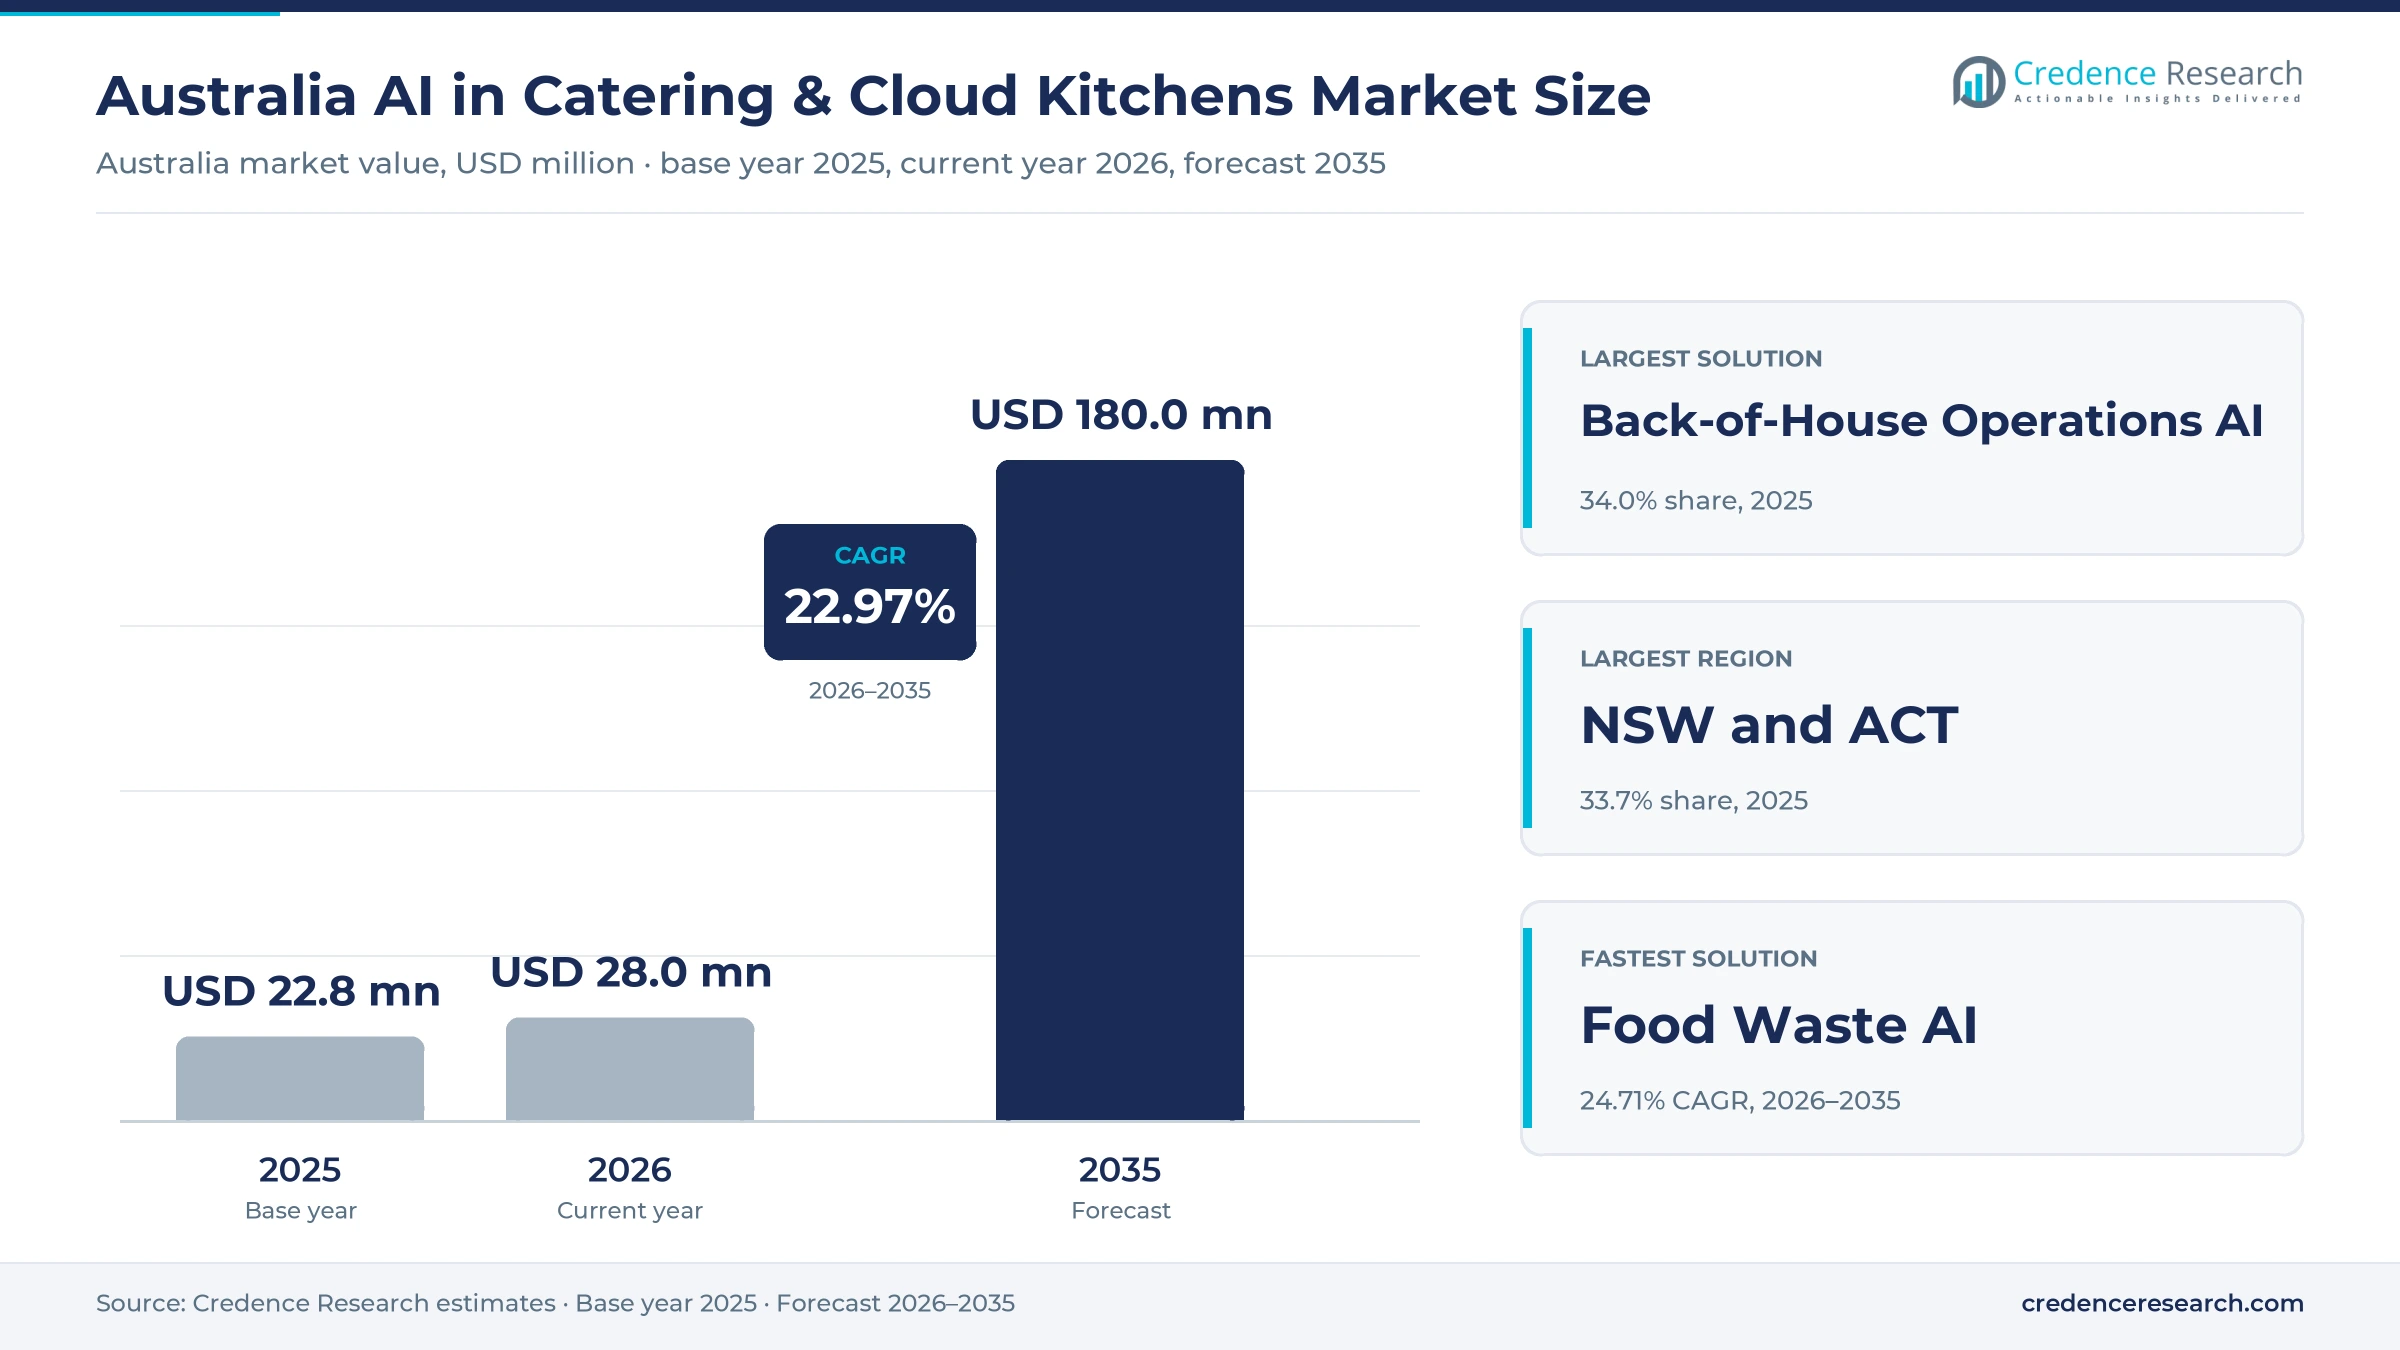
The Australia AI in catering and cloud kitchens market was valued at USD 22.8 million in 2025 and is projected to increase from USD 28.0 million in 2026 to USD 180.0 million by 2035, registering a CAGR of 22.97% during 2026–2035. Spending comes from caterers, cloud kitchen groups and hybrid kitchen operators that license software to forecast production, capture supplier invoices, price menus and track waste. The pressure behind that spending is operating cost, because Restaurant & Catering Australia put sector margins as low as 2.3% in May 2026. New South Wales and Australian Capital Territory held the largest regional share, 33.7% in 2025, while Queensland is the fastest-growing zone at 23.62% a year. Adoption is still thin, as the Australian Bureau of Statistics found that only 5% of accommodation and food services businesses used AI in 2024–25. However, Guzman y Gomez scheduled AI-capable kitchen displays for all its Australian restaurants from May 2026, which signals a move from pilots to chainwide systems.
What does AI spending in Australian catering and cloud kitchens include?
The market counts subscription, usage and project fees paid for AI software that runs kitchen production, purchasing, analytics, ordering and food waste tracking at catering and delivery-led kitchen operators in Australia. Most buyers purchase it as monthly software per venue, while national caterers and large chains sign multi-site enterprise agreements with implementation fees attached.
The estimate excludes food sales, delivery commissions, kitchen rent, general point-of-sale hardware and payment processing margins. It also leaves out AI bought by supermarkets and food manufacturers, because those buyers run different systems. The value chain runs from model and cloud suppliers through vertical software vendors and integrators to the operators that use the tools every day.
Australia AI in Catering & Cloud Kitchens Market Insights
- The market grows from USD 22.8 million in 2025 to USD 180.0 million by 2035, a 22.97% CAGR, as operators buy software to protect thin margins.
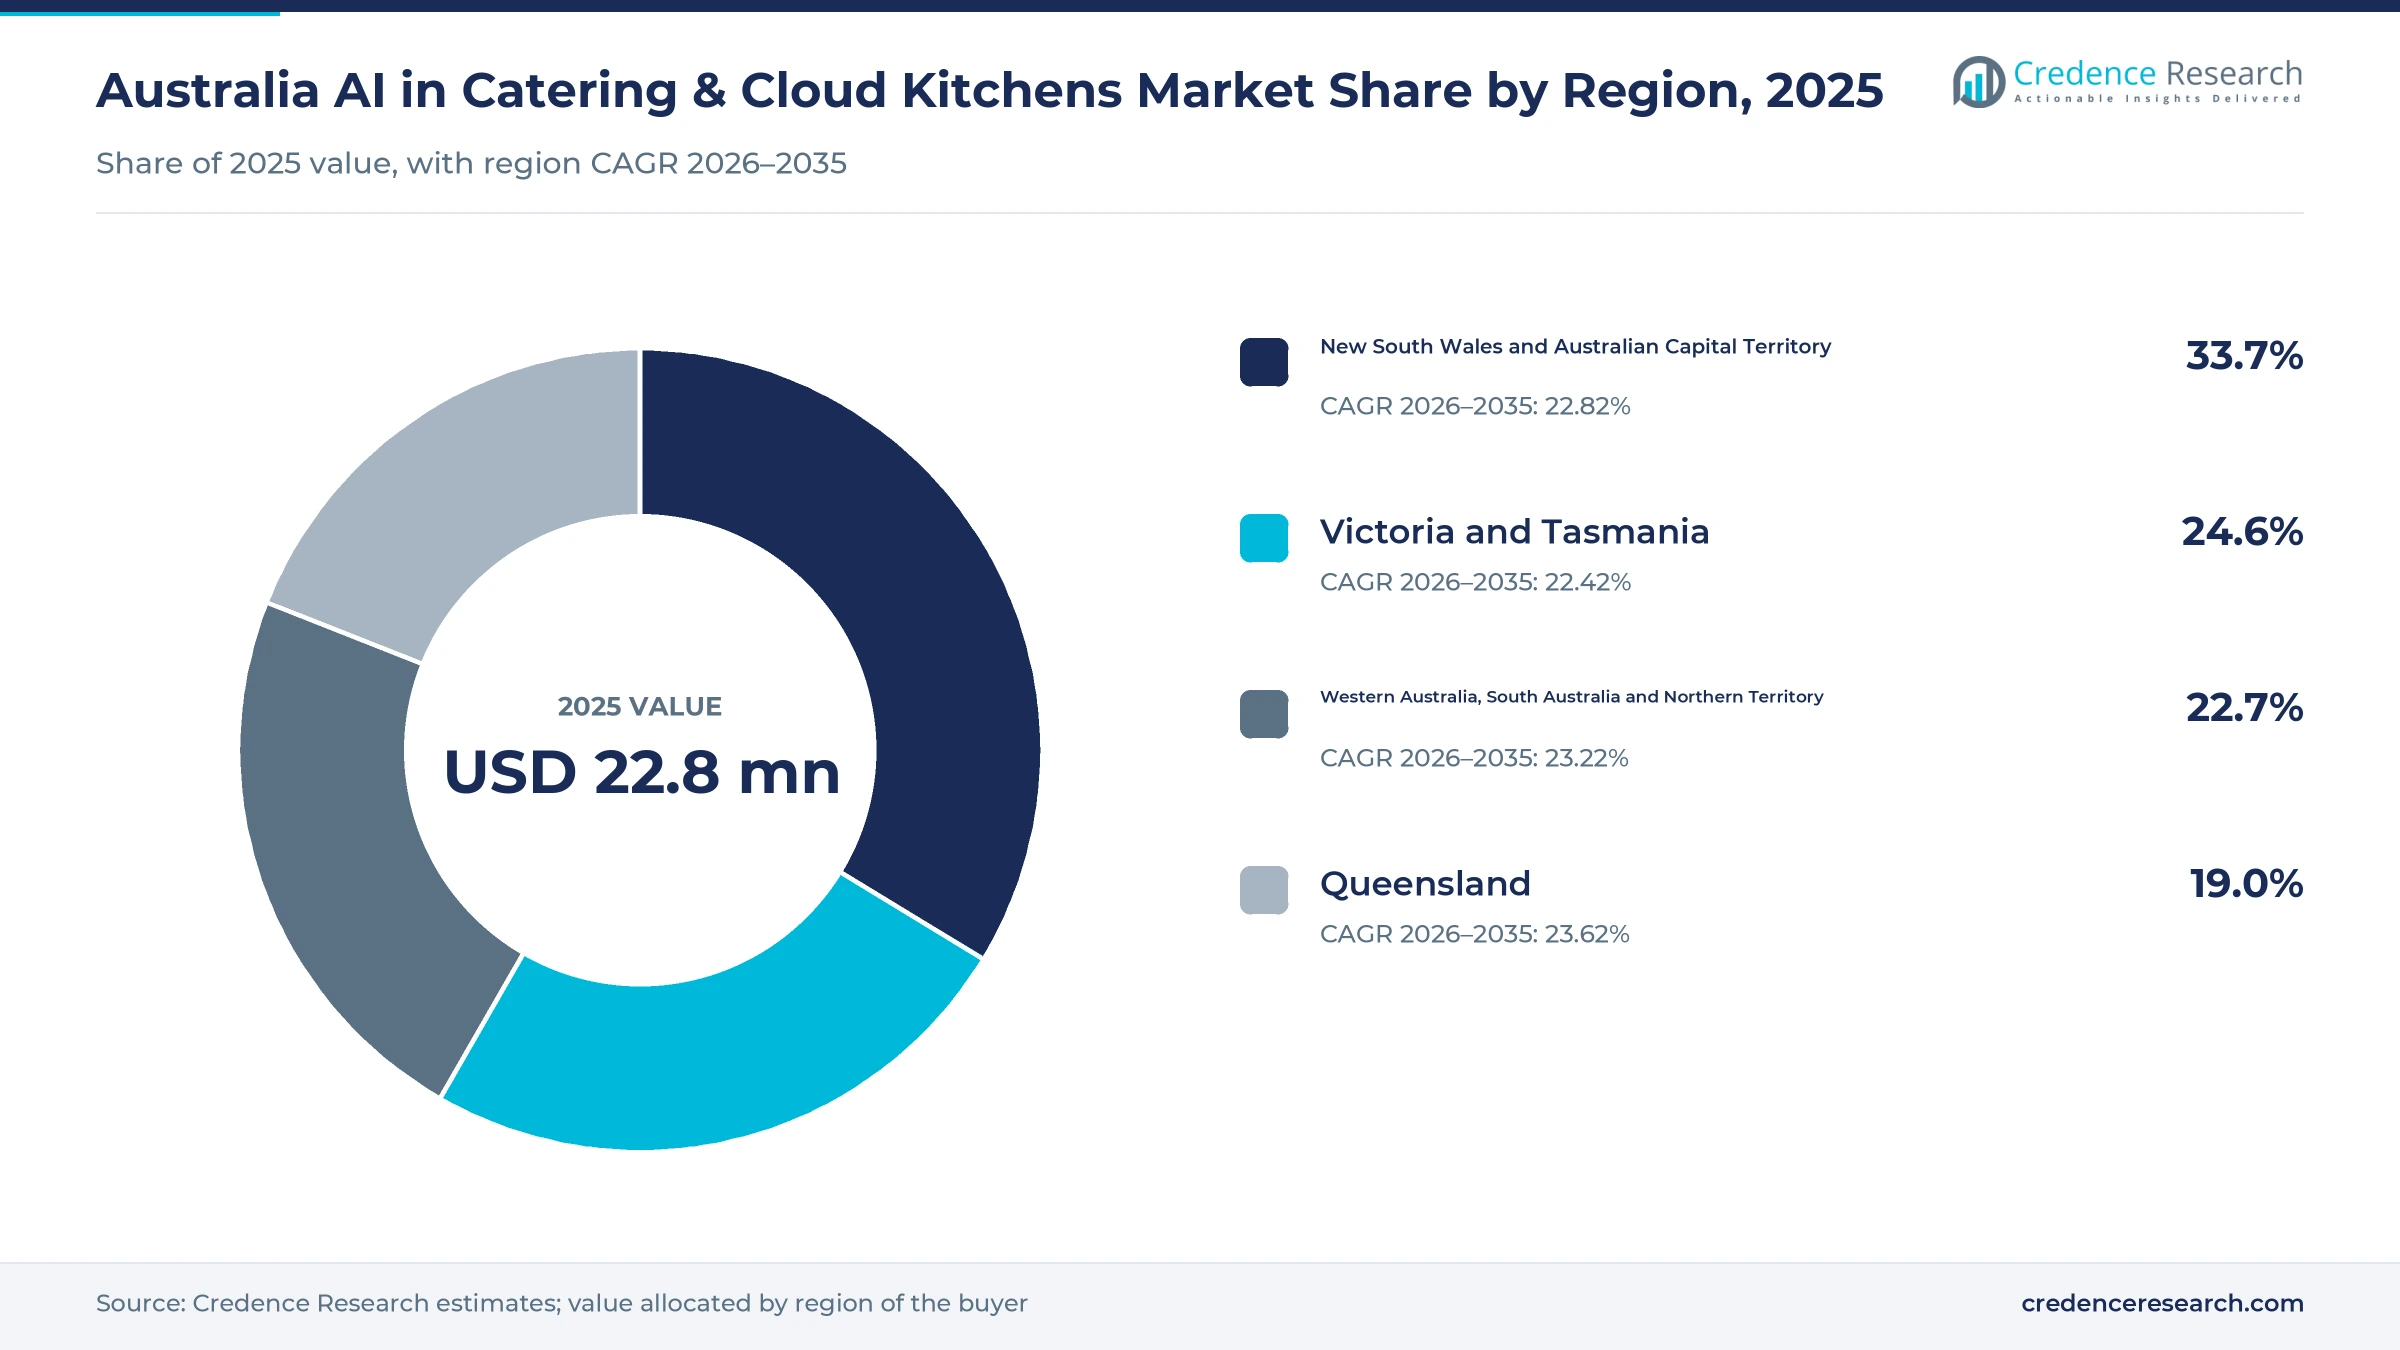
- New South Wales and Australian Capital Territory held 33.7% of 2025 value, supported by Sydney head offices and the first phase of the New South Wales food waste rules.
- Back-of-House Operations AI led with 34.0% of 2025 value, because production, labor and stock decisions directly affect the largest controllable kitchen costs.
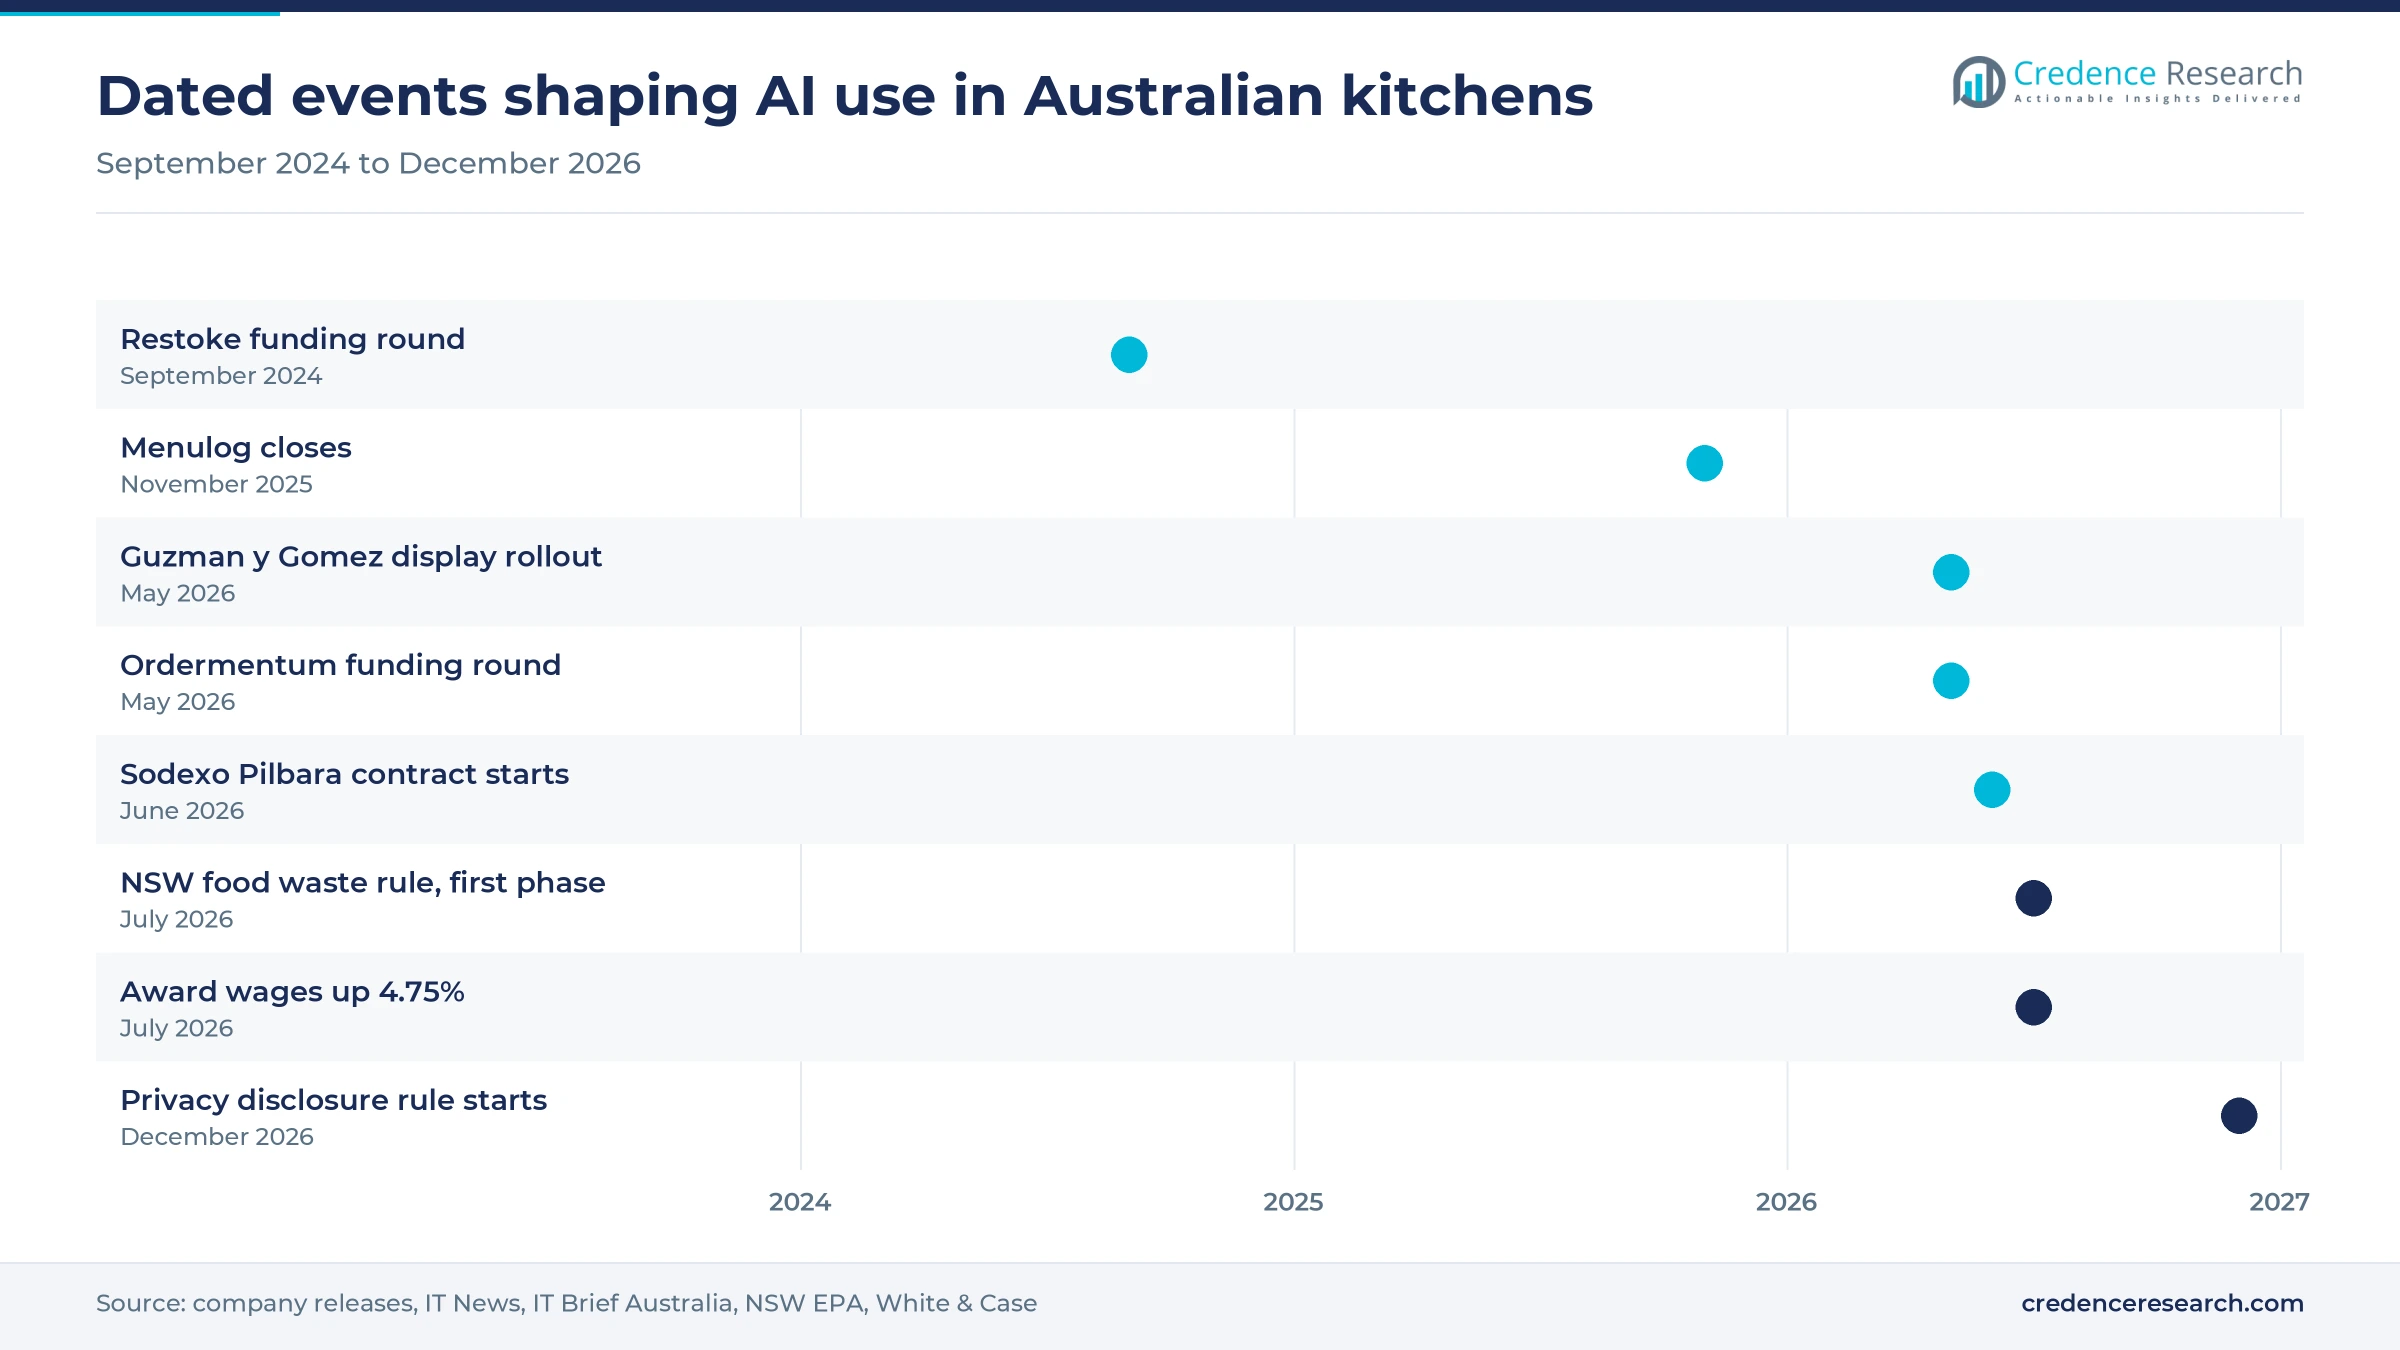
- Ordermentum raised A$55 million from Five V Capital on May 22, 2026, to deploy AI across ordering, pricing, inventory and payments for food service venues.
- Competition is led by Australian vertical start-ups such as Restoke, me&u and Ordermentum, which connect to point-of-sale and accounting systems rather than replacing them.
Back-of-house tools and caterers anchor software spending
Why do back-of-house tools hold the largest share of spending?
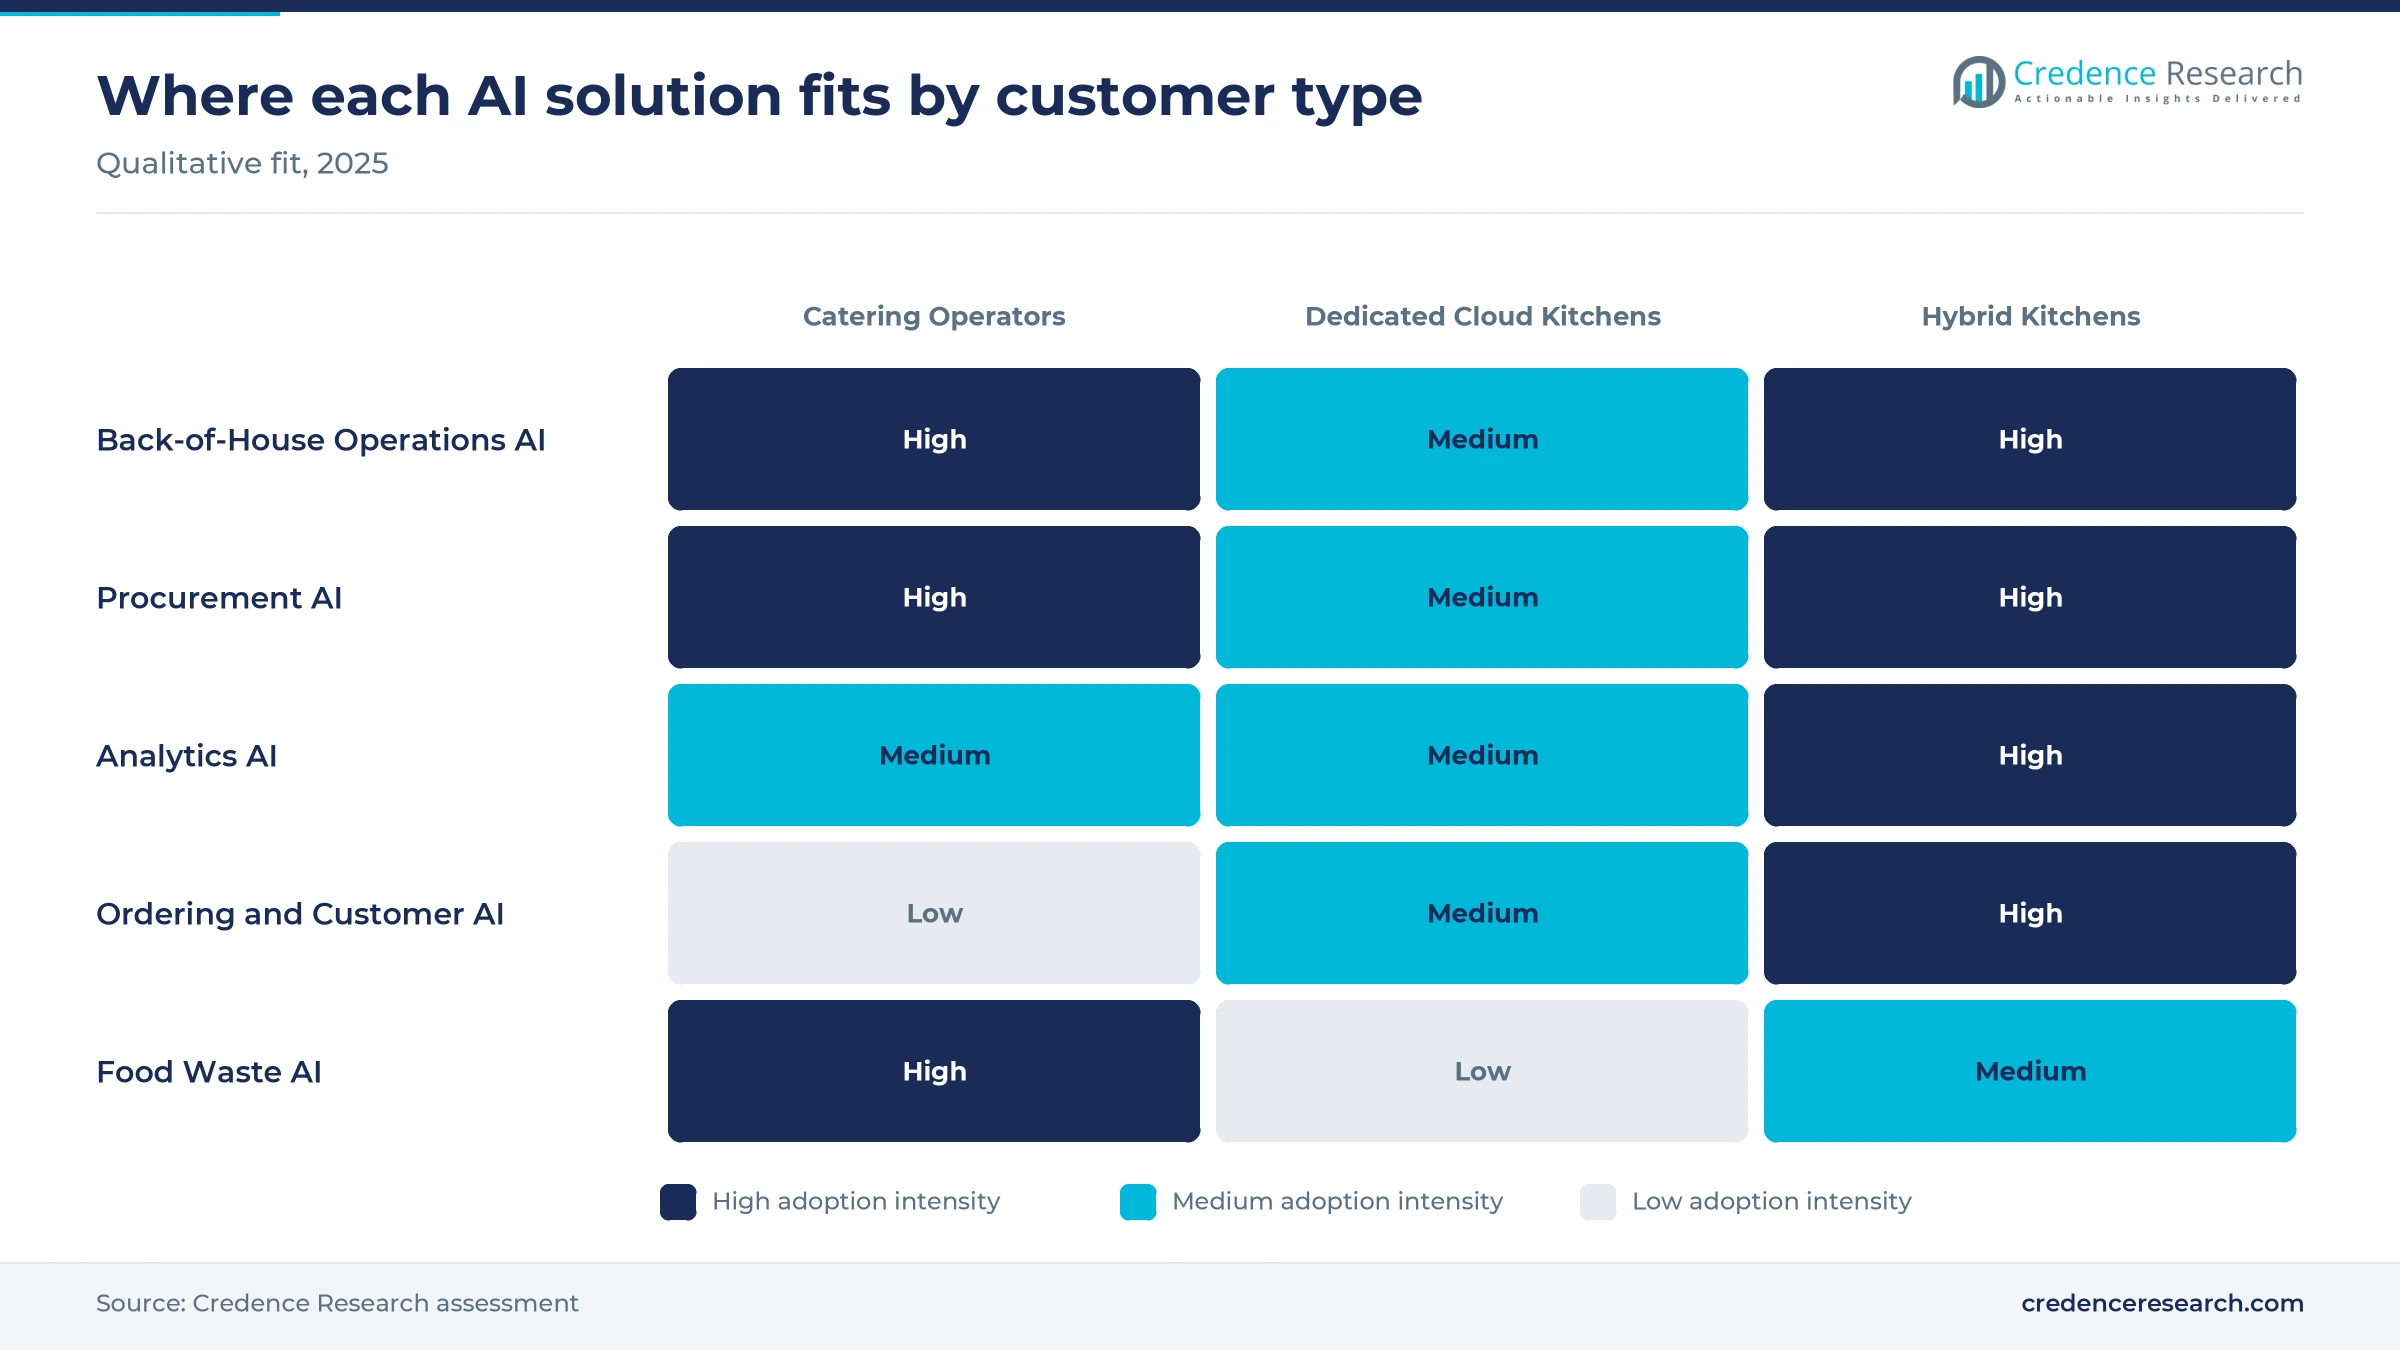
Based on solution type, the market is categorized into Back-of-House Operations AI, Procurement AI, Analytics AI, Ordering and Customer AI, and Food Waste AI. Back-of-House Operations AI led with 34.0% of 2025 value because production planning touches the largest costs, and IT News reported in April 2026 that about 16,000 Guzman y Gomez employees would work with its new kitchen display system. Food Waste AI grows fastest at 24.71% a year as New South Wales began phasing in mandatory food waste separation on July 1, 2026, which gives large kitchens a reason to measure what they discard.
Why do catering operators outspend delivery-only kitchens?
Based on customer type, the market is categorized into Catering Operators, Dedicated Cloud Kitchen Operators and Hybrid Kitchen Operators. Catering Operators led with 52.0% of 2025 value because contract volumes are large, and Rio Tinto said in May 2026 that about 14 million meals a year are served to its Pilbara workforce. Hybrid Kitchen Operators grow fastest at 23.64% a year as existing venues add delivery without new premises, while Menulog stopped taking orders on Nov. 26, 2025, according to The New Daily, which makes single-platform, delivery-only models harder to sustain.
How do operators choose between SaaS and on-site processing?
Based on deployment model, the market is categorized into Public Cloud SaaS, Private Cloud and Hybrid Deployment. Public Cloud SaaS led with 72.0% of 2025 value because independent venues can start at low monthly prices, and the Xero App Store lists Restoke plans at A$139 and A$219 a month before tax. Hybrid Deployment grows fastest at 23.95% a year as chains process kitchen data on site, and IT News reported in April 2026 that the HP displays chosen by Guzman y Gomez carry neural processors that run AI workloads inside each restaurant.
Why does cost control outrank revenue and compliance uses?
Based on application, the market is categorized into Cost Optimisation, Revenue Optimisation and Compliance Support. Cost Optimisation led with 61.0% of 2025 value because Restaurant & Catering Australia reported in May 2026 that 41% of businesses were already cutting staff hours, which makes labor and food savings the easiest purchase to justify. Compliance Support grows fastest at 24.15% a year as Food Standards Australia New Zealand requires higher-risk caterers to substantiate critical food safety controls under Standard 3.2.2A, in force since December 2023, and digital temperature and cleaning records are a practical way to hold that evidence.
| Segment Group | Leading Sub-segment | Share, 2025 | Fastest-growing Sub-segment | CAGR, 2026–2035 |
|---|---|---|---|---|
| By Solution Type | Back-of-House Operations AI | 34.0% | Food Waste AI | 24.71% |
| By Customer Type | Catering Operators | 52.0% | Hybrid Kitchen Operators | 23.64% |
| By Deployment Model | Public Cloud SaaS | 72.0% | Hybrid Deployment | 23.95% |
| By Application | Cost Optimisation | 61.0% | Compliance Support | 24.15% |
Request a Free Sample
Fill in your details and we'll send you a free sample report.
- Sample data tables & charts
- Research methodology
Wage, invoice and waste pressures drive software buying
How does operating cost productivity lift demand for AI tools?
Labor and input costs give operators the clearest reason to pay for forecasting and scheduling tools. The Fair Work Commission lifted modern award rates by 4.75% from July 1, 2026, according to Squire Patton Boggs, which raises the cost of every rostered kitchen hour. CreditorWatch reported a 12.03% closure rate among cafes, restaurants and takeaways in the 12 months to July 2026, nearly double the 6.69% national average. As a result, buyers judge software on payback within weeks, and Forbes Australia reported that Restoke claims savings of more than A$8,000 a week for its customers, a figure that comes from the company. Cost Optimisation therefore held 61.0% of 2025 value across the application groups.
Why is invoice and procurement digitization spreading across kitchens?
Supplier paperwork is the cheapest entry point for AI, because each invoice already holds the prices that feed food costing. Ordermentum said on May 22, 2026, that it is embedded in about half of Australian venues and has added AI to ordering, pricing, inventory and payments, after raising A$55 million from Five V Capital. The Xero App Store listing for Restoke describes unlimited AI invoice processing that reads suppliers, line items and taxes, then updates ingredient prices automatically. Procurement also gains from public rules, since Avalara reported in September 2025 that Commonwealth agencies must receive 30% of supplier invoices through Peppol by mid-2026. Sovos noted that suppliers themselves face no legal requirement, so uptake among caterers remains commercial.
What makes integrated kitchen workflows a buying priority?
Operators want one system to connect orders, stock and production, because disconnected tools leave managers making timing decisions by feel. IT News reported on April 24, 2026 that Guzman y Gomez would finish installing new kitchen displays across 225 Australian restaurants within six weeks from early May, starting with algorithms that balance orders between production lines. IT Brief Australia reported on Aug. 24, 2026, that Otto and Restoke linked AI phone ordering to menu and stock data, so calls can steer diners toward higher-margin dishes. Otto also connects to Square, Lightspeed and Doshii, which shows that integration matters more than replacing installed systems. These links support the 34.0% share held by back-of-house tools.
How do food waste rules and costs add a fourth reason to buy?
Food waste has moved from a sustainability topic to a measurable cost line with legal deadlines attached. The NSW Environment Protection Authority requires separation at sites with about 4,000 liters of weekly general waste from July 1, 2026, with thresholds falling to about 2,000 liters in 2028 and about 700 liters in 2030. Restaurant & Catering Australia reported in April 2026 that hospitality produces about 1.2 million metric tons of food waste a year, 16% of the national total, and that prevention returns more than six dollars for each dollar spent. The association also said 80% of catering sites adopting reduction programs recover their costs within two years, which gives food waste AI a clear payback argument.
Agentic kitchens and voice AI reshape operator priorities
Shift from predictive dashboards to agentic kitchen systems
Vendors are moving from reports that describe a problem to software that recommends or takes the next step. IT Brief Australia reported on Dec. 16, 2025, that Melbourne-based Restoke had moved from predictive analytics to what its co-founder calls true agentic automation, while still asking staff to confirm when its confidence is low. The new displays at Guzman y Gomez were in nine restaurants by April 2026, and the chain is prototyping a forecasting module that would advise when to restock and cook, while its chief technology officer said people would keep the final decision on closing a production line. As a result, human approval remains part of how these systems reach kitchens. The wider category of food and beverage technology is following a similar path.
Rise of voice AI on restaurant and catering phone lines
Phone calls have emerged as a practical first use of customer-facing AI, because missed calls translate directly into lost bookings. IT Brief Australia reported on Aug. 12, 2026, that me&u launched a reservations product with voice AI, co-designed with Sydney venue Aria and being rolled out by the 16-venue Solotel group. The restaurant reservations software category is therefore gaining an ordering and guest-data layer. Restaurant & Catering Australia described a Sydney operator whose AI handled 859 overflow calls in a month, of which about 200 became confirmed bookings. Lime Mexican, a 120-seat restaurant in Sawtell, New South Wales, also uses Otto for takeaway orders and booking enquiries, which shows that the tools now reach regional venues.
Opportunity in contract catering for mining and Defense sites
Remote and institutional catering offers an opening for vendors because volumes are large and each contract runs for years. Rio Tinto said on May 5, 2026, that Sodexo won a seven-year Pilbara contract from June 2026 covering 25 villages where more than 10,000 people stay each night. ISS signed a six-year agreement in September 2025 covering catering and other services at 85 Defense sites in South Australia and Western Australia, worth about DKK 300 million a year and including digital improvements, according to FM Business Daily. Sodexo Australia also reports feeding more than 25,000 workers daily across 100-plus sites. Fixed menus and predictable headcounts suit production forecasting, so a single enterprise win can equal thousands of small venue subscriptions.
Opportunity among small operators with low formal AI use
Small kitchens represent the largest pool of unsold accounts, although the published adoption data point in different directions. The Australian Bureau of Statistics found that 5% of accommodation and food services businesses used AI in 2024–25, compared with 12% of all businesses. In contrast, the federal AI Adoption Tracker recorded 42% among hospitality small and medium businesses in early 2025, using a broader definition that captures any use. Across all industries, the same tracker showed 33% among firms with up to four staff and 82% among those with 200 to 500. Because Restoke lists plans from A$139 a month, cost is less of a barrier than setup time, and vendors that automate onboarding can close that gap.
Closures, platform exits and privacy rules slow adoption
How do closures and arrears limit software budgets?
Financial stress shortens the time an operator will keep paying for software. CreditorWatch reported that 10.21% of food and beverage businesses were at least 60 days in arrears in July 2026, against 5.36% nationally. Tourism Research Australia data cited by IT Brief Australia showed only 51% of cafes, restaurants and takeaways operating in June 2021 were still trading in June 2025. Vendors serving independents and cloud kitchens therefore face high churn, and many respond with monthly contracts and rapid payback promises.
What does delivery platform concentration mean for cloud kitchens?
Delivery-led kitchens depend on a shrinking group of platforms, which limits the data and margin they control. Menulog stopped taking orders on Nov. 26, 2025, according to SmartCompany, three years after Deliveroo shut its local operations in 2022. Hospitality Hub says commissions can reach 30% to 35% an order. Delivery-only ghost brands therefore have little spare margin for software, which is why vendors target hybrid venues first.
How will automated decision rules affect workforce AI?
Privacy reform adds legal work for any tool that uses staff or customer data in significant decisions. White & Case reports that from Dec. 10, 2026, privacy policies must disclose the personal information used by such programs and the types of decisions involved, with employment named among the examples. Rostering and performance tools may therefore need legal review, which slows procurement at larger operators. Guzman y Gomez has kept AI out of staff rosters for now, according to IT News.
Why do training gaps slow kitchen AI rollouts?
Software only pays back when kitchen staff trust and use it, and many businesses lack the structure to teach them. Restaurant & Catering Australia said in April 2026, citing its 2025 benchmarking report, that nearly 60% of hospitality businesses have no structured staff training program. Casual rosters compound the problem, because each new starter must learn the system again. Vendors are responding with human confirmation prompts and simpler interfaces, although larger operators still need dedicated rollout teams and budgets.
Sydney and Melbourne lead while Queensland grows fastest
| Region | Value, 2025 (USD million) | Share, 2025 | CAGR, 2026–2035 |
|---|---|---|---|
| New South Wales and Australian Capital Territory | 7.7 | 33.7% | 22.82% |
| Victoria and Tasmania | 5.6 | 24.6% | 22.42% |
| Western Australia, South Australia and Northern Territory | 5.2 | 22.7% | 23.22% |
| Queensland | 4.3 | 19.0% | 23.62% |
New South Wales and Australian Capital Territory lead on rules and head offices
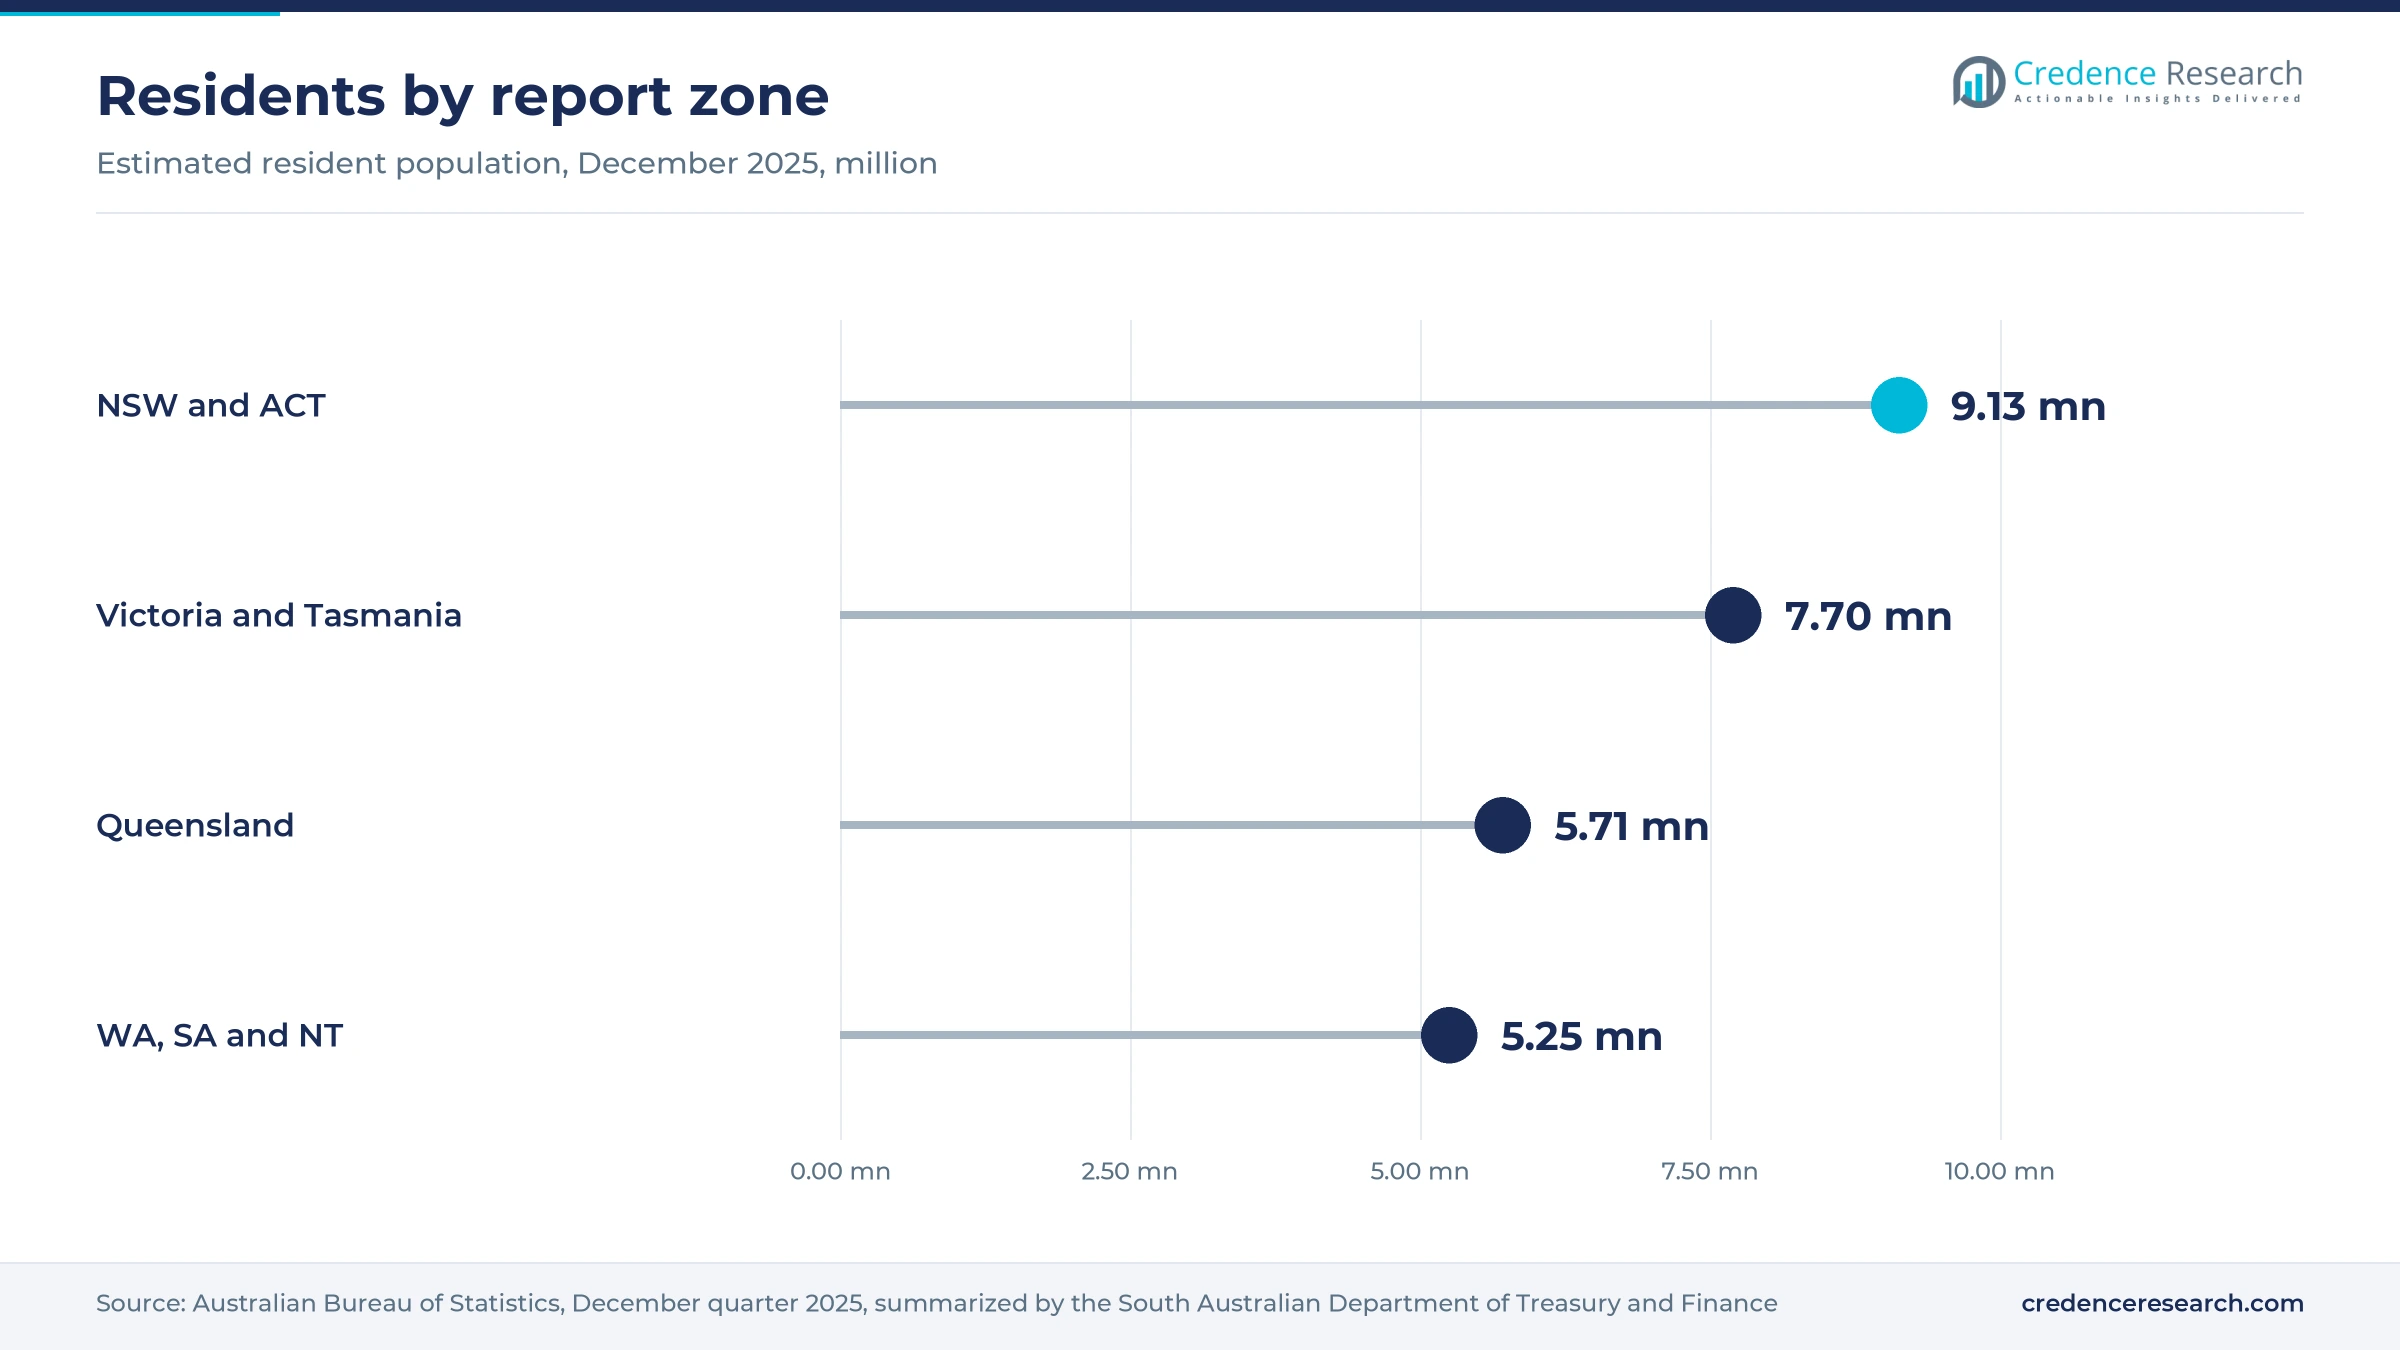
New South Wales and Australian Capital Territory held a 33.7% share of 2025 value and grows at 22.82% a year. The zone had about 9.13 million residents at December 2025, according to Australian Bureau of Statistics data, and it hosts Sydney-based Ordermentum alongside the Aria venue where me&u tested its reservations product. The phased New South Wales food waste separation rules also began on July 1, 2026, which adds a compliance reason to measure kitchen waste.
Victoria and Tasmania build on a Melbourne software base
Victoria and Tasmania held a 24.6% share of 2025 value and the zone grows at 22.42% a year, the slowest pace of the four zones. The zone had about 7.70 million residents at December 2025, and Melbourne is home to Restoke, whose early customers were mostly Australian before the company launched in the U.S. in April 2025. Because Restoke builds its back-of-house software from that base, operators in the zone have a local supplier of invoice and procurement tools.
Queensland grows fastest ahead of the 2032 Games
Queensland held a 19.0% share of 2025 value and grows fastest at 23.62% a year, from a base of about 5.71 million residents at December 2025. Jobs Queensland says nearly 200,000 Queenslanders work in accommodation and food services, and it expects the 2032 Olympic Games and the Queens Wharf precinct to raise demand for more skilled hospitality workers. Because event catering peaks are hard to staff, operators in the state have a practical reason to adopt forecasting and scheduling tools before those volumes arrive.
Western Australia, South Australia and Northern Territory rely on remote catering
Western Australia, South Australia and Northern Territory held a 22.7% share of 2025 value and grows at 23.22% a year, a share above the zone's 5.25 million residents would suggest. Large remote contracts explain that gap, because Sodexo's Rio Tinto agreement supports about 2,500 jobs in Western Australia, and the ISS Defense contract covering Western Australia and South Australia was due to begin in early 2026. These accounts buy centrally, so a few enterprise decisions can move spending across the entire zone.
Funding rounds and chain rollouts marked 2024 to 2026
| Development | Status and market relevance |
|---|---|
| In September 2024, Restoke closed an A$5.1 million funding round led by Rampersand, with more than 2,000 restaurants and cafes on its platform across four countries. | Completed; the company launched in the U.S. in April 2025 |
| In April 2026, Guzman y Gomez outlined plans for agentic kitchen systems and said HP displays would reach all 225 Australian restaurants after a May start. | Rollout under way; the forecasting module remains a prototype |
| In May 2026, Ordermentum raised A$55 million from Five V Capital to deploy AI across ordering, pricing, inventory and payments for venues and suppliers. | Completed; the round included secondary share sales |
| In August 2026, me&u launched me&u Reservations with voice AI, co-designed with Aria Restaurant in Sydney, with Solotel rolling it out across its venues. | Live at Aria; group rollout in progress |
| In August 2026, Otto and Restoke connected AI phone ordering to menu performance and stock data so that calls can favor higher-margin dishes. | Announced; the link applies during live phone orders |
Kitchen displays and invoice capture set the technical base
- Optical character recognition reads supplier, line item and tax details from uploaded invoices, which gives food costing systems current ingredient prices without manual entry.
- Edge-capable kitchen displays run AI workloads on site through neural processors, as in the HP hardware chosen by Guzman y Gomez, so that AI workloads can run inside each restaurant.
- Voice AI agents answer inbound calls, take orders and pass difficult requests to staff, and they gain value when connected to point-of-sale and menu data.
- Computer vision waste tracking identifies discarded items with a camera and prices them, an approach Winnow introduced to Australia in August 2019 with OzHarvest's ForPurposeCo for hotel kitchens.
Need a Custom Version of This Report?
Tailor the scope, geography, or segments to your exact requirements.
- Custom geography or segment scope
- Direct access to our analyst team
Australian start-ups compete with global point-of-sale
Competition centers on Australian vertical software firms that sit on top of the systems kitchens already use. Restoke focuses on back-of-house costing, invoices and stock, while Ordermentum approaches the same operators through supplier ordering and payments, and me&u moves from ordering into reservations and voice AI. Otto concentrates on phone orders and depends on integrations with Square, Lightspeed and Doshii, which keeps those point-of-sale providers central to any rollout. Square also shapes buyer expectations through research such as its January 2025 survey, which included 500 Australian operators. Large catering groups and chains behave differently, because they can build or specify their own tools, as Guzman y Gomez has done with its order platform. As a result, specialist vendors win independents and midsize groups first, then compete for enterprise accounts through integration depth, reliable data and evidence of savings rather than price alone.
Which companies are active in the Australian market?
| Company | Type | Role in the market |
|---|---|---|
| Restoke | Vertical software vendor | Melbourne-based AI back-of-house platform covering invoices, food costing, inventory and supplier ordering |
| Ordermentum | Ordering and payments platform | Sydney-based supplier ordering network adding AI to pricing, inventory and payments |
| me&u | Ordering and guest platform | Australian ordering group that launched voice AI reservations with Aria in August 2026 |
| Otto | Voice AI vendor | AI phone ordering used by venues such as Lime Mexican in Sawtell, New South Wales |
| Square | Point-of-sale and payments | Integration partner for Otto and sponsor of operator research including Australian respondents |
| Winnow | Food waste AI vendor | Introduced Winnow Vision to Australia in 2019 through OzHarvest's ForPurposeCo |
| Sodexo | Catering buyer | Seven-year Rio Tinto Pilbara facilities contract from June 2026, including catering |
| ISS | Catering buyer | Six-year Defense contract across South Australia and Western Australia, including catering |
| Guzman y Gomez | Chain buyer and developer | Building agentic kitchen workflow tools on HP displays across its Australian restaurants |
Contract caterers are the largest untapped accounts
Credence Research's view is that the market will be decided less by model quality than by who owns the kitchen's daily data. Australian vendors have an early lead among independents and cloud kitchens, yet the largest untapped budgets sit with contract caterers feeding mining villages and Defense bases, where the Sodexo and ISS agreements run for six years or more. The main risk to the 22.97% forecast rate is operator failure rather than weak interest, given closure data from CreditorWatch. Vendors that prove savings within a quarter and survive legal review of workforce tools should hold the strongest positions by 2030.
How the Australian market estimate was built
The report uses 2025 as the base year and forecasts 2026 to 2035, with market values drawn from the Credence Research model. Regional, segment and application splits are Credence Research estimates, informed by public data and cross-checked against top-down and bottom-up calculations. Sources include the Australian Bureau of Statistics, federal and state regulators, Food Standards Australia New Zealand, industry associations, company announcements and named trade publications. No interviews or surveys were conducted for this edition, and vendor savings claims are reported as claims rather than verified results.
Compliance and chain rollouts shape demand through 2035
Through 2035 the market grows from USD 28.0 million in 2026 to USD 180.0 million, and three dated events set the early direction. New South Wales lowers its food waste threshold in 2028 and again in 2030, which steadily brings smaller kitchens into scope. Agentic features should also move from chain pilots to standard packages as Guzman y Gomez and Restoke report results. Beyond that, the United Nations target of halving per capita food waste by 2030 keeps waste reporting on the policy agenda. Hybrid sites, cloud kitchens with visible venues and compliance tools should gain share, while cost control remains the leading reason to buy.
Frequently Asked Questions
How big is the Australia AI in catering and cloud kitchens market?
Which solution type leads the market?
Which region holds the largest share?
Which region is growing fastest?
How widely do Australian food service businesses use AI?
What is driving demand for these tools?
What are the main challenges?
Which companies are active in Australia?
Table of Content
Chapter 1 Market Segmentation
- 1.1 Segmentation Framework
- 1.1.1 Product and Service Classification
- 1.1.2 Application and End-Use Classification
- 1.1.3 Technology and Solution Classification
- 1.1.4 Customer and Distribution Channel Classification
- 1.1.5 Geographic Segmentation
- 1.1.6 Market Segment Definitions and Boundaries
- 1.2 By Solution Type
- 1.2.1 Back-of-House Operations AI
- 1.2.2 Procurement AI
- 1.2.3 Analytics AI
- 1.2.4 Ordering and Customer AI
- 1.2.5 Food Waste AI
- 1.3 By Customer Type
- 1.3.1 Catering Operators
- 1.3.2 Dedicated Cloud Kitchen Operators
- 1.3.3 Hybrid Kitchen Operators
- 1.4 By Deployment Model
- 1.4.1 Public Cloud SaaS
- 1.4.2 Private Cloud
- 1.4.3 Hybrid Deployment
- 1.5 By Application
- 1.5.1 Cost Optimisation
- 1.5.2 Revenue Optimisation
- 1.5.3 Compliance Support
Chapter 2 Introduction
- 2.1 Report Objectives and Scope
- 2.2 Product Definition and Industry Terminology
- 2.3 Market Inclusions and Exclusions
- 2.4 Research Process
- 2.4.1 Primary Research and Expert Interviews
- 2.4.2 Secondary Research and Source Review
- 2.4.3 Top-Down and Bottom-Up Estimation
- 2.4.4 Data Triangulation and Verification
- 2.5 Market Size Measurement Basis
- 2.5.1 2025: USD 22.8 million → 2035: USD 180.0 million
- 2.6 Historical and Forecast Reference Periods
- 2.6.1 Historical Period: 2018-2025
- 2.6.2 Base Year: 2025
- 2.6.3 Forecast Period: 2025-2035
- 2.7 Research Assumptions and Limitations
Chapter 3 Executive Summary
- 3.1 Market Snapshot and Key Findings
- 3.2 Base-Year Market Size, 2025
- 3.3 Forecast Market Size, 2035
- 3.4 Revenue and Volume Growth Outlook
- 3.5 Key Demand and Supply Indicators
- 3.6 Leading Market Segments
- 3.7 Fastest-Growing Market Opportunities
- 3.8 Regional Performance Highlights
- 3.9 Technology and Industry Transformation
- 3.10 Competitive Landscape Summary
- 3.11 Analyst View and Strategic Implications
Chapter 4 Australia AI in Catering & Cloud Kitchens Market Trends and Developments
- 4.1 Historical Industry Development, 2018-2025
- 4.2 Recent Market Trends and Developments
- 4.3 Demand and Customer Behavior Trends
- 4.4 Technology and Product Innovation
- 4.5 Artificial Intelligence, Automation and Digitalization
- 4.6 Local Manufacturing and Supply Chain Realignment
- 4.7 Industry Partnerships, Mergers and Acquisitions
- 4.8 Sustainability and Circular Economy Developments
- 4.9 Government and Private Sector Investment Trends
- 4.10 Emerging Business Models and Commercialization
- 4.11 Industry Developments and Announcements
Chapter 5 Australia AI in Catering & Cloud Kitchens Market Supply and Demand Analysis
- 5.1 Demand Trend and Consumption Analysis, 2018-2025
- 5.2 Demand Forecast, 2025-2035
- 5.3 Supply Chain Structure and Procurement Trends
- 5.4 Supply-Demand Gap and Bottlenecks
- 5.5 Import Dependence and Sourcing Structure
- 5.6 Regional Supply and Demand Concentration
Chapter 6 Australia AI in Catering & Cloud Kitchens Market Pricing Analysis
- 6.1 Pricing Structure and Measurement
- 6.2 Historical Pricing Trends, 2018-2025
- 6.3 Pricing Outlook, 2025-2035
- 6.4 Pricing by Product and Market Segment
- 6.5 Geographic Pricing Differences
- 6.6 Key Input, Energy, Labor and Logistics Costs
- 6.7 Contract Pricing and Purchasing Models
- 6.8 Pricing Sensitivity and Competitive Positioning
- 6.9 Price, Margin and Profitability Implications
Chapter 7 Australia AI in Catering & Cloud Kitchens Market Dynamics
- 7.1 Market Growth Drivers
- 7.1.1 Demand-Side Drivers
- 7.1.2 Technology and Innovation Drivers
- 7.1.3 Infrastructure and Investment Drivers
- 7.1.4 Regulatory and Policy Drivers
- 7.2 Market Restraints
- 7.2.1 Cost and Affordability Constraints
- 7.2.2 Technology and Adoption Barriers
- 7.2.3 Supply Chain and Operational Constraints
- 7.3 Market Challenges
- 7.3.1 Competitive Pressure and Margin Erosion
- 7.3.2 Skills, Infrastructure and Implementation Gaps
- 7.4 Emerging Market Opportunities
- 7.5 Market Dynamics Impact and Time-Horizon Assessment
Chapter 8 Australia AI in Catering & Cloud Kitchens Value Chain Analysis
- 8.1 Industry Value Chain Overview
- 8.2 Upstream Suppliers and Critical Inputs
- 8.3 Technology and Component Providers
- 8.4 Manufacturing or Service Delivery
- 8.5 Distribution, Channel Partners and Integrators
- 8.6 Downstream Applications and End Users
- 8.7 Value Addition and Profit Pools
- 8.8 Vertical Integration and Outsourcing
- 8.9 Supplier Concentration and Risk
- 8.10 Supply Chain Localization and Resilience
Chapter 9 Australia AI in Catering & Cloud Kitchens Market Regulations and Policies
- 9.1 Relevant Laws, Standards and Compliance Frameworks
- 9.2 Product, Service, Safety and Quality Requirements
- 9.3 Government Policies, Incentives and Subsidies
- 9.4 Imports, Exports and Trade Barriers
- 9.5 Public Procurement and Local Content Requirements
- 9.6 Data Protection, AI and Cybersecurity Compliance
- 9.7 Upcoming Policy Changes and Market Implications
Chapter 10 Australia AI in Catering & Cloud Kitchens Market Hotspots and Opportunities
- 10.1 Market Opportunity Mapping and Growth Hotspots
- 10.2 High-Growth Applications and Customer Groups
- 10.3 Underserved Markets and White-Space Opportunities
- 10.4 Emerging Technology and Product Opportunities
- 10.5 New Capacity and Investment Hotspots
- 10.6 Market Entry and Expansion Opportunities
- 10.7 Distribution and Partnership Opportunities
- 10.8 Near-Term and Long-Term Commercial Potential
- 10.9 Opportunity Attractiveness and Execution Risks
Chapter 11 Australia AI in Catering & Cloud Kitchens Market Outlook, 2025-2035
- 11.1 Market Size and Analysis
- 11.1.1 Revenue (Market Measurement: 2025: USD 22.8 million → 2035: USD 180.0 million)
- 11.1.2 Historical Market Size, 2018-2025
- 11.1.3 Base-Year Market Size, 2025
- 11.2 Market Forecast, 2025-2035
- 11.2.1 Revenue Forecast to 2035
- 11.2.2 CAGR and Year-on-Year Growth
- 11.2.3 Incremental Revenue Opportunity
- 11.3 Forecast Assumptions and Scenario Analysis
- 11.3.1 Base-Case Forecast
- 11.3.2 Optimistic and Conservative Scenarios
- 11.3.3 Technology, Pricing and Policy Sensitivities
- 11.4 Market Attractiveness and Growth Outlook
Chapter 12 Australia AI in Catering & Cloud Kitchens Market Segmentation and Outlook
- 12.1 Segmentation Summary and Market Shares, 2025
- 12.2 Largest and Fastest-Growing Segments
- 12.3 By Solution Type - Market Size and Forecast, 2025-2035
- 12.3.1 Segment Definition and Scope
- 12.3.2 Historical Market Size, 2018-2025
- 12.3.3 Revenue Forecast, 2025-2035
- 12.3.4 Base-Year Market Share, 2025
- 12.3.5 Segment CAGR and Growth Drivers
- 12.3.6 Subsegment Market Size and Forecast
- 12.3.6.1 Back-of-House Operations AI
- 12.3.6.2 Procurement AI
- 12.3.6.3 Analytics AI
- 12.3.6.4 Ordering and Customer AI
- 12.3.6.5 Food Waste AI
- 12.3.7 Subsegment Pricing and Adoption Trends
- 12.3.8 Leading Suppliers and Competition
- 12.3.9 Regional Demand and Opportunities
- 12.4 By Customer Type - Market Size and Forecast, 2025-2035
- 12.4.1 Segment Definition and Scope
- 12.4.2 Historical Market Size, 2018-2025
- 12.4.3 Revenue Forecast, 2025-2035
- 12.4.4 Base-Year Market Share, 2025
- 12.4.5 Segment CAGR and Growth Drivers
- 12.4.6 Subsegment Market Size and Forecast
- 12.4.6.1 Catering Operators
- 12.4.6.2 Dedicated Cloud Kitchen Operators
- 12.4.6.3 Hybrid Kitchen Operators
- 12.4.7 Subsegment Pricing and Adoption Trends
- 12.4.8 Leading Suppliers and Competition
- 12.4.9 Regional Demand and Opportunities
- 12.5 By Deployment Model - Market Size and Forecast, 2025-2035
- 12.5.1 Segment Definition and Scope
- 12.5.2 Historical Market Size, 2018-2025
- 12.5.3 Revenue Forecast, 2025-2035
- 12.5.4 Base-Year Market Share, 2025
- 12.5.5 Segment CAGR and Growth Drivers
- 12.5.6 Subsegment Market Size and Forecast
- 12.5.6.1 Public Cloud SaaS
- 12.5.6.2 Private Cloud
- 12.5.6.3 Hybrid Deployment
- 12.5.7 Subsegment Pricing and Adoption Trends
- 12.5.8 Leading Suppliers and Competition
- 12.5.9 Regional Demand and Opportunities
- 12.6 By Application - Market Size and Forecast, 2025-2035
- 12.6.1 Segment Definition and Scope
- 12.6.2 Historical Market Size, 2018-2025
- 12.6.3 Revenue Forecast, 2025-2035
- 12.6.4 Base-Year Market Share, 2025
- 12.6.5 Segment CAGR and Growth Drivers
- 12.6.6 Subsegment Market Size and Forecast
- 12.6.6.1 Cost Optimisation
- 12.6.6.2 Revenue Optimisation
- 12.6.6.3 Compliance Support
- 12.6.7 Subsegment Pricing and Adoption Trends
- 12.6.8 Leading Suppliers and Competition
- 12.6.9 Regional Demand and Opportunities
- 12.7 Segment Growth Comparison
- 12.8 Segment Attractiveness and Priority Matrix
Chapter 13 Australia AI in Catering & Cloud Kitchens End-Use and Application Market Outlook
- 13.1 End-Use Industry and Customer Demand Structure
- 13.2 Leading Applications and Customer Groups
- 13.3 End-Use Market Size, Share and Forecast
- 13.4 Major End-Use Industry Deep Dives
- 13.4.1 Customer Requirements and Use Cases
- 13.4.2 Demand and Replacement Cycles
- 13.4.3 Technical and Regulatory Considerations
- 13.4.4 Purchasing and Procurement Models
- 13.4.5 Leading Vendors and Distribution Channels
- 13.4.6 Forecast and Commercial Opportunities
- 13.5 Emerging Applications and Cross-Segment Demand
- 13.6 End-Use Industry Investment Priorities
Chapter 14 Australia AI in Catering & Cloud Kitchens Geographic Market Outlook, 2025-2035
- 14.1 Domestic Market Distribution and Demand Clusters
- 14.2 State- or Province-Wise Market Size and Forecast, 2025-2035
- 14.3 City and Metropolitan Market Outlook
- 14.4 Industrial, Manufacturing and Commercial Clusters
- 14.5 Geographic Concentration of Key End Users
- 14.6 Local Pricing and Purchasing Differences
- 14.7 Domestic Production Facilities and Capacity Map
- 14.8 Local Infrastructure and Project Pipeline
- 14.9 State-Level Policy and Incentive Differences
- 14.10 Subnational Investment Hotspots and Opportunities
- 14.11 Distribution and Logistics Networks
- 14.12 Domestic Competitive Footprint
Chapter 15 Australia AI in Catering & Cloud Kitchens Technology, Innovation and Sustainability Outlook
- 15.1 Technology Landscape and Maturity
- 15.2 Product, Process and Service Innovation
- 15.3 AI, Automation and Digital Tools in the Industry
- 15.4 Technology Adoption and Performance Benchmarking
- 15.5 Innovation Pipeline and R&D Investment
- 15.6 Patent and Intellectual Property Trends
- 15.7 Energy Efficiency and Resource Management
- 15.8 Sustainability, Recycling and Circularity
- 15.9 Technology Roadmap, 2025-2035
- 15.10 Risks of Obsolescence and Technology Substitution
Chapter 16 Australia AI in Catering & Cloud Kitchens Market Key Strategic Imperatives
- 16.1 Growth and Market Entry Priorities
- 16.2 High-Return Products and Segments
- 16.3 Pricing, Profitability and Cost Optimization
- 16.4 Technology Investment and Product Differentiation
- 16.5 Supply Chain Localization and Resilience
- 16.6 Distribution and Customer Acquisition
- 16.7 Partnership, Acquisition and Capacity Strategy
- 16.8 Regional Expansion Priorities
- 16.9 Short-, Medium- and Long-Term Actions
Chapter 17 Competition Outlook
- 17.1 Industry Competition Characteristics
- 17.2 Market Structure and Concentration
- 17.3 Market Share and Competitive Positioning, 2025
- 17.4 Company-Wise Revenue and Product Benchmarking
- 17.5 Production and Service Capacity Benchmarking
- 17.6 Technology, Pricing and Differentiation
- 17.7 Regional Footprint and Distribution Strength
- 17.8 Mergers, Acquisitions and Strategic Alliances
- 17.9 New Entrants and Competitive Threats
- 17.10 Porter's Five Forces and Industry Attractiveness
- 17.11 Competitive Outlook, 2025-2035
Chapter 18 Company Profiles
- 18.1 Company Coverage and Selection Criteria
- 18.2 Restoke
- 18.2.1 Business Description
- 18.2.2 Company Ownership and Geographic Presence
- 18.2.3 Product and Service Portfolio
- 18.2.4 Manufacturing and Operating Footprint
- 18.2.5 Financial Performance and Investment
- 18.2.6 Market Share and Competitive Position
- 18.2.7 Technology and Innovation Capabilities
- 18.2.8 Strategic Alliances or Partnerships
- 18.2.9 Recent Developments
- 18.2.10 Growth Strategy and Outlook
- 18.3 Ordermentum
- 18.4 me&u
- 18.5 Otto
- 18.6 Square
- 18.7 Lightspeed
- 18.8 Xero
- 18.9 Winnow
- 18.10 Sodexo
- 18.11 ISS
- 18.12 Guzman y Gomez
- 18.13 Other Relevant Market Participants
Note: Every listed company is profiled on the structure shown under the first company. The company list is preliminary and may change based on research findings, market developments, data availability and client requirements.
Chapter 19 Disclaimer
- 19.1 Research and Forecast Disclaimer
- 19.2 Data Source and Estimation Limitations
Note: The depth of individual sections depends on data availability for this market. Volume, capacity, trade and other unit-based metrics are included where applicable.

