
Verified records and digital settlement start a ledger niche
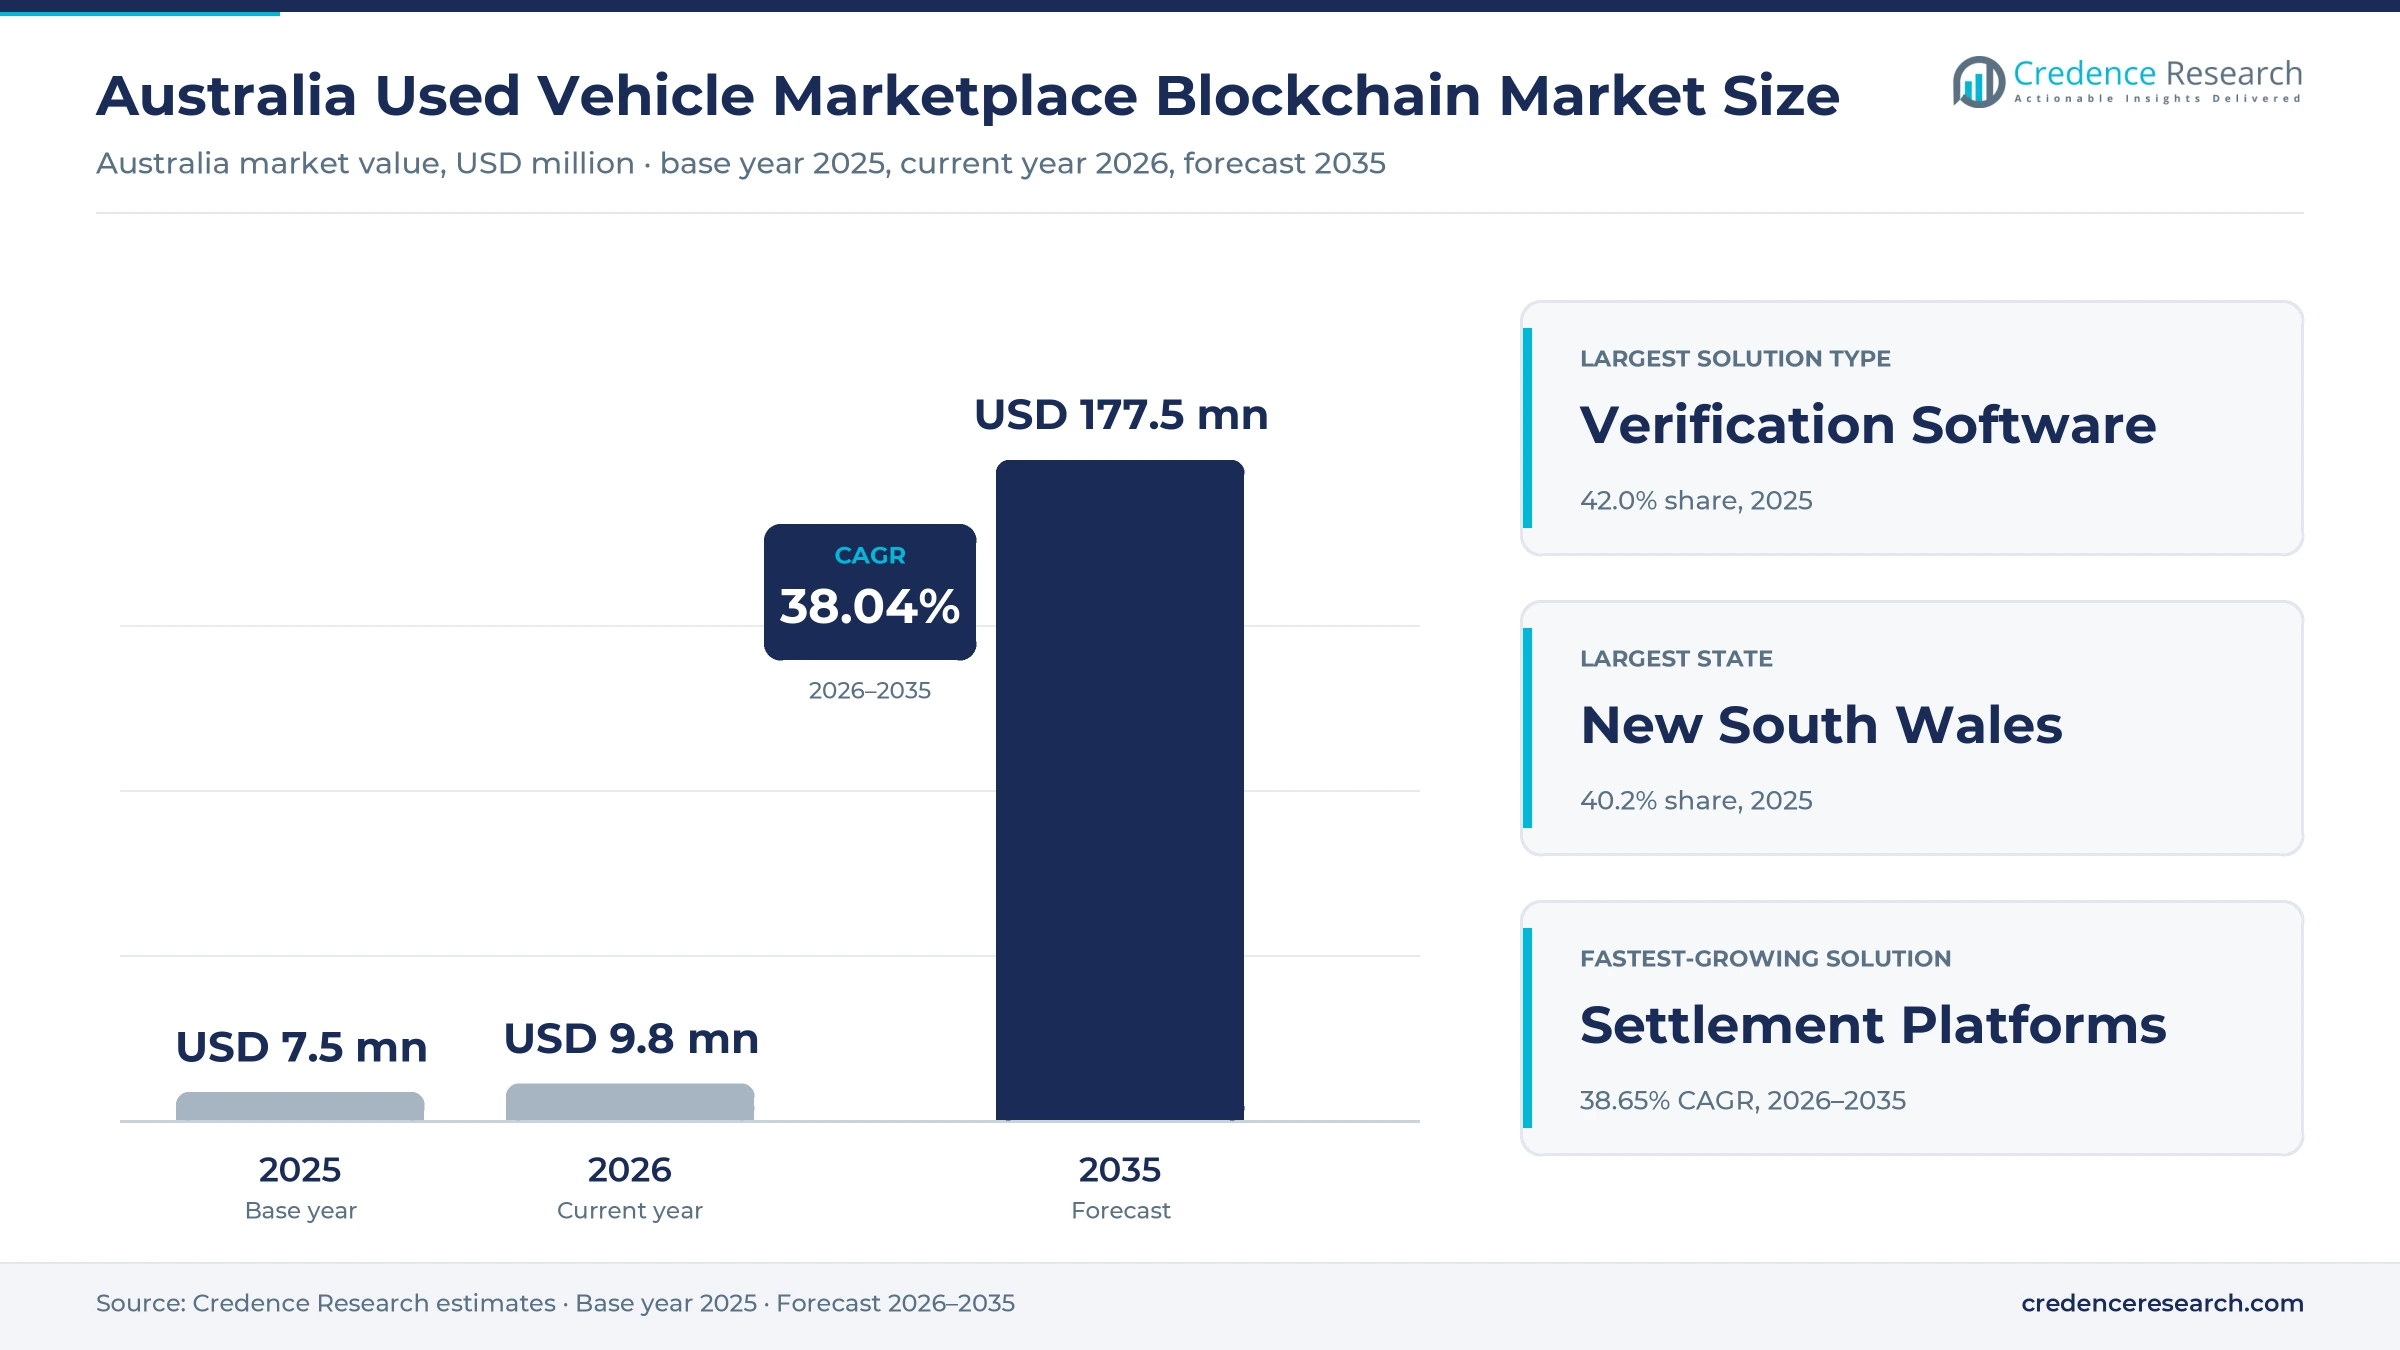
The Australia used vehicle marketplace blockchain market was valued at USD 7.07 million in 2025 and is projected to increase from USD 9.76 million in 2026 to USD 177.5 million by 2035, registering a CAGR of 38.04% during 2026–2035. Demand comes from dealers, online marketplaces, auction and fleet operators, lenders and data providers that want tamper-evident vehicle records and safer digital settlement for a trade of about 2.32 million used vehicles a year. Most current spending goes to verification layers, settlement software and integration work, because the official encumbrance register and the main history databases still run on conventional systems. New South Wales held the largest state share, 40.2% in 2025, because it has the largest registered vehicle fleet in the country. Queensland is the fastest-growing state at 38.59% a year over the forecast period. In turn, the national Digital ID Act, which commenced on Dec. 1, 2024, gives settlement platforms a regulated route to verified identity checks for buyers and sellers.
What does the Australian estimate count as ledger spending?
The estimate measures spending in Australia on distributed ledger and tamper-evident record software and services used in used vehicle trading, including settlement platforms, verification software for history and encumbrance checks, digital vehicle passports and the integration work that links them to dealer, lender and registry systems. It counts usage, subscription and project fees paid by dealers, marketplaces, fleet and auction operators, lenders and data providers.
The estimate excludes the vehicle value itself, car loans, insurance premiums, general listing advertising, cryptocurrency trading and government register fees. The value chain runs from ledger and cloud developers through data providers and integrators to dealers, lenders and private sellers, who decide whether a shared record adds enough trust and speed to justify a fee on each transaction.
Australia Used Vehicle Marketplace Blockchain Market Insights
- The Australia used vehicle marketplace blockchain market was valued at USD 7.07 million in 2025 and is projected to reach USD 177.5 million by 2035, registering a CAGR of 38.04% during 2026–2035.
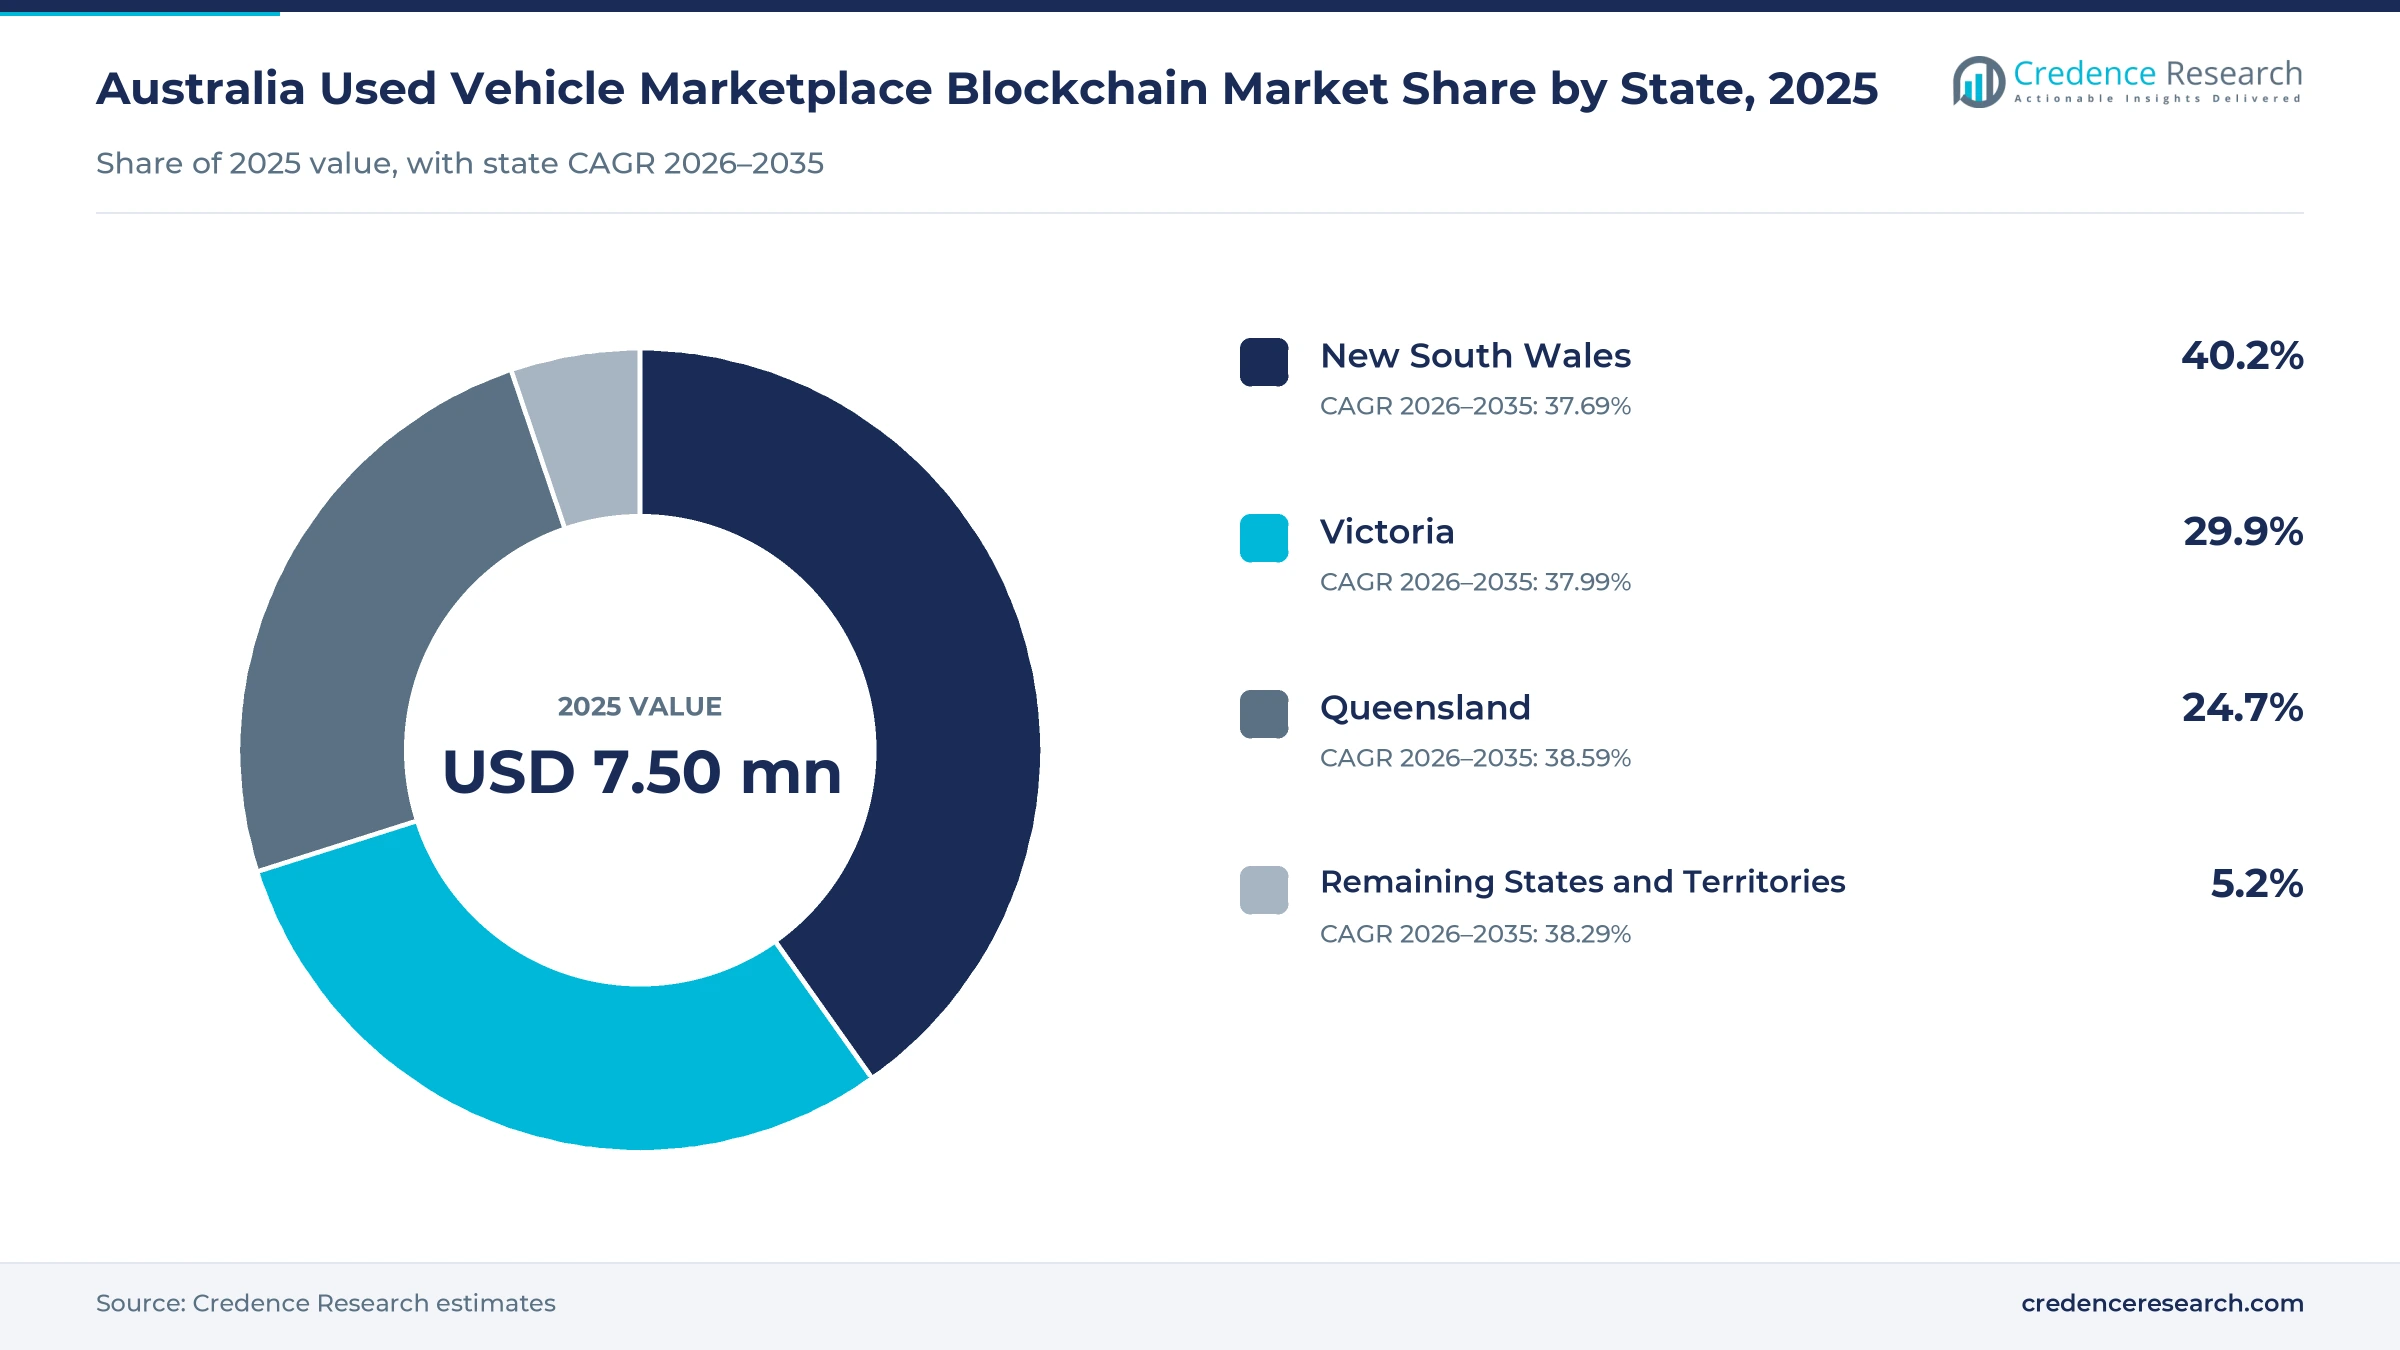
- New South Wales held a 40.2% share of 2025 value, because Sydney concentrates dealer groups, lenders and the largest registered vehicle fleet.
- Verification Software led with a 42.0% share of 2025 value, as history and encumbrance checks are the most common paid step in a used car deal.
- The Reserve Bank of Australia selected 24 Project Acacia use cases on July 10, 2025, testing settlement on several distributed ledger platforms.
- Settlement Platforms grow fastest at 38.65% a year during 2026–2035, as lenders and dealers move funds, title checks and handover into one digital step.
Verification software leads while settlement tools surge
Why does verification software hold the largest share?
Based on solution type, the market is categorized into Settlement Platforms, Verification Software and Integration Services. Verification Software led with a 42.0% share of 2025 value, because nearly every dealer and many private buyers pay for a history or encumbrance check before purchase. Settlement Platforms grow fastest at 38.65% a year, as lenders and dealers want identity checks, payment and handover recorded in one shared, tamper-evident workflow.
Which applications carry the most value today?
Based on application, the market is categorized into Transaction Settlement, History and Encumbrance Verification, and Digital Vehicle Passports. History and Encumbrance Verification led with a 48.0% share of 2025 value, because PPSR and history checks are routine for each trade. Digital Vehicle Passports grow fastest at 39.50% a year, as hybrid and battery electric cars need service, battery and ownership records that follow the vehicle across several owners.
Which buyers fund most ledger projects?
Based on customer type, the market is categorized into Dealers and Marketplaces, Fleet and Auction Operators, and Finance and Data Providers. Dealers and Marketplaces led with a 52.0% share of 2025 value, because dealers now handle almost half of used car transactions. Finance and Data Providers grow fastest at 38.52% a year, as lenders link car finance approvals to verified vehicle and seller data.
How do shared and hybrid deployments split spending?
Based on deployment model, the market is categorized into Shared Cloud, Dedicated Cloud and Hybrid Deployment. Shared Cloud led with a 55.0% share of 2025 value, because small dealers buy checks and settlement on a per-use basis from hosted platforms. Hybrid Deployment grows fastest at 39.07% a year, as lenders keep customer data on private systems while anchoring proofs on shared ledgers.
| Segment Group | Leading Sub-segment | Share, 2025 | Fastest-growing Sub-segment | CAGR, 2026–2035 |
|---|---|---|---|---|
| By Solution Type | Verification Software | 42.0% | Settlement Platforms | 38.65% |
| By Application | History and Encumbrance Verification | 48.0% | Digital Vehicle Passports | 39.50% |
| By Customer Type | Dealers and Marketplaces | 52.0% | Finance and Data Providers | 38.52% |
| By Deployment Model | Shared Cloud | 55.0% | Hybrid Deployment | 39.07% |
Request a Free Sample
Fill in your details and we'll send you a free sample report.
- Sample data tables & charts
- Research methodology
Dealer workflows, digital ID and clean records lift demand
How does dealer workflow consolidation lift platform spending?
Dealers are pulling sourcing, pricing, checks, finance and settlement into fewer connected tools, which creates room for shared record layers. Australia recorded about 2.32 million used vehicle sales in 2025, and dealers lifted their share to almost half of all transactions, according to AutoGrab and the AADA. AutoGrab launched AutoMate, an AI assistant for dealership stock, pricing and trade-in work, on June 4, 2025. This shift ties verification and settlement steps to dealer management software rather than to separate manual checks at the point of sale. As a result, Dealers and Marketplaces hold 52.0% of 2025 market value.
Why does identity and settlement interoperability matter?
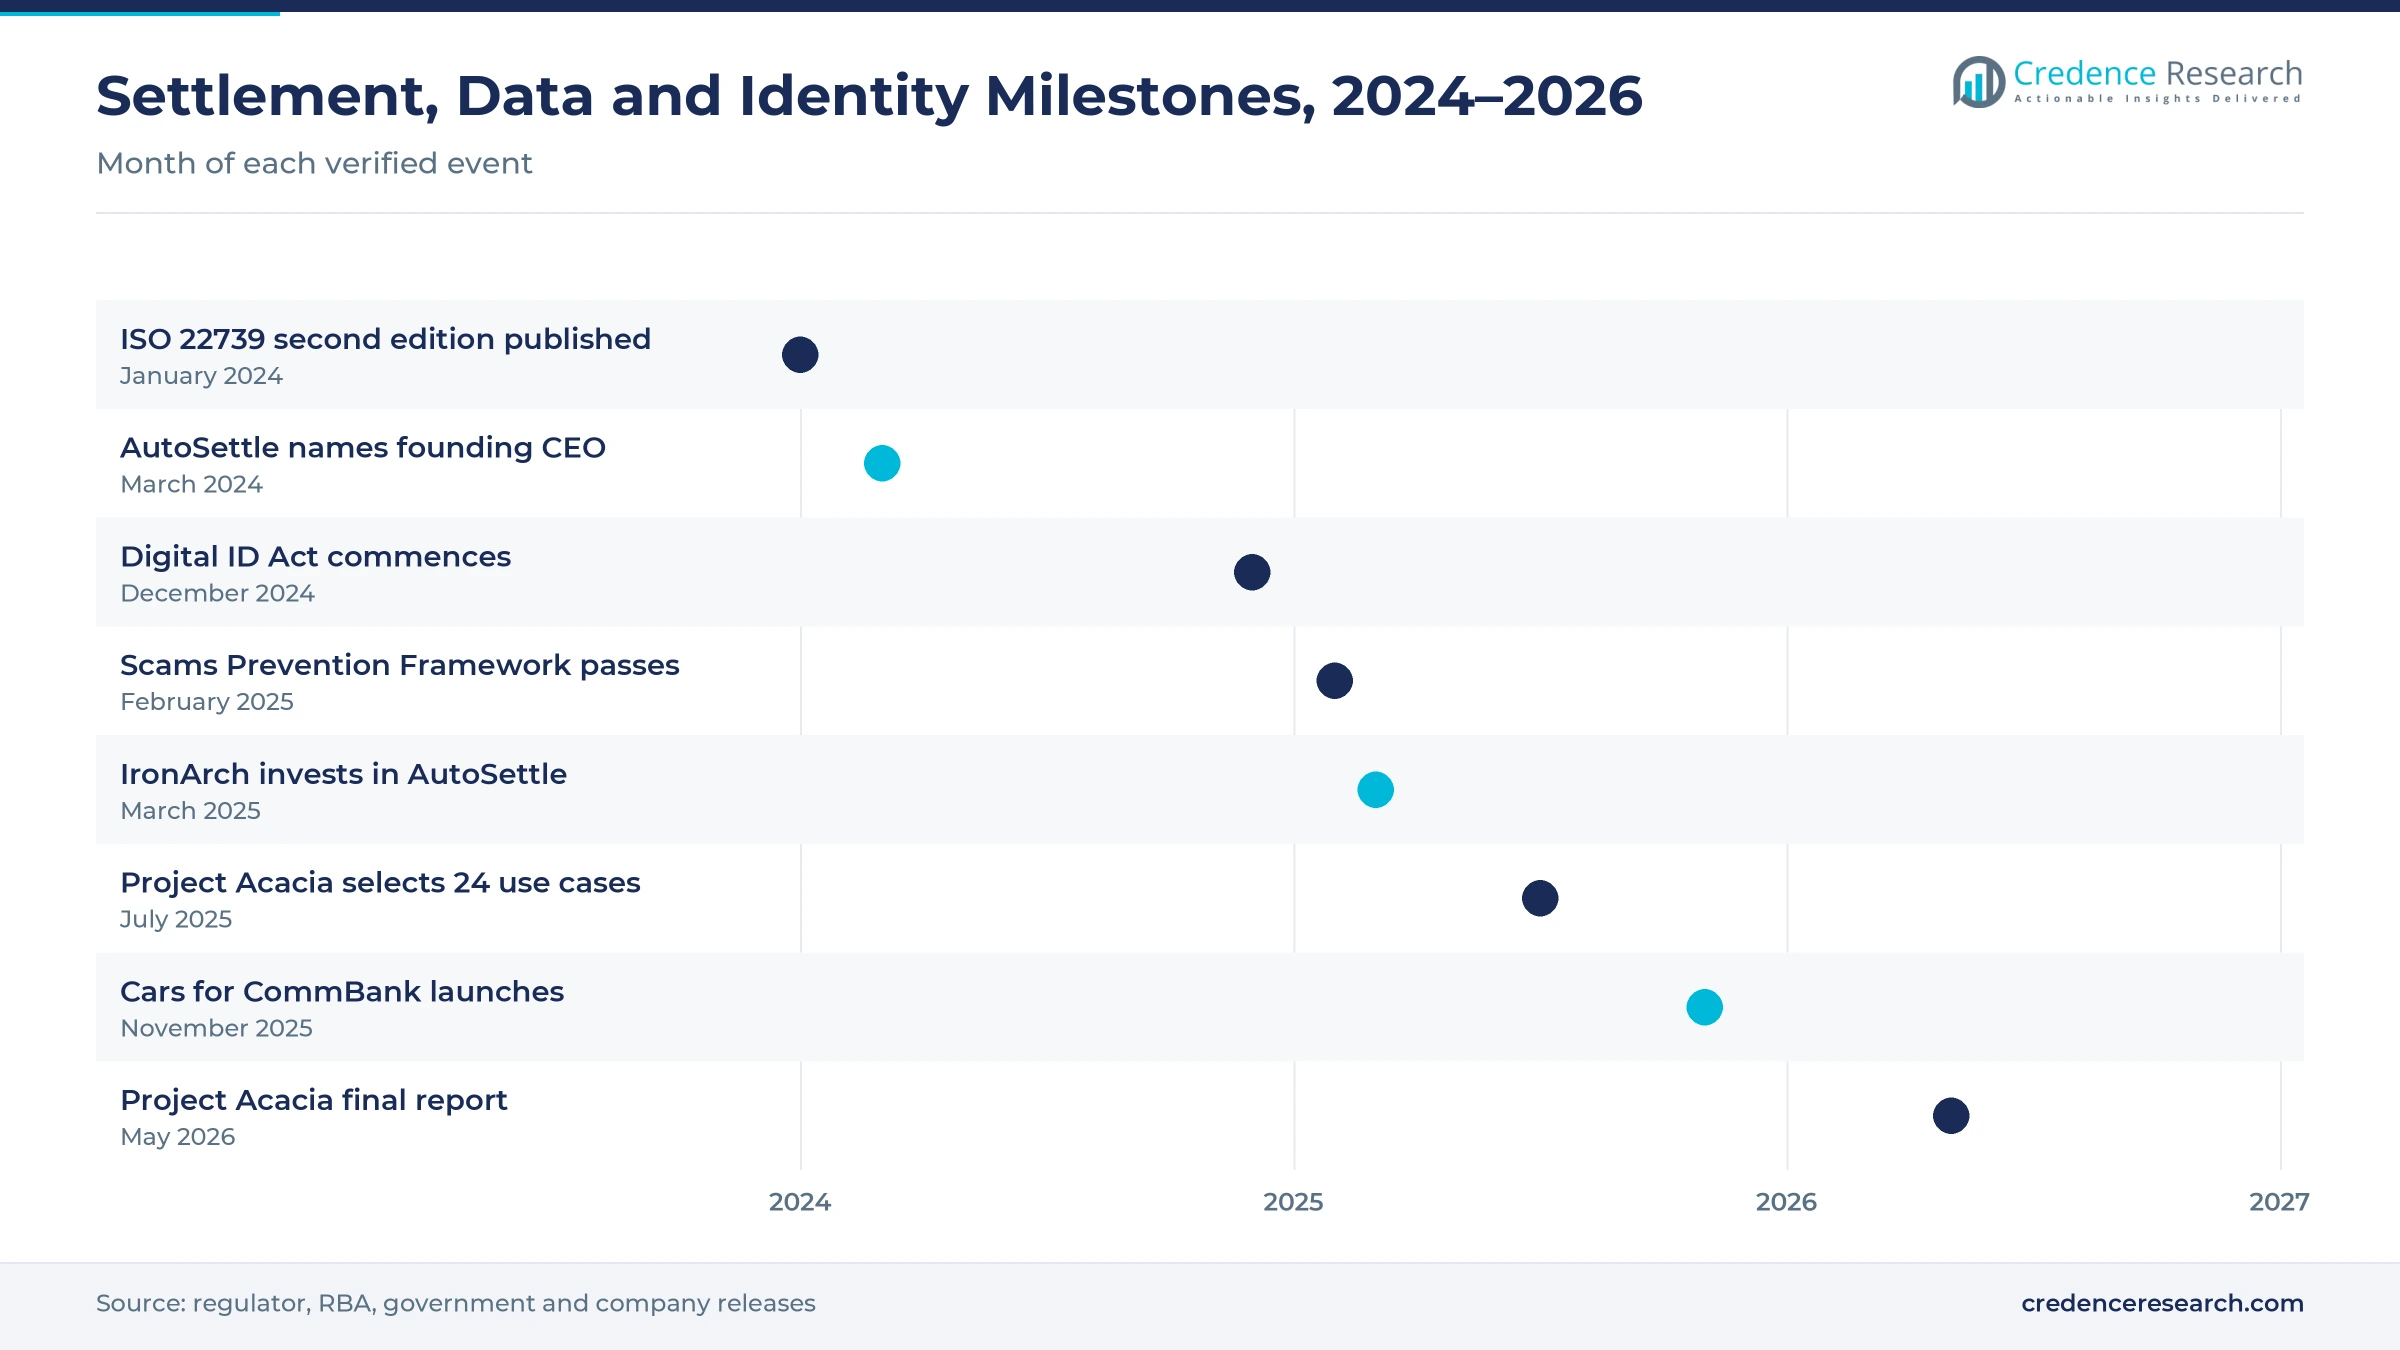
Buyers, sellers and lenders need verified identities and funds to meet at handover, which is the core job of a digital settlement record. The Digital ID Act commenced on Dec. 1, 2024, made the ACCC the Digital ID Regulator and lets private sector entities apply to join the national system by December 2026, according to the Australian Government Digital ID System. AutoSettle combines identity verification, vehicle checks, PPSR orchestration and real-time payments, according to an AFIA member profile. This links settlement tools to wider digital identity and cyber governance rules. In turn, Settlement Platforms grow at 38.65% a year during the forecast period.

How does demand for vehicle record integrity drive checks?
Buyers want proof that a car is unencumbered, not stolen or written off and has a genuine odometer reading, which keeps history checks at the center of each deal. The Personal Property Securities Register handled 3,348,955 searches in the December quarter 2025, up 4.3% from a year earlier, and 55.6% were serial number searches, according to AFSA statistics. CarHistory reports draw on the National Vehicle Information System that Equifax operates and include PPSR, damage, stolen status and odometer checks for each vehicle. As a result, History and Encumbrance Verification holds 48.0% of 2025 market value.
How do scam rules and payment reform push digital settlement?
Payment fraud and the decline of cheques push private buyers and sellers toward secure, traceable settlement channels. Scamwatch recorded AUD 318.8 million in reported losses in 2024, and bank transfers caused the highest losses at AUD 141.7 million, according to the National Anti-Scam Centre in March 2025. Federal Parliament passed the Scams Prevention Framework Bill on Feb. 13, 2025, covering banks, telecommunications and digital platforms. ANZ also states that the government plans to phase cheques out of the payments system by 2030, removing a common private sale payment method. In turn, private buyers and sellers have a stronger reason to settle through traceable digital platforms instead of checks, cash or unverified bank transfers.
Tokenized settlement and vehicle passports emerge
How is the shift to tokenized settlement reshaping vehicle deals?
Central bank work on tokenized settlement is giving lenders a tested model for linking ledgers to real payments, which strengthens the case for digital vehicle settlement. The Reserve Bank of Australia selected 24 Project Acacia use cases, including 19 pilots with real money, according to an RBA media release of July 10, 2025. The pilot wholesale digital currency ran on Hedera, Redbelly Network, R3 Corda and other permissioned or public ledgers. The use cases covered asset classes including trade receivables, which ties the pilots to trade finance ledger pilots, and a findings report was due in the first quarter of 2026. As a result, Finance and Data Providers grow at 38.52% a year as lenders test these settlement models.
Why are hybrid ledger designs emerging in vehicle records?
Privacy rules push vehicle data holders toward hybrid designs that keep personal data private while publishing proofs on shared ledgers, because this balances privacy with auditability. EY OpsChain Traceability tokenizes physical assets on Polygon or Ethereum and adds a zero-knowledge privacy layer built on the Nightfall project, according to EY. The second edition of ISO 22739, published in January 2024, sets shared vocabulary for blockchain and distributed ledger technologies. Shared terms and cross-chain interoperability tools make links between dealer, lender and data systems easier to build and audit. In turn, Hybrid Deployment grows at 39.07% a year over the forecast period.
Can digital vehicle passports serve electrified used cars?
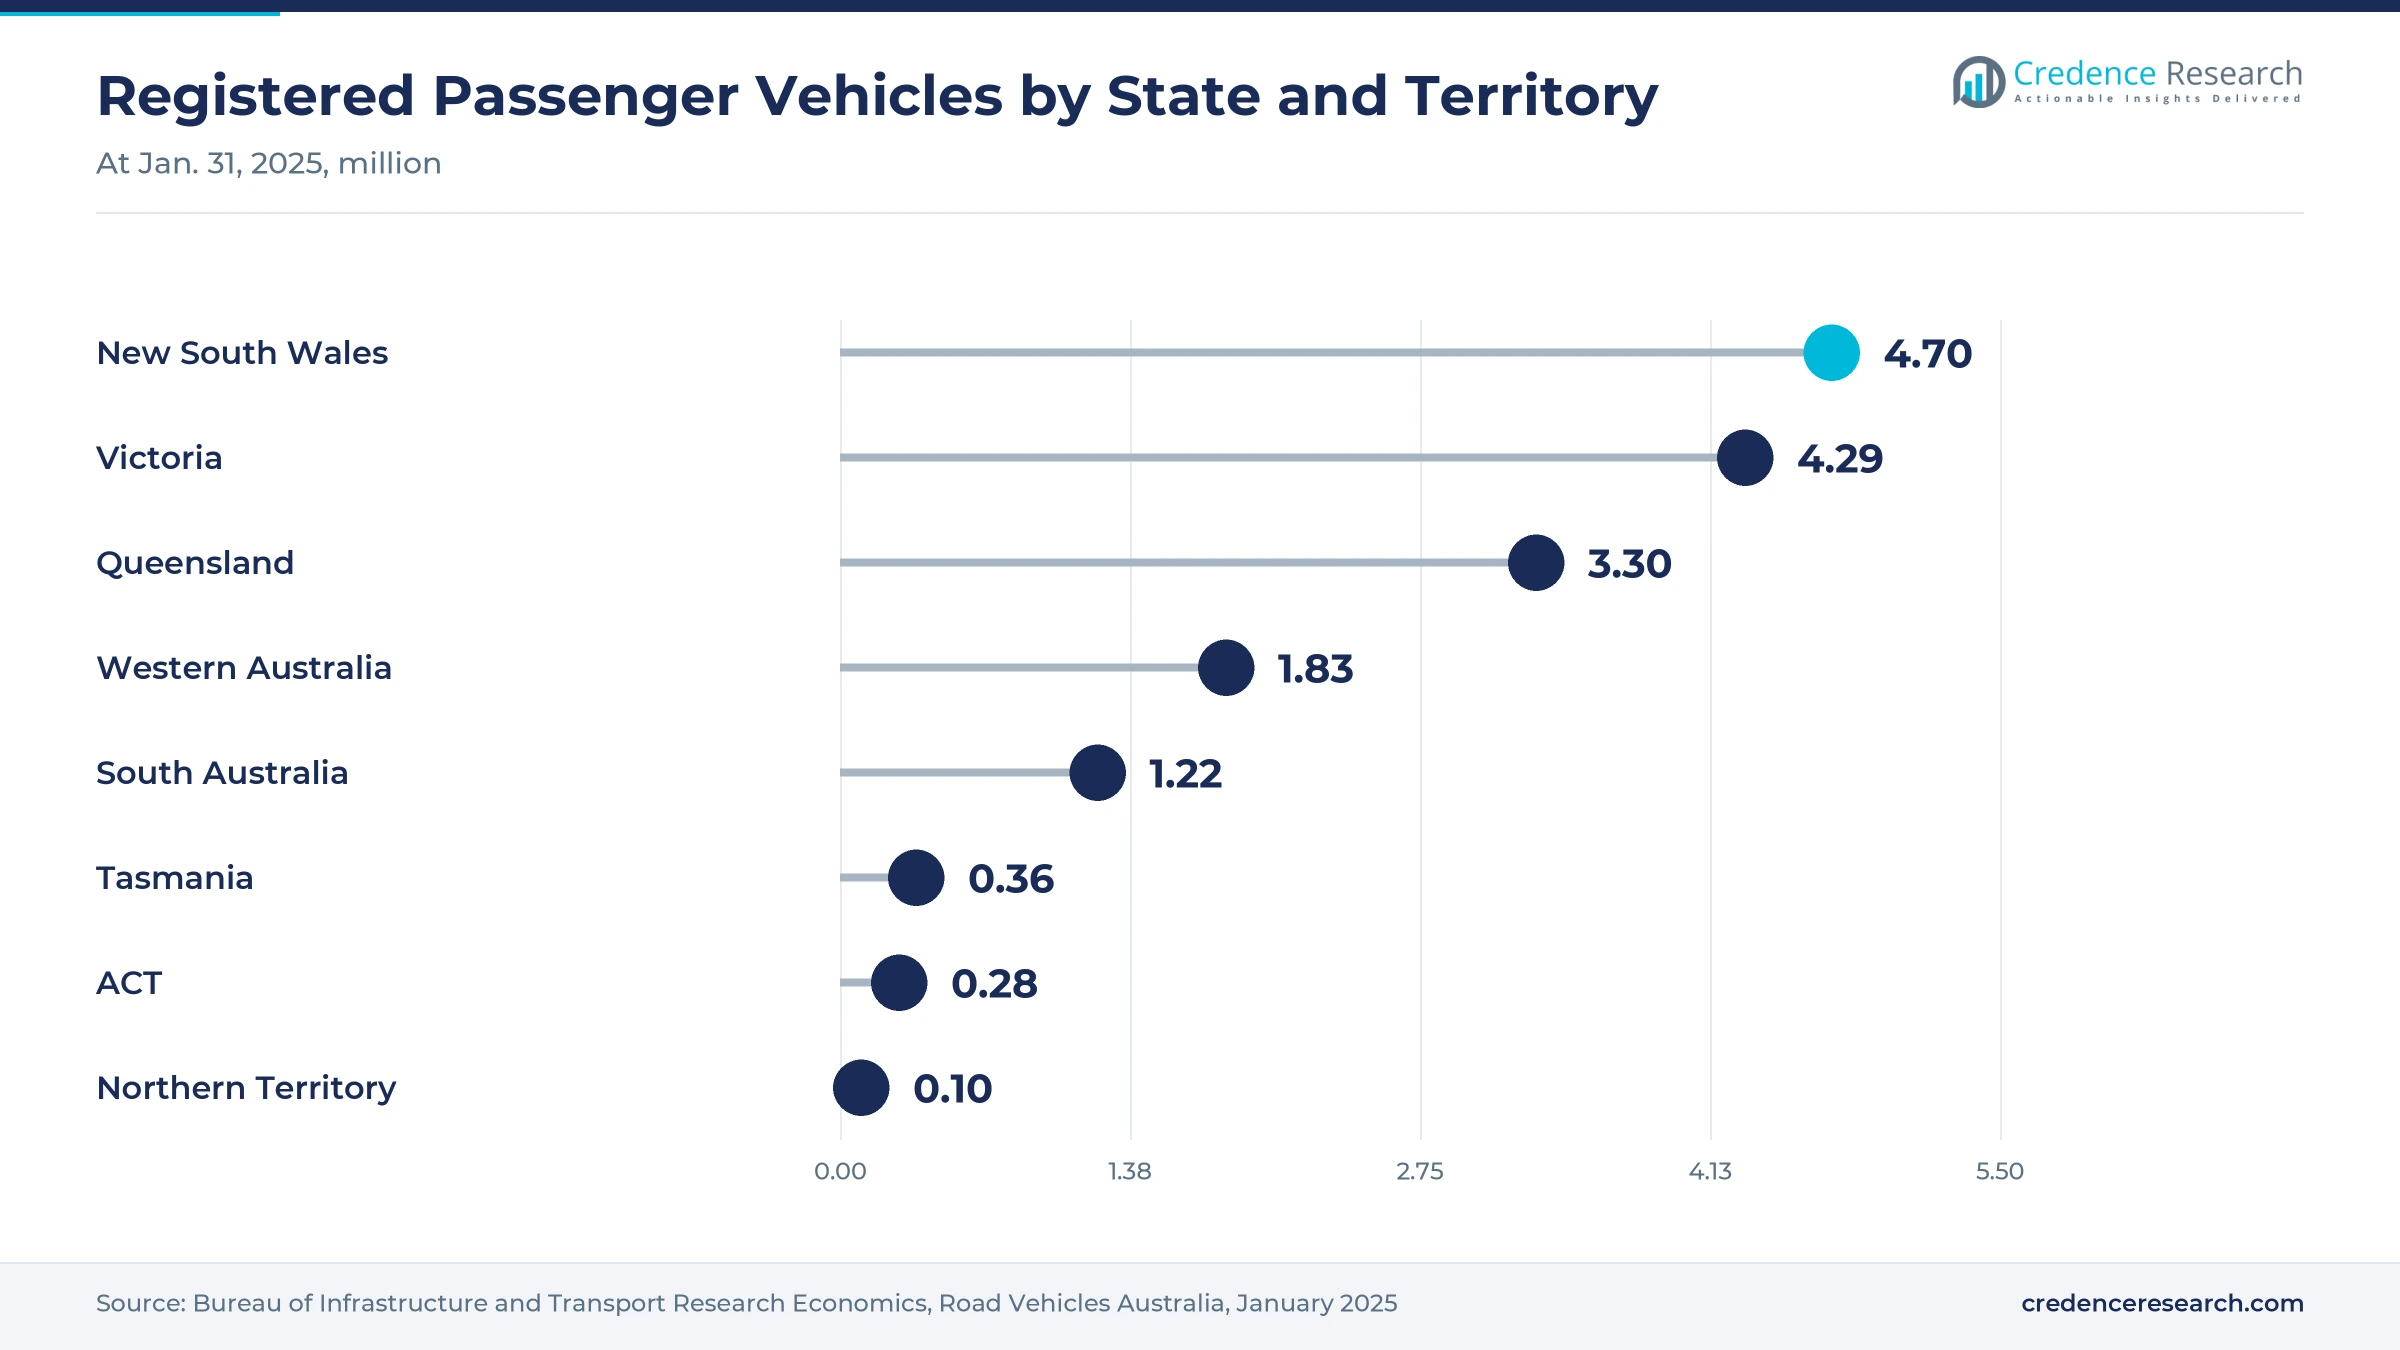
A growing pool of second-hand hybrids and battery electric cars creates an opening for passports that carry battery, service and ownership records across owners. Hybrid and battery electric used car sales grew much faster than the overall market in 2025, according to the AutoGrab annual report released on Feb. 4, 2026. The registered fleet is also old, with an average age of 11.54 years at Jan. 31, 2025, according to the Bureau of Infrastructure and Transport Research Economics. Older cars change hands several times, so a shared record that follows each vehicle has more value. As a result, Digital Vehicle Passports grow at 39.50% a year.
Is there room to bind digital licenses to settlement checks?
Phone-based licenses issued by the states already give settlement platforms a ready identity credential that can be checked at handover between buyer and seller. More than one million Victorians activated a digital driver license within about 13 weeks of the May 2024 launch, according to the Victorian Premier on Aug. 15, 2024. Queensland rolled out its digital license statewide from Nov. 1, 2023, with QR codes that expire after 20 seconds. About 4.4 million NSW adults held a digital license in the Service NSW app in early 2023, according to NFCW. In turn, Settlement Platforms can verify sellers faster, cut identity fraud and lower the cost of each private sale.
Central registers and thin adoption slow ledger uptake
How do central registers limit the need for a ledger?
The PPSR and the main history databases already give buyers a trusted central record, which narrows the gap a ledger can fill. AFSA held 10,673,341 current registrations at Dec. 31, 2025, and CarHistory draws on a database run by Equifax. As a result, buyers see little need to replace central systems. Vendors respond by selling audit trails and settlement layers that sit beside these registers.
Why does thin proven adoption make buyers cautious?
Few Australian used car tools describe themselves as blockchain-based, which leaves buyers with little local proof of value. AutoSettle and CarHistory describe digital settlement and history services without naming a ledger, while the best known local ledger marketplace, 2Mota, launched in 2019 for car servicing. In turn, dealers treat ledgers as an option rather than a requirement. Vendors respond with contained pilots, per-use pricing and partnerships with established data providers.
How does the private sale channel slow rollout?
Private sellers still account for about half of used car transactions, and they buy services once rather than on contract. This fragmentation raises customer acquisition costs for settlement and passport providers. In turn, platform volumes grow slowly outside dealer networks, and fees must stay low to win occasional users. Vendors respond by partnering with lenders, marketplaces and banks that already reach private buyers.
Why does the identity timeline delay private sector use?
Private sector entities can only apply to join the national Digital ID system by December 2026, so full identity links for car sales are still ahead. Until then, platforms must run their own biometric and document checks, which adds cost per transaction. As a result, smaller dealers delay adoption of full digital settlement. Providers respond by reusing state digital license checks and bank identity data where allowed.
New South Wales leads as Queensland grows fastest
| State | Value, 2025 (USD million) | Share, 2025 | CAGR, 2026–2035 |
|---|---|---|---|
| New South Wales | 2.8 | 40.2% | 37.69% |
| Victoria | 2.1 | 29.9% | 37.99% |
| Queensland | 1.7 | 24.7% | 38.59% |
| Remaining States and Territories | 0.4 | 5.2% | 38.29% |
New South Wales leads on fleet size and dealer activity
New South Wales held a 40.2% share of 2025 value and grows at 37.69% a year, because Sydney concentrates dealer groups, lenders and data providers. The state had 6,407,874 registered motor vehicles at Jan. 31, 2025, the most of any state, according to the Bureau of Infrastructure and Transport Research Economics. About 4.4 million NSW adults held a digital license in early 2023. As a result, the state leads verification and settlement spending.
How do digital licenses shape demand in Victoria?
Victoria held a 29.9% share of 2025 value and grows at 37.99% a year, supported by Melbourne dealer groups and data firms such as AutoGrab. The state had 5,686,171 registered motor vehicles at Jan. 31, 2025, and more than one million Victorians activated a digital license within about 13 weeks of the May 2024 launch. In turn, identity-linked settlement and history checks carry most new spending in the state.
Why does Queensland grow fastest among the states?
Queensland held a 24.7% share of 2025 value and grows fastest at 38.59% a year. The state had 4,892,464 registered motor vehicles at Jan. 31, 2025, and its fleet is older than the national average at 11.76 years. Queensland rolled out its digital license statewide on Nov. 1, 2023. As a result, older cars that change hands often and a ready identity credential support faster uptake of verification and passport tools.
How do the remaining states and territories contribute?
Remaining States and Territories held a 5.2% share of 2025 value and grows at 38.29% a year. Western Australia, South Australia, Tasmania and the two territories had about 5.3 million registered motor vehicles at Jan. 31, 2025, but platform pilots and dealer software rollouts start on the east coast. In turn, spending in these smaller regions stays small until national settlement services reach local dealers.
Settlement, data and identity moves, 2024–2026
| Development | Status and market relevance |
|---|---|
| In March 2024, AutoSettle appointed Jason Van as founding chief executive of its virtual settlement exchange for motor vehicles. | Launches a dedicated vehicle settlement platform |
| In December 2024, the Digital ID Act 2024 commenced, with the ACCC acting as Digital ID Regulator. | Sets the rules for verified identity in settlement |
| In March 2025, IronArch made a strategic investment in AutoSettle to scale its platform in Australia and abroad. | Funds identity, PPSR and payment orchestration |
| In July 2025, the Reserve Bank of Australia selected 24 Project Acacia use cases for tokenized asset settlement. | Tests ledger settlement models used by lenders |
| In November 2025, CommBank and AutoGrab launched Cars for CommBank with more than 20,000 dealer vehicles. | Links car search, data and finance approval in one app |
Hashes, permissioned ledgers and tokens compete
- Cryptographic hashes and time stamps anchor inspection reports, odometer readings and ownership documents so that any later change can be detected in a dispute.
- Permissioned ledgers let dealers, lenders and data providers share a tamper-evident record of checks and handover without exposing personal data publicly.
- Smart contracts release funds only when identity, PPSR and vehicle checks are complete, although private sales with deposits remain hard to automate.
- Tokenized vehicle records give each car a digital passport that carries service, battery and ownership history from one owner to the next.
Need a Custom Version of This Report?
Tailor the scope, geography, or segments to your exact requirements.
- Custom geography or segment scope
- Direct access to our analyst team
Data platforms and settlement startups set the pace
Competition is shaped by data platforms that already sit inside dealer and lender workflows and by a small group of settlement startups. AutoGrab supplies vehicle data, valuation and AI tools to dealers and publishes the national used sales reports with the AADA. CarHistory, part of Equifax, sells VIN-based history reports built on the National Vehicle Information System and the PPSR. AutoSettle runs a digital settlement exchange that combines identity checks, PPSR orchestration and real-time payments. EY Australia helped Block2 build 2Mota, a car service marketplace on EY OpsChain Tesseract, in 2019, and now offers OpsChain Traceability on public chains. Rivals compete on data access, lender integration and identity assurance, and ledger vendors usually win work as partners of data and finance firms rather than as standalone marketplaces.
Which companies shape ledger activity in Australian car trading?
| Company | Type | Role in the market |
|---|---|---|
| AutoSettle | Settlement platform | Runs digital settlement for vehicle sales |
| CarHistory / Equifax | Vehicle history provider | VIN reports from NVIS and PPSR data |
| AutoGrab | Automotive data platform | Dealer data, valuations and Cars for CommBank |
| EY Australia | Ledger developer and advisor | Built 2Mota on OpsChain Tesseract |
| Block2 / 2Mota | Ledger marketplace operator | Launched car service marketplace in 2019 |
Settlement trust matters more than the ledger itself
Credence Research's view is that the Australia used vehicle marketplace blockchain market will grow quickly from a very small base, but mainly as a trust layer inside existing tools. Buyers pay for verified identity, clean title and safe funds transfer, not for the ledger itself, so the winners will be data and settlement providers that embed tamper-evident records in dealer and lender workflows. Digital identity reform and tokenized settlement research are the main catalysts, while central registers and the large private sale channel will keep adoption gradual.
Model built from registry, sales and regulator data
The report uses 2025 as the base year on a calendar basis, and market values come from the Credence Research model. That model draws on used vehicle sales data, PPSR search statistics, registered vehicle counts, regulator and central bank releases, and company announcements on platforms, investments and partnerships. Segment splits and regional growth rates are Credence Research estimates, and regional shares follow the Credence Research regional model. Sources used are official statistics, regulator releases, government documents, trade press and company releases, and no interviews or surveys were used.
Pilots turn into embedded dealer tools by 2035
The Australia used vehicle marketplace blockchain market is expected to reach USD 177.5 million by 2035, a 38.04% CAGR during 2026–2035, as pilots turn into embedded dealer and lender tools. Growth should pick up after December 2026, when private sector firms can apply to join the national Digital ID system. Settlement platforms and digital vehicle passports are likely to add most new value, especially for electrified cars. Slow uptake among private sellers would hold back volumes, while bank-led settlement services would speed adoption.
Frequently Asked Questions
How big is the Australia used vehicle marketplace blockchain market?
Does the PPSR run on a blockchain?
Which solution type leads the Australian market?
Which state leads the Australian market?
How does the Digital ID Act affect car sale settlement?
How many used vehicles are sold in Australia each year?
Who are the leading companies in this market?
What are the main challenges for ledger adoption?
Table of Content
Chapter 1 Market Segmentation
- 1.1 Segmentation Framework
- 1.1.1 Product and Service Classification
- 1.1.2 Application and End-Use Classification
- 1.1.3 Technology and Solution Classification
- 1.1.4 Customer and Distribution Channel Classification
- 1.1.5 Geographic Segmentation
- 1.1.6 Market Segment Definitions and Boundaries
- 1.2 By Solution Type
- 1.2.1 Settlement Platforms
- 1.2.2 Verification Software
- 1.2.3 Integration Services
- 1.3 By Application
- 1.3.1 Transaction Settlement
- 1.3.2 History and Encumbrance Verification
- 1.3.3 Digital Vehicle Passports
- 1.4 By Customer Type
- 1.4.1 Dealers and Marketplaces
- 1.4.2 Fleet and Auction Operators
- 1.4.3 Finance and Data Providers
- 1.5 By Deployment Model
- 1.5.1 Shared Cloud
- 1.5.2 Dedicated Cloud
- 1.5.3 Hybrid Deployment
- 1.6 By State
- 1.6.1 New South Wales
- 1.6.2 Victoria
- 1.6.3 Queensland
- 1.6.4 Remaining States and Territories
Chapter 2 Introduction
- 2.1 Report Objectives and Scope
- 2.2 Product Definition and Industry Terminology
- 2.3 Market Inclusions and Exclusions
- 2.4 Research Process
- 2.4.1 Primary Research and Expert Interviews
- 2.4.2 Secondary Research and Source Review
- 2.4.3 Top-Down and Bottom-Up Estimation
- 2.4.4 Data Triangulation and Verification
- 2.5 Market Size Measurement Basis
- 2.5.1 2025: USD 7.07 million → 2035: USD 177.5 million
- 2.6 Historical and Forecast Reference Periods
- 2.6.1 Historical Period: 2018-2025
- 2.6.2 Base Year: 2025
- 2.6.3 Forecast Period: 2025-2035
- 2.7 Research Assumptions and Limitations
Chapter 3 Executive Summary
- 3.1 Market Snapshot and Key Findings
- 3.2 Base-Year Market Size, 2025
- 3.3 Forecast Market Size, 2035
- 3.4 Revenue and Volume Growth Outlook
- 3.5 Key Demand and Supply Indicators
- 3.6 Leading Market Segments
- 3.7 Fastest-Growing Market Opportunities
- 3.8 Regional Performance Highlights
- 3.9 Technology and Industry Transformation
- 3.10 Competitive Landscape Summary
- 3.11 Analyst View and Strategic Implications
Chapter 4 Australia Used Vehicle Marketplace Blockchain Market Trends and Developments
- 4.1 Historical Industry Development, 2018-2025
- 4.2 Recent Market Trends and Developments
- 4.3 Demand and Customer Behavior Trends
- 4.4 Technology and Product Innovation
- 4.5 Artificial Intelligence, Automation and Digitalization
- 4.6 Local Manufacturing and Supply Chain Realignment
- 4.7 Industry Partnerships, Mergers and Acquisitions
- 4.8 Sustainability and Circular Economy Developments
- 4.9 Government and Private Sector Investment Trends
- 4.10 Emerging Business Models and Commercialization
- 4.11 Industry Developments and Announcements
Chapter 5 Australia Used Vehicle Marketplace Blockchain Market Supply and Demand Analysis
- 5.1 Demand Trend and Consumption Analysis, 2018-2025
- 5.2 Demand Forecast, 2025-2035
- 5.3 Supply Chain Structure and Procurement Trends
- 5.4 Supply-Demand Gap and Bottlenecks
- 5.5 Import Dependence and Sourcing Structure
- 5.6 Regional Supply and Demand Concentration
Chapter 6 Australia Used Vehicle Marketplace Blockchain Market Pricing Analysis
- 6.1 Pricing Structure and Measurement
- 6.2 Historical Pricing Trends, 2018-2025
- 6.3 Pricing Outlook, 2025-2035
- 6.4 Pricing by Product and Market Segment
- 6.5 Geographic Pricing Differences
- 6.6 Key Input, Energy, Labor and Logistics Costs
- 6.7 Contract Pricing and Purchasing Models
- 6.8 Pricing Sensitivity and Competitive Positioning
- 6.9 Price, Margin and Profitability Implications
Chapter 7 Australia Used Vehicle Marketplace Blockchain Market Dynamics
- 7.1 Market Growth Drivers
- 7.1.1 Demand-Side Drivers
- 7.1.2 Technology and Innovation Drivers
- 7.1.3 Infrastructure and Investment Drivers
- 7.1.4 Regulatory and Policy Drivers
- 7.2 Market Restraints
- 7.2.1 Cost and Affordability Constraints
- 7.2.2 Technology and Adoption Barriers
- 7.2.3 Supply Chain and Operational Constraints
- 7.3 Market Challenges
- 7.3.1 Competitive Pressure and Margin Erosion
- 7.3.2 Skills, Infrastructure and Implementation Gaps
- 7.4 Emerging Market Opportunities
- 7.5 Market Dynamics Impact and Time-Horizon Assessment
Chapter 8 Australia Used Vehicle Marketplace Blockchain Value Chain Analysis
- 8.1 Industry Value Chain Overview
- 8.2 Upstream Suppliers and Critical Inputs
- 8.3 Technology and Component Providers
- 8.4 Manufacturing or Service Delivery
- 8.5 Distribution, Channel Partners and Integrators
- 8.6 Downstream Applications and End Users
- 8.7 Value Addition and Profit Pools
- 8.8 Vertical Integration and Outsourcing
- 8.9 Supplier Concentration and Risk
- 8.10 Supply Chain Localization and Resilience
Chapter 9 Australia Used Vehicle Marketplace Blockchain Market Regulations and Policies
- 9.1 Relevant Laws, Standards and Compliance Frameworks
- 9.2 Product, Service, Safety and Quality Requirements
- 9.3 Government Policies, Incentives and Subsidies
- 9.4 Imports, Exports and Trade Barriers
- 9.5 Public Procurement and Local Content Requirements
- 9.6 Data Protection, AI and Cybersecurity Compliance
- 9.7 Upcoming Policy Changes and Market Implications
Chapter 10 Australia Used Vehicle Marketplace Blockchain Market Hotspots and Opportunities
- 10.1 Market Opportunity Mapping and Growth Hotspots
- 10.2 High-Growth Applications and Customer Groups
- 10.3 Underserved Markets and White-Space Opportunities
- 10.4 Emerging Technology and Product Opportunities
- 10.5 New Capacity and Investment Hotspots
- 10.6 Market Entry and Expansion Opportunities
- 10.7 Distribution and Partnership Opportunities
- 10.8 Near-Term and Long-Term Commercial Potential
- 10.9 Opportunity Attractiveness and Execution Risks
Chapter 11 Australia Used Vehicle Marketplace Blockchain Market Outlook, 2025-2035
- 11.1 Market Size and Analysis
- 11.1.1 Revenue (Market Measurement: 2025: USD 7.07 million → 2035: USD 177.5 million)
- 11.1.2 Historical Market Size, 2018-2025
- 11.1.3 Base-Year Market Size, 2025
- 11.2 Market Forecast, 2025-2035
- 11.2.1 Revenue Forecast to 2035
- 11.2.2 CAGR and Year-on-Year Growth
- 11.2.3 Incremental Revenue Opportunity
- 11.3 Forecast Assumptions and Scenario Analysis
- 11.3.1 Base-Case Forecast
- 11.3.2 Optimistic and Conservative Scenarios
- 11.3.3 Technology, Pricing and Policy Sensitivities
- 11.4 Market Attractiveness and Growth Outlook
Chapter 12 Australia Used Vehicle Marketplace Blockchain Market Segmentation and Outlook
- 12.1 Segmentation Summary and Market Shares, 2025
- 12.2 Largest and Fastest-Growing Segments
- 12.3 By Solution Type - Market Size and Forecast, 2025-2035
- 12.3.1 Segment Definition and Scope
- 12.3.2 Historical Market Size, 2018-2025
- 12.3.3 Revenue Forecast, 2025-2035
- 12.3.4 Base-Year Market Share, 2025
- 12.3.5 Segment CAGR and Growth Drivers
- 12.3.6 Subsegment Market Size and Forecast
- 12.3.6.1 Settlement Platforms
- 12.3.6.2 Verification Software
- 12.3.6.3 Integration Services
- 12.3.7 Subsegment Pricing and Adoption Trends
- 12.3.8 Leading Suppliers and Competition
- 12.3.9 Regional Demand and Opportunities
- 12.4 By Application - Market Size and Forecast, 2025-2035
- 12.4.1 Segment Definition and Scope
- 12.4.2 Historical Market Size, 2018-2025
- 12.4.3 Revenue Forecast, 2025-2035
- 12.4.4 Base-Year Market Share, 2025
- 12.4.5 Segment CAGR and Growth Drivers
- 12.4.6 Subsegment Market Size and Forecast
- 12.4.6.1 Transaction Settlement
- 12.4.6.2 History and Encumbrance Verification
- 12.4.6.3 Digital Vehicle Passports
- 12.4.7 Subsegment Pricing and Adoption Trends
- 12.4.8 Leading Suppliers and Competition
- 12.4.9 Regional Demand and Opportunities
- 12.5 By Customer Type - Market Size and Forecast, 2025-2035
- 12.5.1 Segment Definition and Scope
- 12.5.2 Historical Market Size, 2018-2025
- 12.5.3 Revenue Forecast, 2025-2035
- 12.5.4 Base-Year Market Share, 2025
- 12.5.5 Segment CAGR and Growth Drivers
- 12.5.6 Subsegment Market Size and Forecast
- 12.5.6.1 Dealers and Marketplaces
- 12.5.6.2 Fleet and Auction Operators
- 12.5.6.3 Finance and Data Providers
- 12.5.7 Subsegment Pricing and Adoption Trends
- 12.5.8 Leading Suppliers and Competition
- 12.5.9 Regional Demand and Opportunities
- 12.6 By Deployment Model - Market Size and Forecast, 2025-2035
- 12.6.1 Segment Definition and Scope
- 12.6.2 Historical Market Size, 2018-2025
- 12.6.3 Revenue Forecast, 2025-2035
- 12.6.4 Base-Year Market Share, 2025
- 12.6.5 Segment CAGR and Growth Drivers
- 12.6.6 Subsegment Market Size and Forecast
- 12.6.6.1 Shared Cloud
- 12.6.6.2 Dedicated Cloud
- 12.6.6.3 Hybrid Deployment
- 12.6.7 Subsegment Pricing and Adoption Trends
- 12.6.8 Leading Suppliers and Competition
- 12.6.9 Regional Demand and Opportunities
- 12.7 By State - Market Size and Forecast, 2025-2035
- 12.7.1 Segment Definition and Scope
- 12.7.2 Historical Market Size, 2018-2025
- 12.7.3 Revenue Forecast, 2025-2035
- 12.7.4 Base-Year Market Share, 2025
- 12.7.5 Segment CAGR and Growth Drivers
- 12.7.6 Subsegment Market Size and Forecast
- 12.7.6.1 New South Wales
- 12.7.6.2 Victoria
- 12.7.6.3 Queensland
- 12.7.6.4 Remaining States and Territories
- 12.7.7 Subsegment Pricing and Adoption Trends
- 12.7.8 Leading Suppliers and Competition
- 12.7.9 Regional Demand and Opportunities
- 12.8 Segment Growth Comparison
- 12.9 Segment Attractiveness and Priority Matrix
Chapter 13 Australia Used Vehicle Marketplace Blockchain End-Use and Application Market Outlook
- 13.1 End-Use Industry and Customer Demand Structure
- 13.2 Leading Applications and Customer Groups
- 13.3 End-Use Market Size, Share and Forecast
- 13.4 Major End-Use Industry Deep Dives
- 13.4.1 Customer Requirements and Use Cases
- 13.4.2 Demand and Replacement Cycles
- 13.4.3 Technical and Regulatory Considerations
- 13.4.4 Purchasing and Procurement Models
- 13.4.5 Leading Vendors and Distribution Channels
- 13.4.6 Forecast and Commercial Opportunities
- 13.5 Emerging Applications and Cross-Segment Demand
- 13.6 End-Use Industry Investment Priorities
Chapter 14 Australia Used Vehicle Marketplace Blockchain Geographic Market Outlook, 2025-2035
- 14.1 Domestic Market Distribution and Demand Clusters
- 14.2 State- or Province-Wise Market Size and Forecast, 2025-2035
- 14.3 City and Metropolitan Market Outlook
- 14.4 Industrial, Manufacturing and Commercial Clusters
- 14.5 Geographic Concentration of Key End Users
- 14.6 Local Pricing and Purchasing Differences
- 14.7 Domestic Production Facilities and Capacity Map
- 14.8 Local Infrastructure and Project Pipeline
- 14.9 State-Level Policy and Incentive Differences
- 14.10 Subnational Investment Hotspots and Opportunities
- 14.11 Distribution and Logistics Networks
- 14.12 Domestic Competitive Footprint
Chapter 15 Australia Used Vehicle Marketplace Blockchain Technology, Innovation and Sustainability Outlook
- 15.1 Technology Landscape and Maturity
- 15.2 Product, Process and Service Innovation
- 15.3 AI, Automation and Digital Tools in the Industry
- 15.4 Technology Adoption and Performance Benchmarking
- 15.5 Innovation Pipeline and R&D Investment
- 15.6 Patent and Intellectual Property Trends
- 15.7 Energy Efficiency and Resource Management
- 15.8 Sustainability, Recycling and Circularity
- 15.9 Technology Roadmap, 2025-2035
- 15.10 Risks of Obsolescence and Technology Substitution
Chapter 16 Australia Used Vehicle Marketplace Blockchain Market Key Strategic Imperatives
- 16.1 Growth and Market Entry Priorities
- 16.2 High-Return Products and Segments
- 16.3 Pricing, Profitability and Cost Optimization
- 16.4 Technology Investment and Product Differentiation
- 16.5 Supply Chain Localization and Resilience
- 16.6 Distribution and Customer Acquisition
- 16.7 Partnership, Acquisition and Capacity Strategy
- 16.8 Regional Expansion Priorities
- 16.9 Short-, Medium- and Long-Term Actions
Chapter 17 Competition Outlook
- 17.1 Industry Competition Characteristics
- 17.2 Market Structure and Concentration
- 17.3 Market Share and Competitive Positioning, 2025
- 17.4 Company-Wise Revenue and Product Benchmarking
- 17.5 Production and Service Capacity Benchmarking
- 17.6 Technology, Pricing and Differentiation
- 17.7 Regional Footprint and Distribution Strength
- 17.8 Mergers, Acquisitions and Strategic Alliances
- 17.9 New Entrants and Competitive Threats
- 17.10 Porter's Five Forces and Industry Attractiveness
- 17.11 Competitive Outlook, 2025-2035
Chapter 18 Company Profiles
- 18.1 Company Coverage and Selection Criteria
- 18.2 AutoSettle
- 18.2.1 Business Description
- 18.2.2 Company Ownership and Geographic Presence
- 18.2.3 Product and Service Portfolio
- 18.2.4 Manufacturing and Operating Footprint
- 18.2.5 Financial Performance and Investment
- 18.2.6 Market Share and Competitive Position
- 18.2.7 Technology and Innovation Capabilities
- 18.2.8 Strategic Alliances or Partnerships
- 18.2.9 Recent Developments
- 18.2.10 Growth Strategy and Outlook
- 18.3 CarHistory / Equifax
- 18.4 AutoGrab
- 18.5 EY Australia
- 18.6 Block2 / 2Mota
- 18.7 Other Relevant Market Participants
Note: Every listed company is profiled on the structure shown under the first company. The company list is preliminary and may change based on research findings, market developments, data availability and client requirements.
Chapter 19 Disclaimer
- 19.1 Research and Forecast Disclaimer
- 19.2 Data Source and Estimation Limitations
Note: The depth of individual sections depends on data availability for this market. Volume, capacity, trade and other unit-based metrics are included where applicable.

