
Navy restocking and Canada's P-8A shape regional buying
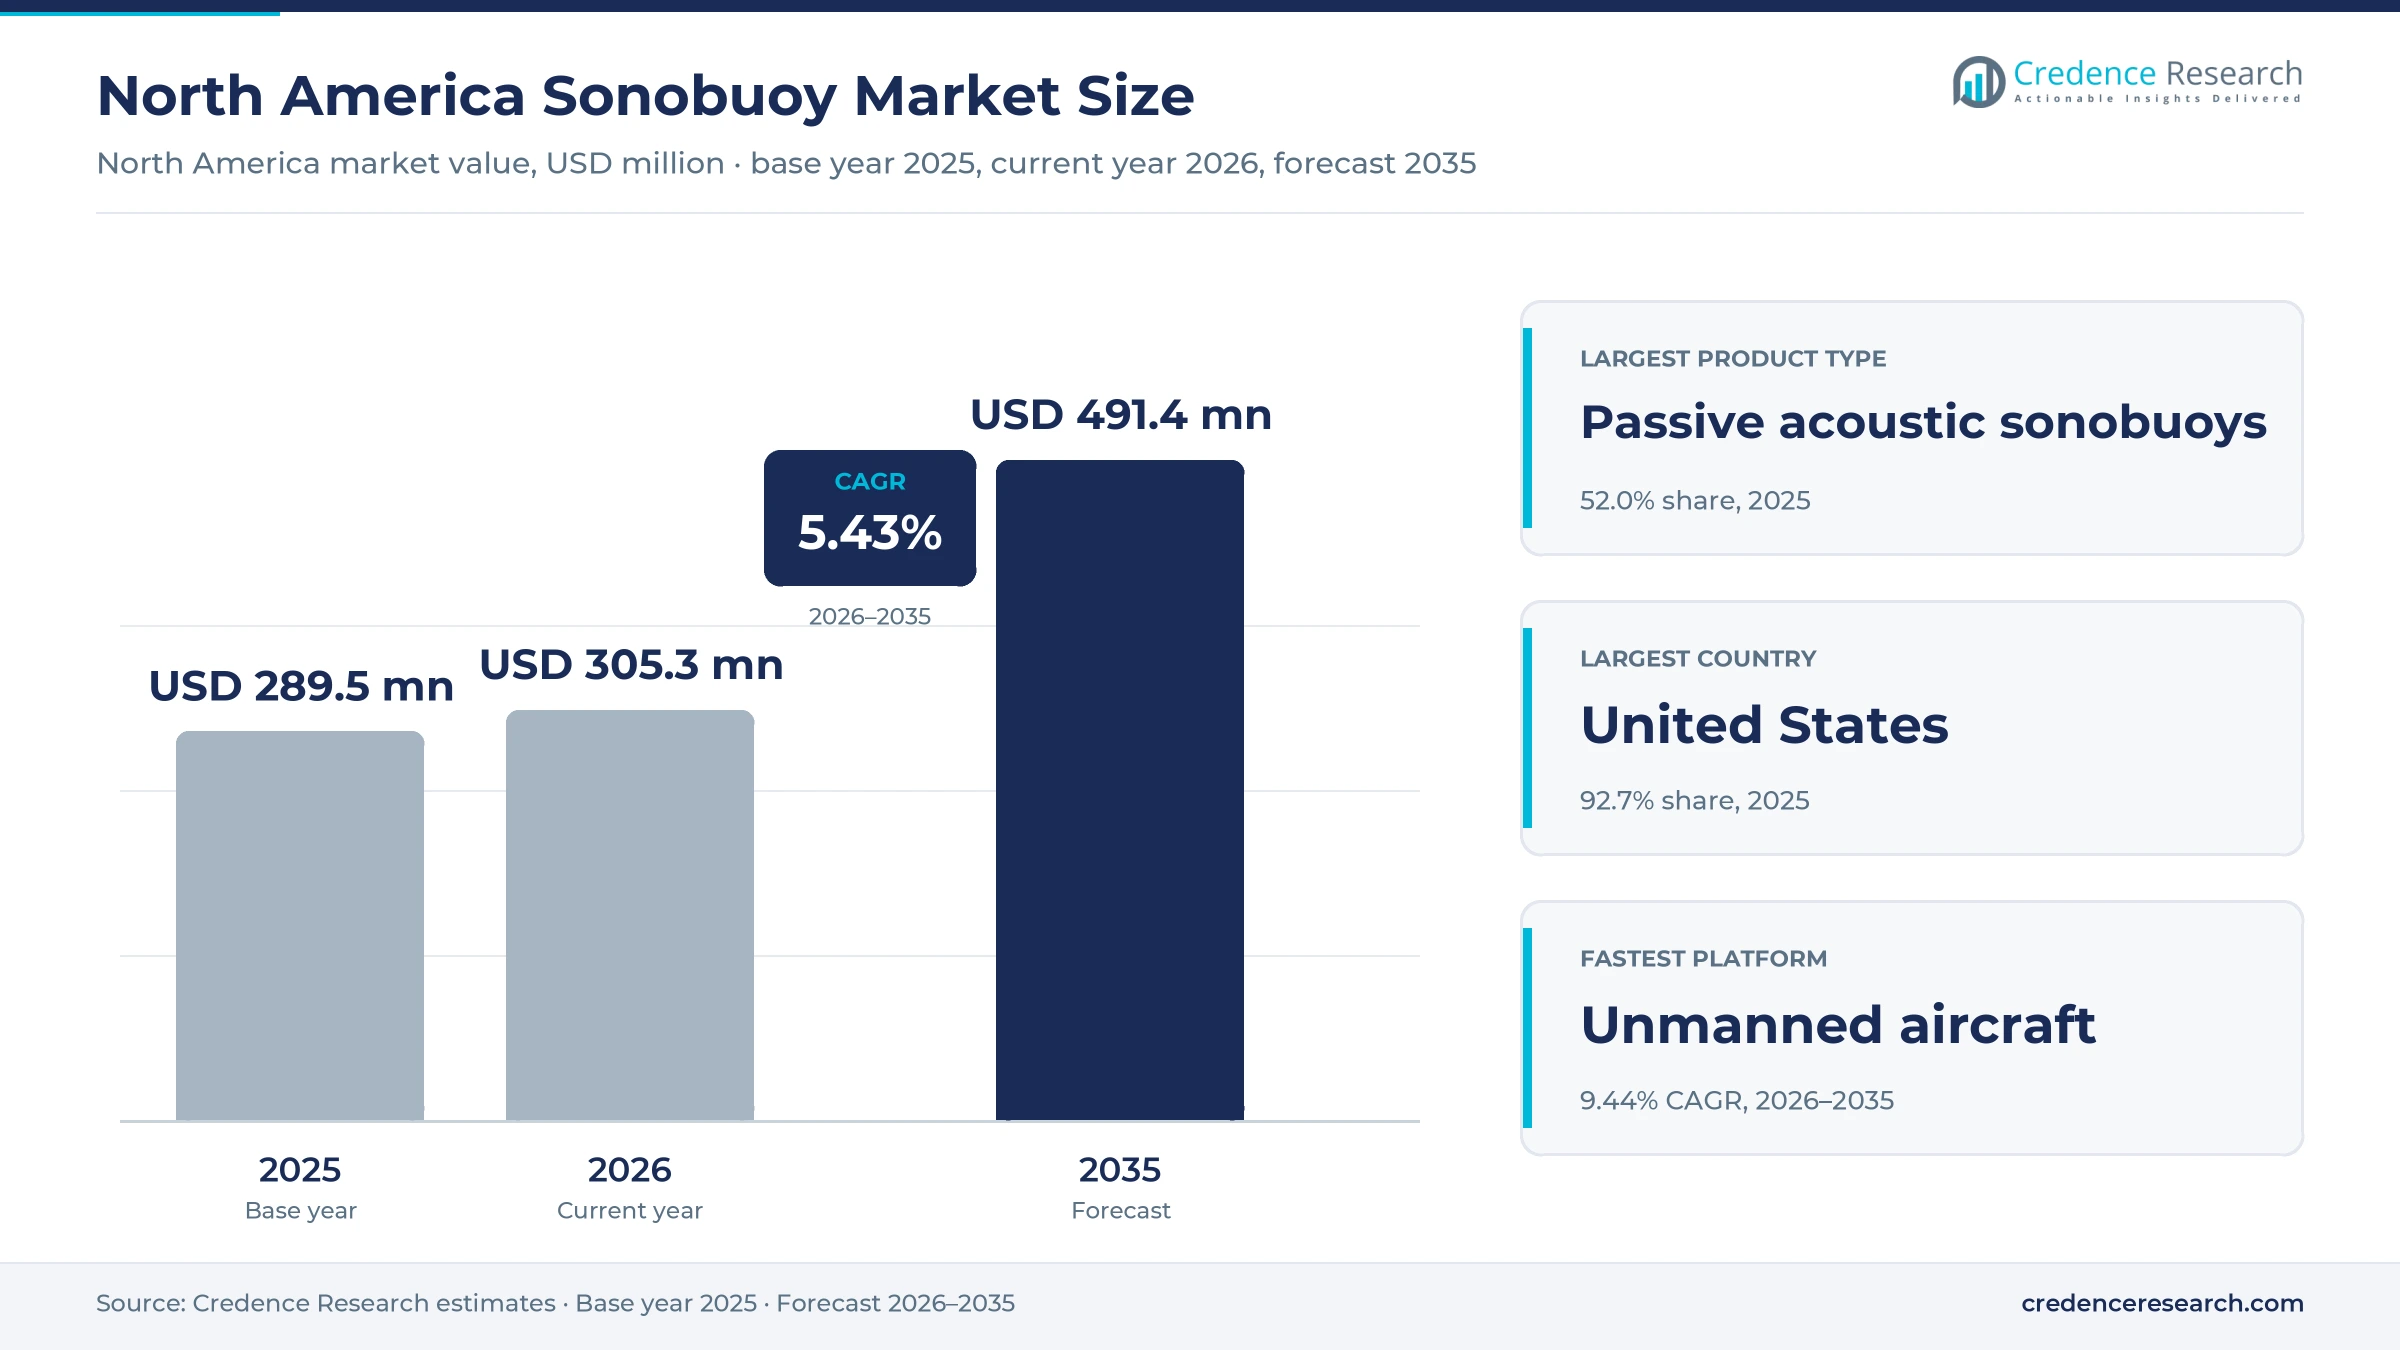
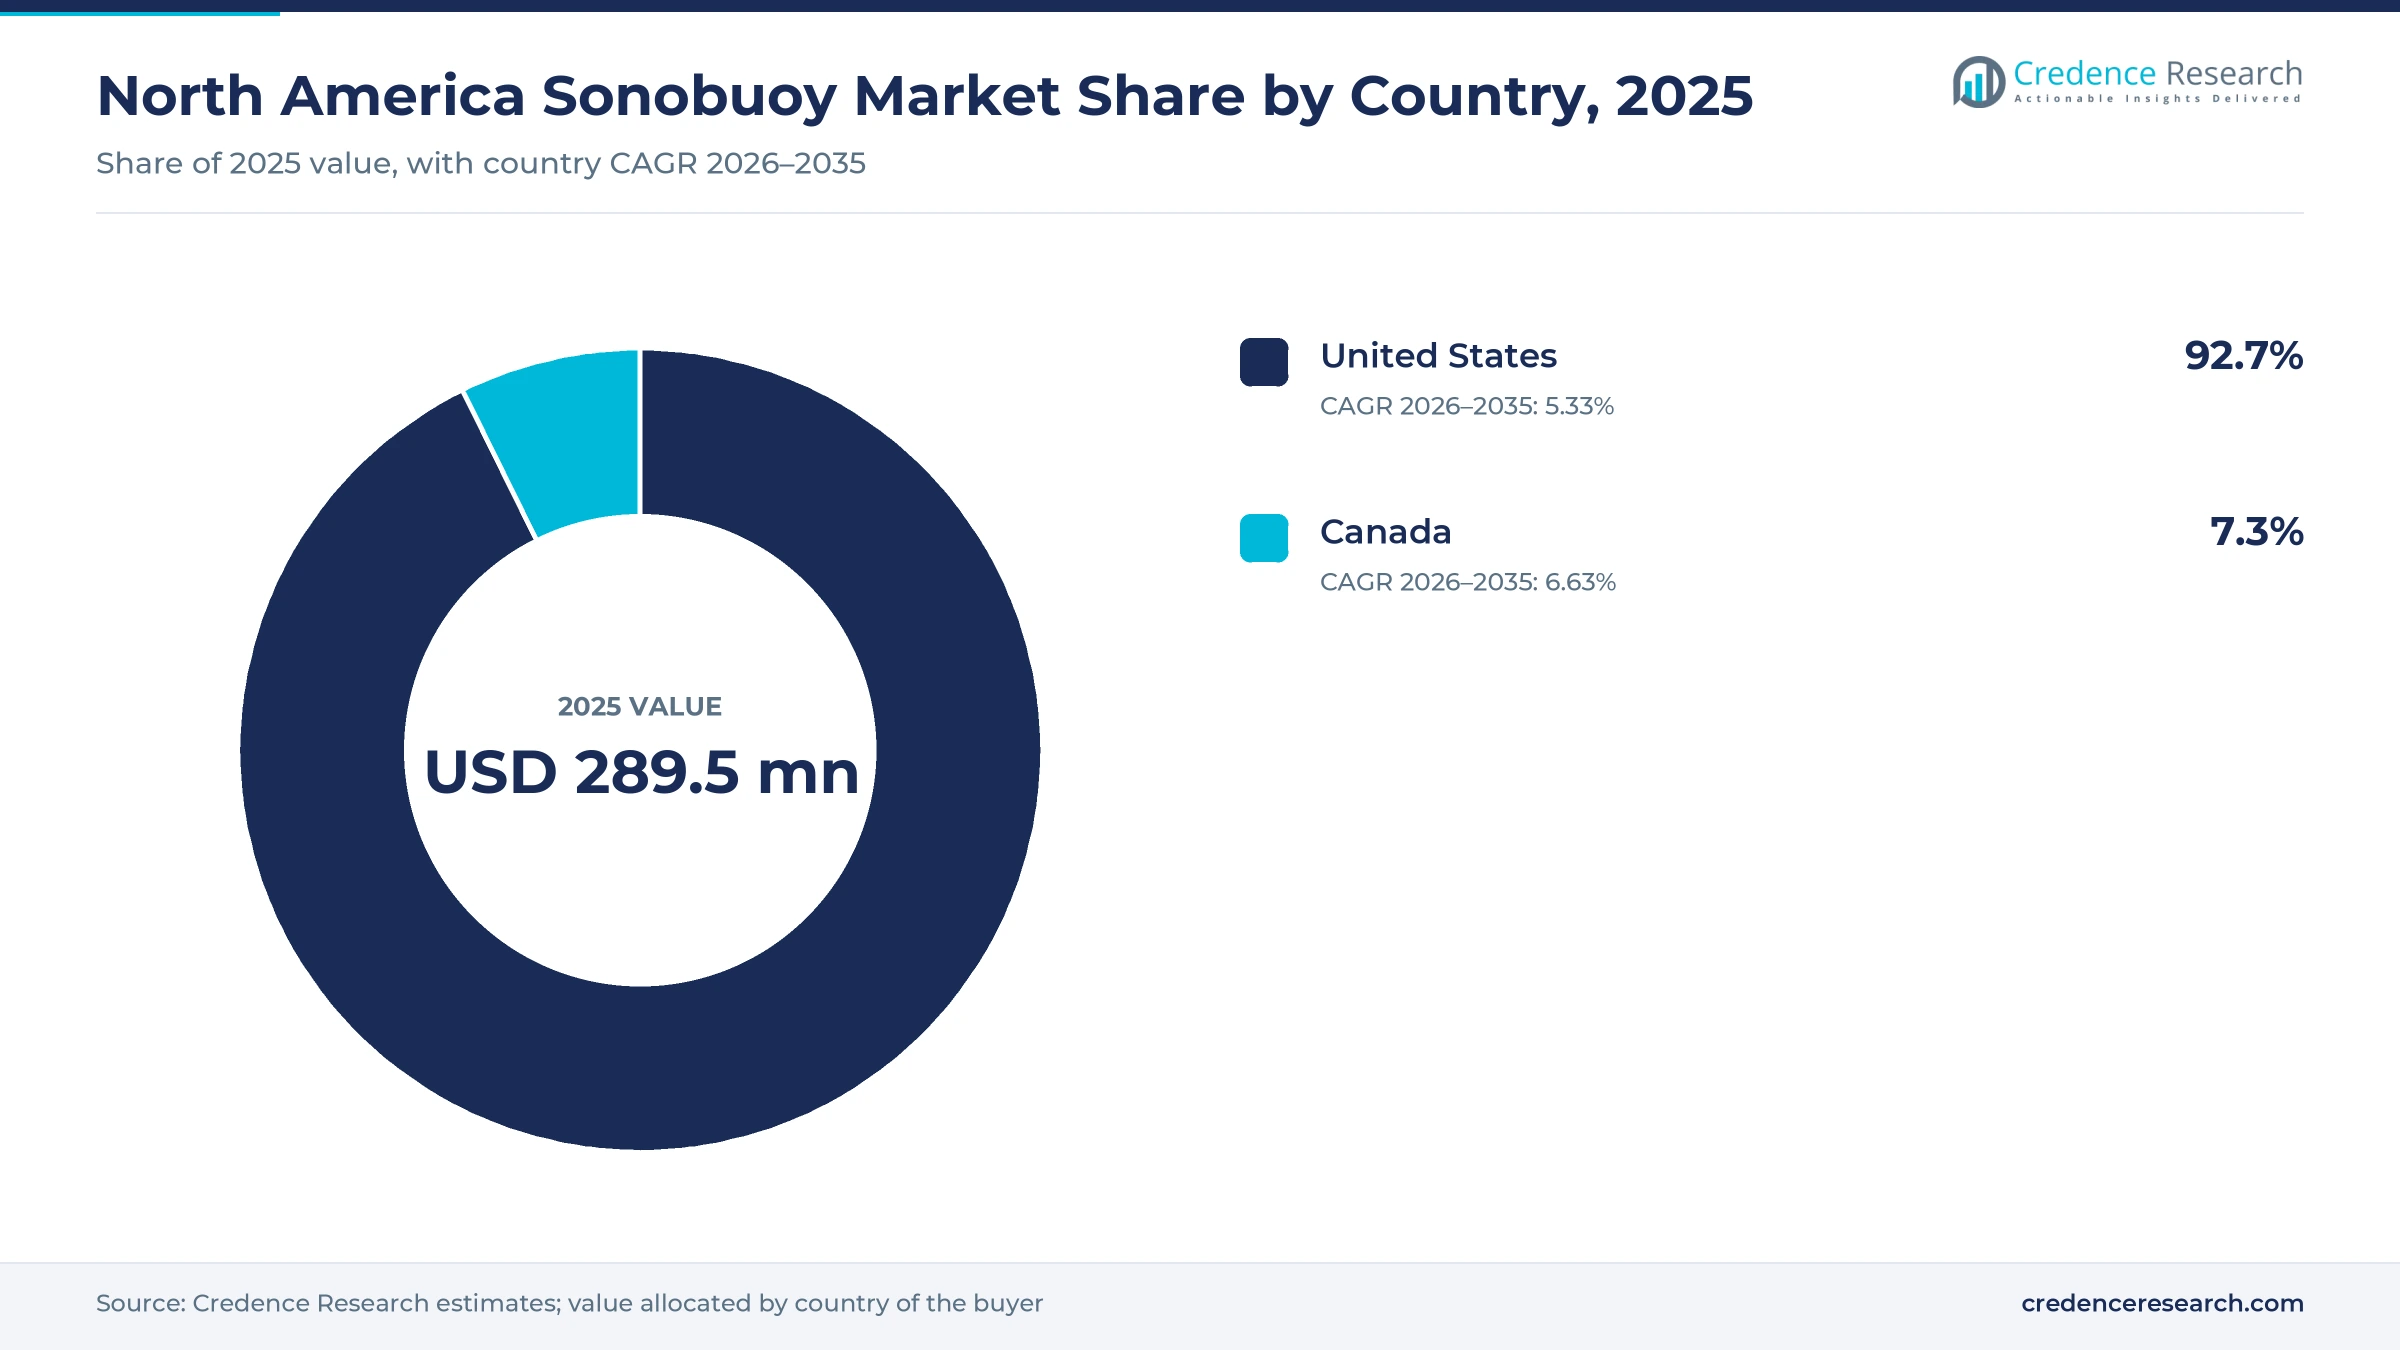
The North America sonobuoy market was valued at USD 289.5 million in 2025 and is projected to increase from USD 305.3 million in 2026 to USD 491.4 million by 2035, registering a CAGR of 5.43% during 2026–2035. Demand comes from the U.S. Navy, which buys expendable acoustic buoys for P-8 and H-60 crews, and from Canada as it moves from the CP-140 Aurora to the P-8A. The United States held the largest country share, 92.7% in 2025, because Navy procurement line 4048 received about $311 million in fiscal 2024 before more than doubling in fiscal 2025. Canada is the faster-growing country at 6.63% a year, since production of its first P-8A began in Wichita on Feb. 18, 2026. Supply is changing as well, because the Navy moved production of multistatic sources to the AN/SSQ-125B and Lockheed Martin agreed in July 2026 to acquire Ultra Maritime.
What does this acoustic buoy market count, and who buys it?
The estimate counts the value of air-launched sonobuoys sold for military use in the United States and Canada, including passive listening buoys, active pinging buoys and special-purpose types such as bathythermographs. Buyers purchase through Naval Air Systems Command delivery orders and Canadian government procurement. Each buoy is expendable, so consumption continues whenever crews train or patrol.
The estimate excludes aircraft, onboard acoustic processors, torpedoes and sonar fitted to ships, and it does not size Mexico separately. The value chain runs from electronics and battery suppliers through final assembly in Florida, Indiana, Virginia and Nova Scotia to Navy and air force stocks.
North America Sonobuoy Market Insights
- The market grows from USD 289.5 million in 2025 to USD 491.4 million by 2035, a 5.43% CAGR over 2026–2035, as Navy stocks and Canadian patrol fleets are replenished.
- The United States held 92.7% of regional value in 2025, reflecting Navy purchases for P-8 and H-60 crews under a single procurement budget line.
- Passive acoustic sonobuoys led with 52.0% of 2025 value, as directional listening buoys such as the AN/SSQ-53 make up most units in published Navy orders.
- The Navy awarded Ultra Maritime a sole-source AN/SSQ-125B low-rate production contract in April 2026, moving multistatic source buying to the newer design from fiscal 2026.
- Lockheed Martin agreed in July 2026 to pay $3.45 billion for Ultra Maritime, combining two of the three U.S. production sources named in a 2022 Navy contract.
Passive buoys and fixed-wing patrols anchor value
Why do passive buoys lead product value?
Based on product type, the market is categorized into passive acoustic sonobuoys, active acoustic sonobuoys and special-purpose sonobuoys. Passive acoustic sonobuoys led with 52.0% of 2025 value because a Navy order reported by Military & Aerospace Electronics in October 2016 listed up to 95,000 AN/SSQ-53 buoys among 141,500 units. Active acoustic sonobuoys grow fastest at 6.02% a year as higher-priced types gain weight, with the same publication reporting a Sparton order in January 2025 for up to 20,000 AN/SSQ-125 buoys at $107.1 million, about $5,355 each.
Which missions consume the most buoys?
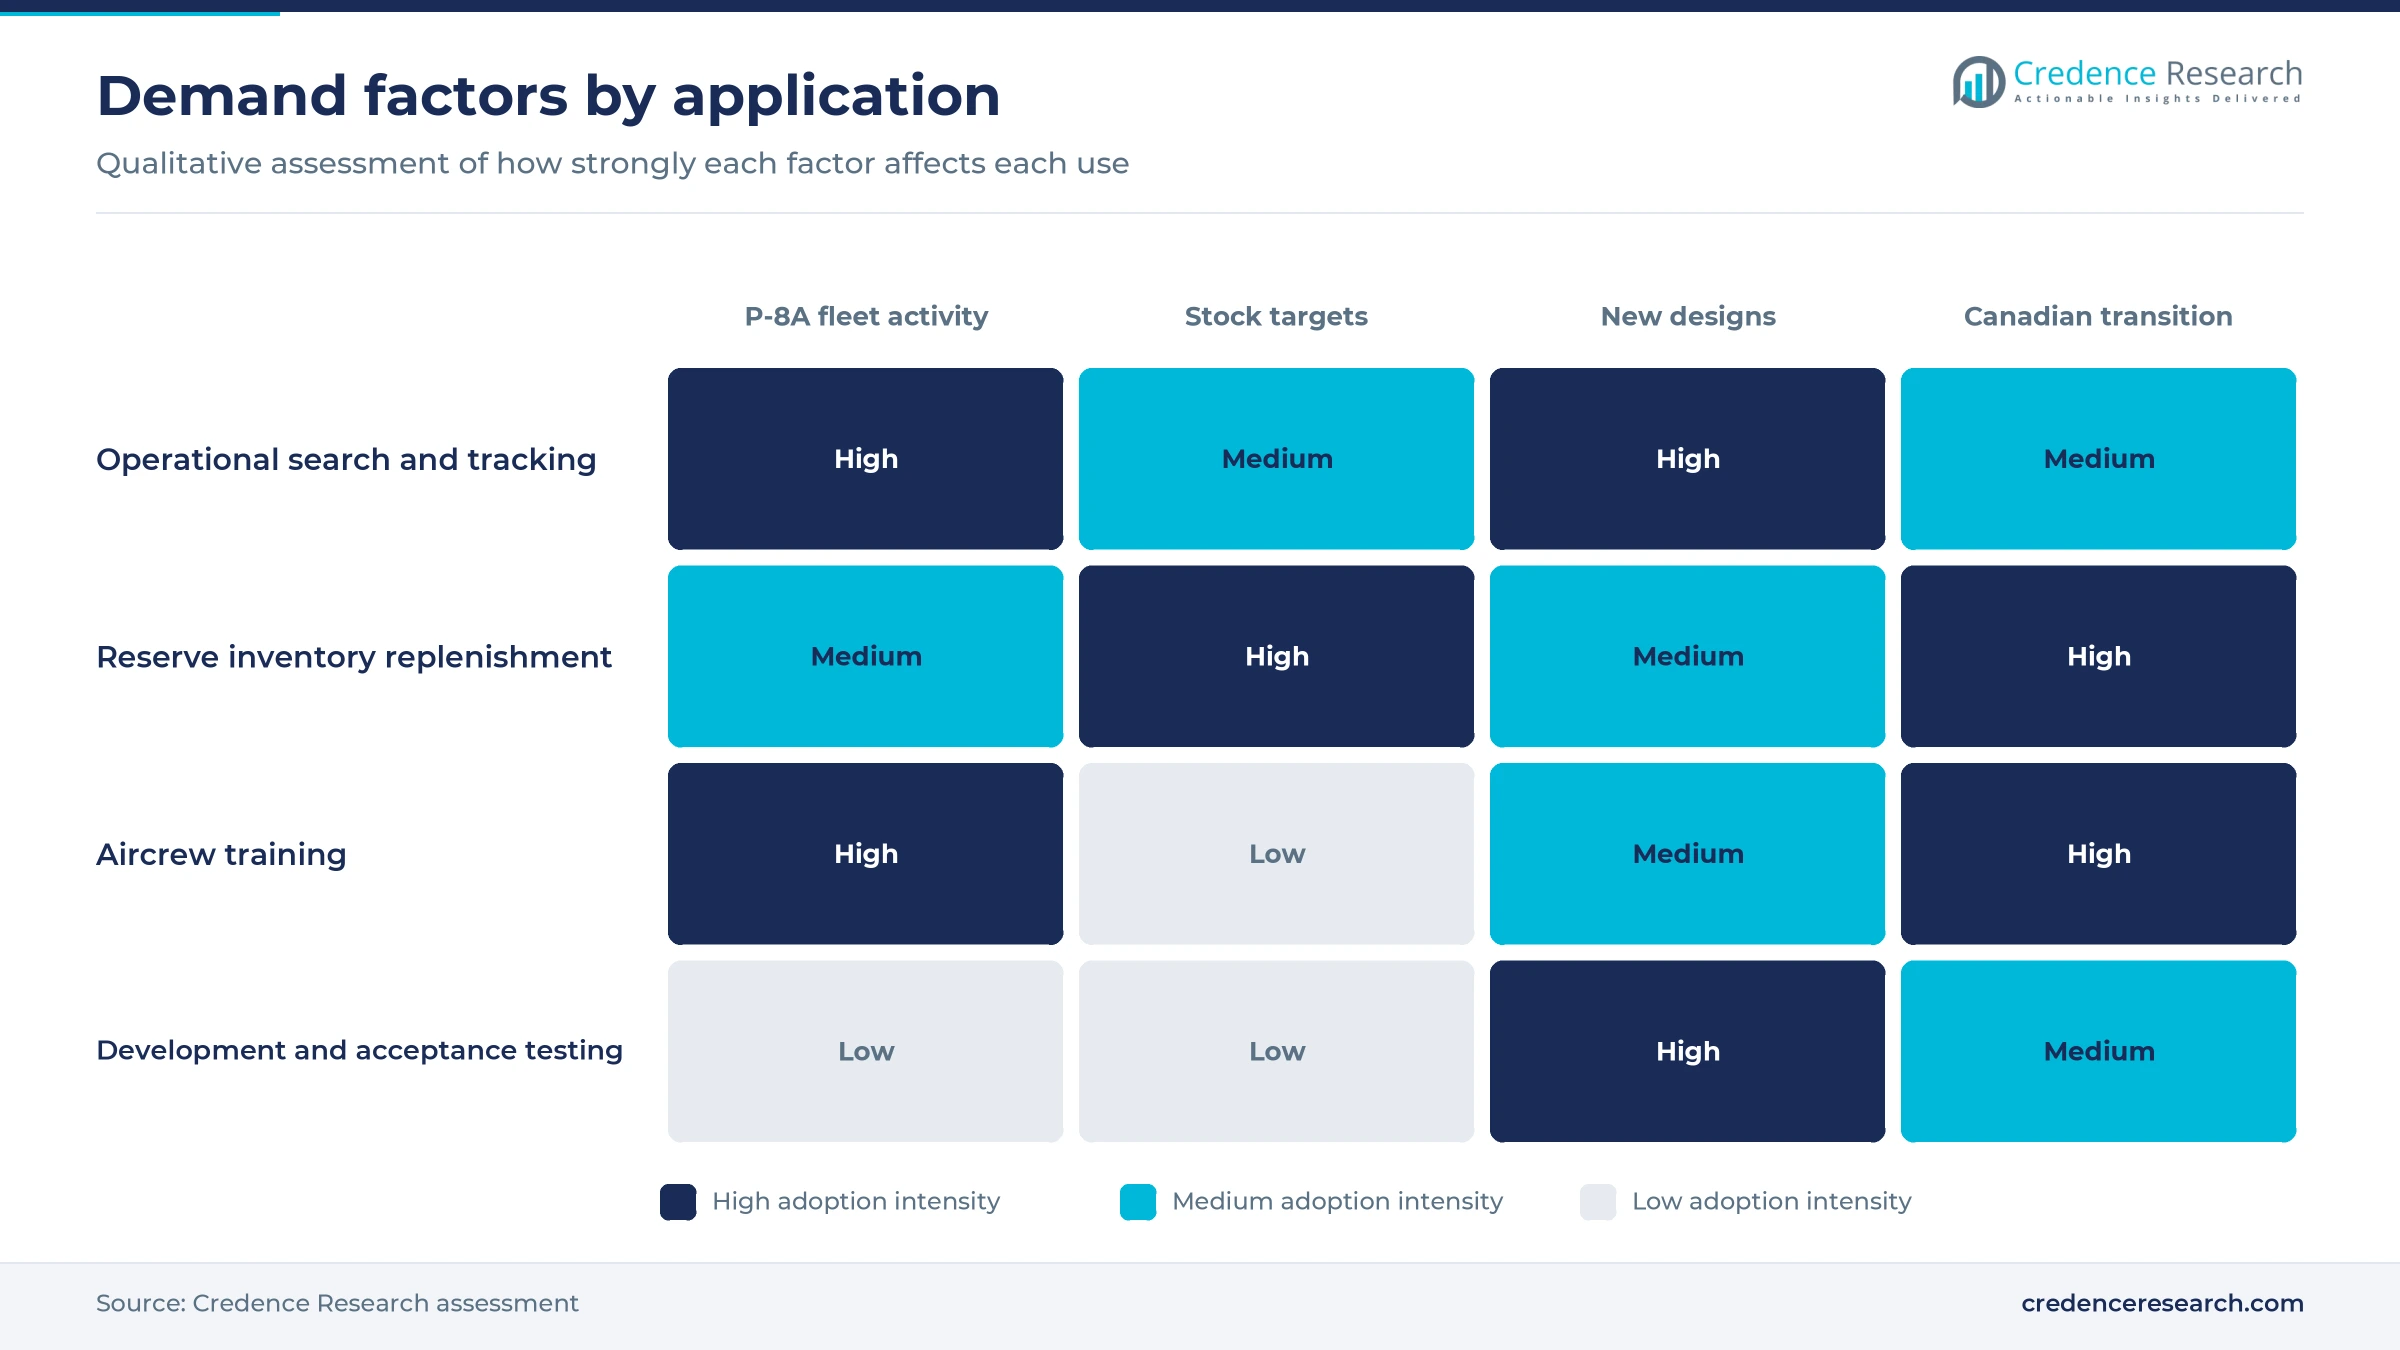
Based on application, the market is categorized into operational search and tracking, reserve inventory replenishment, aircrew training and development and acceptance testing. Operational search and tracking led with 46.0% of 2025 value because the Navy budget justification ties this line to forward anti-submarine presence by P-8 and H-60 crews. Reserve inventory replenishment grows fastest at 6.18% a year as an October 2022 Navy contract, reported by Defense Daily, names inventory for major combat operations among its purposes, and fiscal 2027 adds a separate out-of-cycle request to replace buoys expended in operations.
How do aircraft types shape buying?
Based on deployment platform, the market is categorized into fixed-wing aircraft, rotary-wing aircraft and unmanned aircraft. Fixed-wing aircraft led with 72.0% of 2025 value because each P-8A can carry a large load, with the Government of Canada listing capacity for 129 A-size sonobuoys on its aircraft. Unmanned aircraft grow fastest at 9.44% a year from a small base, as General Atomics dropped DIFAR, DICASS and bathythermograph buoys from pods on an MQ-9B during tests on Jan. 20-30, 2025, according to its Feb. 25, 2025 release.
Where does competition end and sole-source begin?
Based on sales channel, the market is categorized into United States competitive delivery orders, United States sole-source production awards and Canadian defence procurement. United States competitive delivery orders led with 64.7% of 2025 value because the Navy's 2022 contract, with a $5.1 billion ceiling according to Defense Daily, lets three producers compete for individual orders. Canadian defence procurement grows fastest at 6.63% a year as 14 P-8A aircraft, with options for two more, replace a CP-140 fleet whose life expectancy ends in 2030, according to Public Services and Procurement Canada.
| Segment Group | Leading Sub-segment | Share, 2025 | Fastest-growing Sub-segment | CAGR, 2026–2035 |
|---|---|---|---|---|
| By Product Type | Passive acoustic sonobuoys | 52.0% | Active acoustic sonobuoys | 6.02% |
| By Application | Operational search and tracking | 46.0% | Reserve inventory replenishment | 6.18% |
| By Deployment Platform | Fixed-wing aircraft | 72.0% | Unmanned aircraft | 9.44% |
| By Sales Channel | United States competitive delivery orders | 64.7% | Canadian defence procurement | 6.63% |
Request a Free Sample
Fill in your details and we'll send you a free sample report.
- Sample data tables & charts
- Research methodology
Replenishment, new buoys and Canada lift orders
Recurring readiness replenishment keeps orders flowing
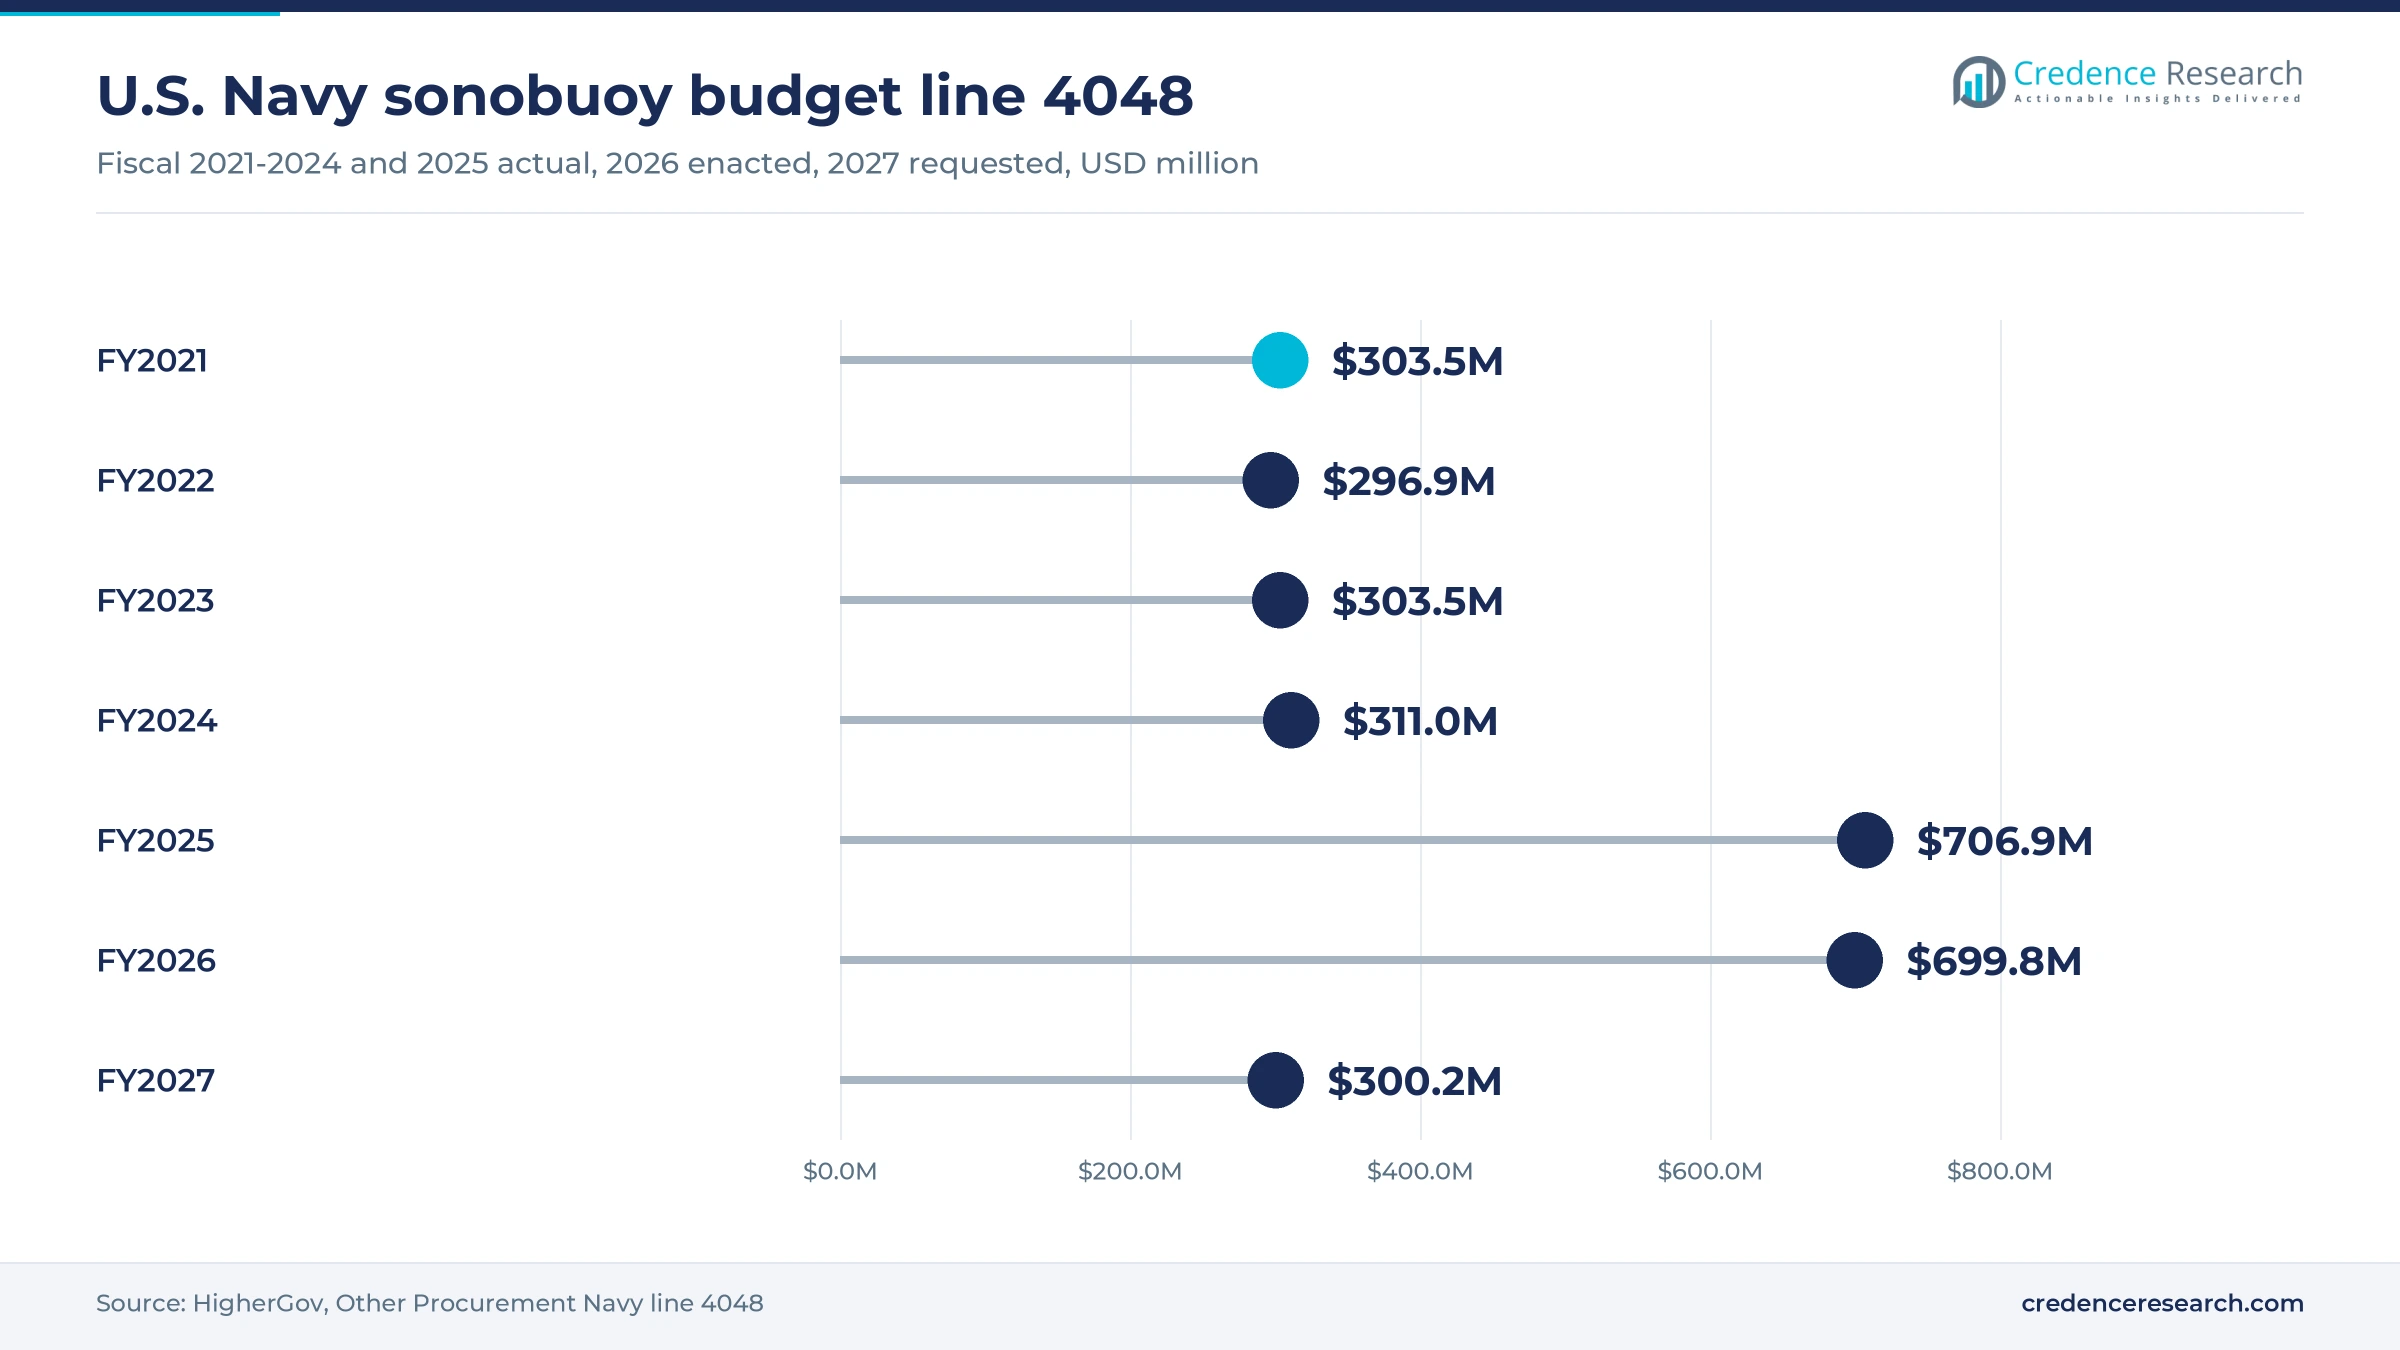
Readiness buying gives this market a steady base because every buoy dropped in training or on patrol has to be replaced. The Navy budget line 4048 on HigherGov shows actual funding between about $297 million and $311 million a year from fiscal 2021 through fiscal 2024, then about $707 million in fiscal 2025 and $700 million enacted for fiscal 2026. That line also pays for acceptance testing and production engineering, and orders are delivered over later years, so appropriations do not become market value dollar for dollar. An October 2022 Navy contract with a $5.1 billion ceiling, reported by Defense Daily, covers annual training, peacetime operations, testing and inventory for major combat operations, with work running through September 2027.
Next-generation acoustic buoys replace older designs
Replacement of older designs lifts value because newer buoys cost more and hunt quieter targets. The Navy moved multistatic source production solely to the AN/SSQ-125B from fiscal 2026, according to its budget justification, and Ultra Maritime won a sole-source low-rate production contract for that buoy, as The Defense Post reported on April 7, 2026. FW-Mag reported the same month that the buoy forms part of the P-8 Increment 3 Block 2 upgrades. The budget text also schedules a new receiver, the AN/SSQ-145, to complement AN/SSQ-101 stocks from fiscal 2029. As a result, Active acoustic sonobuoys grow at 6.02% a year in the Credence Research model.
Canadian maritime patrol transition opens a new buyer
Canada adds a distinct demand step as it replaces the CP-140 Aurora with the P-8A, a change in the country's maritime patrol aircraft that alters buoy requirements. The Government of Canada project page lists up to 16 aircraft, each able to carry 129 A-size sonobuoys, at 14 Wing Greenwood and 19 Wing Comox. Production of the first aircraft began on Feb. 18, 2026, and the same page estimates first delivery in 2027 and final deliveries in 2027-2028. Canadian Defence Review reported in October 2024 that Ultra Maritime plans to supply these aircraft with significant made-in-Canada content. Canada therefore grows faster than the United States in the Credence Research model through 2035.
Canada's submarine plan and export scale support capacity
Allied programs support regional plants even when the buoys are not bought for North American fleets. Ultra Maritime says up to 20 countries are procuring or expected to procure the SSQ-62G, according to its Oct. 2, 2025 statement, and it reports more than 150 suppliers across 24 U.S. states. Canada's Department of National Defence said in July 2026 that it had begun negotiations with Thyssenkrupp Marine Systems for up to 12 submarines, with the first four due in 2034, which keeps undersea warfare high in planning for Canadian naval vessels. The Navy budget text for fiscal 2025 also cites economies of scale across domestic and foreign military sales funds, so allied volume can spread fixed plant costs.
Competition, drones and consolidation reshape supply
Shift from a joint venture to rival production lines
Competition among separate designs is replacing the old shared supply model. The Navy budget justification says independent Sparton and Ultra Undersea Sensor Systems designs replaced the former ERAPSCO joint venture, while Defense Daily named Lockheed Martin as a third contract holder in October 2022. Ultra Maritime then announced a competitive SSQ-53H delivery order on June 20, 2025, and an SSQ-62G order on Oct. 2, 2025. Fiscal 2027 offers the first competitive opportunity for the DICASS buoy after single-source production through fiscal 2026. Competitive orders therefore held 64.7% of 2025 value in the Credence Research estimate, while the Navy accepts higher qualification and learning costs for a broader supplier base.
Rise of pod-launched buoys on unmanned aircraft
Unmanned launch is moving from concept to tested capability, which widens where buoys can be used. General Atomics tested sonobuoy dispensing pods on an MQ-9B SeaGuardian on Jan. 20-30, 2025, with support from the Naval Air Warfare Center Aircraft Division, according to its Feb. 25, 2025 release. The company tied that work to earlier cooperation at the RIMPAC exercise in July 2024. The test covered DIFAR, DICASS and bathythermograph types, the same families bought by the Navy. Buyers of military drones can therefore treat sonobuoys as a mission load rather than a separate fleet. Unmanned aircraft grow at 9.44% a year in the Credence Research model, although from a small base.
Opportunity in a Canadian-content supply chain
Canada offers an opening for suppliers that can build to U.S. Navy specifications inside the country. Ultra Maritime invested more than $20 million in its Dartmouth site, according to Canadian Defence Review, which also counted about 350 company employees in Atlantic Canada. A March 2021 company statement carried by EDR Magazine described the firm as Canada's sovereign sonobuoy supplier. High North News reported in December 2023 that the P-8A fleet reaches full operating capability by 2033, so stocking decisions will run for years. Component makers in defense electronics could therefore compete for work on Canadian lines as Canadian defence procurement grows fastest among sales channels in the Credence Research model.
Opportunity in test services after the P-3 retires
Acceptance testing is an opening because the aircraft traditionally used for it are leaving service. The Navy budget justification for fiscal 2027 funds a new contractor-operated air-launch test capability, stating that the P-3 is being retired and suitable aircraft are difficult to schedule. The same document lists acceptance testing and production engineering within a line requesting about $300 million for that year. The Navy also plans a first AN/SSQ-101B competition in fiscal 2027, combining three years of requirements, which adds qualification work for new sources in a market worth USD 305.3 million in 2026. Service providers with instrumented ranges and drop aircraft can therefore bid on recurring work outside the buoy production lines in Florida and Indiana.
Budget swings and split orders test suppliers
Budget swings make capacity planning harder
Funding volatility is the largest planning risk for regional buoy producers. The Navy line moved from about $311 million in fiscal 2024 to about $707 million in fiscal 2025, and the fiscal 2027 request falls to about $300 million before forecasts return above $640 million in fiscal 2028. Plants that add shifts for peak years can face idle capacity in the next one. Producers therefore rely on export orders and multi-year contract ceilings to steady their lines.
Split awards raise the cost of each buoy
Dual sourcing protects supply but costs money, since the Navy budget text states that splitting orders reduces economical ordering quantities and contributes to higher unit costs. The AN/SSQ-53 is one type named in that passage, and unit prices already vary widely, with published ceilings near $5,355 for AN/SSQ-125 buoys in the December 2024 Sparton order. Navy budget offices therefore get fewer buoys for each dollar spent. The Navy accepts this trade to keep at least two qualified producers.
Consolidation narrows the supplier base
Consolidation could reduce the competition the Navy has worked to build. The October 2022 contract named Lockheed Martin, Undersea Sensor Systems and Sparton, while Lockheed Martin's 10-Q for the quarter ended Sept. 27, 2026 confirms a definitive agreement for Ultra Maritime, which owns the second of those lines. That leaves Sparton, owned by Elbit America since April 2021, as the other independent source. Navy buyers may respond by watching pricing closely and maintaining qualified second sources for each type.
Canadian timing leaves a transition risk
Canada faces a tight handover between aircraft fleets, with supply consequences for buoy planners. A Public Services and Procurement Canada note placed the first P-8A delivery as early as 2026, while the current project page estimates 2027, and the CP-140 life expectancy is 2030. Buoy stocks must suit both fleets during that overlap, and overordering older types risks waste. Canadian planners can reduce the risk by timing orders to confirmed aircraft deliveries at Greenwood and Comox.
The United States dominates while Canada grows faster
| Country | Value, 2025 (USD million) | Share, 2025 | CAGR, 2026–2035 |
|---|---|---|---|
| United States | 268.4 | 92.7% | 5.33% |
| Canada | 21.1 | 7.3% | 6.63% |
The United States buys through one Navy line
The United States held 92.7% of 2025 value and grows at 5.33% a year, a pace close to the regional total because it sets that total. Naval Air Systems Command at Patuxent River buys for P-8 and H-60 crews, with plants named in the 2022 contract at Manassas, Virginia, Columbia City, Indiana and De Leon Springs, Florida. Ultra Maritime also reports hundreds of jobs added at Columbia City over two years, which shows how Navy orders shape regional employment.
Canada moves to P-8A aircraft and Atlantic production
Canada held 7.3% of 2025 value and grows faster than the regional average because a new aircraft brings new buoy requirements. The first P-8A entered fuselage assembly in Wichita in February 2026, and bases at Greenwood and Comox will operate the fleet on both coasts. Dartmouth, Nova Scotia, provides domestic production, since Canadian Defence Review reported sonobuoy production areas there. Arctic security and NATO duties, cited by High North News, add patrol demand over a wide ocean area.
Dated orders and deals from 2025 to 2026
| Development | Status and market relevance |
|---|---|
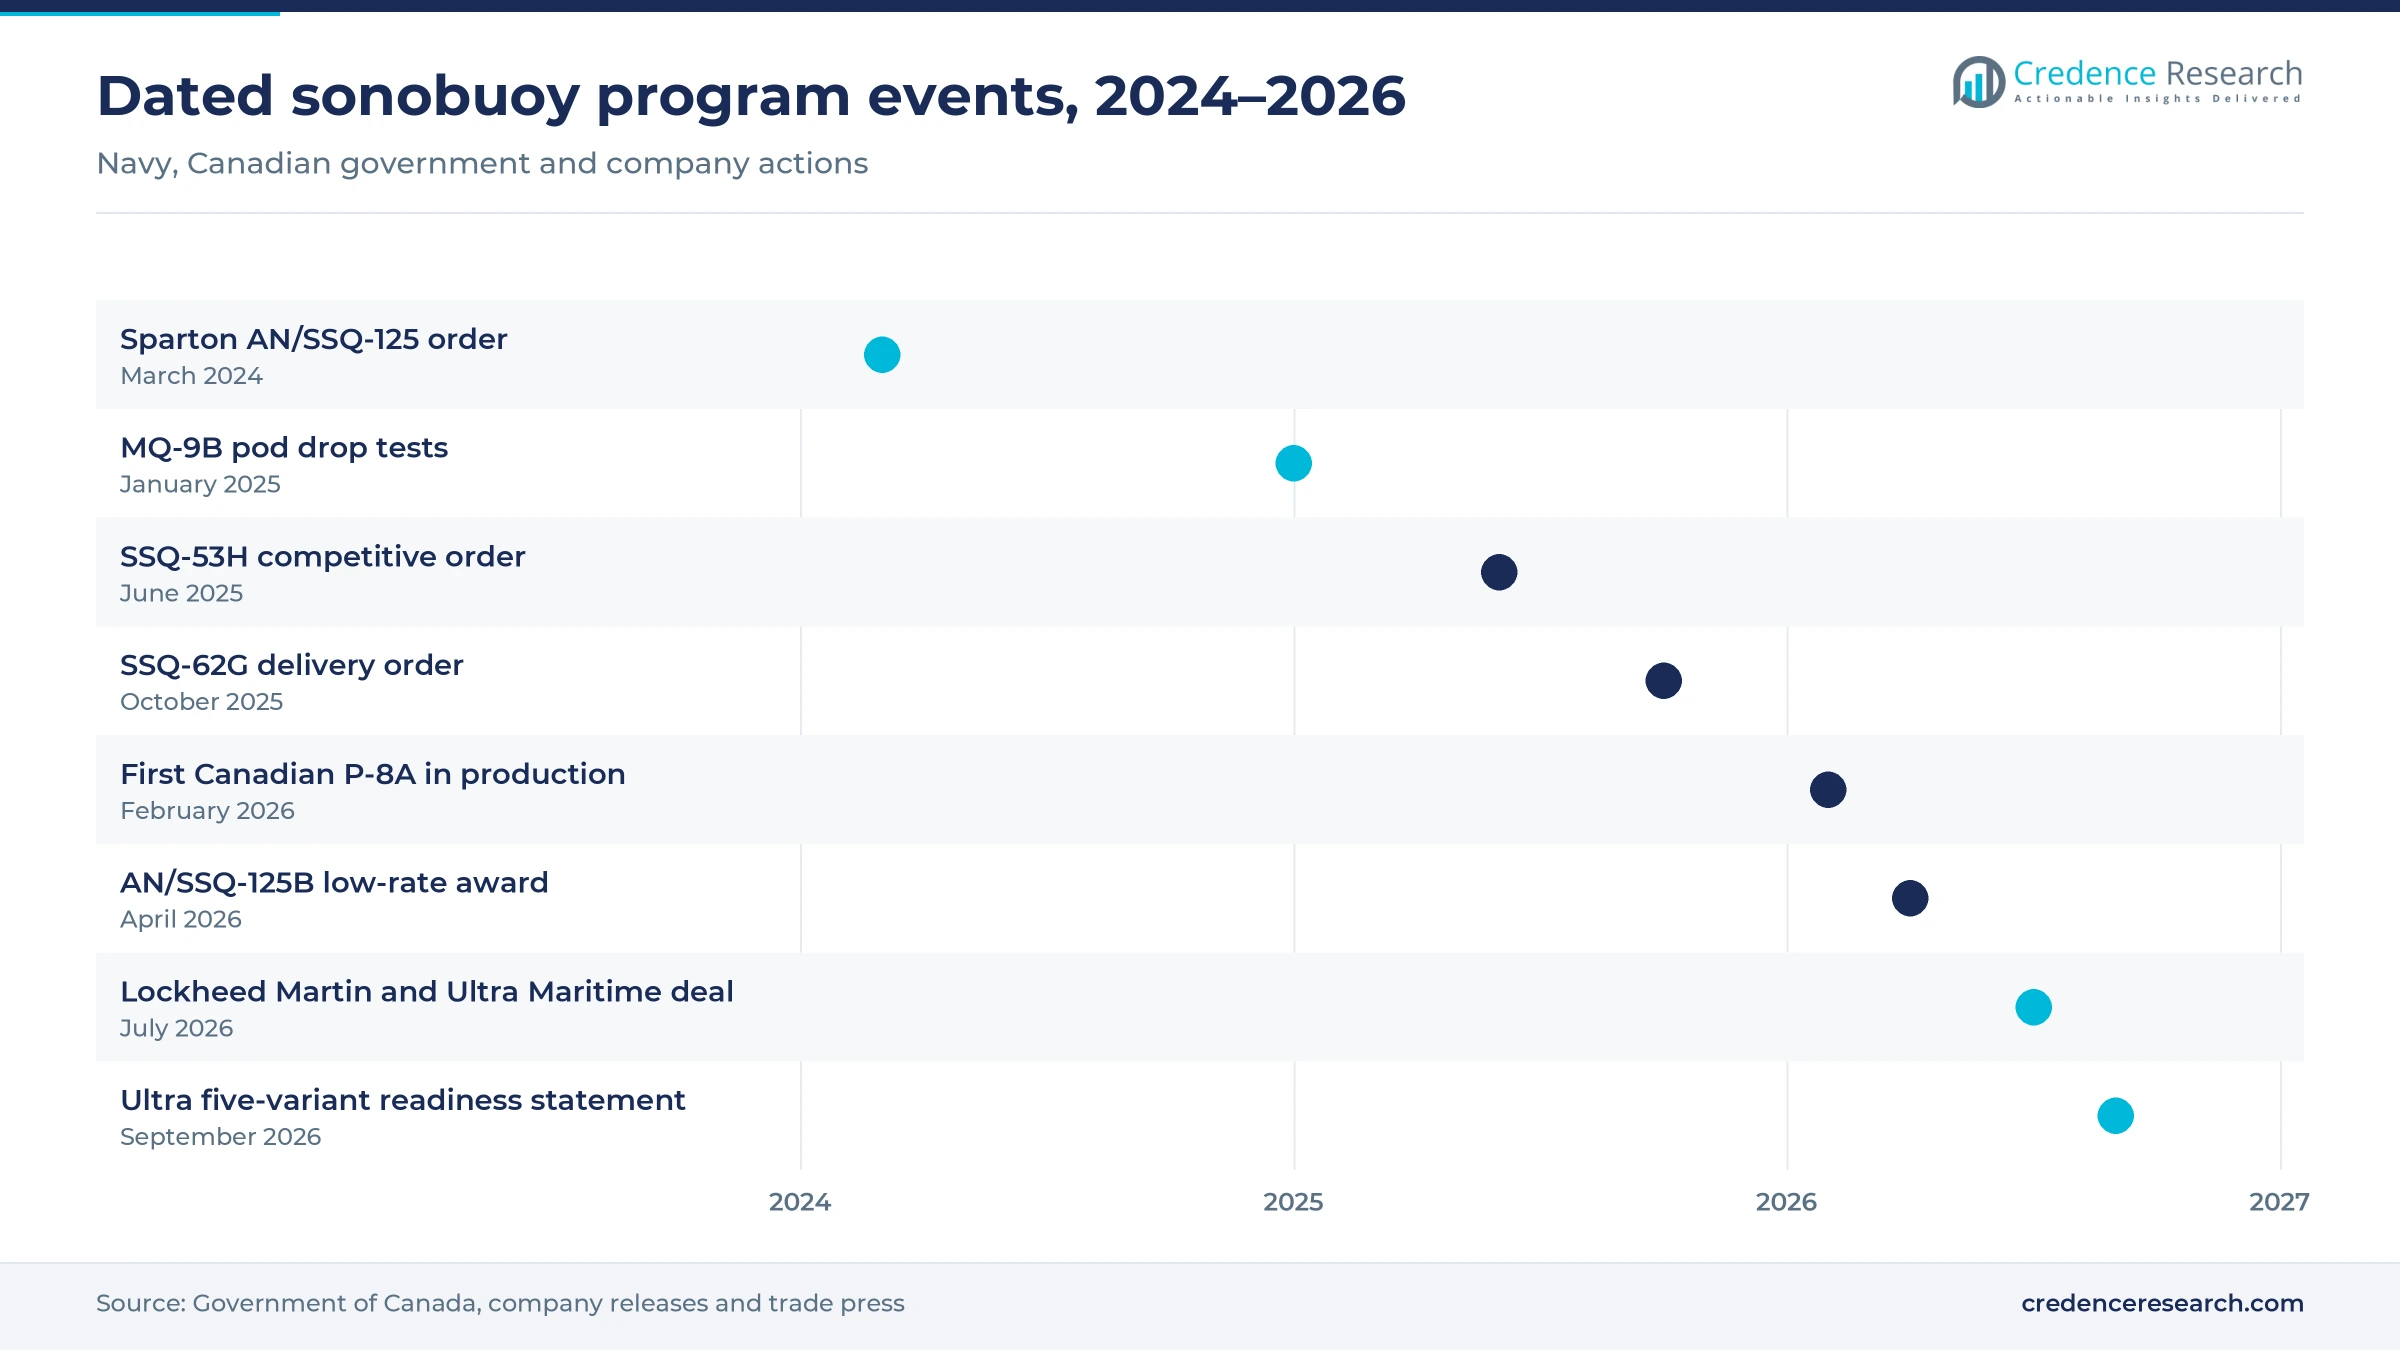
| In June 2025, Ultra Maritime announced a competitive firm-fixed-price delivery order for SSQ-53H sonobuoys under fair opportunity procedures. | Order placed; value not disclosed; shows passive buoys moving through competitive channels |
| In April 2026, Ultra Maritime won a sole-source low-rate production contract for the AN/SSQ-125B. | In low-rate production; buoys support training, operations and stockpiling for the Navy |
| In July 2026, Lockheed Martin agreed to acquire Ultra Maritime for $3.45 billion, with the business to join Rotary and Mission Systems on closing. | Agreement signed per the third-quarter 10-Q, with closing expected in the fourth quarter of 2026; reshapes the U.S. supplier base |
| In February 2026, production of Canada's first P-8A began at Boeing's Wichita facility, according to the Government of Canada. | First delivery estimated in 2027; creates buoy stocking requirements at two bases |
SSQ-125B, SSQ-145 and G-size buoys define the next phase
- AN/SSQ-125B is a coherent source buoy that generates varied waveforms for other buoys to record, and it can change depth or parameters after deployment.
- AN/SSQ-145 is a planned multistatic receiver that the Navy expects to complement AN/SSQ-101 inventories from fiscal 2029.
- G-size buoys are smaller formats offered by Ultra Maritime, which described itself in September 2026 as the only company offering them.
- Pod dispensing allows unmanned aircraft without internal launch tubes to carry buoys, as the January 2025 MQ-9B tests showed.
Need a Custom Version of This Report?
Tailor the scope, geography, or segments to your exact requirements.
- Custom geography or segment scope
- Direct access to our analyst team
Two U.S. production bases and one pending merger
Competition centers on qualification, plant capacity and price per delivery order rather than brand. Ultra Maritime reports more than 1,000 sonobuoys a day across the United States, the United Kingdom and Canada, with Columbia City, Indiana, as its modernized U.S. plant. Sparton builds at De Leon Springs, Florida and has held Navy orders for AN/SSQ-125 multistatic buoys since at least March 2024. Lockheed Martin, a third holder of the 2022 Navy contract, agreed to buy Ultra Maritime for $3.45 billion in July 2026, a deal that would place Ultra Maritime inside its Rotary and Mission Systems business once it closes. That business also held AN/SSQ-125A work with sites at Manassas and Clearwater, according to Military & Aerospace Electronics in April 2022. Sparton therefore remains the main independent U.S. line, backed by Elbit America since April 2021. Aircraft makers such as Boeing and General Atomics do not make buoys, but their launch systems and aircraft integration decide which formats buyers can use.
Companies profiled and their roles in this market
| Company | Type | Role in the market |
|---|---|---|
| Ultra Maritime | Buoy producer | Columbia City and Dartmouth plants; SSQ-53H, SSQ-62G and AN/SSQ-125B orders; pending sale to Lockheed Martin |
| Sparton DeLeon Springs, LLC | Buoy producer | De Leon Springs, Florida; AN/SSQ-125 orders of up to 20,000 buoys in 2024; Elbit America subsidiary |
| Lockheed Martin Corporation, Rotary and Mission Systems | Buoy producer and acquirer | Manassas, Virginia; holder of the 2022 Navy contract; buyer of Ultra Maritime |
| General Atomics Aeronautical Systems | Platform integrator | MQ-9B pod-launched buoy tests in January 2025; does not produce buoys |
| Boeing | Platform maker | P-8A fuselage assembly for Canada at Wichita; does not produce buoys |
Inventory policy matters more than fleet size
Credence Research's view is that inventory policy will matter more than fleet size in the North America sonobuoy market through 2035. Navy budget text now separates training, operational replenishment and stocks for major combat operations, and the jump to about $707 million in fiscal 2025 suggests stocks are the swing factor. The North America sonobuoy forecast to 2035 could prove conservative if funding near $640 million or more holds from fiscal 2028. However, the fiscal 2027 request of about $300 million shows how quickly that funding can reverse, so buyers should plan for uneven orders.
How Credence Research built this acoustic buoy estimate
The report uses 2025 as the base year and 2035 as the forecast year, with market values from the Credence Research model. Country, product, application, platform and channel splits are Credence Research estimates, not reported statistics. Values are modeled estimates of buoy hardware rather than appropriations, so they can sit well below the Navy line in years when funding jumps. Sources consisted of Navy budget text republished by HigherGov, Government of Canada pages, a Lockheed Martin filing and company releases, plus trade publications named in the text. No interviews or surveys were carried out, and classified inventory data were not available.
Navy budgets and Canadian deliveries set the pace to 2035
Through 2035, the North America sonobuoy market reaches USD 491.4 million at a 5.43% CAGR over 2026–2035, with growth depending on how much of the higher Navy funding reaches delivered buoys. The AN/SSQ-125B ramp and the AN/SSQ-145 receiver planned from fiscal 2029 should raise average prices across the product mix. Canada reaches full P-8A capability by 2033 under the timeline reported by High North News, so its orders should settle into a replenishment pattern. The outcome of the Lockheed Martin purchase of Ultra Maritime will decide how much competition remains.
Frequently Asked Questions
How big is the North America sonobuoy market?
How fast is the market growing?
Which country leads the region?
Which product type is the largest?
Why did the Navy budget line jump in fiscal 2025?
How does Canada affect demand?
Who are the main suppliers?
What is the biggest risk for suppliers?
Table of Content
Chapter 1 Market Segmentation
- 1.1 Segmentation Framework
- 1.1.1 Product and Service Classification
- 1.1.2 Application and End-Use Classification
- 1.1.3 Technology and Solution Classification
- 1.1.4 Customer and Distribution Channel Classification
- 1.1.5 Geographic Segmentation
- 1.1.6 Market Segment Definitions and Boundaries
- 1.2 By Product Type
- 1.2.1 Passive acoustic sonobuoys
- 1.2.2 Active acoustic sonobuoys
- 1.2.3 Special-purpose sonobuoys
- 1.3 By Application
- 1.3.1 Operational search and tracking
- 1.3.2 Reserve inventory replenishment
- 1.3.3 Aircrew training
- 1.3.4 Development and acceptance testing
- 1.4 By Deployment Platform
- 1.4.1 Fixed-wing aircraft
- 1.4.2 Rotary-wing aircraft
- 1.4.3 Unmanned aircraft
- 1.5 By Sales Channel
- 1.5.1 United States competitive delivery orders
- 1.5.2 United States sole-source production awards
- 1.5.3 Canadian defence procurement
- 1.6 By Country
- 1.6.1 United States
- 1.6.2 Canada
Chapter 2 Introduction
- 2.1 Report Objectives and Scope
- 2.2 Product Definition and Industry Terminology
- 2.3 Market Inclusions and Exclusions
- 2.4 Research Process
- 2.4.1 Primary Research and Expert Interviews
- 2.4.2 Secondary Research and Source Review
- 2.4.3 Top-Down and Bottom-Up Estimation
- 2.4.4 Data Triangulation and Verification
- 2.5 Market Size Measurement Basis
- 2.5.1 2025: USD 289.5 million → 2035: USD 491.4 million
- 2.6 Historical and Forecast Reference Periods
- 2.6.1 Historical Period: 2018-2025
- 2.6.2 Base Year: 2025
- 2.6.3 Forecast Period: 2025-2035
- 2.7 Research Assumptions and Limitations
Chapter 3 Executive Summary
- 3.1 Market Snapshot and Key Findings
- 3.2 Base-Year Market Size, 2025
- 3.3 Forecast Market Size, 2035
- 3.4 Revenue and Volume Growth Outlook
- 3.5 Key Demand and Supply Indicators
- 3.6 Leading Market Segments
- 3.7 Fastest-Growing Market Opportunities
- 3.8 Regional Performance Highlights
- 3.9 Technology and Industry Transformation
- 3.10 Competitive Landscape Summary
- 3.11 Analyst View and Strategic Implications
Chapter 4 North America Sonobuoy Market Trends and Developments
- 4.1 Historical Industry Development, 2018-2025
- 4.2 Recent Market Trends and Developments
- 4.3 Demand and Customer Behavior Trends
- 4.4 Technology and Product Innovation
- 4.5 Artificial Intelligence, Automation and Digitalization
- 4.6 Local Manufacturing and Supply Chain Realignment
- 4.7 Industry Partnerships, Mergers and Acquisitions
- 4.8 Sustainability and Circular Economy Developments
- 4.9 Government and Private Sector Investment Trends
- 4.10 Emerging Business Models and Commercialization
- 4.11 Industry Developments and Announcements
Chapter 5 North America Sonobuoy Market Production, Supply and Demand Analysis
- 5.1 Demand Trend and Consumption Analysis, 2018-2025
- 5.2 Demand Forecast, 2025-2035
- 5.3 Production and Output Trend, 2018-2025
- 5.4 Production and Output Forecast, 2025-2035
- 5.5 Installed Capacity and Capacity Utilization
- 5.6 Company-Wise Production Plants and Statistics
- 5.6.1 Installed Production Capacity
- 5.6.2 Actual Production
- 5.6.3 Planned Capacity and Expansion Targets
- 5.7 Supply Chain Structure and Procurement Trends
- 5.8 Supply-Demand Gap and Bottlenecks
- 5.9 Import Dependence and Sourcing Structure
- 5.10 Contract Manufacturing and Outsourcing
- 5.11 Regional Supply and Demand Concentration
Chapter 6 North America Sonobuoy Market Pricing Analysis
- 6.1 Pricing Structure and Measurement
- 6.2 Historical Pricing Trends, 2018-2025
- 6.3 Pricing Outlook, 2025-2035
- 6.4 Average Selling Price and Unit Economics
- 6.5 Pricing by Product and Market Segment
- 6.6 Geographic Pricing Differences
- 6.7 Key Input, Energy, Labor and Logistics Costs
- 6.8 Contract Pricing and Purchasing Models
- 6.9 Pricing Sensitivity and Competitive Positioning
- 6.10 Price, Margin and Profitability Implications
Chapter 7 North America Sonobuoy Market Dynamics
- 7.1 Market Growth Drivers
- 7.1.1 Demand-Side Drivers
- 7.1.2 Technology and Innovation Drivers
- 7.1.3 Infrastructure and Investment Drivers
- 7.1.4 Regulatory and Policy Drivers
- 7.2 Market Restraints
- 7.2.1 Cost and Affordability Constraints
- 7.2.2 Technology and Adoption Barriers
- 7.2.3 Supply Chain and Operational Constraints
- 7.3 Market Challenges
- 7.3.1 Competitive Pressure and Margin Erosion
- 7.3.2 Skills, Infrastructure and Implementation Gaps
- 7.4 Emerging Market Opportunities
- 7.5 Market Dynamics Impact and Time-Horizon Assessment
Chapter 8 North America Sonobuoy Value Chain Analysis
- 8.1 Industry Value Chain Overview
- 8.2 Upstream Suppliers and Critical Inputs
- 8.3 Technology and Component Providers
- 8.4 Manufacturing or Service Delivery
- 8.5 Distribution, Channel Partners and Integrators
- 8.6 Downstream Applications and End Users
- 8.7 Value Addition and Profit Pools
- 8.8 Vertical Integration and Outsourcing
- 8.9 Supplier Concentration and Risk
- 8.10 Supply Chain Localization and Resilience
Chapter 9 North America Sonobuoy Market Regulations and Policies
- 9.1 Relevant Laws, Standards and Compliance Frameworks
- 9.2 Product, Service, Safety and Quality Requirements
- 9.3 Government Policies, Incentives and Subsidies
- 9.4 Imports, Exports and Trade Barriers
- 9.5 Public Procurement and Local Content Requirements
- 9.6 Environmental and Sustainability Compliance
- 9.7 Upcoming Policy Changes and Market Implications
Chapter 10 North America Sonobuoy Market Hotspots and Opportunities
- 10.1 Market Opportunity Mapping and Growth Hotspots
- 10.2 High-Growth Applications and Customer Groups
- 10.3 Underserved Markets and White-Space Opportunities
- 10.4 Emerging Technology and Product Opportunities
- 10.5 New Capacity and Investment Hotspots
- 10.6 Market Entry and Expansion Opportunities
- 10.7 Distribution and Partnership Opportunities
- 10.8 Near-Term and Long-Term Commercial Potential
- 10.9 Opportunity Attractiveness and Execution Risks
Chapter 11 North America Sonobuoy Market Outlook, 2025-2035
- 11.1 Market Size and Analysis
- 11.1.1 Revenue (Market Measurement: 2025: USD 289.5 million → 2035: USD 491.4 million)
- 11.1.2 Market Volume and Quantity Sold
- 11.1.3 Historical Market Size, 2018-2025
- 11.1.4 Base-Year Market Size, 2025
- 11.2 Market Forecast, 2025-2035
- 11.2.1 Revenue Forecast to 2035
- 11.2.2 Volume Forecast to 2035
- 11.2.3 CAGR and Year-on-Year Growth
- 11.2.4 Incremental Revenue Opportunity
- 11.3 Forecast Assumptions and Scenario Analysis
- 11.3.1 Base-Case Forecast
- 11.3.2 Optimistic and Conservative Scenarios
- 11.3.3 Technology, Pricing and Policy Sensitivities
- 11.4 Market Attractiveness and Growth Outlook
Chapter 12 North America Sonobuoy Market Segmentation and Outlook
- 12.1 Segmentation Summary and Market Shares, 2025
- 12.2 Largest and Fastest-Growing Segments
- 12.3 By Product Type - Market Size and Forecast, 2025-2035
- 12.3.1 Segment Definition and Scope
- 12.3.2 Historical Market Size, 2018-2025
- 12.3.3 Revenue Forecast, 2025-2035
- 12.3.4 Volume Forecast, 2025-2035
- 12.3.5 Base-Year Market Share, 2025
- 12.3.6 Segment CAGR and Growth Drivers
- 12.3.7 Subsegment Market Size and Forecast
- 12.3.7.1 Passive acoustic sonobuoys
- 12.3.7.2 Active acoustic sonobuoys
- 12.3.7.3 Special-purpose sonobuoys
- 12.3.8 Subsegment Pricing and Adoption Trends
- 12.3.9 Leading Suppliers and Competition
- 12.3.10 Regional Demand and Opportunities
- 12.4 By Application - Market Size and Forecast, 2025-2035
- 12.4.1 Segment Definition and Scope
- 12.4.2 Historical Market Size, 2018-2025
- 12.4.3 Revenue Forecast, 2025-2035
- 12.4.4 Volume Forecast, 2025-2035
- 12.4.5 Base-Year Market Share, 2025
- 12.4.6 Segment CAGR and Growth Drivers
- 12.4.7 Subsegment Market Size and Forecast
- 12.4.7.1 Operational search and tracking
- 12.4.7.2 Reserve inventory replenishment
- 12.4.7.3 Aircrew training
- 12.4.7.4 Development and acceptance testing
- 12.4.8 Subsegment Pricing and Adoption Trends
- 12.4.9 Leading Suppliers and Competition
- 12.4.10 Regional Demand and Opportunities
- 12.5 By Deployment Platform - Market Size and Forecast, 2025-2035
- 12.5.1 Segment Definition and Scope
- 12.5.2 Historical Market Size, 2018-2025
- 12.5.3 Revenue Forecast, 2025-2035
- 12.5.4 Volume Forecast, 2025-2035
- 12.5.5 Base-Year Market Share, 2025
- 12.5.6 Segment CAGR and Growth Drivers
- 12.5.7 Subsegment Market Size and Forecast
- 12.5.7.1 Fixed-wing aircraft
- 12.5.7.2 Rotary-wing aircraft
- 12.5.7.3 Unmanned aircraft
- 12.5.8 Subsegment Pricing and Adoption Trends
- 12.5.9 Leading Suppliers and Competition
- 12.5.10 Regional Demand and Opportunities
- 12.6 By Sales Channel - Market Size and Forecast, 2025-2035
- 12.6.1 Segment Definition and Scope
- 12.6.2 Historical Market Size, 2018-2025
- 12.6.3 Revenue Forecast, 2025-2035
- 12.6.4 Volume Forecast, 2025-2035
- 12.6.5 Base-Year Market Share, 2025
- 12.6.6 Segment CAGR and Growth Drivers
- 12.6.7 Subsegment Market Size and Forecast
- 12.6.7.1 United States competitive delivery orders
- 12.6.7.2 United States sole-source production awards
- 12.6.7.3 Canadian defence procurement
- 12.6.8 Subsegment Pricing and Adoption Trends
- 12.6.9 Leading Suppliers and Competition
- 12.6.10 Regional Demand and Opportunities
- 12.7 By Country - Market Size and Forecast, 2025-2035
- 12.7.1 Segment Definition and Scope
- 12.7.2 Historical Market Size, 2018-2025
- 12.7.3 Revenue Forecast, 2025-2035
- 12.7.4 Volume Forecast, 2025-2035
- 12.7.5 Base-Year Market Share, 2025
- 12.7.6 Segment CAGR and Growth Drivers
- 12.7.7 Subsegment Market Size and Forecast
- 12.7.7.1 United States
- 12.7.7.2 Canada
- 12.7.8 Subsegment Pricing and Adoption Trends
- 12.7.9 Leading Suppliers and Competition
- 12.7.10 Regional Demand and Opportunities
- 12.8 Segment Growth Comparison
- 12.9 Segment Attractiveness and Priority Matrix
Chapter 13 North America Sonobuoy End-Use and Application Market Outlook
- 13.1 End-Use Industry and Customer Demand Structure
- 13.2 Leading Applications and Customer Groups
- 13.3 End-Use Market Size, Share and Forecast
- 13.4 Major End-Use Industry Deep Dives
- 13.4.1 Customer Requirements and Use Cases
- 13.4.2 Demand and Replacement Cycles
- 13.4.3 Technical and Regulatory Considerations
- 13.4.4 Purchasing and Procurement Models
- 13.4.5 Leading Vendors and Distribution Channels
- 13.4.6 Forecast and Commercial Opportunities
- 13.5 Emerging Applications and Cross-Segment Demand
- 13.6 End-Use Industry Investment Priorities
Chapter 14 North America Sonobuoy Geographic Market Outlook, 2025-2035
- 14.1 Regional Market Size and Country-Level Shares, 2025
- 14.2 Country Market Size Comparison, 2025
- 14.3 Country Market Forecasts, 2025-2035
- 14.4 Subregional Industrial and Demand Clusters
- 14.5 Intra-Regional Pricing and Cost Differences
- 14.6 Cross-Border Trade and Supply Networks
- 14.7 Regional Supply and Demand Balances
- 14.8 Country Opportunity Comparison and Prioritization
Note: Every listed country is covered on the structure shown under the first country.
Chapter 15 North America Sonobuoy Technology, Innovation and Sustainability Outlook
- 15.1 Technology Landscape and Maturity
- 15.2 Product, Process and Service Innovation
- 15.3 AI, Automation and Digital Tools in the Industry
- 15.4 Technology Adoption and Performance Benchmarking
- 15.5 Innovation Pipeline and R&D Investment
- 15.6 Patent and Intellectual Property Trends
- 15.7 Energy Efficiency and Resource Management
- 15.8 Sustainability, Recycling and Circularity
- 15.9 Technology Roadmap, 2025-2035
- 15.10 Risks of Obsolescence and Technology Substitution
Chapter 16 North America Sonobuoy Market Key Strategic Imperatives
- 16.1 Growth and Market Entry Priorities
- 16.2 High-Return Products and Segments
- 16.3 Pricing, Profitability and Cost Optimization
- 16.4 Technology Investment and Product Differentiation
- 16.5 Supply Chain Localization and Resilience
- 16.6 Distribution and Customer Acquisition
- 16.7 Partnership, Acquisition and Capacity Strategy
- 16.8 Regional Expansion Priorities
- 16.9 Short-, Medium- and Long-Term Actions
Chapter 17 Competition Outlook
- 17.1 Industry Competition Characteristics
- 17.2 Market Structure and Concentration
- 17.3 Market Share and Competitive Positioning, 2025
- 17.4 Company-Wise Revenue and Product Benchmarking
- 17.5 Production and Service Capacity Benchmarking
- 17.6 Technology, Pricing and Differentiation
- 17.7 Regional Footprint and Distribution Strength
- 17.8 Mergers, Acquisitions and Strategic Alliances
- 17.9 New Entrants and Competitive Threats
- 17.10 Porter's Five Forces and Industry Attractiveness
- 17.11 Competitive Outlook, 2025-2035
Chapter 18 Company Profiles
- 18.1 Company Coverage and Selection Criteria
- 18.2 Ultra Maritime
- 18.2.1 Business Description
- 18.2.2 Company Ownership and Geographic Presence
- 18.2.3 Product and Service Portfolio
- 18.2.4 Manufacturing and Operating Footprint
- 18.2.5 Production Capacity and Expansion Plans
- 18.2.6 Financial Performance and Investment
- 18.2.7 Market Share and Competitive Position
- 18.2.8 Technology and Innovation Capabilities
- 18.2.9 Strategic Alliances or Partnerships
- 18.2.10 Recent Developments
- 18.2.11 Growth Strategy and Outlook
- 18.3 Sparton DeLeon Springs, LLC
- 18.4 Lockheed Martin Corporation, Rotary and Mission Systems
- 18.5 General Atomics Aeronautical Systems
- 18.6 Boeing
- 18.7 Other Relevant Market Participants
Note: Every listed company is profiled on the structure shown under the first company. The company list is preliminary and may change based on research findings, market developments, data availability and client requirements.
Chapter 19 Disclaimer
- 19.1 Research and Forecast Disclaimer
- 19.2 Data Source and Estimation Limitations
Note: The depth of individual sections depends on data availability for this market. Volume, capacity, trade and other unit-based metrics are included where applicable.

