
Police hiring and armor renewal shape officer safety buying
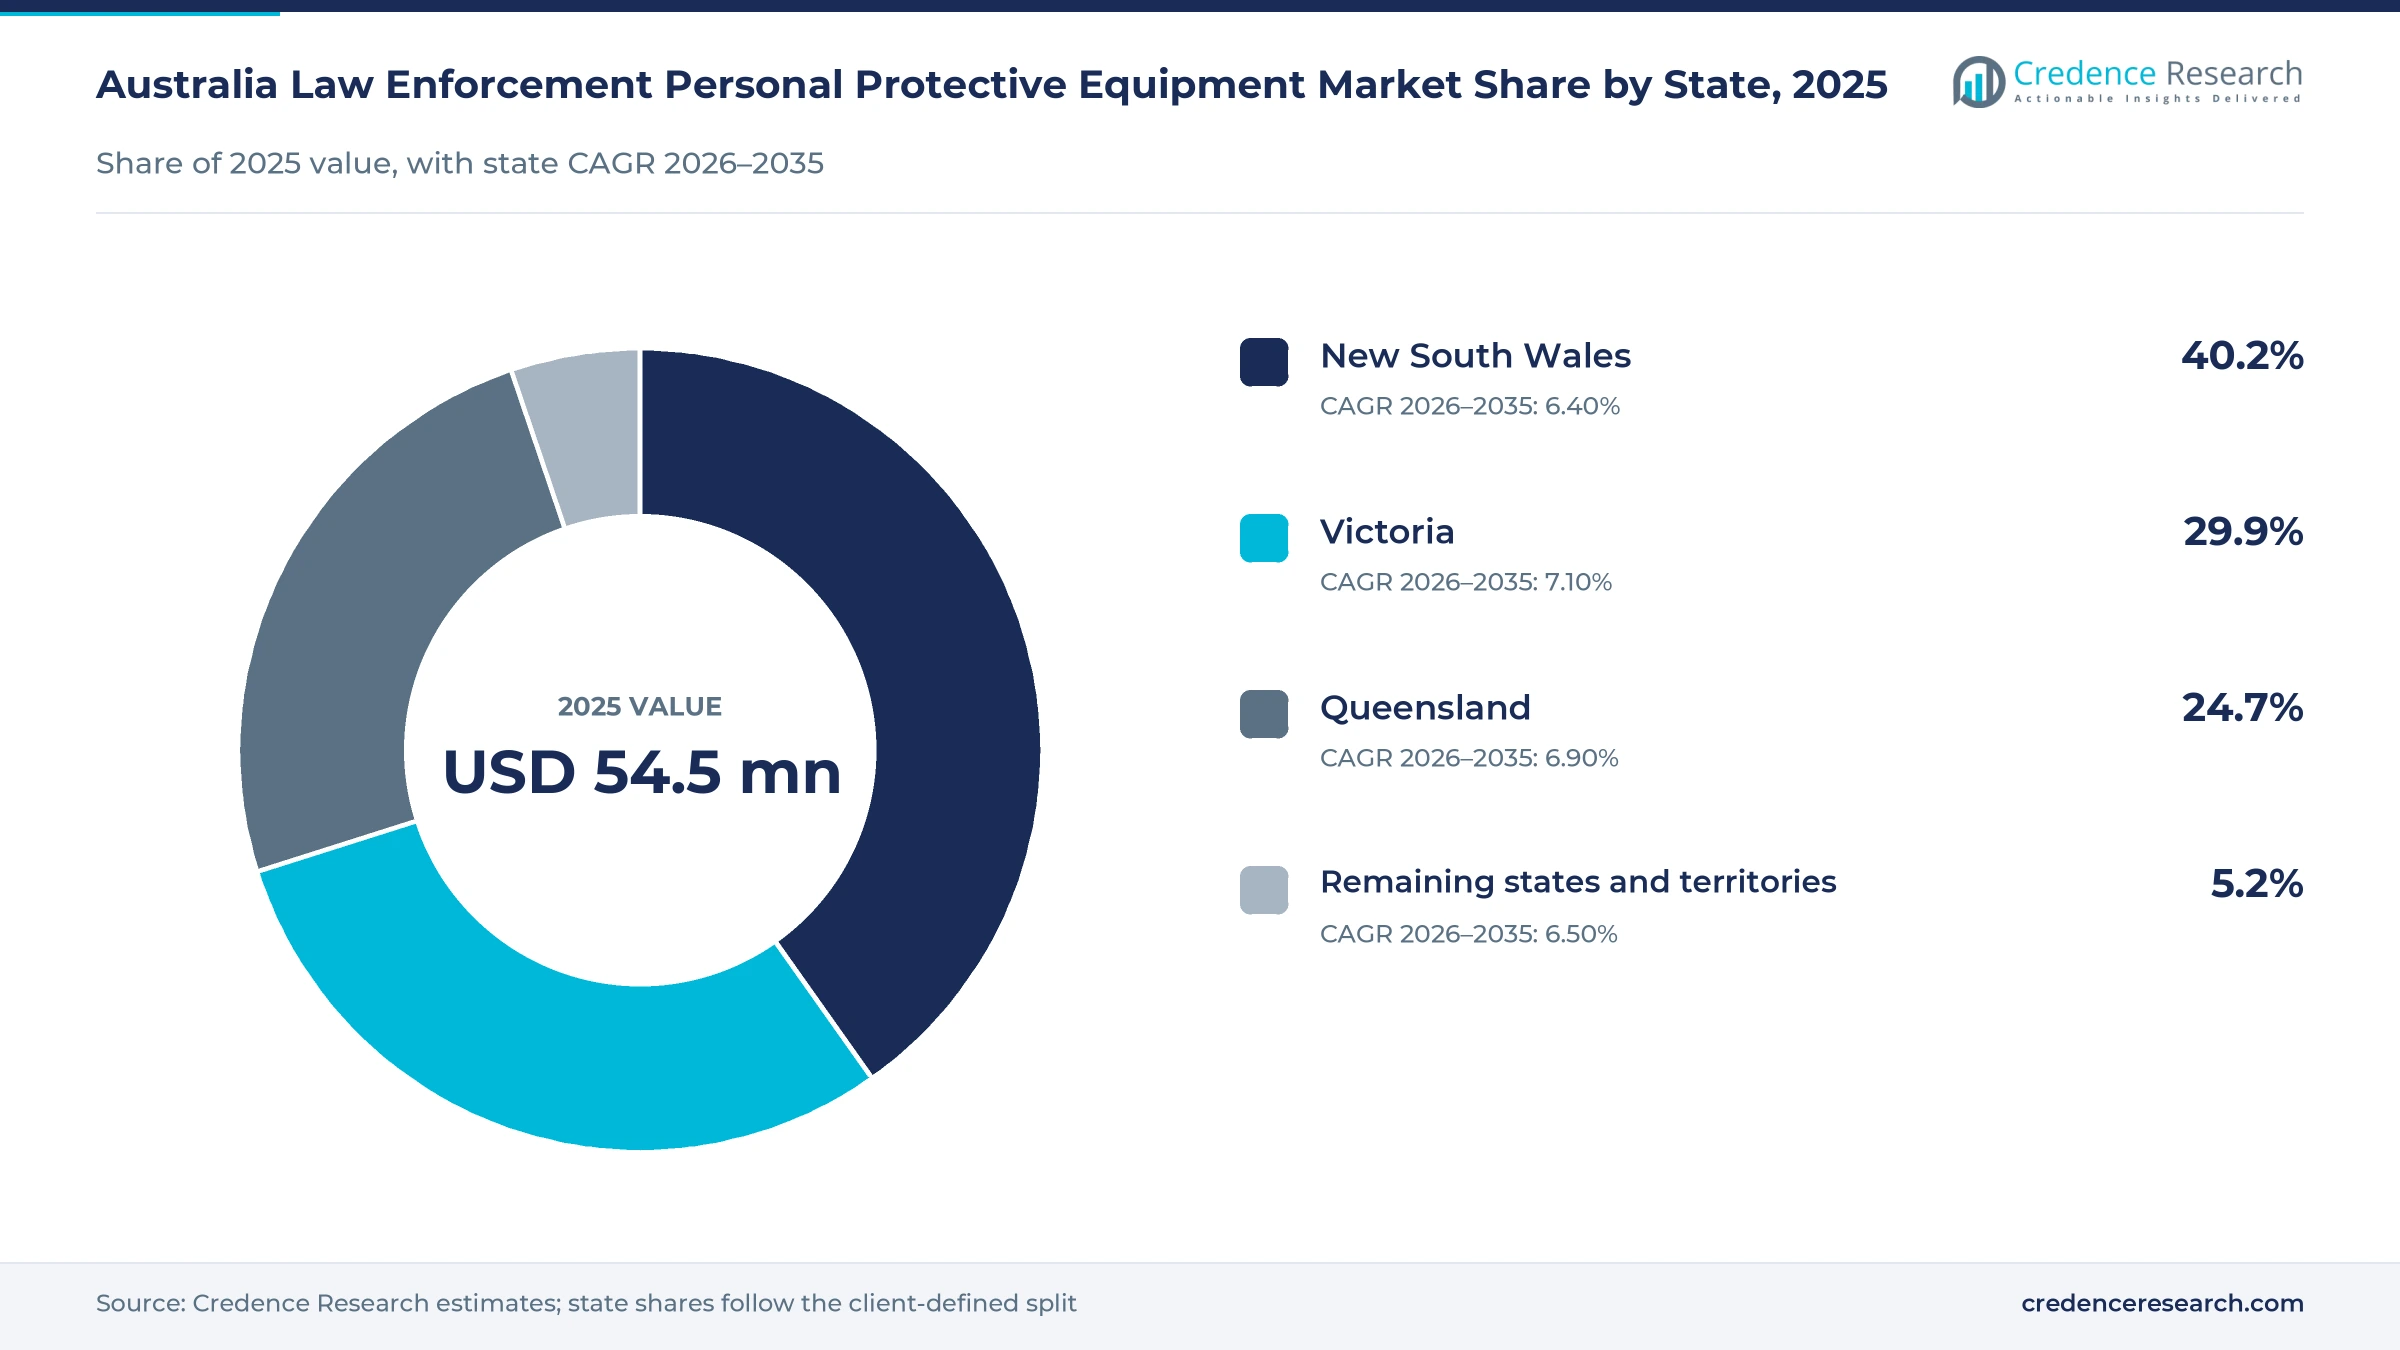
The Australia law enforcement personal protective equipment market was valued at USD 54.5 million in 2025 and is projected to increase from USD 64.0 million in 2026 to USD 115.1 million by 2035, registering a CAGR of 6.74% during 2026–2035. Demand comes from state and territory police forces, federal agencies and corrective services that issue vests, duty belts, helmets and respirators to every new officer and replace them on fixed cycles. New South Wales held the largest state share, 40.2% in 2025, because it runs the largest police force and is rolling out new ballistic carriers statewide. Victoria is the fastest-growing state at 7.10% a year, as the force doubled its recruit intake in April 2026. In turn, Queensland funded replacement load-bearing vests with ballistic plates in its 2025-26 budget, which shows how armor renewal now sits inside wider frontline equipment programs.
Which officer protection products does the estimate cover?
The estimate measures the value of personal protective equipment bought for law enforcement staff in Australia, including ballistic and stab vests, protective clothing and duty systems, helmets and public-order kit, and respiratory and CBRN protection. It counts purchases by police, federal agencies, corrective services and hospital security teams.
The estimate excludes weapons, conducted energy devices, body-worn cameras, radios, vehicles and general uniforms without protective function. The value chain runs from fiber and plate makers through domestic manufacturers, overseas suppliers and specialist distributors to agency stores and frontline staff.
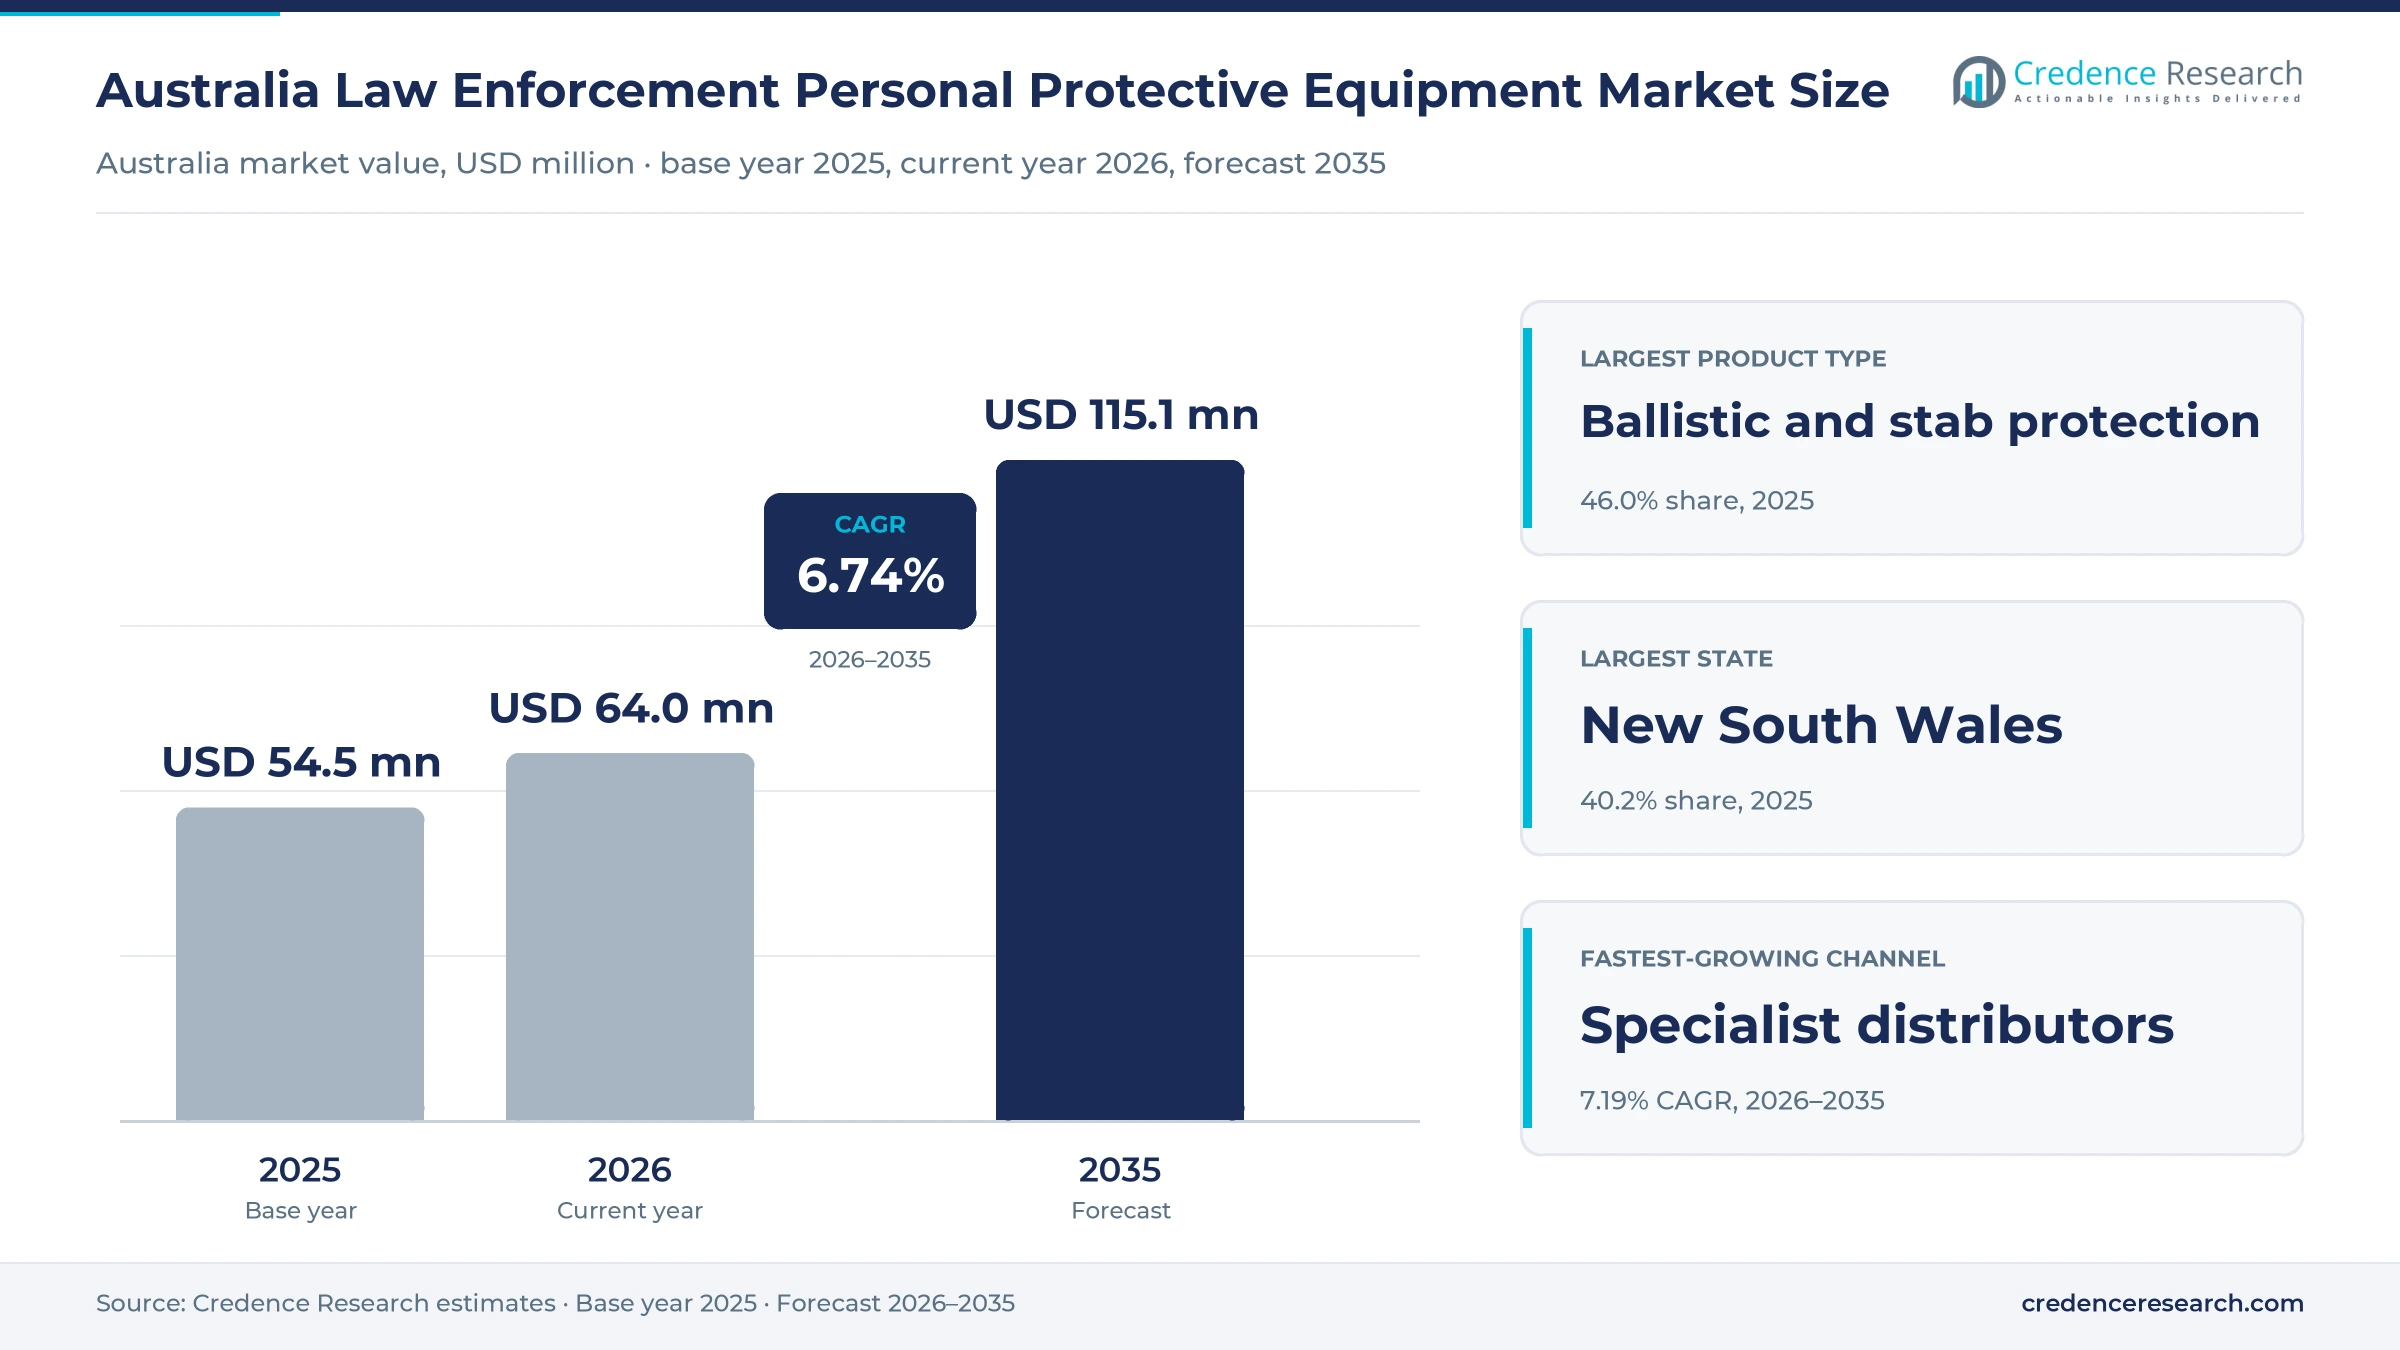
Australia Law Enforcement Personal Protective Equipment Market Insights
- The Australia law enforcement personal protective equipment market was valued at USD 54.5 million in 2025 and is projected to reach USD 115.1 million by 2035, registering a CAGR of 6.74% during 2026–2035.
- New South Wales held a 40.2% share of 2025 value, because it has the largest police force and recruit pipeline in the country.
- Ballistic and stab protection led with a 46.0% share of 2025 value, because every frontline officer receives a vest that is replaced on a set cycle.
- Australian police employed 82,448 full-time equivalent staff in 2024-25, and 87.8% of them were operational, according to the Productivity Commission in June 2026.
- Domestic manufacturer contracts hold the largest channel share, while specialist distributor contracts grow fastest at 7.19% a year during 2026–2035.
Ballistic and stab protection leads while CBRN grows fastest
Why do vests lead product value?
Based on product type, the market is categorized into ballistic and stab protection, protective clothing and duty systems, head protection and public-order equipment, and respiratory and CBRN protection. Ballistic and stab protection led with a 46.0% share of 2025 value, because every frontline officer wears a vest. Respiratory and CBRN protection grows fastest at 7.46% a year, as agencies prepare specialist teams for chemical and biological incidents.
How do patrol and specialist work split demand?
Based on application, the market is categorized into routine patrol, custodial and facility security, public-order response and specialist operations. Routine patrol led with a 58.0% share of 2025 value, because general duties officers make up most operational staff. Specialist operations grow fastest at 7.31% a year, as tactical teams adopt hard armor plates and modular carriers.
Why do state police dominate purchases?
Based on end user, the market is categorized into state and territory police, federal enforcement agencies, corrective services and government hospital security. State and territory police accounted for 80.0% of 2025 value, because states run most frontline policing in Australia. Corrective services grow fastest at 7.34% a year, as custodial agencies extend stab protection to more staff.
How do agencies buy protective kit?
Based on sales channel, the market is categorized into domestic manufacturer contracts, international direct procurement, specialist distributor contracts and agency-authorised replenishment. Domestic manufacturer contracts led with a 44.0% share of 2025 value, because agencies favor local makers that tailor vests to each force. Specialist distributor contracts grow fastest at 7.19% a year, as distributors add imported armor brands.
| Segment Group | Leading Sub-segment | Share, 2025 | Fastest-growing Sub-segment | CAGR, 2026–2035 |
|---|---|---|---|---|
| By Product Type | Ballistic and stab protection | 46.0% | Respiratory and CBRN protection | 7.46% |
| By Application | Routine patrol | 58.0% | Specialist operations | 7.31% |
| By End User | State and territory police | 80.0% | Corrective services | 7.34% |
| By Sales Channel | Domestic manufacturer contracts | 44.0% | Specialist distributor contracts | 7.19% |
Request a Free Sample
Fill in your details and we'll send you a free sample report.
- Sample data tables & charts
- Research methodology
Recruitment, threat ratings and steady renewal lift demand
How does police recruitment lift equipment provisioning?
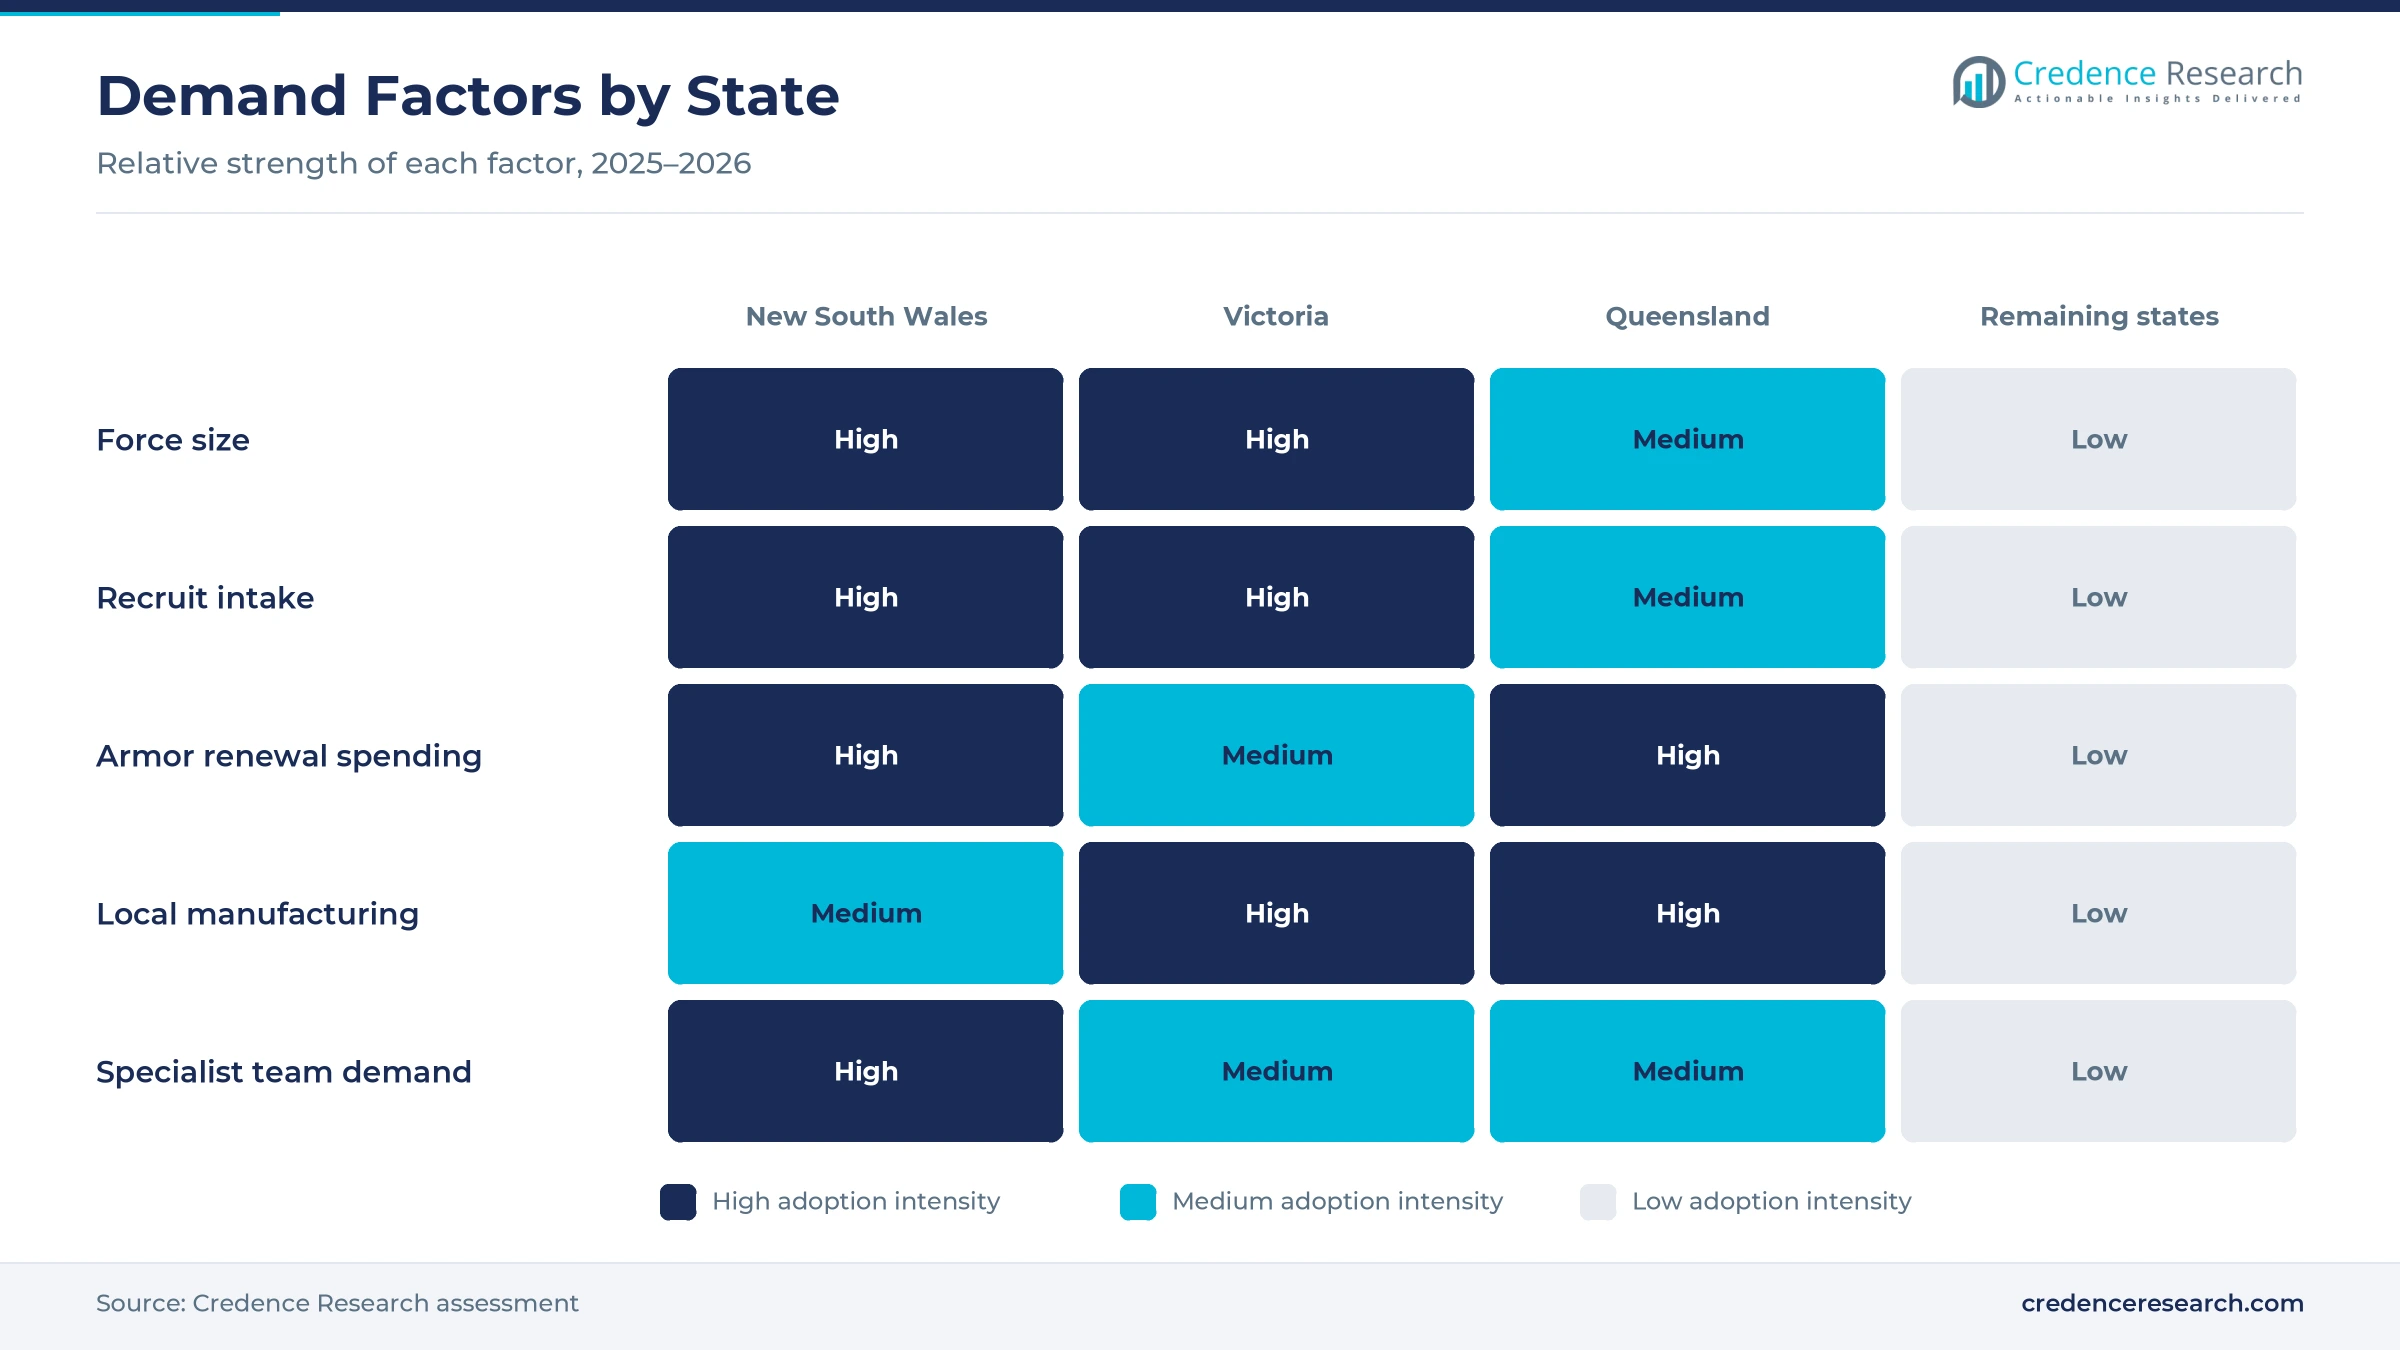
Recruitment-linked equipment provisioning lifts demand, because each new officer needs a fitted vest, duty belt and protective clothing before starting general duties. The NSW Police Force attested 341 recruits on Dec. 12, 2025, its largest class in 13 years, and added 1,255 recruits since November 2024, according to the NSW Government. A scheme that pays recruits to train lifted applications by 70%. Victoria Police doubled its intake to 1,300 recruits a year from April 20, 2026, while working to fill more than 1,500 vacancies. As a result, routine patrol holds 58.0% of 2025 value, and Victoria posts the fastest state growth in the country.
Why does threat-specific armor qualification matter?
Threat-specific armor qualification matters, because agencies now buy vests and plates rated for named threats such as knives, handgun rounds and rifle fire. Craig International Ballistics won a contract worth A$30 million in May 2024 to supply Australian Defence Force armor that protects against fragmentation and low- and high-velocity rounds. The Queensland Government said in August 2026 it would fund a second hard armor plate tool at the company's Gold Coast plant, which also supplies law enforcement agencies. The new tool will lift output of lighter polyethylene plates by late 2027 and create 47 jobs. In turn, specialist operations grow at 7.31% a year, as tactical teams adopt ballistic materials rated for higher threats.
How does recurring public protection procurement sustain demand?
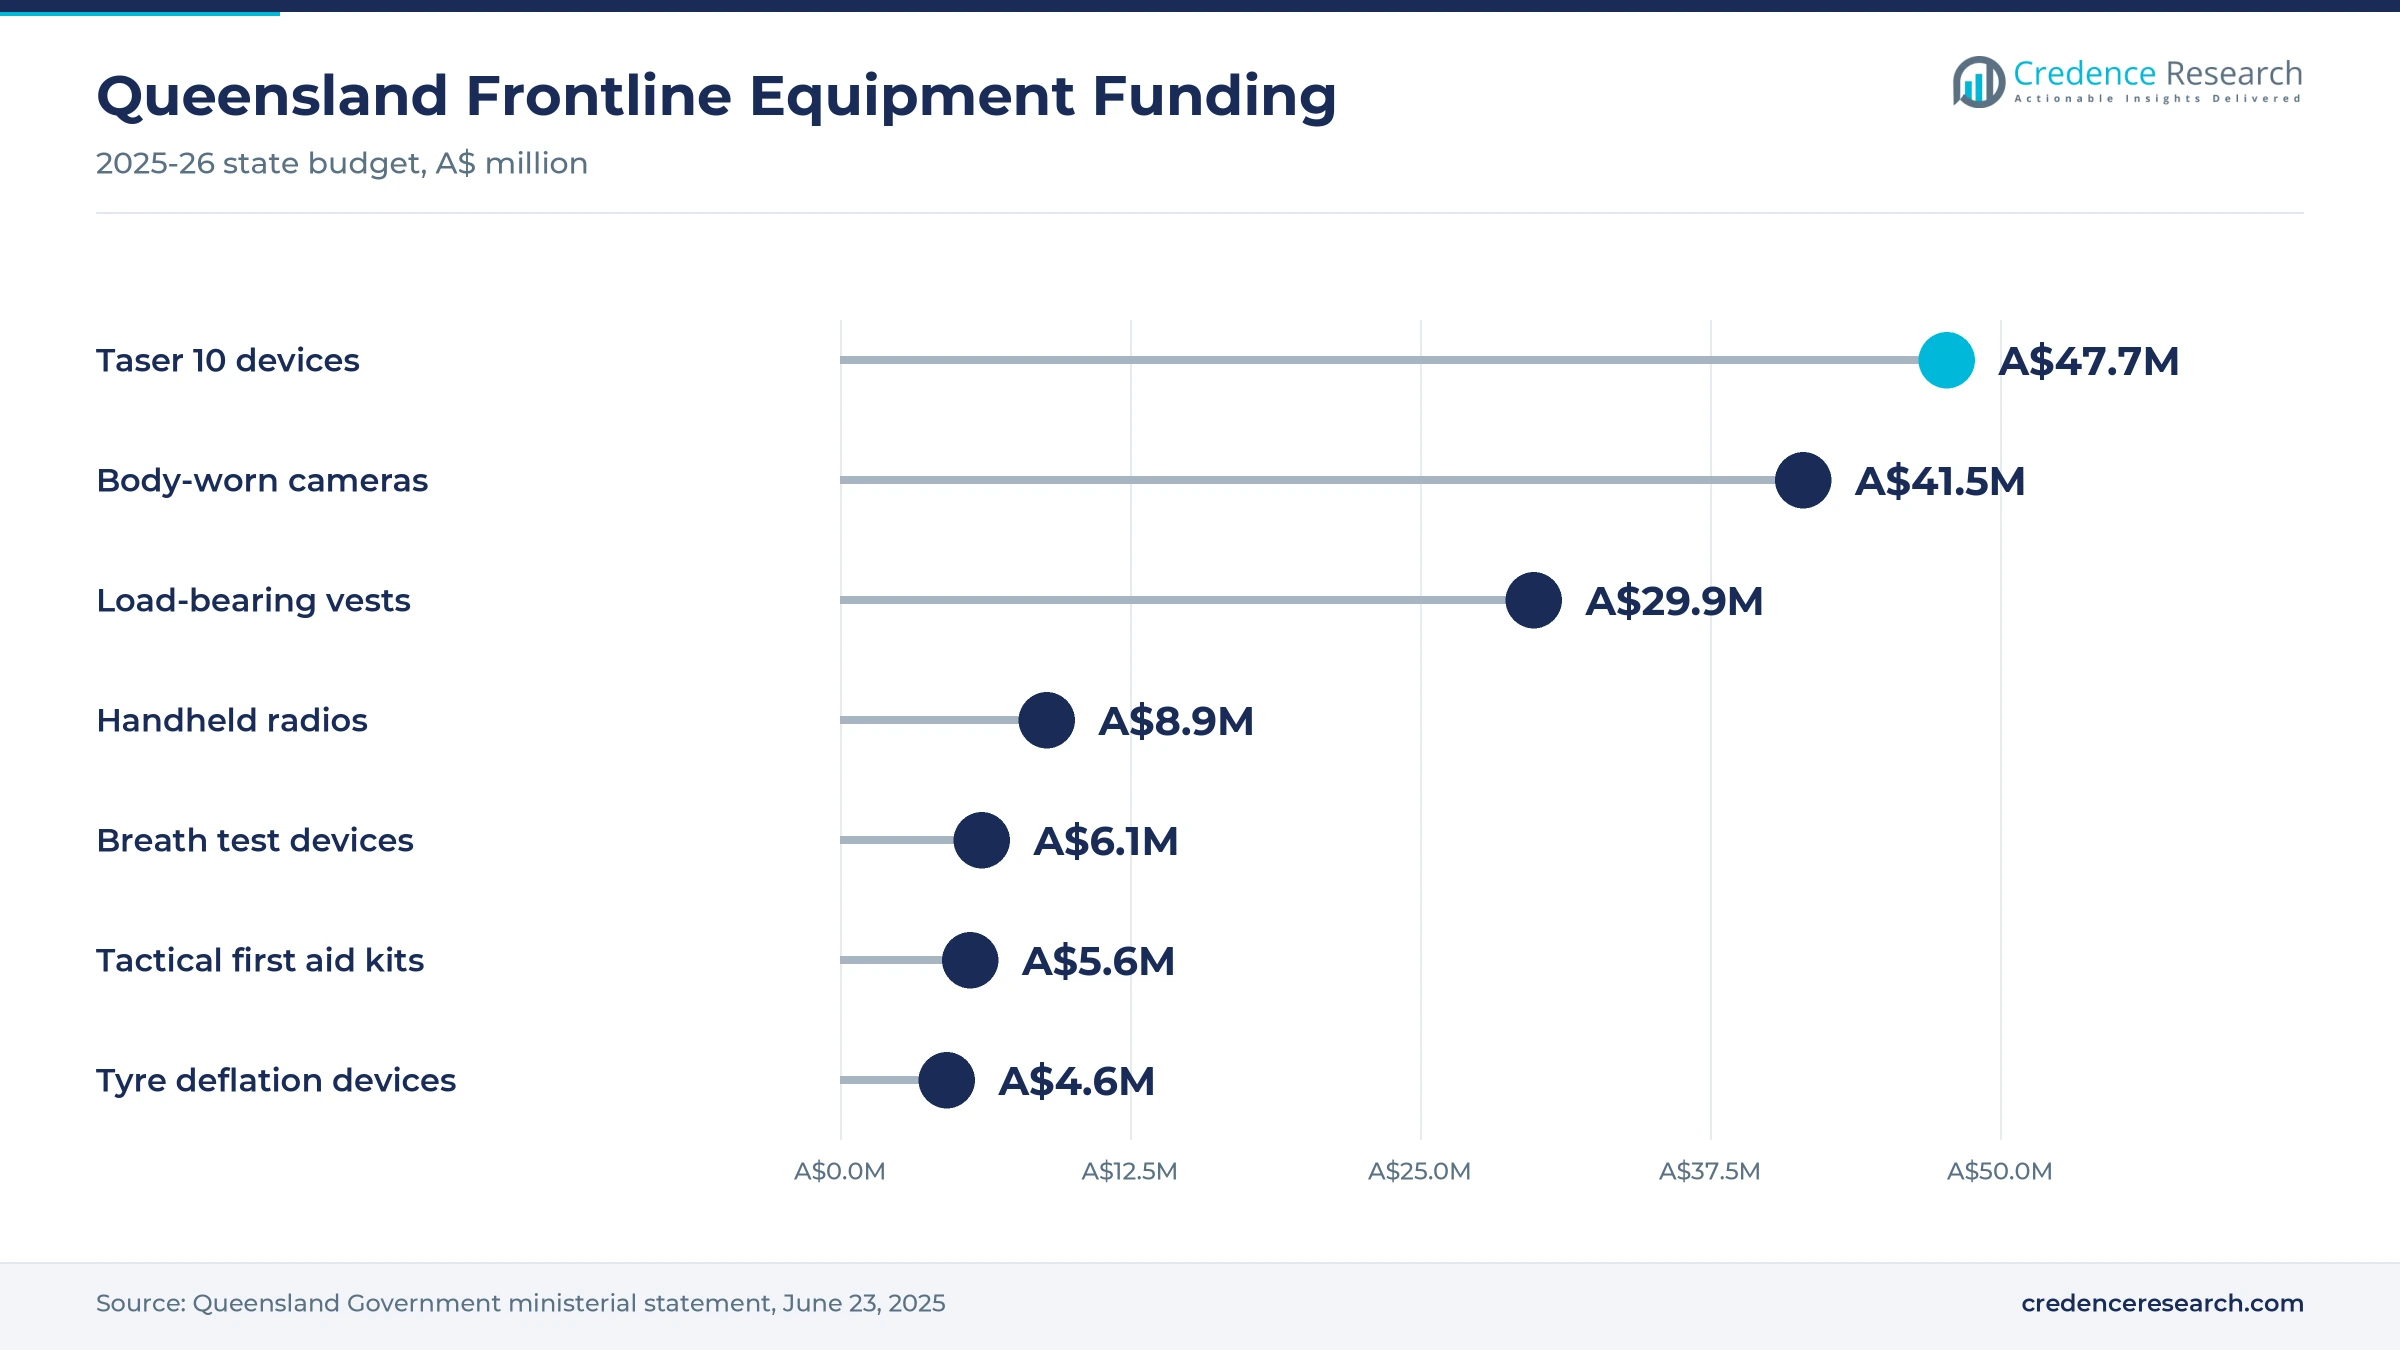
Recurring procurement across public protection functions sustains demand, because agencies replace vests, carriers and duty kit on fixed cycles and fund them through annual budgets. Queensland set aside A$147.9 million in its 2025-26 budget to equip frontline police, including A$29.9 million to replace integrated load-bearing vests with ballistic plates, according to the Queensland Government. The same package included A$5.6 million for tactical first aid kits. Australian police spending reached A$17.9 billion in 2024-25, according to the Productivity Commission. As a result, state and territory police hold 80.0% of 2025 value, as renewal spending repeats each budget cycle, and 87.8% of police staff were operational.
Why does population growth expand frontline numbers?
Population growth expands frontline numbers, because states set police staffing in line with the number of residents they serve. Australia had about 27.6 million residents in 2025, up from 27.2 million in 2024, according to the World Bank. Australian police employed 82,448 full-time equivalent staff in 2024-25, with 264 operational staff for every 100,000 people. The Northern Territory had the highest rate at 767 operational staff per 100,000 people, which shows how remote policing needs more officers. In turn, larger forces need more vests, helmets and police batons, and Queensland grows at 6.90% a year.
Modular carriers, hard plates and local supply gain ground
How is the shift to modular ballistic carriers changing kit?
The shift to modular ballistic carriers is changing kit, because officers want vests that hold radios, cameras and first aid gear without extra belts. Australian Defence Apparel began a statewide rollout of its ENFORCR H.A.L.O. X ballistic carrier across the NSW Police Force in February 2026. The carrier uses climate-regulating materials and laser-cut attachment panels that officers configure for each role. Queensland is also replacing integrated load-bearing vests that include ballistic plates under its 2025-26 budget. As a result, ballistic and stab protection holds 46.0% of 2025 value, and carriers that combine body armor with load carriage replace separate duty belts.
Why is the rise of lighter hard armor plates notable?
The rise of lighter hard armor plates is notable, because officers on long shifts carry heavy loads that cause fatigue and injury. Craig International Ballistics makes hard plates from ultra-high-molecular-weight polyethylene, which produces lighter body armor than ceramic or steel designs. The Queensland Government committed more than A$500,000 in August 2026 to expand that plate production on the Gold Coast. The company has made armor for more than 25 years and supplies both soldiers and police officers, and the state announced the expansion in August 2026. In turn, domestic manufacturer contracts hold 44.0% of 2025 value, because local plate makers can tailor weight and coverage to each force.
Can distributor partnerships open new supply?
Distributor partnerships can open new supply, because smaller agencies and corrective services often buy through specialist suppliers rather than long tenders. TacSource Group, founded in 2015 and based in Brisbane, agreed on May 8, 2025, to offer EnGarde ballistic vests, plate carriers and armor systems in Australia and New Zealand. TacSource serves military, law enforcement, corrections, fire and rescue and paramedic customers through a store and an online platform. Hellweg, based in Victoria, has also supplied integrated protection vests to Tasmania Police, a program worth A$1.8 million announced in April 2015. Victoria Police also runs more than 15,000 locally made equipment belt systems. As a result, specialist distributor contracts grow fastest at 7.19% a year, as agencies widen the range of brands they can buy.
Is there room to grow in public-order and CBRN kit?
Public-order and CBRN kit offers room to grow, because agencies prepare specialist teams for crowd events, chemical incidents and counter-terrorism work. Respiratory and CBRN protection grows fastest of all product types at 7.46% a year from a small base. Queensland also funded A$47.7 million for 6,546 Taser 10 devices in 2025-26, which shows that states are refreshing several layers of officer kit at once. Victoria Police introduced a 25-week academy program in July 2025 to move recruits to the frontline faster, and the force launched its doubled intake in April 2026. In turn, suppliers that pair respirators and helmets with riot control gear training can win specialist contracts.
Budget cycles, weight and testing slow buying decisions
How do budget cycles delay purchases?
Budget cycles delay purchases, because agencies must wait for annual state budgets before they replace large batches of vests or carriers. As a result, suppliers face long gaps between orders and then sudden large contracts. Suppliers respond with multi-year supply agreements and spare stock programs, which smooth production and help agencies spread renewal costs. In turn, forces can replace kit on schedule even when budgets tighten.
Why does armor weight limit adoption?
Armor weight limits adoption, because officers who wear vests and duty kit for long shifts report fatigue and back strain. In turn, agencies hesitate to add hard plates or extra protection to general duties kit. Suppliers respond with lighter polyethylene plates, better load distribution and climate-regulating fabrics, which reduce strain and help forces raise protection levels without slowing officers on foot patrol or in vehicles.
How do testing and certification slow new products?
Testing and certification slow new products, because every vest and plate must pass ballistic and stab tests before an agency issues it. As a result, new designs can take years to move from trials to statewide rollout. Suppliers respond with early trials alongside frontline officers and wider testing programs, which shorten approval and give agencies confidence that each design meets its threat rating and fit needs.
Why does fit across diverse officers raise costs?
Fit across diverse officers raises costs, because forces now recruit men and women of many body sizes who each need well-fitted armor. In turn, suppliers must hold more sizes and make more custom panels for each contract. Suppliers respond with modular carriers, adjustable panels and on-site fitting services, which improve comfort and coverage and reduce the number of returns and refits after each issue.
New South Wales leads as Victoria grows fastest
| State | Value, 2025 (USD million) | Share, 2025 | CAGR, 2026–2035 |
|---|---|---|---|
| New South Wales | 21.9 | 40.2% | 6.40% |
| Victoria | 16.3 | 29.9% | 7.10% |
| Queensland | 13.5 | 24.7% | 6.90% |
| Remaining states and territories | 2.8 | 5.2% | 6.50% |
Why does New South Wales hold the top share?
New South Wales held a 40.2% share of 2025 value and grows at 6.40% a year, because it runs the largest police force in the country. The force attested 341 recruits in December 2025, its third record class that year, and passed 1,000 attesting students in 2025. NSW Police also began a statewide rollout of new ballistic carriers in February 2026. As a result, the state leads vest, carrier and duty kit purchases.
Why is Victoria the fastest-growing state?
Victoria held a 29.9% share of 2025 value and grows fastest at 7.10% a year, because Victoria Police doubled its recruit intake to 1,300 a year from April 2026. More than 8,700 people applied to join the force in 2025, the highest number in at least five years. The force is also filling more than 1,500 vacancies statewide. In turn, each new squad adds vests, belts and protective clothing to annual purchases.
How does Queensland support demand?
Queensland held a 24.7% share of 2025 value and grows at 6.90% a year, because the state set aside A$147.9 million in 2025-26 to equip frontline police. That package included A$29.9 million for replacement load-bearing vests with ballistic plates and A$5.6 million for tactical first aid kits. The Gold Coast also hosts hard armor plate production that supplies the Australian Defence Force and police forces. As a result, Queensland combines strong agency demand with local manufacturing capacity.
What shapes demand in the remaining states and territories?
The remaining states and territories held a 5.2% share of 2025 value and grow at 6.50% a year, because their forces are smaller. However, the Northern Territory has the highest operational police rate in the country.
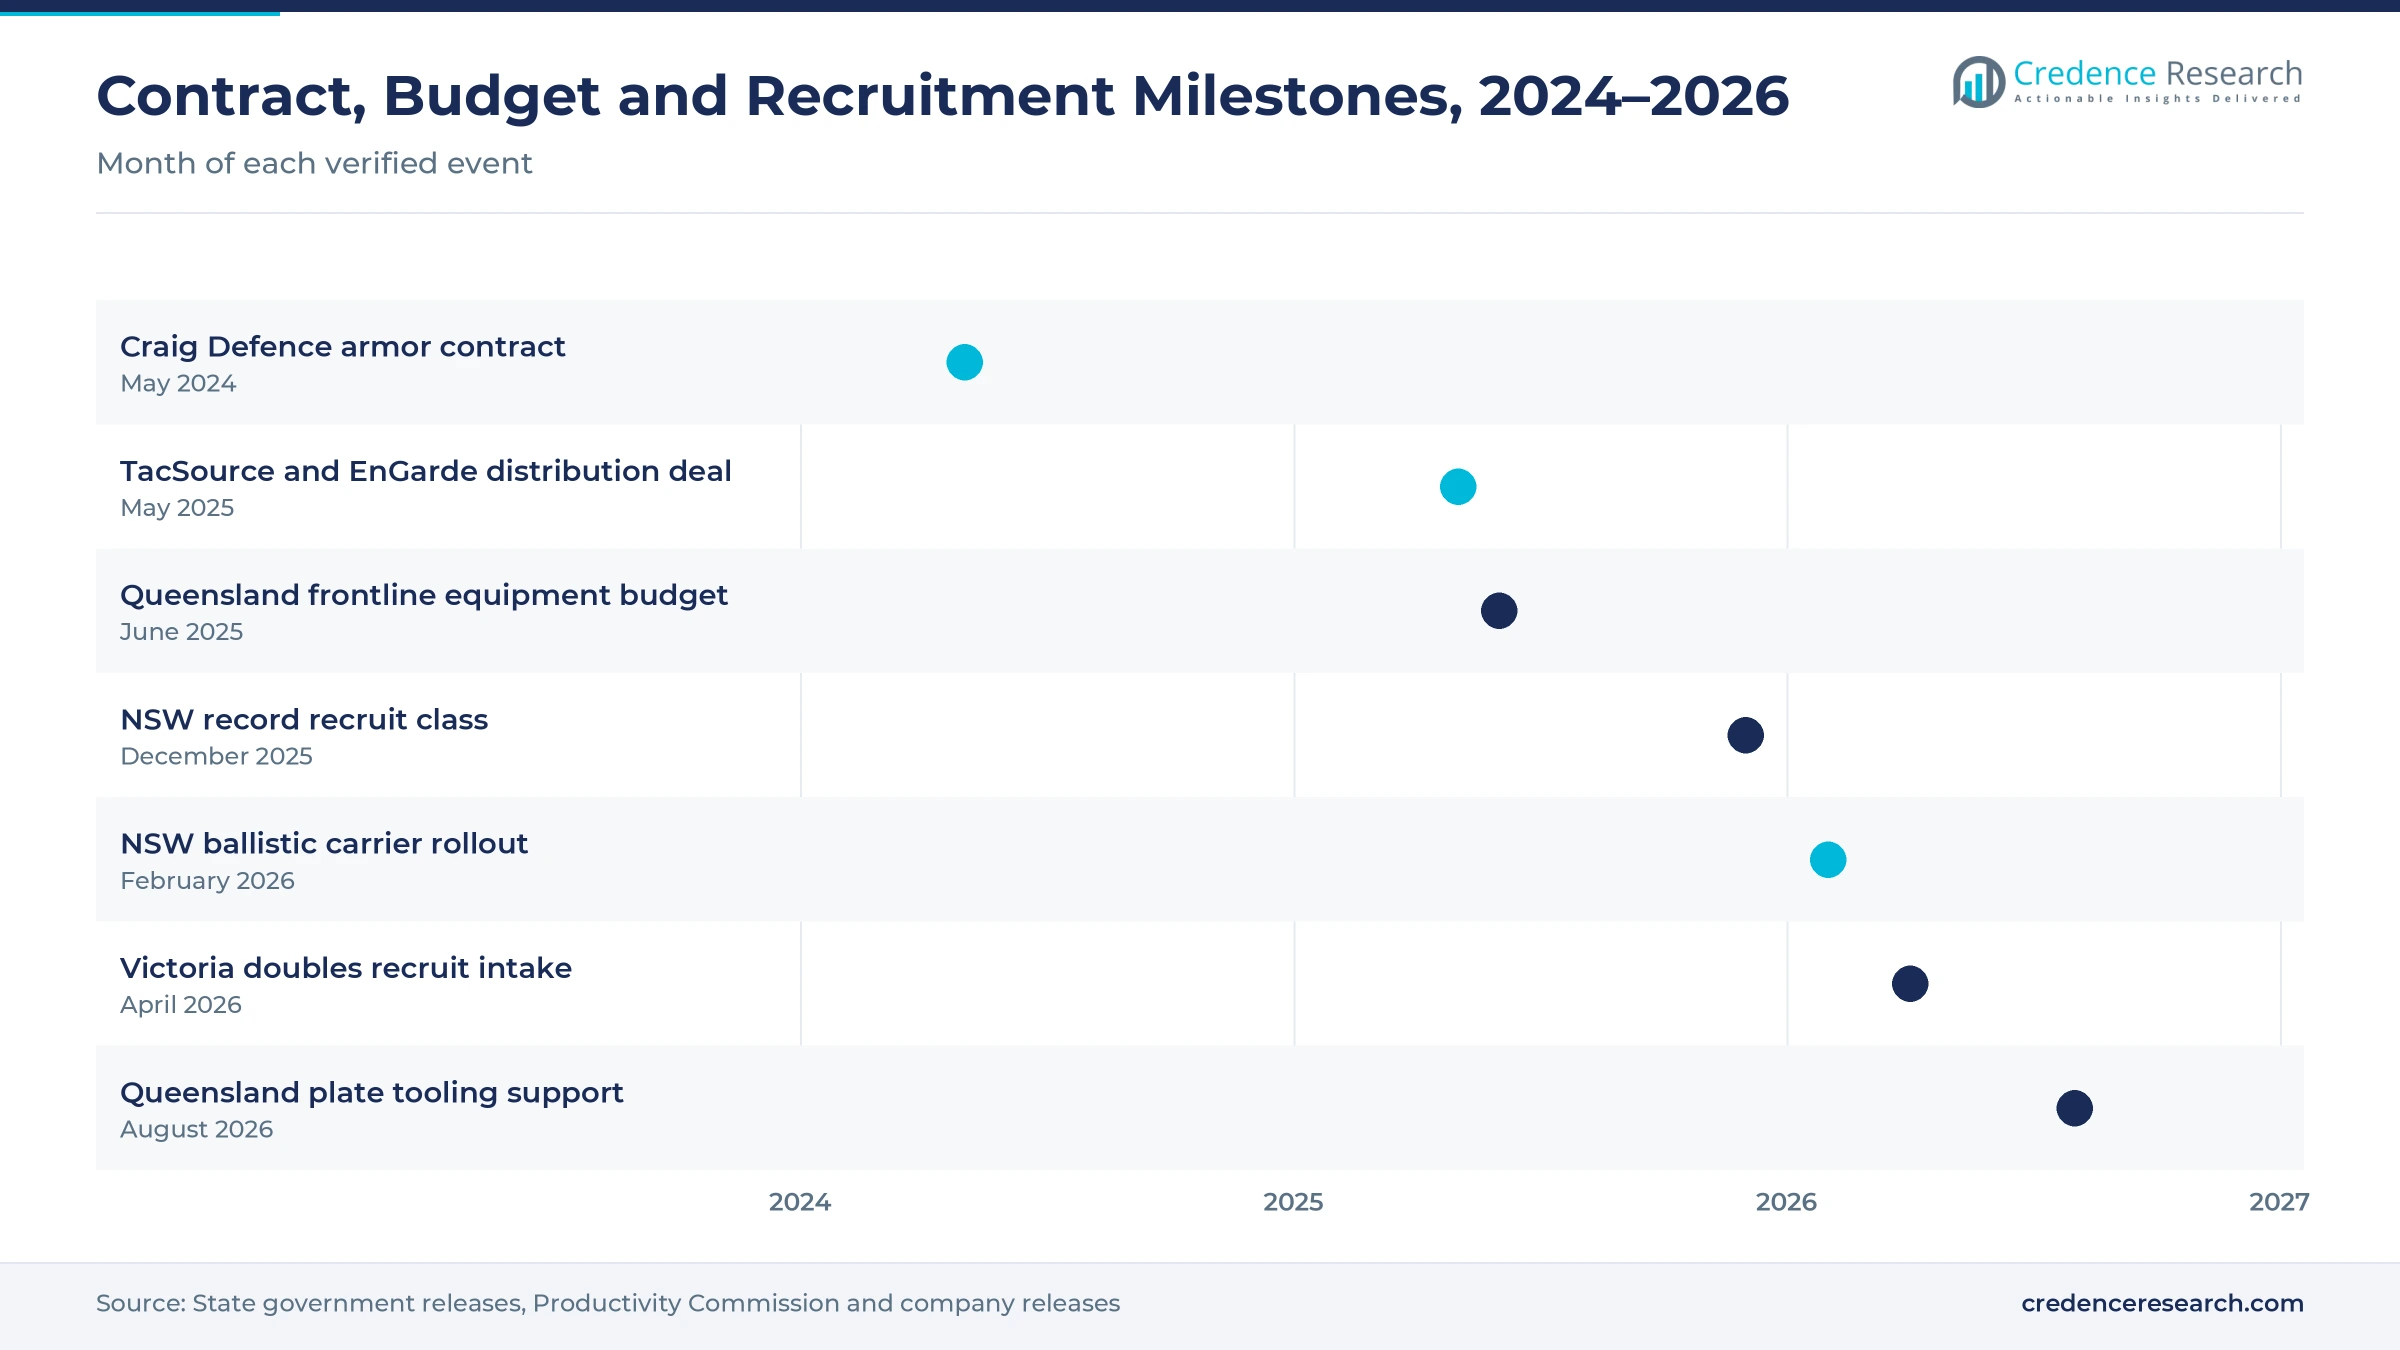
Contracts, budgets and recruitment milestones
| Development | Status and market relevance |
|---|---|
| In May 2024, Craig International Ballistics won a contract worth A$30 million to supply body armor components to the Australian Defence Force. | Strengthens local hard armor capacity |
| In June 2025, Queensland set aside A$147.9 million to equip frontline police, including A$29.9 million for replacement load-bearing vests. | Funds vest renewal in Queensland |
| In December 2025, the NSW Police Force attested 341 recruits, its largest class in 13 years. | Adds new officers who need fitted kit |
| In February 2026, Australian Defence Apparel began a statewide rollout of the ENFORCR H.A.L.O. X ballistic carrier across the NSW Police Force. | Moves patrol officers to modular carriers |
| In April 2026, Victoria Police doubled its recruit intake to 1,300 recruits a year. | Lifts provisioning demand in Victoria |
Woven, composite, textile and moulded systems define kit
- Woven ballistic systems stack layers of aramid or polyethylene fabric inside soft vests, which stop handgun rounds while staying flexible for patrol work.
- Advanced composite systems press polyethylene or ceramic layers into hard plates, which stop rifle rounds for tactical teams and specialist operations.
- Protective textile systems use cut, flame and climate-regulating fabrics in clothing and carriers, which protect officers while keeping them cool on long shifts.
- Moulded protective systems shape helmets, shields and limb guards from tough plastics and composites, which protect officers during public-order response.
Need a Custom Version of This Report?
Tailor the scope, geography, or segments to your exact requirements.
- Custom geography or segment scope
- Direct access to our analyst team
Local makers and distributors compete on fit and testing
Competition is led by Australian manufacturers that design vests and plates for each force, alongside specialist distributors that import international armor and tactical brands. Craig International Ballistics competes on hard armor plates made on the Gold Coast, backed by the A$30 million Defence contract and state support for new plate tooling. Australian Defence Apparel competes on soft armor carriers, with a statewide NSW Police rollout in 2026. Hellweg competes on integrated protection vests from Victoria, while TacSource competes through its Brisbane store, online platform and EnGarde distribution deal. Rivals compete on threat ratings, weight, fit across body sizes, testing records and local service. Because agencies favor proven suppliers, firms that trial designs with frontline officers and offer local fitting usually win longer contracts.
Which companies supply Australian agencies?
| Company | Type | Role in the market |
|---|---|---|
| Craig International Ballistics | Domestic manufacturer | Makes hard armor plates on the Gold Coast for the Australian Defence Force and law enforcement |
| Hellweg | Domestic manufacturer | Victoria-based maker of integrated protection vests for police |
| TacSource | Specialist distributor | Brisbane-based supplier of EnGarde armor to law enforcement and corrections |
Credence Research view on officer protection buying
Credence Research's view is that Australian demand for officer protection will grow steadily because states are hiring more police and renewing armor on fixed cycles. Ballistic and stab protection remains the largest value pool, while CBRN kit, specialist operations and distributor channels add the fastest growth. Recruitment in Victoria and New South Wales will shape near-term volumes. Suppliers with local manufacturing, proven testing records and lighter modular designs should gain the most, while budget cycles keep orders uneven.
How the national officer protection estimate was built
The report uses 2025 as the base year on a calendar basis, and market values come from the Credence Research model. That model combines police staffing and spending statistics, state budget papers, recruitment releases, population data and company announcements. Segment splits and state growth rates are Credence Research estimates, while state shares follow the client-defined split. Sources used are official statistics, government publications and company releases, and no interviews or surveys were used.
Larger forces and armor renewal carry growth to 2035
The Australia law enforcement personal protective equipment market is expected to reach USD 115.1 million by 2035, a 6.74% CAGR during 2026–2035, as states hire more officers and replace vests and carriers on regular cycles. Growth should be strongest in CBRN kit, specialist operations and distributor channels, because agencies prepare for wider threats and widen supplier choice. Local plate and carrier production will support supply, while budget timing and armor weight could slow some purchases.
Frequently Asked Questions
How big is the Australia law enforcement personal protective equipment market?
Which product type leads Australian value?
Which state leads the Australian market?
How many police staff work in Australia?
What did Queensland fund for police equipment in 2025-26?
Which sales channel is growing fastest?
Who are the leading companies in the Australian market?
What are the main challenges for suppliers?
Table of Content
Chapter 1 Market Segmentation
- 1.1 Segmentation Framework
- 1.1.1 Product and Service Classification
- 1.1.2 Application and End-Use Classification
- 1.1.3 Technology and Solution Classification
- 1.1.4 Customer and Distribution Channel Classification
- 1.1.5 Geographic Segmentation
- 1.1.6 Market Segment Definitions and Boundaries
- 1.2 By Product Type
- 1.2.1 Ballistic and stab protection
- 1.2.2 Protective clothing and duty systems
- 1.2.3 Head protection and public-order equipment
- 1.2.4 Respiratory and CBRN protection
- 1.3 By Application
- 1.3.1 Routine patrol
- 1.3.2 Custodial and facility security
- 1.3.3 Public-order response
- 1.3.4 Specialist operations
- 1.4 By End User
- 1.4.1 State and territory police
- 1.4.2 Federal enforcement agencies
- 1.4.3 Corrective services
- 1.4.4 Government hospital security
- 1.5 By Sales Channel
- 1.5.1 Domestic manufacturer contracts
- 1.5.2 International direct procurement
- 1.5.3 Specialist distributor contracts
- 1.5.4 Agency-authorised replenishment
- 1.6 By State
- 1.6.1 New South Wales
- 1.6.2 Victoria
- 1.6.3 Queensland
- 1.6.4 Remaining states and territories
Chapter 2 Introduction
- 2.1 Report Objectives and Scope
- 2.2 Product Definition and Industry Terminology
- 2.3 Market Inclusions and Exclusions
- 2.4 Research Process
- 2.4.1 Primary Research and Expert Interviews
- 2.4.2 Secondary Research and Source Review
- 2.4.3 Top-Down and Bottom-Up Estimation
- 2.4.4 Data Triangulation and Verification
- 2.5 Market Size Measurement Basis
- 2.5.1 2025: USD 54.5 million → 2035: USD 115.1 million
- 2.6 Historical and Forecast Reference Periods
- 2.6.1 Historical Period: 2018-2025
- 2.6.2 Base Year: 2025
- 2.6.3 Forecast Period: 2025-2035
- 2.7 Research Assumptions and Limitations
Chapter 3 Executive Summary
- 3.1 Market Snapshot and Key Findings
- 3.2 Base-Year Market Size, 2025
- 3.3 Forecast Market Size, 2035
- 3.4 Revenue and Volume Growth Outlook
- 3.5 Key Demand and Supply Indicators
- 3.6 Leading Market Segments
- 3.7 Fastest-Growing Market Opportunities
- 3.8 Regional Performance Highlights
- 3.9 Technology and Industry Transformation
- 3.10 Competitive Landscape Summary
- 3.11 Analyst View and Strategic Implications
Chapter 4 Australia Law Enforcement Personal Protective Equipment Market Trends and Developments
- 4.1 Historical Industry Development, 2018-2025
- 4.2 Recent Market Trends and Developments
- 4.3 Demand and Customer Behavior Trends
- 4.4 Technology and Product Innovation
- 4.5 Artificial Intelligence, Automation and Digitalization
- 4.6 Local Manufacturing and Supply Chain Realignment
- 4.7 Industry Partnerships, Mergers and Acquisitions
- 4.8 Sustainability and Circular Economy Developments
- 4.9 Government and Private Sector Investment Trends
- 4.10 Emerging Business Models and Commercialization
- 4.11 Industry Developments and Announcements
Chapter 5 Australia Law Enforcement Personal Protective Equipment Market Production, Supply and Demand Analysis
- 5.1 Demand Trend and Consumption Analysis, 2018-2025
- 5.2 Demand Forecast, 2025-2035
- 5.3 Production and Output Trend, 2018-2025
- 5.4 Production and Output Forecast, 2025-2035
- 5.5 Installed Capacity and Capacity Utilization
- 5.6 Company-Wise Production Plants and Statistics
- 5.6.1 Installed Production Capacity
- 5.6.2 Actual Production
- 5.6.3 Planned Capacity and Expansion Targets
- 5.7 Supply Chain Structure and Procurement Trends
- 5.8 Supply-Demand Gap and Bottlenecks
- 5.9 Import Dependence and Sourcing Structure
- 5.10 Contract Manufacturing and Outsourcing
- 5.11 Regional Supply and Demand Concentration
Chapter 6 Australia Law Enforcement Personal Protective Equipment Market Pricing Analysis
- 6.1 Pricing Structure and Measurement
- 6.2 Historical Pricing Trends, 2018-2025
- 6.3 Pricing Outlook, 2025-2035
- 6.4 Average Selling Price and Unit Economics
- 6.5 Pricing by Product and Market Segment
- 6.6 Geographic Pricing Differences
- 6.7 Key Input, Energy, Labor and Logistics Costs
- 6.8 Contract Pricing and Purchasing Models
- 6.9 Pricing Sensitivity and Competitive Positioning
- 6.10 Price, Margin and Profitability Implications
Chapter 7 Australia Law Enforcement Personal Protective Equipment Market Dynamics
- 7.1 Market Growth Drivers
- 7.1.1 Demand-Side Drivers
- 7.1.2 Technology and Innovation Drivers
- 7.1.3 Infrastructure and Investment Drivers
- 7.1.4 Regulatory and Policy Drivers
- 7.2 Market Restraints
- 7.2.1 Cost and Affordability Constraints
- 7.2.2 Technology and Adoption Barriers
- 7.2.3 Supply Chain and Operational Constraints
- 7.3 Market Challenges
- 7.3.1 Competitive Pressure and Margin Erosion
- 7.3.2 Skills, Infrastructure and Implementation Gaps
- 7.4 Emerging Market Opportunities
- 7.5 Market Dynamics Impact and Time-Horizon Assessment
Chapter 8 Australia Law Enforcement Personal Protective Equipment Value Chain Analysis
- 8.1 Industry Value Chain Overview
- 8.2 Upstream Suppliers and Critical Inputs
- 8.3 Technology and Component Providers
- 8.4 Manufacturing or Service Delivery
- 8.5 Distribution, Channel Partners and Integrators
- 8.6 Downstream Applications and End Users
- 8.7 Value Addition and Profit Pools
- 8.8 Vertical Integration and Outsourcing
- 8.9 Supplier Concentration and Risk
- 8.10 Supply Chain Localization and Resilience
Chapter 9 Australia Law Enforcement Personal Protective Equipment Market Regulations and Policies
- 9.1 Relevant Laws, Standards and Compliance Frameworks
- 9.2 Product, Service, Safety and Quality Requirements
- 9.3 Government Policies, Incentives and Subsidies
- 9.4 Imports, Exports and Trade Barriers
- 9.5 Public Procurement and Local Content Requirements
- 9.6 Environmental and Sustainability Compliance
- 9.7 Upcoming Policy Changes and Market Implications
Chapter 10 Australia Law Enforcement Personal Protective Equipment Market Hotspots and Opportunities
- 10.1 Market Opportunity Mapping and Growth Hotspots
- 10.2 High-Growth Applications and Customer Groups
- 10.3 Underserved Markets and White-Space Opportunities
- 10.4 Emerging Technology and Product Opportunities
- 10.5 New Capacity and Investment Hotspots
- 10.6 Market Entry and Expansion Opportunities
- 10.7 Distribution and Partnership Opportunities
- 10.8 Near-Term and Long-Term Commercial Potential
- 10.9 Opportunity Attractiveness and Execution Risks
Chapter 11 Australia Law Enforcement Personal Protective Equipment Market Outlook, 2025-2035
- 11.1 Market Size and Analysis
- 11.1.1 Revenue (Market Measurement: 2025: USD 54.5 million → 2035: USD 115.1 million)
- 11.1.2 Market Volume and Quantity Sold
- 11.1.3 Historical Market Size, 2018-2025
- 11.1.4 Base-Year Market Size, 2025
- 11.2 Market Forecast, 2025-2035
- 11.2.1 Revenue Forecast to 2035
- 11.2.2 Volume Forecast to 2035
- 11.2.3 CAGR and Year-on-Year Growth
- 11.2.4 Incremental Revenue Opportunity
- 11.3 Forecast Assumptions and Scenario Analysis
- 11.3.1 Base-Case Forecast
- 11.3.2 Optimistic and Conservative Scenarios
- 11.3.3 Technology, Pricing and Policy Sensitivities
- 11.4 Market Attractiveness and Growth Outlook
Chapter 12 Australia Law Enforcement Personal Protective Equipment Market Segmentation and Outlook
- 12.1 Segmentation Summary and Market Shares, 2025
- 12.2 Largest and Fastest-Growing Segments
- 12.3 By Product Type - Market Size and Forecast, 2025-2035
- 12.3.1 Segment Definition and Scope
- 12.3.2 Historical Market Size, 2018-2025
- 12.3.3 Revenue Forecast, 2025-2035
- 12.3.4 Volume Forecast, 2025-2035
- 12.3.5 Base-Year Market Share, 2025
- 12.3.6 Segment CAGR and Growth Drivers
- 12.3.7 Subsegment Market Size and Forecast
- 12.3.7.1 Ballistic and stab protection
- 12.3.7.2 Protective clothing and duty systems
- 12.3.7.3 Head protection and public-order equipment
- 12.3.7.4 Respiratory and CBRN protection
- 12.3.8 Subsegment Pricing and Adoption Trends
- 12.3.9 Leading Suppliers and Competition
- 12.3.10 Regional Demand and Opportunities
- 12.4 By Application - Market Size and Forecast, 2025-2035
- 12.4.1 Segment Definition and Scope
- 12.4.2 Historical Market Size, 2018-2025
- 12.4.3 Revenue Forecast, 2025-2035
- 12.4.4 Volume Forecast, 2025-2035
- 12.4.5 Base-Year Market Share, 2025
- 12.4.6 Segment CAGR and Growth Drivers
- 12.4.7 Subsegment Market Size and Forecast
- 12.4.7.1 Routine patrol
- 12.4.7.2 Custodial and facility security
- 12.4.7.3 Public-order response
- 12.4.7.4 Specialist operations
- 12.4.8 Subsegment Pricing and Adoption Trends
- 12.4.9 Leading Suppliers and Competition
- 12.4.10 Regional Demand and Opportunities
- 12.5 By End User - Market Size and Forecast, 2025-2035
- 12.5.1 Segment Definition and Scope
- 12.5.2 Historical Market Size, 2018-2025
- 12.5.3 Revenue Forecast, 2025-2035
- 12.5.4 Volume Forecast, 2025-2035
- 12.5.5 Base-Year Market Share, 2025
- 12.5.6 Segment CAGR and Growth Drivers
- 12.5.7 Subsegment Market Size and Forecast
- 12.5.7.1 State and territory police
- 12.5.7.2 Federal enforcement agencies
- 12.5.7.3 Corrective services
- 12.5.7.4 Government hospital security
- 12.5.8 Subsegment Pricing and Adoption Trends
- 12.5.9 Leading Suppliers and Competition
- 12.5.10 Regional Demand and Opportunities
- 12.6 By Sales Channel - Market Size and Forecast, 2025-2035
- 12.6.1 Segment Definition and Scope
- 12.6.2 Historical Market Size, 2018-2025
- 12.6.3 Revenue Forecast, 2025-2035
- 12.6.4 Volume Forecast, 2025-2035
- 12.6.5 Base-Year Market Share, 2025
- 12.6.6 Segment CAGR and Growth Drivers
- 12.6.7 Subsegment Market Size and Forecast
- 12.6.7.1 Domestic manufacturer contracts
- 12.6.7.2 International direct procurement
- 12.6.7.3 Specialist distributor contracts
- 12.6.7.4 Agency-authorised replenishment
- 12.6.8 Subsegment Pricing and Adoption Trends
- 12.6.9 Leading Suppliers and Competition
- 12.6.10 Regional Demand and Opportunities
- 12.7 By State - Market Size and Forecast, 2025-2035
- 12.7.1 Segment Definition and Scope
- 12.7.2 Historical Market Size, 2018-2025
- 12.7.3 Revenue Forecast, 2025-2035
- 12.7.4 Volume Forecast, 2025-2035
- 12.7.5 Base-Year Market Share, 2025
- 12.7.6 Segment CAGR and Growth Drivers
- 12.7.7 Subsegment Market Size and Forecast
- 12.7.7.1 New South Wales
- 12.7.7.2 Victoria
- 12.7.7.3 Queensland
- 12.7.7.4 Remaining states and territories
- 12.7.8 Subsegment Pricing and Adoption Trends
- 12.7.9 Leading Suppliers and Competition
- 12.7.10 Regional Demand and Opportunities
- 12.8 Segment Growth Comparison
- 12.9 Segment Attractiveness and Priority Matrix
Chapter 13 Australia Law Enforcement Personal Protective Equipment End-Use and Application Market Outlook
- 13.1 End-Use Industry and Customer Demand Structure
- 13.2 Leading Applications and Customer Groups
- 13.3 End-Use Market Size, Share and Forecast
- 13.4 Major End-Use Industry Deep Dives
- 13.4.1 Customer Requirements and Use Cases
- 13.4.2 Demand and Replacement Cycles
- 13.4.3 Technical and Regulatory Considerations
- 13.4.4 Purchasing and Procurement Models
- 13.4.5 Leading Vendors and Distribution Channels
- 13.4.6 Forecast and Commercial Opportunities
- 13.5 Emerging Applications and Cross-Segment Demand
- 13.6 End-Use Industry Investment Priorities
Chapter 14 Australia Law Enforcement Personal Protective Equipment Geographic Market Outlook, 2025-2035
- 14.1 Domestic Market Distribution and Demand Clusters
- 14.2 State- or Province-Wise Market Size and Forecast, 2025-2035
- 14.3 City and Metropolitan Market Outlook
- 14.4 Industrial, Manufacturing and Commercial Clusters
- 14.5 Geographic Concentration of Key End Users
- 14.6 Local Pricing and Purchasing Differences
- 14.7 Domestic Production Facilities and Capacity Map
- 14.8 Local Infrastructure and Project Pipeline
- 14.9 State-Level Policy and Incentive Differences
- 14.10 Subnational Investment Hotspots and Opportunities
- 14.11 Distribution and Logistics Networks
- 14.12 Domestic Competitive Footprint
Chapter 15 Australia Law Enforcement Personal Protective Equipment Technology, Innovation and Sustainability Outlook
- 15.1 Technology Landscape and Maturity
- 15.2 Product, Process and Service Innovation
- 15.3 AI, Automation and Digital Tools in the Industry
- 15.4 Technology Adoption and Performance Benchmarking
- 15.5 Innovation Pipeline and R&D Investment
- 15.6 Patent and Intellectual Property Trends
- 15.7 Energy Efficiency and Resource Management
- 15.8 Sustainability, Recycling and Circularity
- 15.9 Technology Roadmap, 2025-2035
- 15.10 Risks of Obsolescence and Technology Substitution
Chapter 16 Australia Law Enforcement Personal Protective Equipment Market Key Strategic Imperatives
- 16.1 Growth and Market Entry Priorities
- 16.2 High-Return Products and Segments
- 16.3 Pricing, Profitability and Cost Optimization
- 16.4 Technology Investment and Product Differentiation
- 16.5 Supply Chain Localization and Resilience
- 16.6 Distribution and Customer Acquisition
- 16.7 Partnership, Acquisition and Capacity Strategy
- 16.8 Regional Expansion Priorities
- 16.9 Short-, Medium- and Long-Term Actions
Chapter 17 Competition Outlook
- 17.1 Industry Competition Characteristics
- 17.2 Market Structure and Concentration
- 17.3 Market Share and Competitive Positioning, 2025
- 17.4 Company-Wise Revenue and Product Benchmarking
- 17.5 Production and Service Capacity Benchmarking
- 17.6 Technology, Pricing and Differentiation
- 17.7 Regional Footprint and Distribution Strength
- 17.8 Mergers, Acquisitions and Strategic Alliances
- 17.9 New Entrants and Competitive Threats
- 17.10 Porter's Five Forces and Industry Attractiveness
- 17.11 Competitive Outlook, 2025-2035
Chapter 18 Company Profiles
- 18.1 Company Coverage and Selection Criteria
- 18.2 Craig International Ballistics
- 18.2.1 Business Description
- 18.2.2 Company Ownership and Geographic Presence
- 18.2.3 Product and Service Portfolio
- 18.2.4 Manufacturing and Operating Footprint
- 18.2.5 Production Capacity and Expansion Plans
- 18.2.6 Financial Performance and Investment
- 18.2.7 Market Share and Competitive Position
- 18.2.8 Technology and Innovation Capabilities
- 18.2.9 Strategic Alliances or Partnerships
- 18.2.10 Recent Developments
- 18.2.11 Growth Strategy and Outlook
- 18.3 Hellweg
- 18.4 Tactical Distributors
- 18.5 Safariland
- 18.6 SORD Australia
- 18.7 TacSource
- 18.8 Spearpoint
- 18.9 PPSS Group
- 18.10 3M Australia
- 18.11 TacEquip
- 18.12 Other Relevant Market Participants
Note: Every listed company is profiled on the structure shown under the first company. The company list is preliminary and may change based on research findings, market developments, data availability and client requirements.
Chapter 19 Disclaimer
- 19.1 Research and Forecast Disclaimer
- 19.2 Data Source and Estimation Limitations
Note: The depth of individual sections depends on data availability for this market. Volume, capacity, trade and other unit-based metrics are included where applicable.

