
Asia-Pacific synthetic aperture radar is moving to fleets
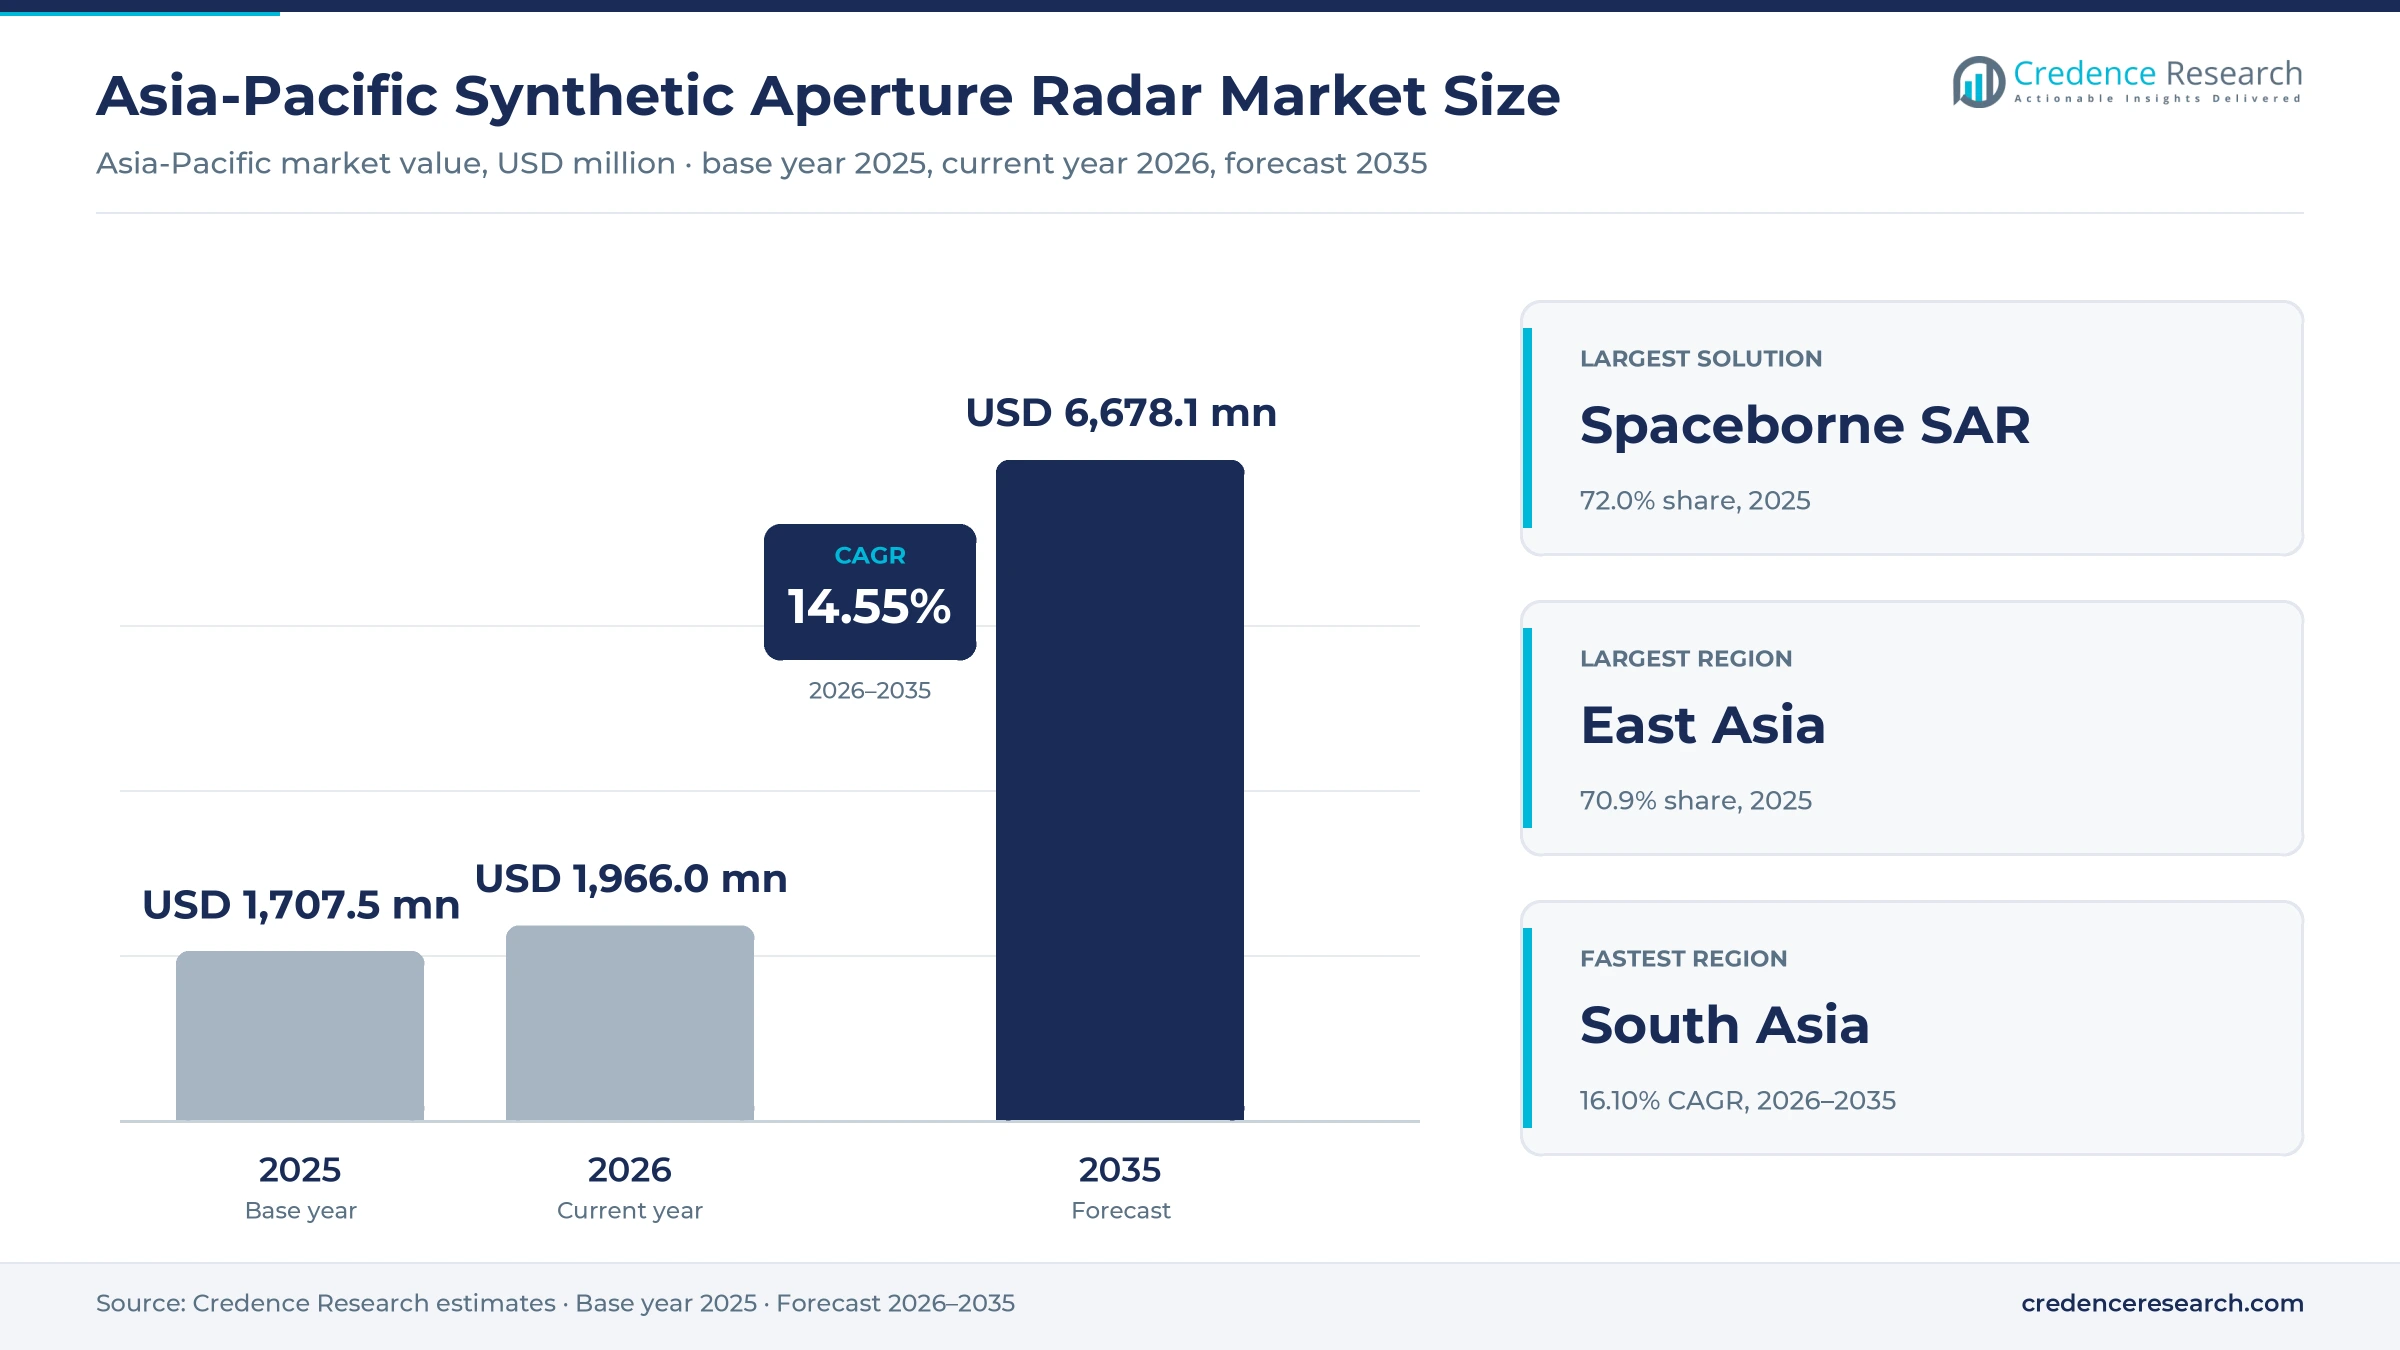
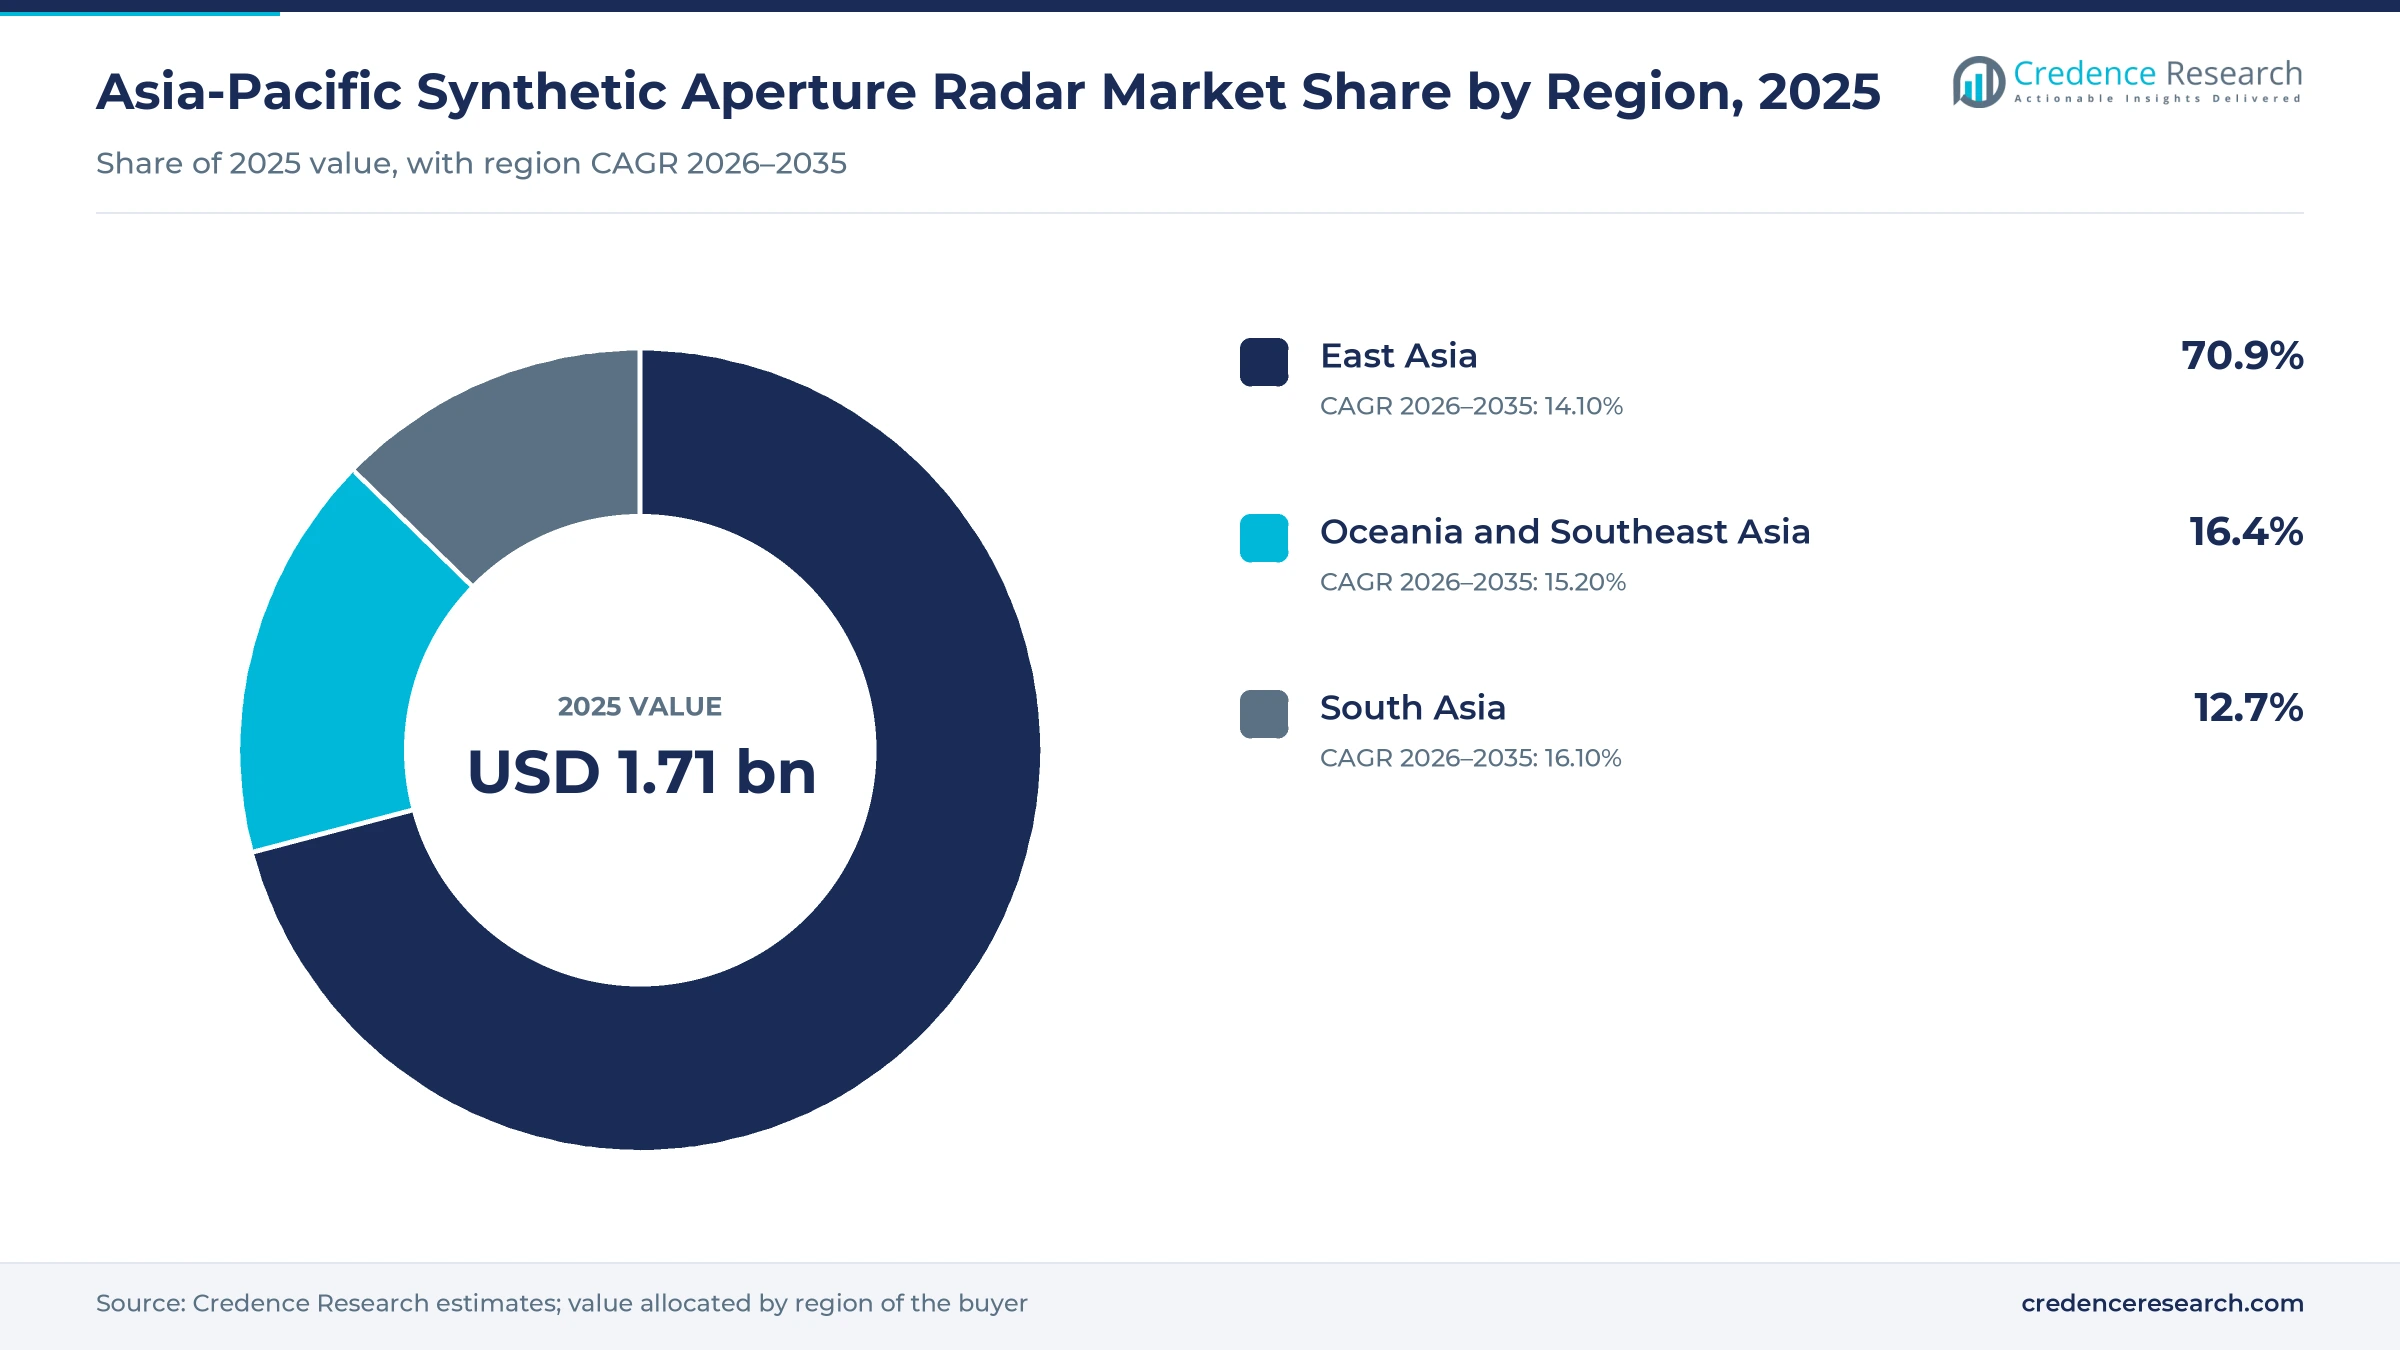
The Asia-Pacific synthetic aperture radar market was valued at USD 1.71 billion in 2025 and is projected to increase from USD 1.97 billion in 2026 to USD 6.68 billion by 2035, registering a CAGR of 14.55% during 2026–2035. Demand comes from defense ministries buying all-weather reconnaissance, commercial operators scaling small satellites, and civil agencies that track earthquakes, forests and ground movement. East Asia held the largest share, 70.9% in 2025, because China, Japan and South Korea all run domestic radar satellite programs. South Asia is the fastest-growing region at 16.10% a year as India moves through a 52-satellite surveillance program approved in October 2024. The most important commercial change is the way governments now buy this capability. Japan signed a five-year constellation contract with a private consortium in February 2026, which moves part of the spending from owned spacecraft toward purchased imagery and analytics.
What does the Asia-Pacific SAR market actually sell, and to whom?
The market counts synthetic aperture radar imaging systems flown on satellites and aircraft or fixed on the ground, together with the imagery, licenses and managed services those systems produce. Buyers include defense ministries, national space agencies, disaster agencies, insurers, mine operators and infrastructure owners across the region.
The estimate excludes conventional surveillance and weather radars, launch services, optical imagery and general geospatial software sold without radar data. Value flows from payload and bus makers through satellite operators to ground segment suppliers and analytics providers, with state programs often integrating several of these steps under one contract.
Asia-Pacific Synthetic Aperture Radar Market Insights
- The market grows from USD 1.71 billion in 2025 to USD 6.68 billion by 2035, a compound rate of 14.55% during 2026–2035 led by sovereign satellite fleets.
- East Asia held 70.9% of 2025 value because China, Japan and South Korea each operate domestic radar satellite programs and supply chains.
- Spaceborne SAR led with 72.0% of 2025 value, and defense ministries remain the largest buyers of radar imagery across the region.
- Japan signed a JPY 283.1 billion, five-year constellation contract with Tri-Sat Constellation in February 2026, moving some spending from hardware to purchased data.
- ICEYE and IHI agreed in October 2025 on a planned 24-satellite constellation, which shows foreign suppliers winning work by assembling spacecraft inside Japan.
Spaceborne defense buyers set the revenue mix
Why do satellites take most of the solution spending?
Based on solution type, the market is categorized into spaceborne SAR, airborne SAR and ground-based SAR. Spaceborne SAR led with 72.0% of 2025 value because governments buy whole fleets, as South Korea did with four radar satellites under Project 425, completed Nov. 2, 2025, according to Janes. Spaceborne SAR also grows fastest at 14.91% a year as iQPS targets 24 satellites by May 2028, according to Via Satellite. Airborne demand rests on large military airborne sensor programs such as India's six-aircraft A321 project, which Raksha Anirveda put at Rs 20,000 crore in July 2025. Ground-based systems sell mainly into slope monitoring at large open-pit mines.
How far does defense spending outweigh commercial and civil budgets?
Based on customer type, the market is categorized into military and defence, commercial Earth observation and civil government. Military and Defence led with 64.0% of 2025 value because single defense contracts are very large, such as the JPY 283.1 billion Tri-Sat Constellation agreement reported by GeoConnexion in March 2026. Commercial Earth Observation grows fastest at 16.33% a year as operators add capacity, with Synspective aiming for 30 satellites by the late 2020s, according to Asia Times. Civil government spending is steadier and centers on agency missions, including JAXA's ALOS-4, launched July 1, 2024, and the NISAR mission India launched with NASA.
Which frequency bands fit which missions?
Based on technology, the market is categorized into X-band SAR, L-band SAR and other-band SAR. X-Band SAR led with 58.0% of 2025 value because high-resolution commercial and mapping fleets favor these shorter-wavelength sensors, and Piesat's four-satellite PIESAT-1 interferometric group launched in 2023 uses X-band, according to SatNow. L-Band SAR grows fastest at 15.45% a year as canopy-penetrating missions multiply, including PALSAR-3 on ALOS-4 and China's geosynchronous Ludi Tance-4 01, launched Aug. 12, 2023, according to SpaceNews. Other bands remain important, as India's C-band EOS-04 and the S-band half of NISAR, described by The Tribune, both show in national programs.
What is the imagery mainly used to watch?
Based on application, the market is categorized into security and maritime surveillance, environmental and disaster monitoring, and infrastructure and resource monitoring. Security and Maritime Surveillance led with 62.0% of 2025 value because coastal surveillance and border security set requirements, and The Week reported that EOS-09 was meant to watch India's 15,000 km of land borders and 7,500 km of coastline. Infrastructure and Resource Monitoring grows fastest at 15.89% a year as natural resource agencies buy in, with China's Ministry of Natural Resources backing the Tiangang small-satellite project, according to SpaceNews. Disaster monitoring proved its value after the March 28, 2025, Myanmar earthquake, when Sentinel Asia distributed ALOS-2 data.
| Segment Group | Leading Sub-segment | Share, 2025 | Fastest-growing Sub-segment | CAGR, 2026–2035 |
|---|---|---|---|---|
| By Solution Type | Spaceborne SAR | 72.0% | Spaceborne SAR | 14.91% |
| By Customer Type | Military and Defence | 64.0% | Commercial Earth Observation | 16.33% |
| By Technology | X-Band SAR | 58.0% | L-Band SAR | 15.45% |
| By Application | Security and Maritime Surveillance | 62.0% | Infrastructure and Resource Monitoring | 15.89% |
Request a Free Sample
Fill in your details and we'll send you a free sample report.
- Sample data tables & charts
- Research methodology
Sovereign constellations anchor regional procurement
Sovereign reconnaissance constellations set the largest orders
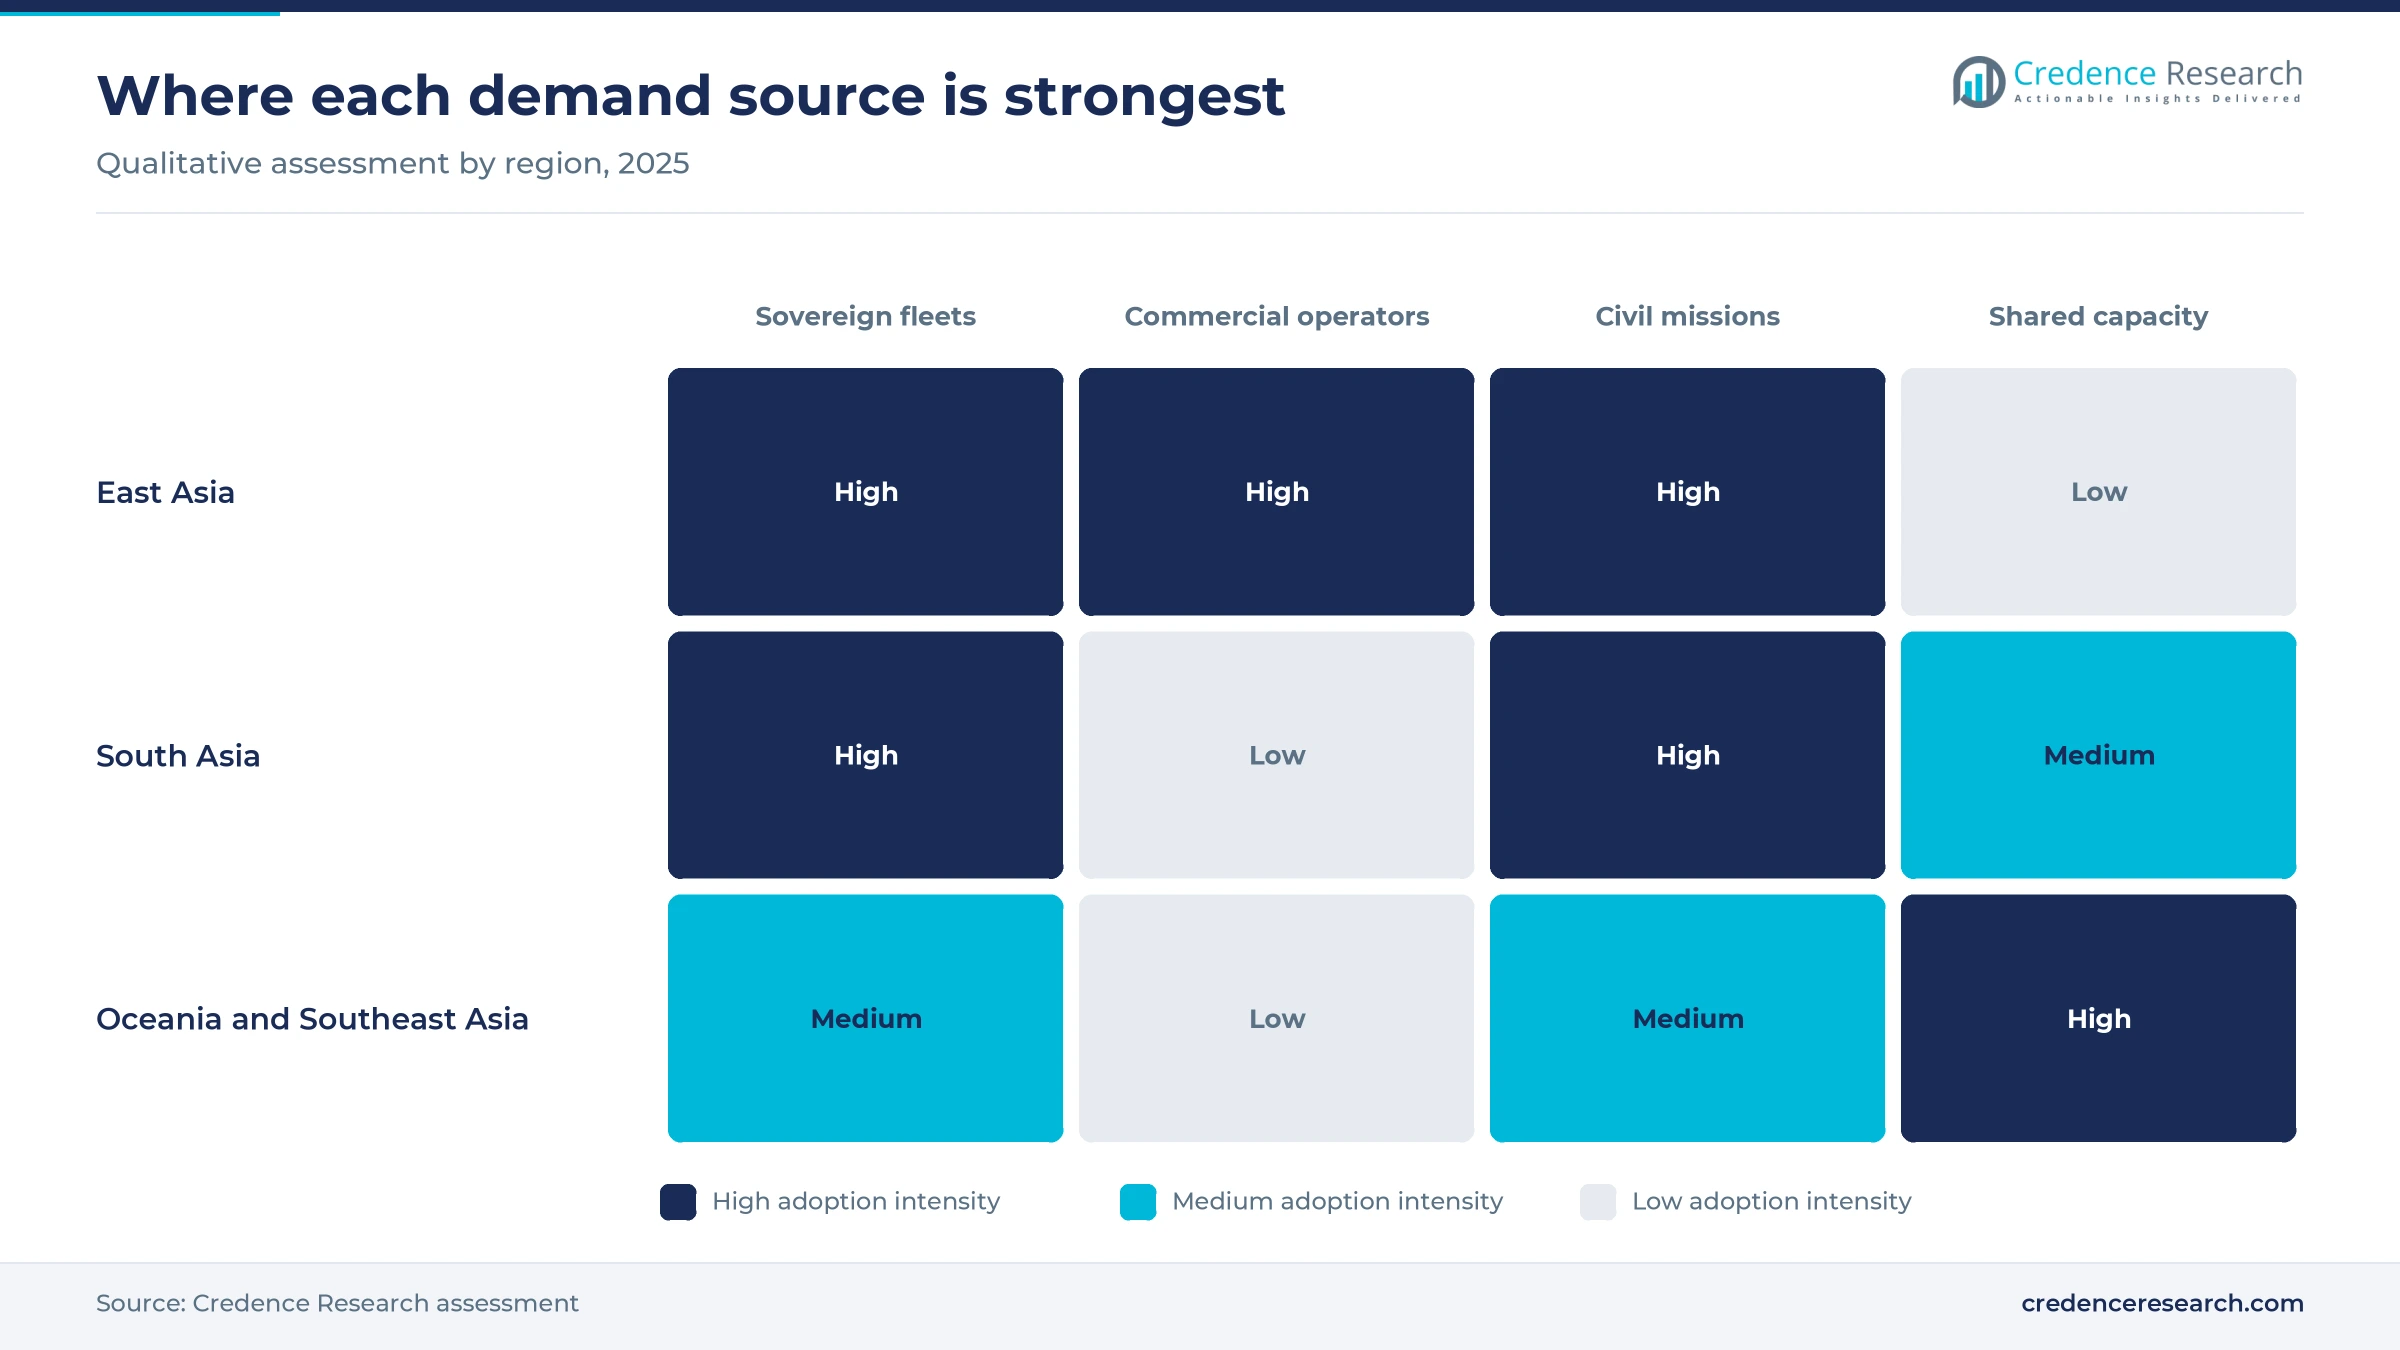
Sovereign reconnaissance constellations are the largest single demand source for synthetic aperture radar because governments want imagery they control during a crisis. South Korea finished Project 425 on Nov. 2, 2025, and Janes reported four to six observations a day over the Korean Peninsula from its radar satellites. The Korea Herald reported in April 2026 a multiministry plan for around 40 SAR satellites, which would extend that buying well beyond the first fleet. India is moving in the same direction, since The Tribune valued its 52-satellite surveillance program at Rs 26,968 crore. As a result, Military and Defence accounted for 64.0% of 2025 value, and these programs tend to favor domestic payload makers.
Commercial small-satellite scaling lowers the cost of revisit
Commercial small-satellite scaling matters because many small radar satellites revisit a target more often than one large spacecraft at a lower unit cost. Asia Times reported in February 2026 that Synspective satellites cost about one twentieth of a conventional large radar satellite, and that its Yamato factory is designed for 12 satellites a year. Via Satellite reported that iQPS reached its 14th successful radar launch on Aug. 20, 2026, and is working toward 24 satellites by May 2028. Synspective also booked 10 satellites with Exolaunch in July 2025, with the first launch scheduled for 2027. These small-satellite fleets support the Commercial Earth Observation segment, which grows at 16.33% a year.
Institutional Earth observation keeps long-wavelength missions funded
Institutional Earth observation sustains missions that commercial operators rarely fund alone, especially long-wavelength radar for forests, crust and volcanoes. Mitsubishi Electric said ALOS-4 returned its first PALSAR-3 images in August 2024, a month after launch from Tanegashima, for disaster and ground deformation monitoring. ISRO chairman V Narayanan said in 2025 that NISAR, launched July 30, 2025, would provide coverage about twice every 12 days. SpaceNews reported that China placed its L-band Ludi Tance-4 01 satellite toward geosynchronous orbit in August 2023 for all-day disaster coverage. These missions help L-Band SAR grow at 15.45% a year.
Rising defense budgets widen the pool of credible buyers
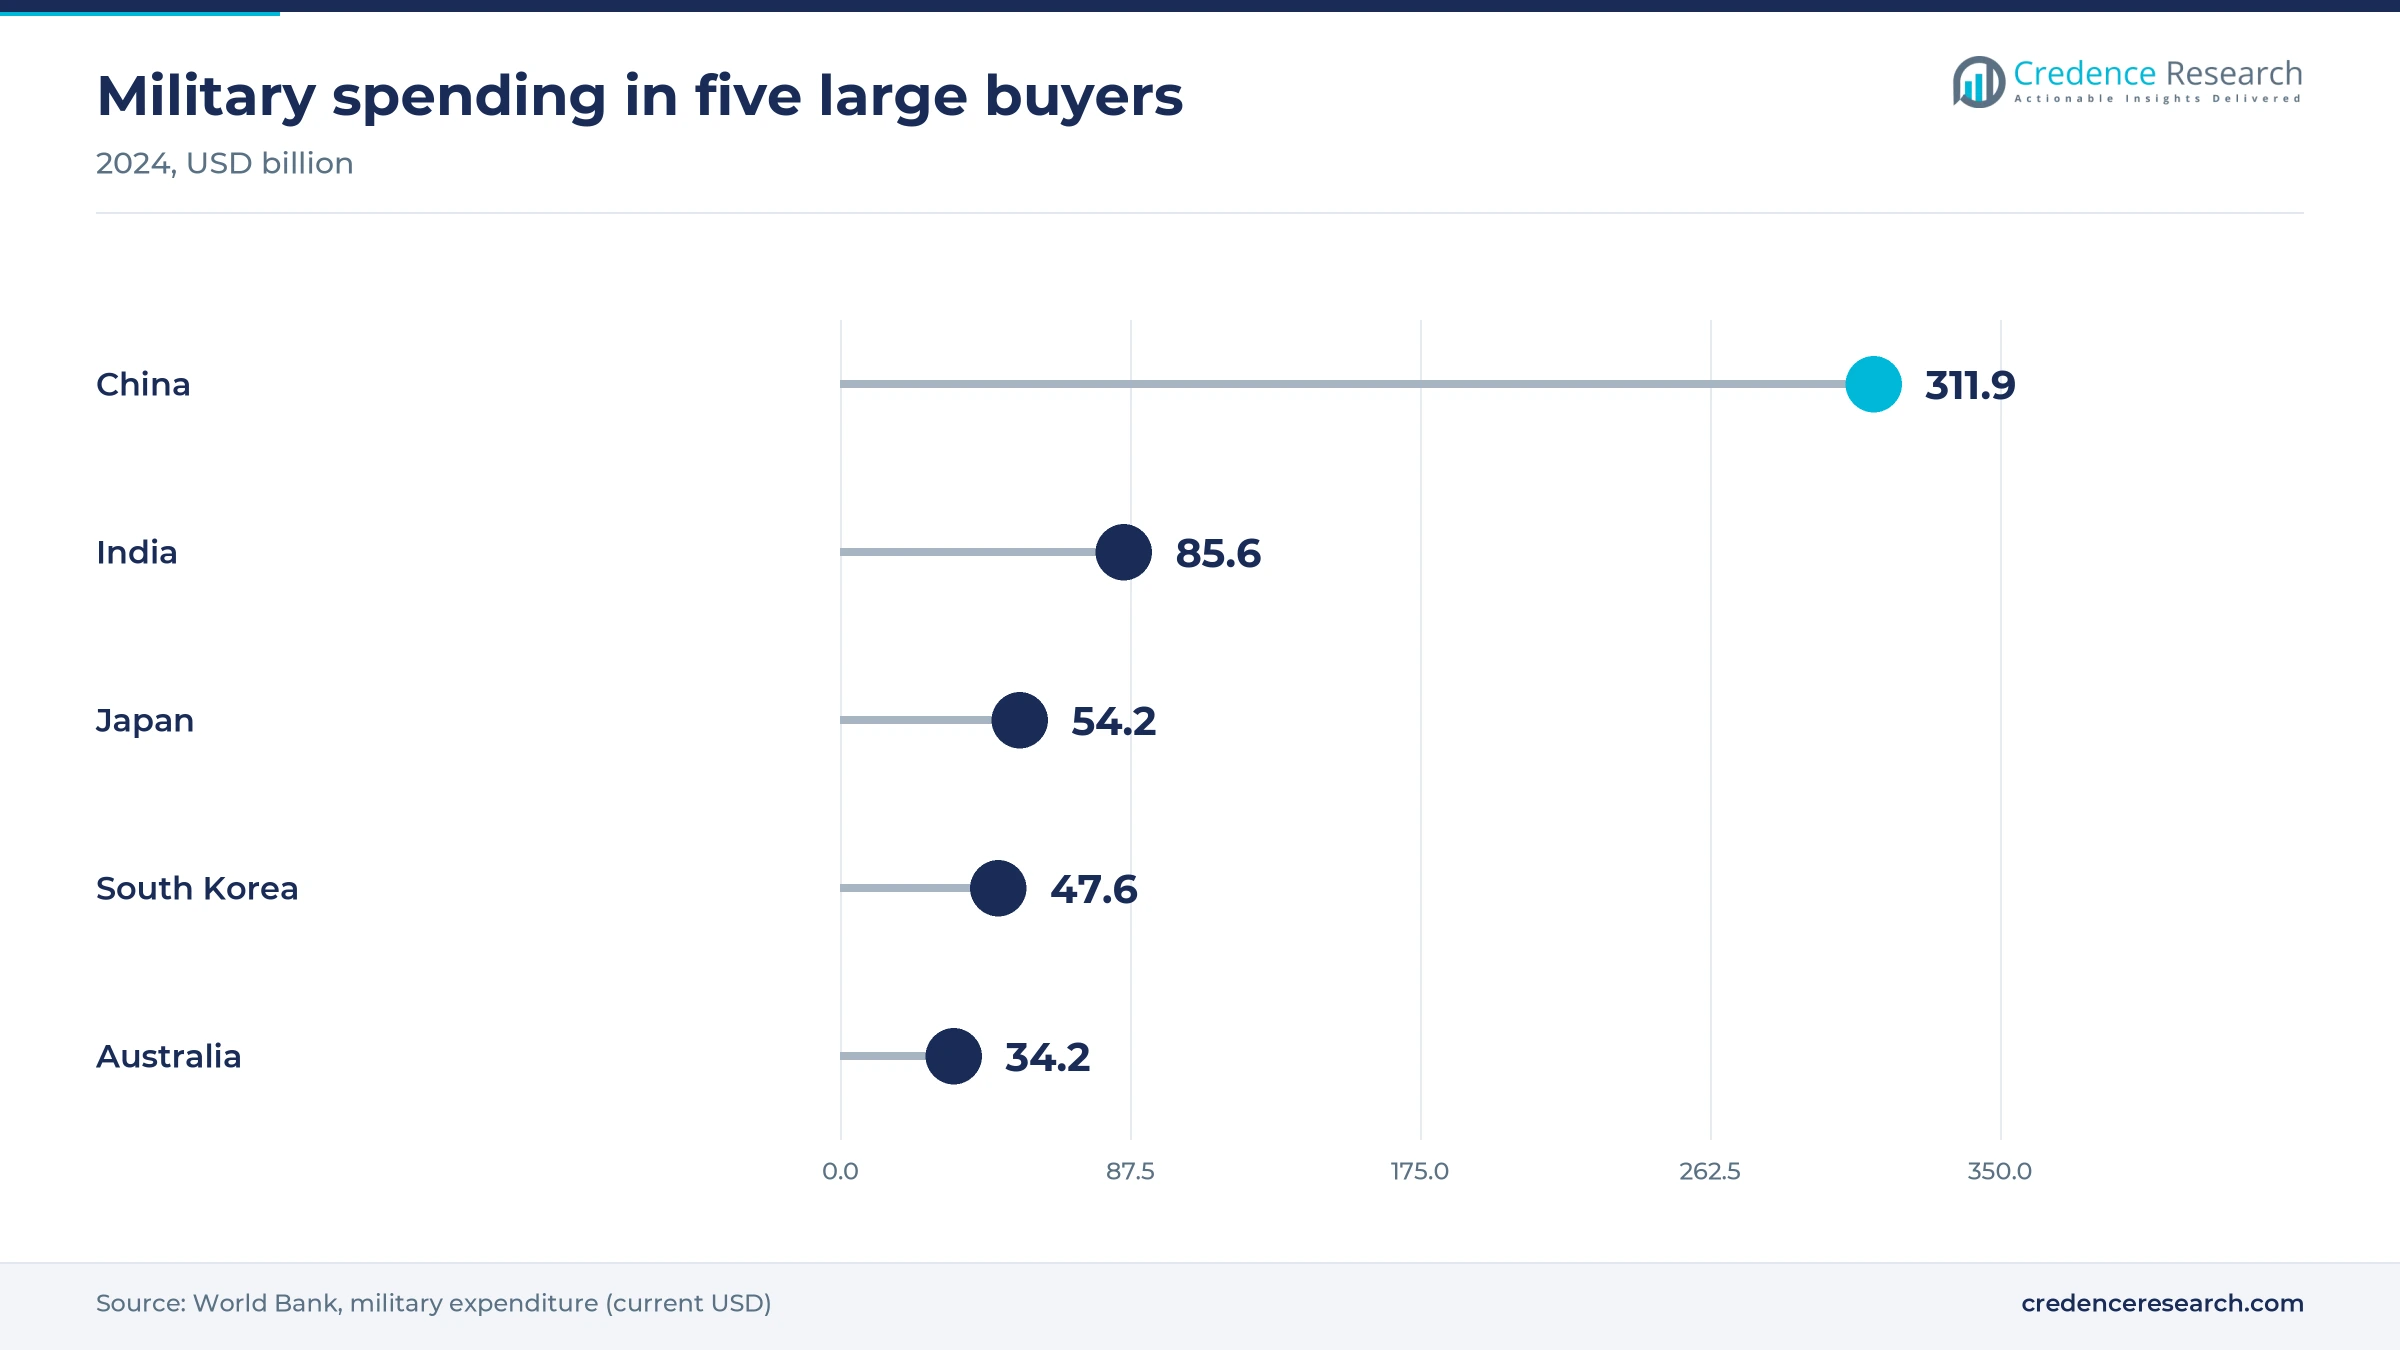
Defense budgets matter because radar imagery competes with other priorities, and larger budgets make multi-year satellite contracts easier to approve. World Bank data show 2024 military spending of USD 311.9 billion in China, USD 85.6 billion in India and USD 54.2 billion in Japan, with South Korea and Australia also above USD 30 billion. Japan's Ministry of Defense budget for fiscal 2026 lists about JPY 8.809 trillion in defense-related spending, including about JPY 174 billion for the space domain. Because these allocations recur, suppliers can plan production lines around them and keep East Asia growing at 14.10% a year.
Data contracts and local assembly reshape supply
Shift from owned satellites to purchased imagery contracts
Governments are shifting part of their budgets from owning satellites to buying imagery over multi-year terms. The clearest case is Japan, where Brief Glance reported that the Ministry of Defense signed with Tri-Sat Constellation on Feb. 19, 2026, for a five-year operating period through March 31, 2031. The special purpose company comes from Mitsubishi Electric, SKY Perfect JSAT and Mitsui, and Synspective supplies radar data as a partner company. Asia Times described the project as a Private Finance Initiative, which spreads costs across the term, and said Synspective satellites image areas above 1,000 square kilometers. This structure benefits operators with satellites already in orbit, since they can deliver data while competitors are still building their own satellites.
Rise of local assembly and radar technology transfer
Local assembly is rising because governments increasingly treat radar payloads as a strategic capability rather than an imported product. Air & Cosmos reported that Thales Alenia Space contracts for Project 425 included SAR technology transfer to Korea Aerospace Industries and Hanwha Systems. EDR Magazine reported in November 2025 that Hanwha Systems developed assembly, testing, key electronics and the data link domestically for its final payload. Foreign suppliers are adapting too, since the ICEYE and IHI agreement of Oct. 16, 2025, plans to assemble and test two of the first four satellites in Japan, with options on 20 more. As a result, foreign vendors now compete by offering local jobs and know-how, which matters most in defense procurement.
Opportunity in disaster data for smaller Southeast Asian states
Disaster response offers an opening among states that lack their own radar fleets but face frequent storms and earthquakes. After the magnitude 7.7 Myanmar earthquake of March 28, 2025, JAXA reported emergency ALOS-2 and ALOS-4 observations through Sentinel Asia within two days. Sentinel Asia also listed EOS-04 imagery from ISRO dated March 31, 2025, which shows that regional agencies already share such data. NEC said LOTUSat-1, a radar satellite built for Vietnam, was completed in 2024 with storm and climate monitoring as a stated purpose. Vendors can therefore offer smaller governments packaged imagery and training, and Oceania and Southeast Asia, with 16.4% of 2025 value, grows at 15.20% a year.
Opportunity in resource and ground-movement monitoring
Resource and ground-movement monitoring offers a second opening, because repeat radar measurement catches slow change that periodic site surveys can miss. SpaceNews reported that China's Ministry of Natural Resources backs the 36 Tiangang project led by Tianjin Satcom Geohe Technologies for disaster warning and resource monitoring. Mitsubishi Electric listed crustal deformation, landslide detection and forest management among ALOS-4 uses in August 2024. At ground level, Geomechanics.io reported in April 2026 that Orica launched a next-generation GroundProbe radar and LiDAR system from Melbourne for pits and tailings storage facilities. Together these point to recurring analytics revenue from miners and infrastructure owners, and Infrastructure and Resource Monitoring is expected to grow at 15.89% a year.
Launch risk and free data limit vendor margins
Launch failures can erase years of national planning
A single launch failure can remove a national capability for years, because government radar satellites are expensive and rarely have spares. The Week reported that PSLV-C61 lost the 1,696 kg EOS-09 on May 18, 2025, after a third-stage fault, which also delayed backup for EOS-04. India's border and coastal users bear most of that gap. Operators can reduce this exposure by splitting capacity across many smaller satellites and more than one launch provider.
Dependence on foreign launchers limits sovereignty goals
Sovereign programs still rely heavily on foreign launchers, which limits the independence those programs promise. Janes reported that South Korea's final Project 425 satellite flew on a SpaceX Falcon 9 from Florida as one of 18 payloads on Nov. 2, 2025. Via Satellite reported that iQPS has flown nine missions with Rocket Lab from New Zealand. Any disruption to those providers would delay revenue for operators, so buyers now treat launch access as a core program risk.
Free public data pressures commercial pricing
Free public radar data caps what commercial suppliers can charge for routine wide-area monitoring. Indian space agency chairman V Narayanan said in 2025 that NISAR data would be free to users worldwide, with releases every 12 days. Commercial operators selling resource and environmental imagery therefore face a low reference price from that source. Vendors can respond by selling what free missions lack, including higher resolution, faster tasking and finished analytics for defined customers.
Compressed schedules strain the regional supply chain
Compressed delivery schedules strain a thin supply chain of payloads and launch slots, and slips are common. Business Today reported in May 2025 that India sought to cut the SBS-3 timeline to between 12 and 18 months from four years. Spacenexus, using Launch Library 2 data, lists South Korea's radar satellite KOMPSAT-6 at no earlier than April 2027, with the date still unconfirmed. Suppliers with spare factory capacity gain an advantage when buyers accelerate programs.
East Asia dominates while South Asia catches up
| Region | Value, 2025 (USD billion) | Share, 2025 | CAGR, 2026–2035 |
|---|---|---|---|
| East Asia | 1.21 | 70.9% | 14.10% |
| Oceania and Southeast Asia | 0.28 | 16.4% | 15.20% |
| South Asia | 0.22 | 12.7% | 16.10% |
East Asia combines the largest budgets with domestic suppliers
East Asia held 70.9% of 2025 value and grows at 14.10% a year, with China, Japan and South Korea all operating domestic supply chains. SpaceWatch.Global reported that China launched almost 400 satellites in 2025, which shows the scale of its industrial base, while Yaogan 50 launches continued through Oct. 23, 2026, according to Gunter's Space Page, which marks the type as possibly radar. Japan adds the Tri-Sat program and commercial operators, and South Korea plans a fleet of about 40 satellites after Project 425.
South Asia grows fastest as India builds surveillance capacity
South Asia held 12.7% of 2025 value and grows at 16.10% a year, the fastest pace in the region. India drives this result, with Business Today reporting Cabinet Committee on Security approval of SBS-3 in October 2024 and Aaj Tak reporting in January 2026 a plan to launch all 52 satellites by 2029. NISAR, launched from Sriharikota in July 2025, adds a dual-frequency civil data source. The May 2025 EOS-09 loss also created replacement demand for C-band coverage.
Oceania and Southeast Asia buy capacity rather than whole fleets
Oceania and Southeast Asia held 16.4% of 2025 value and grow at 15.20% a year, mostly through shared capacity and single national missions. CSIRO holds a 10% share of NovaSAR-1 tasking time for Australia, according to its program page, and the Philippine DOST-ASTI controls a separate share. The Philippine Department of Science and Technology signed a maritime monitoring agreement with the National Security Council on May 19, 2021, for that satellite. NEC completed the LOTUSat-1 radar satellite for Vietnam in 2024, adding a national mission.
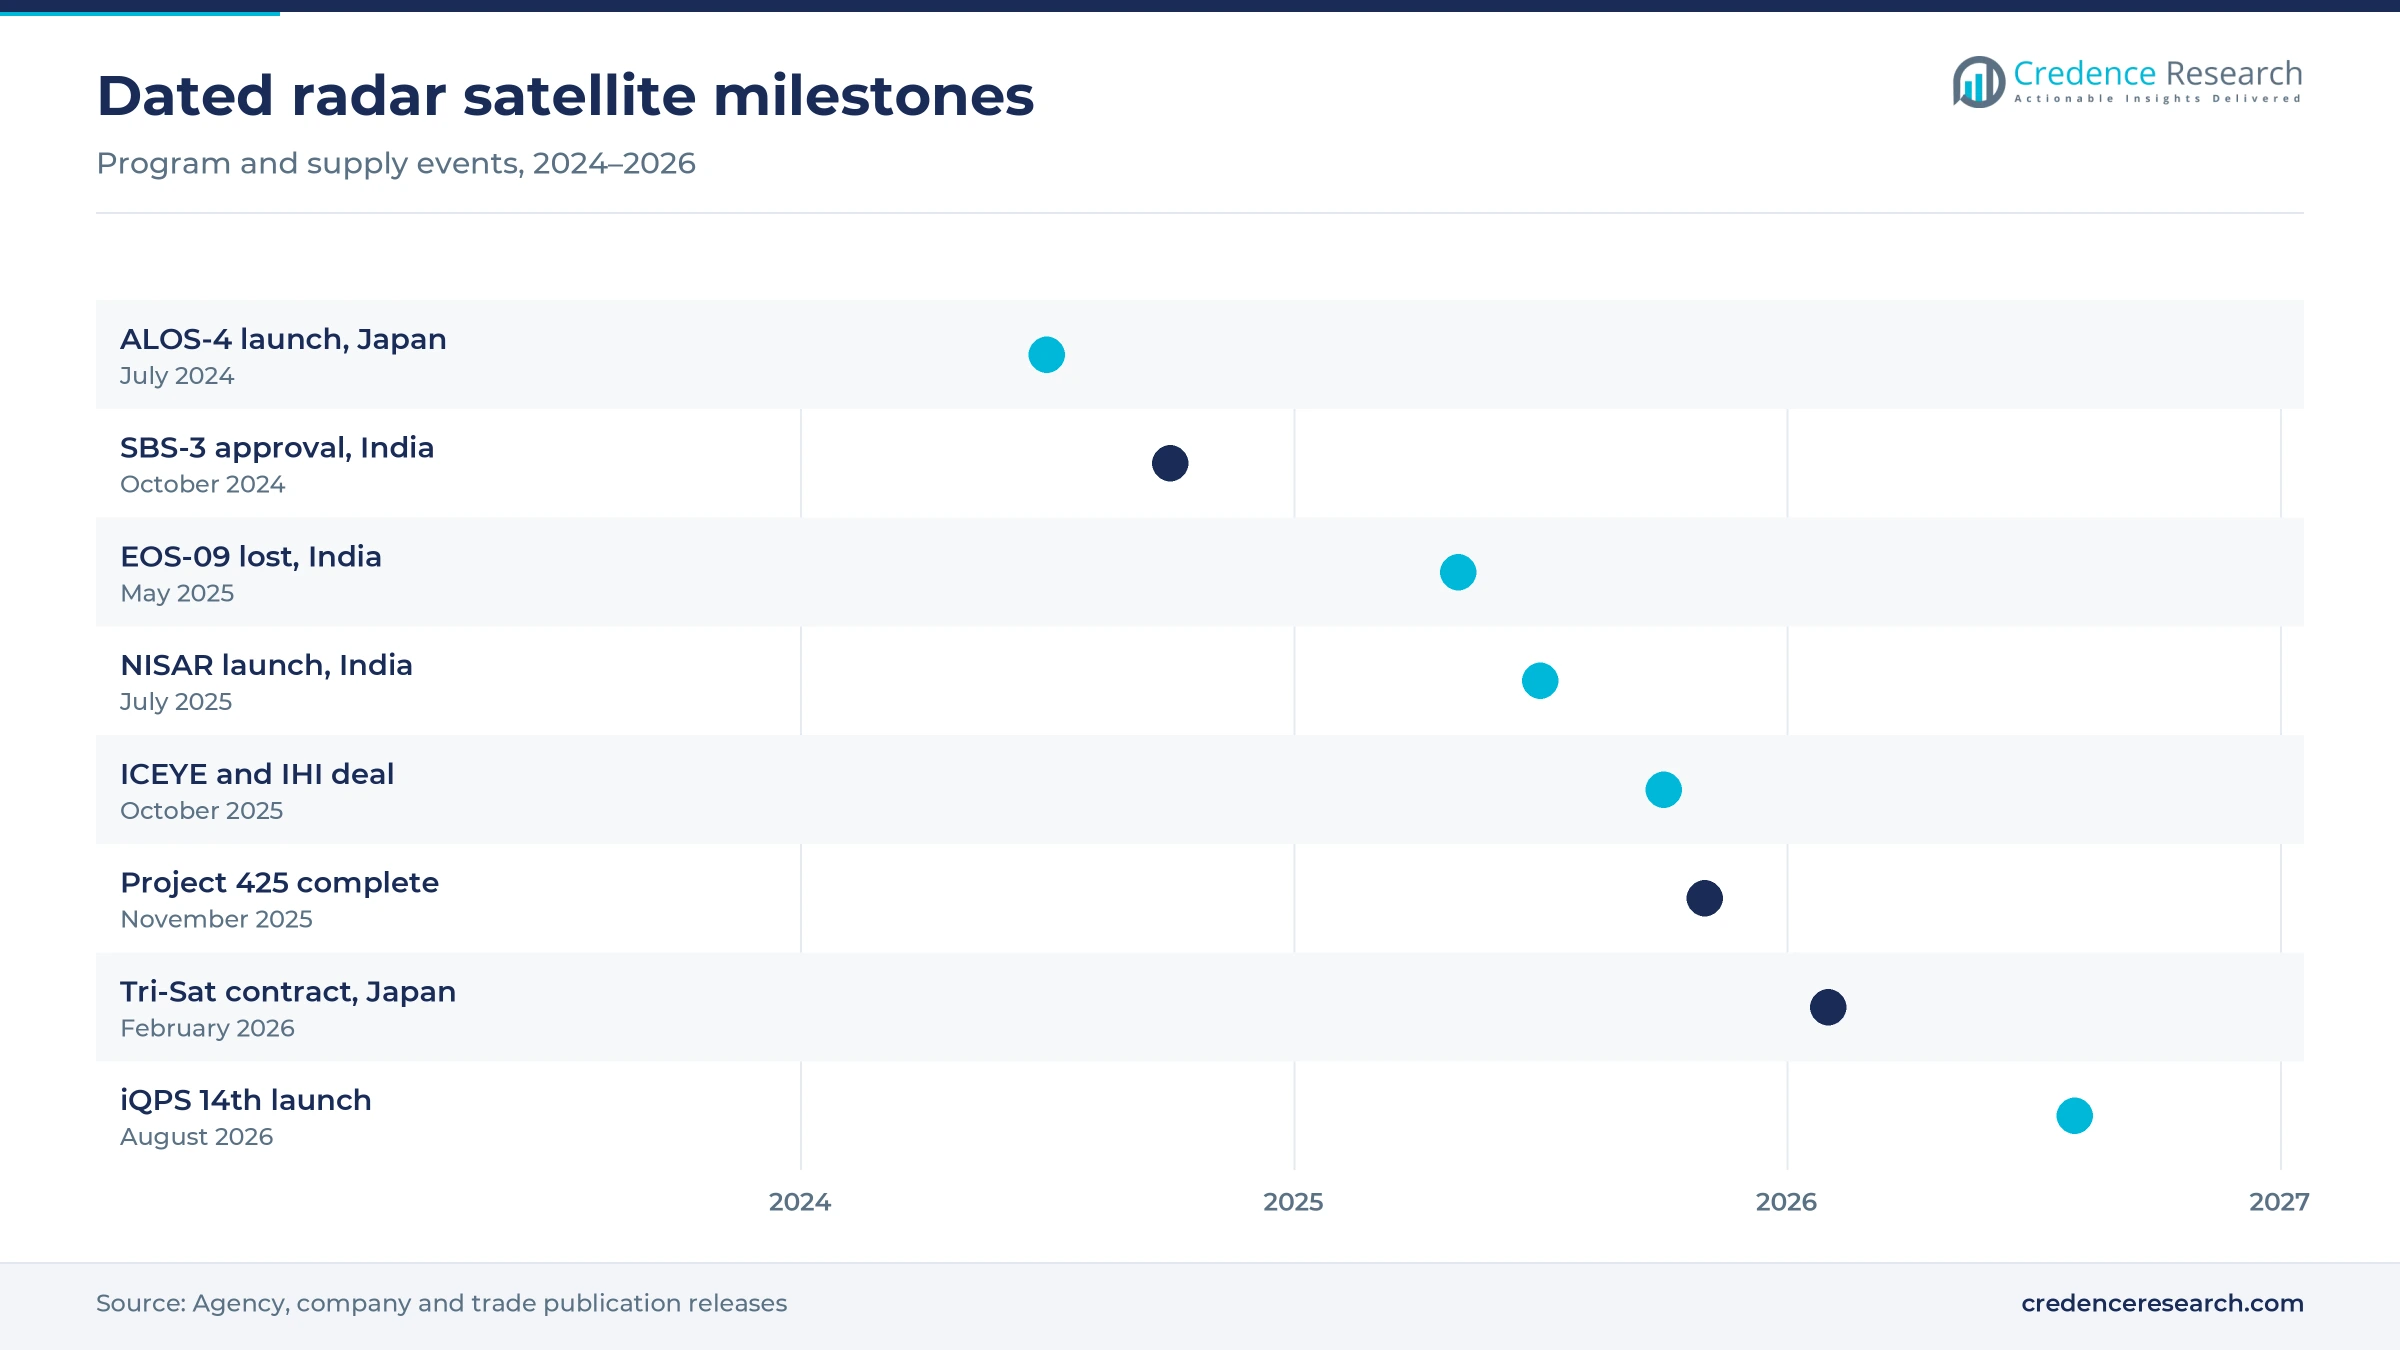
Dated contracts and launches since 2024
| Development | Status and market relevance |
|---|---|
| In July 2024, JAXA launched ALOS-4 on the third H3 rocket from Tanegashima, carrying the Mitsubishi Electric PALSAR-3 L-band radar. | First images came in August 2024, and the satellite now supports disaster and deformation monitoring. |
| In July 2025, ISRO and NASA launched NISAR on a GSLV-F16 from Sriharikota with L-band and S-band radars. | Its free data sets a public reference for routine monitoring products. |
| In October 2025, ICEYE and IHI agreed on four satellites with options for 20 more by fiscal 2029. | Two of the first four satellites are planned for assembly and testing in Japan. |
| In November 2025, South Korea launched the fifth and final Project 425 satellite on a Falcon 9. | Hanwha Systems supplied the radar payloads for four of the five satellites. |
| In February 2026, Japan's Ministry of Defense signed a five-year, JPY 283.1 billion contract with Tri-Sat Constellation. | Synspective provides radar data as a partner company through March 2031. |
Frequency and orbit choices decide each mission
- X-band systems deliver fine resolution for target identification, and PIESAT-1 uses this band for interferometric mapping from a four-satellite formation.
- L-band systems penetrate vegetation better, which explains their use on ALOS-4 and on the NISAR mission for forest and crustal monitoring.
- Geosynchronous radar trades resolution for persistence, since SpaceNews noted that radar at this altitude can give constant coverage, and China Aerospace Science and Technology Corporation's 2023 plan mentioned a high-orbit 20-meter radar satellite.
- Staring spotlight modes concentrate dwell time on one target, and Asia Times reported that a July 2024 Synspective test reached 25 cm azimuth resolution.
- AIS-equipped radar satellites match radar detections with ship identities, a capability the Philippine DOST described for NovaSAR-1 in maritime monitoring.
Need a Custom Version of This Report?
Tailor the scope, geography, or segments to your exact requirements.
- Custom geography or segment scope
- Direct access to our analyst team
State primes and small-satellite specialists compete
Competition for synthetic aperture radar work splits into state-linked primes, national champions and venture-backed constellation operators, and buyers rarely treat them as interchangeable. China's market is largely closed, with China Aerospace Science and Technology Corporation and its subsidiaries central to national programs. In Japan, Mitsubishi Electric builds government spacecraft and now leads the Tri-Sat consortium, while NEC exports its small radar design to Vietnam. South Korea relies on Hanwha Systems for radar payloads and Korea Aerospace Industries for platforms, building on earlier Thales Alenia Space technology transfer. Synspective and iQPS compete on unit cost and launch cadence, and ICEYE enters through local partners such as IHI. Contracts increasingly reward domestic content and proven delivery from orbit, so the strongest position belongs to suppliers that already have flying satellites and a local partner.
Companies profiled and their roles in this market
| Company | Type | Role in the market |
|---|---|---|
| China Aerospace Science and Technology Corporation | State prime | Announced the Ludi Tance-4 01 L-band satellite and launches national remote sensing missions |
| Mitsubishi Electric Corporation | Prime and integrator | Built ALOS-4 and PALSAR-3, and co-founded Tri-Sat Constellation for Japan's defense project |
| Hanwha Systems | Payload supplier | Supplied radar payloads for Project 425 satellites two through five and develops smaller SAR satellites |
| Korea Aerospace Industries | Platform supplier | Received Thales Alenia Space technology and components under Project 425 contracts |
| NEC Corporation | Satellite builder | Developed ASNARO-2 and completed the LOTUSat-1 radar satellite for Vietnam in 2024 |
| Thales Alenia Space | Technology partner | Provided radar payload technology and components to Korean firms under Project 425 |
| Synspective Inc. | Constellation operator | Operates StriX satellites, targets 30 by the late 2020s and supplies data for Japan's defense project |
| ICEYE | Constellation supplier | Agreed with IHI in October 2025 on a planned 24-satellite constellation for Japan |
| iQPS, Inc. | Constellation operator | Reached its 14th successful radar launch in August 2026 and targets 24 satellites by May 2028 |
Why sovereign demand will outlast the first wave
Credence Research's view is that sovereign demand for synthetic aperture radar will last beyond the first wave of fleets, because radar satellites wear out and adversaries keep moving. South Korea has barely finished Project 425 and is already planning about 40 more satellites, which suggests replacement and expansion will overlap. The more interesting question concerns which suppliers end up getting paid. Japan's Tri-Sat structure suggests that operators selling data may capture a growing portion of budgets once held by hardware primes. Vendors without flying satellites or a local partner will find it increasingly hard to enter these programs, and that shift could shape worldwide SAR demand as well.
Budgets and program records support the estimate
The report uses 2025 as the base year and 2035 as the forecast year, with growth stated for 2026–2035. Market values in this report come from the Credence Research model. Regional, segment and growth splits are Credence Research estimates informed by program announcements and public budget data. Sources include government budget documents, World Bank statistics, company releases, space agency pages and named trade publications that were reviewed for this edition. No interviews or surveys were conducted, and undisclosed Chinese program budgets remain the largest uncertainty in the estimate.
Fleet replacement becomes the next revenue cycle
The market should reach USD 6.68 billion by 2035, with growth of 14.55% a year during 2026–2035. Through 2029, spending should come mainly from fleets already announced, including India's SBS-3, Japan's constellation contract and the planned Korean fleet. Later years depend more on replacement cycles and on whether commercial operators can win recurring civil and enterprise work. South Asia should keep gaining share as Indian deliveries progress, although East Asia will still hold most of the value. The result to watch is whether data contracts replace satellite purchases or simply add to them.
Frequently Asked Questions
How big is the Asia-Pacific synthetic aperture radar market?
Which region leads the Asia-Pacific SAR market?
Which region is growing fastest?
Which solution type holds the largest share?
Who are the main customers for SAR in the region?
What is the most important recent change in procurement?
Why does free NISAR data matter to commercial vendors?
Which companies are active in the Asia-Pacific SAR market?
Table of Content
Chapter 1 Market Segmentation
- 1.1 Segmentation Framework
- 1.1.1 Product and Service Classification
- 1.1.2 Application and End-Use Classification
- 1.1.3 Technology and Solution Classification
- 1.1.4 Customer and Distribution Channel Classification
- 1.1.5 Geographic Segmentation
- 1.1.6 Market Segment Definitions and Boundaries
- 1.2 By Solution Type
- 1.2.1 Spaceborne SAR
- 1.2.2 Airborne SAR
- 1.2.3 Ground-Based SAR
- 1.3 By Customer Type
- 1.3.1 Military and Defence
- 1.3.2 Commercial Earth Observation
- 1.3.3 Civil Government
- 1.4 By Technology
- 1.4.1 X-Band SAR
- 1.4.2 L-Band SAR
- 1.4.3 Other-Band SAR
- 1.5 By Application
- 1.5.1 Security and Maritime Surveillance
- 1.5.2 Environmental and Disaster Monitoring
- 1.5.3 Infrastructure and Resource Monitoring
Chapter 2 Introduction
- 2.1 Report Objectives and Scope
- 2.2 Product Definition and Industry Terminology
- 2.3 Market Inclusions and Exclusions
- 2.4 Research Process
- 2.4.1 Primary Research and Expert Interviews
- 2.4.2 Secondary Research and Source Review
- 2.4.3 Top-Down and Bottom-Up Estimation
- 2.4.4 Data Triangulation and Verification
- 2.5 Market Size Measurement Basis
- 2.5.1 2025: USD 1.71 billion → 2035: USD 6.68 billion
- 2.6 Historical and Forecast Reference Periods
- 2.6.1 Historical Period: 2018-2025
- 2.6.2 Base Year: 2025
- 2.6.3 Forecast Period: 2025-2035
- 2.7 Research Assumptions and Limitations
Chapter 3 Executive Summary
- 3.1 Market Snapshot and Key Findings
- 3.2 Base-Year Market Size, 2025
- 3.3 Forecast Market Size, 2035
- 3.4 Revenue and Volume Growth Outlook
- 3.5 Key Demand and Supply Indicators
- 3.6 Leading Market Segments
- 3.7 Fastest-Growing Market Opportunities
- 3.8 Regional Performance Highlights
- 3.9 Technology and Industry Transformation
- 3.10 Competitive Landscape Summary
- 3.11 Analyst View and Strategic Implications
Chapter 4 Asia-Pacific Synthetic Aperture Radar Market Trends and Developments
- 4.1 Historical Industry Development, 2018-2025
- 4.2 Recent Market Trends and Developments
- 4.3 Demand and Customer Behavior Trends
- 4.4 Technology and Product Innovation
- 4.5 Artificial Intelligence, Automation and Digitalization
- 4.6 Local Manufacturing and Supply Chain Realignment
- 4.7 Industry Partnerships, Mergers and Acquisitions
- 4.8 Sustainability and Circular Economy Developments
- 4.9 Government and Private Sector Investment Trends
- 4.10 Emerging Business Models and Commercialization
- 4.11 Industry Developments and Announcements
Chapter 5 Asia-Pacific Synthetic Aperture Radar Market Production, Supply and Demand Analysis
- 5.1 Demand Trend and Consumption Analysis, 2018-2025
- 5.2 Demand Forecast, 2025-2035
- 5.3 Production and Output Trend, 2018-2025
- 5.4 Production and Output Forecast, 2025-2035
- 5.5 Installed Capacity and Capacity Utilization
- 5.6 Company-Wise Production Plants and Statistics
- 5.6.1 Installed Production Capacity
- 5.6.2 Actual Production
- 5.6.3 Planned Capacity and Expansion Targets
- 5.7 Supply Chain Structure and Procurement Trends
- 5.8 Supply-Demand Gap and Bottlenecks
- 5.9 Import Dependence and Sourcing Structure
- 5.10 Contract Manufacturing and Outsourcing
- 5.11 Regional Supply and Demand Concentration
Chapter 6 Asia-Pacific Synthetic Aperture Radar Market Pricing Analysis
- 6.1 Pricing Structure and Measurement
- 6.2 Historical Pricing Trends, 2018-2025
- 6.3 Pricing Outlook, 2025-2035
- 6.4 Average Selling Price and Unit Economics
- 6.5 Pricing by Product and Market Segment
- 6.6 Geographic Pricing Differences
- 6.7 Key Input, Energy, Labor and Logistics Costs
- 6.8 Contract Pricing and Purchasing Models
- 6.9 Pricing Sensitivity and Competitive Positioning
- 6.10 Price, Margin and Profitability Implications
Chapter 7 Asia-Pacific Synthetic Aperture Radar Market Dynamics
- 7.1 Market Growth Drivers
- 7.1.1 Demand-Side Drivers
- 7.1.2 Technology and Innovation Drivers
- 7.1.3 Infrastructure and Investment Drivers
- 7.1.4 Regulatory and Policy Drivers
- 7.2 Market Restraints
- 7.2.1 Cost and Affordability Constraints
- 7.2.2 Technology and Adoption Barriers
- 7.2.3 Supply Chain and Operational Constraints
- 7.3 Market Challenges
- 7.3.1 Competitive Pressure and Margin Erosion
- 7.3.2 Skills, Infrastructure and Implementation Gaps
- 7.4 Emerging Market Opportunities
- 7.5 Market Dynamics Impact and Time-Horizon Assessment
Chapter 8 Asia-Pacific Synthetic Aperture Radar Value Chain Analysis
- 8.1 Industry Value Chain Overview
- 8.2 Upstream Suppliers and Critical Inputs
- 8.3 Technology and Component Providers
- 8.4 Manufacturing or Service Delivery
- 8.5 Distribution, Channel Partners and Integrators
- 8.6 Downstream Applications and End Users
- 8.7 Value Addition and Profit Pools
- 8.8 Vertical Integration and Outsourcing
- 8.9 Supplier Concentration and Risk
- 8.10 Supply Chain Localization and Resilience
Chapter 9 Asia-Pacific Synthetic Aperture Radar Market Regulations and Policies
- 9.1 Relevant Laws, Standards and Compliance Frameworks
- 9.2 Product, Service, Safety and Quality Requirements
- 9.3 Government Policies, Incentives and Subsidies
- 9.4 Imports, Exports and Trade Barriers
- 9.5 Public Procurement and Local Content Requirements
- 9.6 Environmental and Sustainability Compliance
- 9.7 Upcoming Policy Changes and Market Implications
Chapter 10 Asia-Pacific Synthetic Aperture Radar Market Hotspots and Opportunities
- 10.1 Market Opportunity Mapping and Growth Hotspots
- 10.2 High-Growth Applications and Customer Groups
- 10.3 Underserved Markets and White-Space Opportunities
- 10.4 Emerging Technology and Product Opportunities
- 10.5 New Capacity and Investment Hotspots
- 10.6 Market Entry and Expansion Opportunities
- 10.7 Distribution and Partnership Opportunities
- 10.8 Near-Term and Long-Term Commercial Potential
- 10.9 Opportunity Attractiveness and Execution Risks
Chapter 11 Asia-Pacific Synthetic Aperture Radar Market Outlook, 2025-2035
- 11.1 Market Size and Analysis
- 11.1.1 Revenue (Market Measurement: 2025: USD 1.71 billion → 2035: USD 6.68 billion)
- 11.1.2 Market Volume and Quantity Sold
- 11.1.3 Historical Market Size, 2018-2025
- 11.1.4 Base-Year Market Size, 2025
- 11.2 Market Forecast, 2025-2035
- 11.2.1 Revenue Forecast to 2035
- 11.2.2 Volume Forecast to 2035
- 11.2.3 CAGR and Year-on-Year Growth
- 11.2.4 Incremental Revenue Opportunity
- 11.3 Forecast Assumptions and Scenario Analysis
- 11.3.1 Base-Case Forecast
- 11.3.2 Optimistic and Conservative Scenarios
- 11.3.3 Technology, Pricing and Policy Sensitivities
- 11.4 Market Attractiveness and Growth Outlook
Chapter 12 Asia-Pacific Synthetic Aperture Radar Market Segmentation and Outlook
- 12.1 Segmentation Summary and Market Shares, 2025
- 12.2 Largest and Fastest-Growing Segments
- 12.3 By Solution Type - Market Size and Forecast, 2025-2035
- 12.3.1 Segment Definition and Scope
- 12.3.2 Historical Market Size, 2018-2025
- 12.3.3 Revenue Forecast, 2025-2035
- 12.3.4 Volume Forecast, 2025-2035
- 12.3.5 Base-Year Market Share, 2025
- 12.3.6 Segment CAGR and Growth Drivers
- 12.3.7 Subsegment Market Size and Forecast
- 12.3.7.1 Spaceborne SAR
- 12.3.7.2 Airborne SAR
- 12.3.7.3 Ground-Based SAR
- 12.3.8 Subsegment Pricing and Adoption Trends
- 12.3.9 Leading Suppliers and Competition
- 12.3.10 Regional Demand and Opportunities
- 12.4 By Customer Type - Market Size and Forecast, 2025-2035
- 12.4.1 Segment Definition and Scope
- 12.4.2 Historical Market Size, 2018-2025
- 12.4.3 Revenue Forecast, 2025-2035
- 12.4.4 Volume Forecast, 2025-2035
- 12.4.5 Base-Year Market Share, 2025
- 12.4.6 Segment CAGR and Growth Drivers
- 12.4.7 Subsegment Market Size and Forecast
- 12.4.7.1 Military and Defence
- 12.4.7.2 Commercial Earth Observation
- 12.4.7.3 Civil Government
- 12.4.8 Subsegment Pricing and Adoption Trends
- 12.4.9 Leading Suppliers and Competition
- 12.4.10 Regional Demand and Opportunities
- 12.5 By Technology - Market Size and Forecast, 2025-2035
- 12.5.1 Segment Definition and Scope
- 12.5.2 Historical Market Size, 2018-2025
- 12.5.3 Revenue Forecast, 2025-2035
- 12.5.4 Volume Forecast, 2025-2035
- 12.5.5 Base-Year Market Share, 2025
- 12.5.6 Segment CAGR and Growth Drivers
- 12.5.7 Subsegment Market Size and Forecast
- 12.5.7.1 X-Band SAR
- 12.5.7.2 L-Band SAR
- 12.5.7.3 Other-Band SAR
- 12.5.8 Subsegment Pricing and Adoption Trends
- 12.5.9 Leading Suppliers and Competition
- 12.5.10 Regional Demand and Opportunities
- 12.6 By Application - Market Size and Forecast, 2025-2035
- 12.6.1 Segment Definition and Scope
- 12.6.2 Historical Market Size, 2018-2025
- 12.6.3 Revenue Forecast, 2025-2035
- 12.6.4 Volume Forecast, 2025-2035
- 12.6.5 Base-Year Market Share, 2025
- 12.6.6 Segment CAGR and Growth Drivers
- 12.6.7 Subsegment Market Size and Forecast
- 12.6.7.1 Security and Maritime Surveillance
- 12.6.7.2 Environmental and Disaster Monitoring
- 12.6.7.3 Infrastructure and Resource Monitoring
- 12.6.8 Subsegment Pricing and Adoption Trends
- 12.6.9 Leading Suppliers and Competition
- 12.6.10 Regional Demand and Opportunities
- 12.7 Segment Growth Comparison
- 12.8 Segment Attractiveness and Priority Matrix
Chapter 13 Asia-Pacific Synthetic Aperture Radar End-Use and Application Market Outlook
- 13.1 End-Use Industry and Customer Demand Structure
- 13.2 Leading Applications and Customer Groups
- 13.3 End-Use Market Size, Share and Forecast
- 13.4 Major End-Use Industry Deep Dives
- 13.4.1 Customer Requirements and Use Cases
- 13.4.2 Demand and Replacement Cycles
- 13.4.3 Technical and Regulatory Considerations
- 13.4.4 Purchasing and Procurement Models
- 13.4.5 Leading Vendors and Distribution Channels
- 13.4.6 Forecast and Commercial Opportunities
- 13.5 Emerging Applications and Cross-Segment Demand
- 13.6 End-Use Industry Investment Priorities
Chapter 14 Asia-Pacific Synthetic Aperture Radar Geographic Market Outlook, 2025-2035
- 14.1 Regional Market Size and Country-Level Shares, 2025
- 14.2 Country Market Size Comparison, 2025
- 14.3 Country Market Forecasts, 2025-2035
- 14.4 Subregional Industrial and Demand Clusters
- 14.5 Intra-Regional Pricing and Cost Differences
- 14.6 Cross-Border Trade and Supply Networks
- 14.7 Regional Supply and Demand Balances
- 14.8 Country Opportunity Comparison and Prioritization
Note: Every listed country is covered on the structure shown under the first country.
Chapter 15 Asia-Pacific Synthetic Aperture Radar Technology, Innovation and Sustainability Outlook
- 15.1 Technology Landscape and Maturity
- 15.2 Product, Process and Service Innovation
- 15.3 AI, Automation and Digital Tools in the Industry
- 15.4 Technology Adoption and Performance Benchmarking
- 15.5 Innovation Pipeline and R&D Investment
- 15.6 Patent and Intellectual Property Trends
- 15.7 Energy Efficiency and Resource Management
- 15.8 Sustainability, Recycling and Circularity
- 15.9 Technology Roadmap, 2025-2035
- 15.10 Risks of Obsolescence and Technology Substitution
Chapter 16 Asia-Pacific Synthetic Aperture Radar Market Key Strategic Imperatives
- 16.1 Growth and Market Entry Priorities
- 16.2 High-Return Products and Segments
- 16.3 Pricing, Profitability and Cost Optimization
- 16.4 Technology Investment and Product Differentiation
- 16.5 Supply Chain Localization and Resilience
- 16.6 Distribution and Customer Acquisition
- 16.7 Partnership, Acquisition and Capacity Strategy
- 16.8 Regional Expansion Priorities
- 16.9 Short-, Medium- and Long-Term Actions
Chapter 17 Competition Outlook
- 17.1 Industry Competition Characteristics
- 17.2 Market Structure and Concentration
- 17.3 Market Share and Competitive Positioning, 2025
- 17.4 Company-Wise Revenue and Product Benchmarking
- 17.5 Production and Service Capacity Benchmarking
- 17.6 Technology, Pricing and Differentiation
- 17.7 Regional Footprint and Distribution Strength
- 17.8 Mergers, Acquisitions and Strategic Alliances
- 17.9 New Entrants and Competitive Threats
- 17.10 Porter's Five Forces and Industry Attractiveness
- 17.11 Competitive Outlook, 2025-2035
Chapter 18 Company Profiles
- 18.1 Company Coverage and Selection Criteria
- 18.2 China Electronics Technology Group Corporation
- 18.2.1 Business Description
- 18.2.2 Company Ownership and Geographic Presence
- 18.2.3 Product and Service Portfolio
- 18.2.4 Manufacturing and Operating Footprint
- 18.2.5 Production Capacity and Expansion Plans
- 18.2.6 Financial Performance and Investment
- 18.2.7 Market Share and Competitive Position
- 18.2.8 Technology and Innovation Capabilities
- 18.2.9 Strategic Alliances or Partnerships
- 18.2.10 Recent Developments
- 18.2.11 Growth Strategy and Outlook
- 18.3 China Aerospace Science and Technology Corporation
- 18.4 Mitsubishi Electric Corporation
- 18.5 Hanwha Systems
- 18.6 Korea Aerospace Industries
- 18.7 NEC Corporation
- 18.8 Thales Alenia Space
- 18.9 Synspective Inc.
- 18.10 ICEYE
- 18.11 iQPS, Inc.
- 18.12 Other Relevant Market Participants
Note: Every listed company is profiled on the structure shown under the first company. The company list is preliminary and may change based on research findings, market developments, data availability and client requirements.
Chapter 19 Disclaimer
- 19.1 Research and Forecast Disclaimer
- 19.2 Data Source and Estimation Limitations
Note: The depth of individual sections depends on data availability for this market. Volume, capacity, trade and other unit-based metrics are included where applicable.

