
Redback orders move vehicle self-defense into production
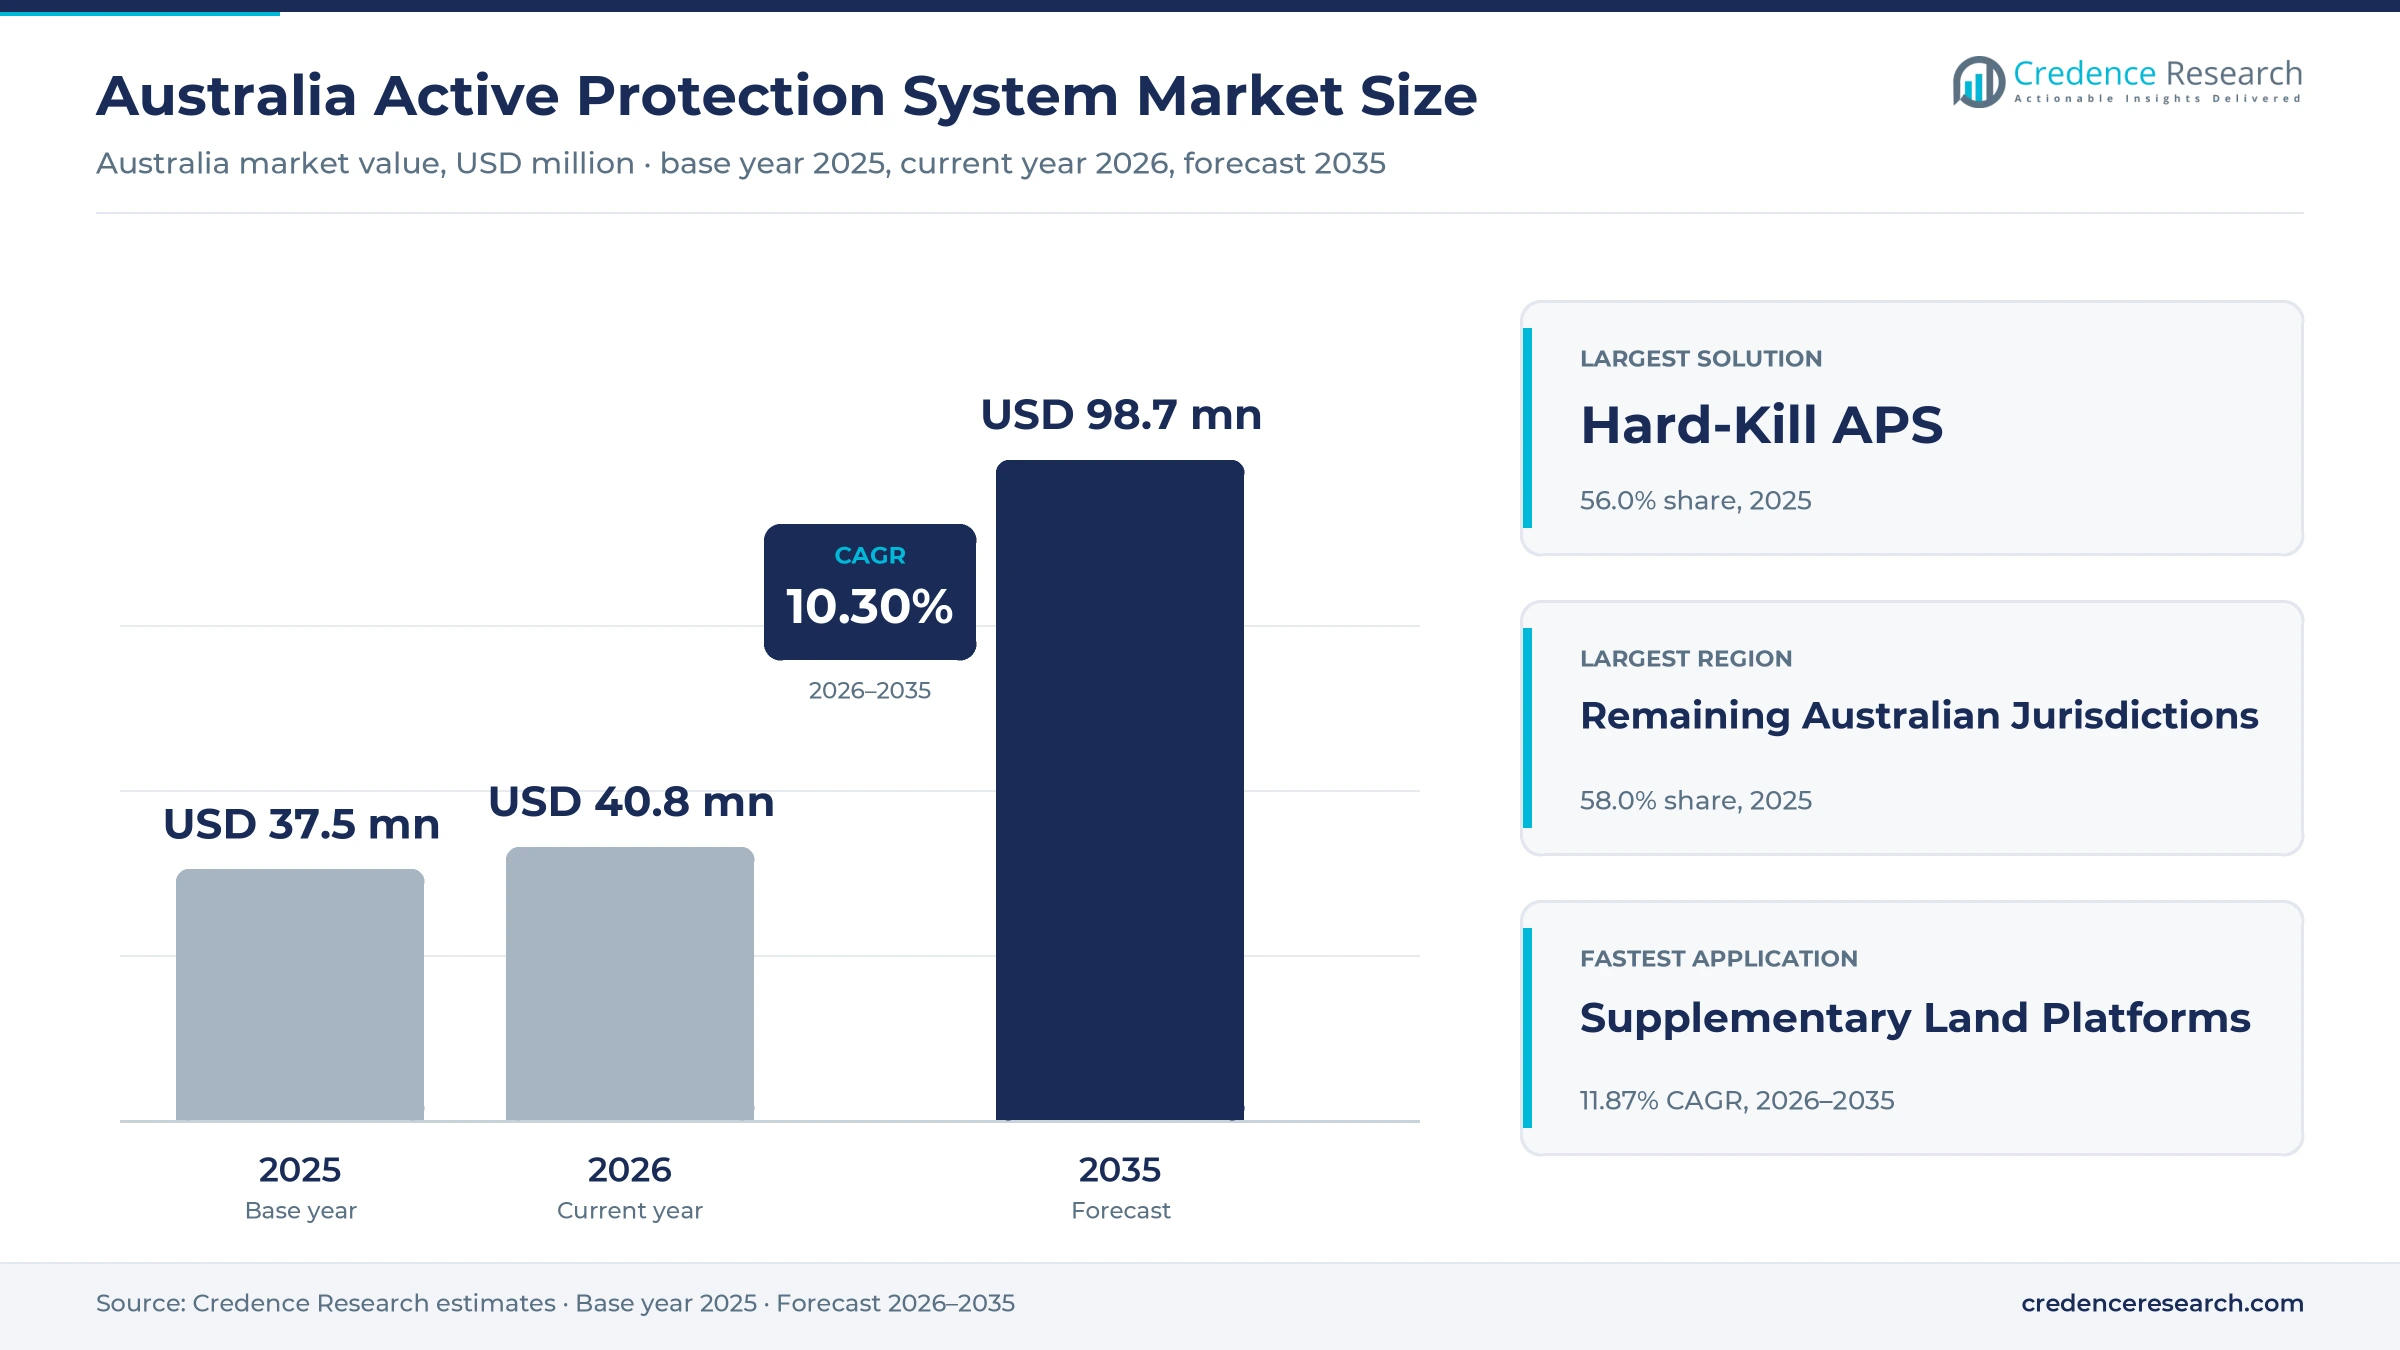
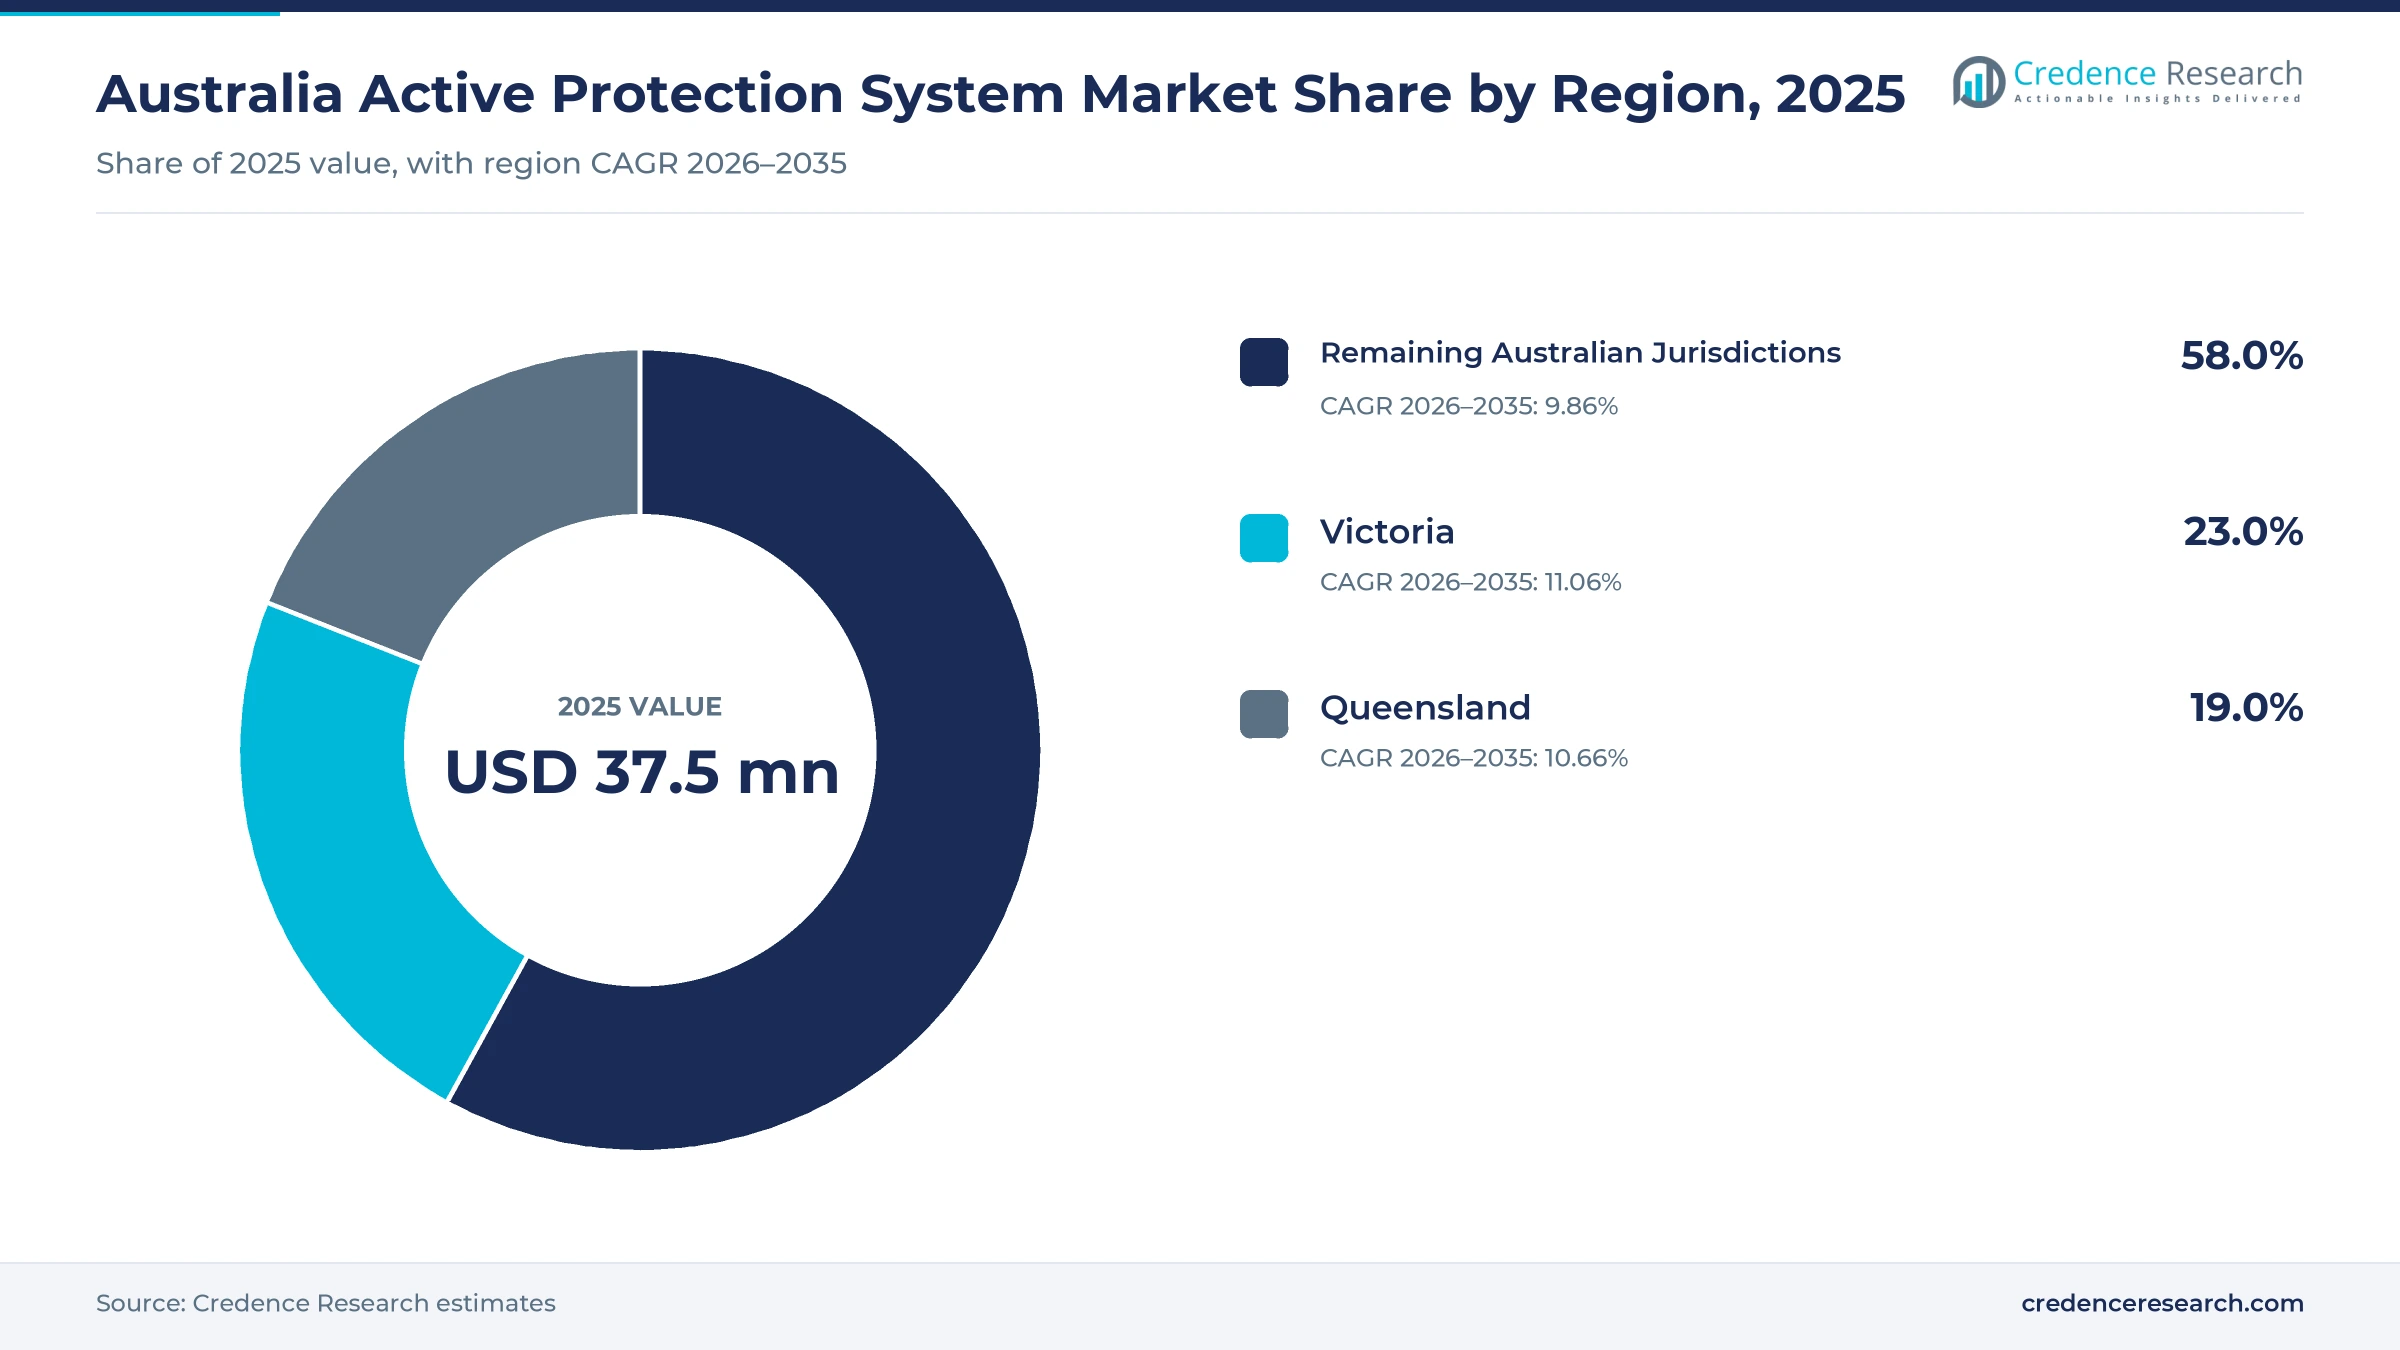
The Australia active protection system market was valued at USD 37.5 million in 2025 and is projected to increase from USD 40.8 million in 2026 to USD 98.7 million by 2035, registering a CAGR of 10.30% during 2026–2035. Demand comes from the Australian Army, which is replacing M113AS4 carriers with Redback infantry fighting vehicles built near Geelong, and from Royal Australian Air Force transport and tanker fleets fitted with laser-based missile countermeasures. Remaining Australian Jurisdictions held the largest regional share, 58.0% in 2025, because New South Wales, the Australian Capital Territory, South Australia and Western Australia together host a wide spread of defense suppliers and air bases. Victoria is the fastest-growing region at 11.06% a year as Redback assembly ramps up at Avalon. The Australian National Audit Office reported in March 2026 that certification of the active protection fit on the Redback had been deferred, which makes test scheduling the main commercial variable through 2028.
What does an active protection system purchase cover in Australia?
An active protection system detects an incoming missile, rocket or drone and defeats it by firing an interceptor, jamming its guidance or cueing the crew. Australian buyers rarely purchase these units as standalone items, since they arrive inside turret packages, vehicle programs or aircraft self-protection cases. The market value counts hardware, integration engineering, test work and recurring support attributed to those contracts.
The market excludes passive and reactive armor, the vehicle hull, main weapons and fixed-site air defense batteries. Its value chain runs from foreign system originators, through the vehicle primes and local electronics suppliers, to Army and Air Force fleet managers who fund sustainment across the life of each platform.
Australia Active Protection System Market Insights
- The Australia active protection system market rises from USD 37.5 million in 2025 to USD 98.7 million by 2035, expanding at a 10.30% CAGR over 2026–2035 as new armored fleets arrive.
- Remaining Australian Jurisdictions held 58.0% of market value in 2025, while Victoria is the fastest-growing region at 11.06% a year on Redback assembly work.
- Hard-Kill APS led with 56.0% of 2025 value because the Redback turret package names the Iron Fist interceptor system as standard equipment.
- Australia committed up to AUD 7 billion to counter-drone capability in April 2026, which more than doubles earlier funding and widens demand for lighter soft-kill vehicle kits.
- Elbit Systems anchors the supply chain through its USD 600 million Redback contract of February 2024, with Hanwha Defense Australia controlling integration as the vehicle prime contractor.
Hard-kill suites lead as soft-kill spending accelerates
Why do hard-kill suites hold the largest solution share?
Based on solution type, the market is categorized into Hard-Kill APS, Soft-Kill APS and APS-Coupled Protection Integration. Hard-Kill APS led with 56.0% of 2025 value because Iron Fist, an interceptor system, sits inside the USD 600 million Elbit package for the Redback, according to Janes in February 2024. Soft-Kill APS grows fastest at 11.22% a year as Thales Australia tested a Dedrone radio-frequency kit on a moving Bushmaster in March 2025, according to The Defense Post. Integration work follows the turret, since Australian Defence Magazine reported that the Redback turret was designed around the system.
How do vehicle fleets and aircraft split protection demand?
Based on application, the market is categorized into Infantry Fighting Vehicles, Combat Reconnaissance Vehicles, Supplementary Land Platforms and Military Aircraft. Infantry Fighting Vehicles led with 41.0% of 2025 value because the Redback package is the only Australian interceptor order with a published value. Supplementary Land Platforms grows fastest at 11.87% a year as the April 2026 order for 268 Bushmasters, worth AUD 750 million according to Army Recognition, adds counter-drone integration and Abrams tanks are understood to be provisioned for later fitting. Aircraft demand ties to military aircraft modernization and a USD 122 million laser countermeasure case approved in February 2022.
Which Australian buyers fund active protection most heavily?
Based on end user, the market is categorized into Australian Army, Royal Australian Air Force and Joint Defence Organisations. Australian Army led with 77.0% of 2025 value because it operates the Redback, Boxer and Abrams fleets, with 36 tanks already in one Townsville squadron, according to Asian Military Review in May 2025. Joint Defence Organisations grows fastest at 12.32% a year as the Advanced Strategic Capabilities Accelerator had committed AUD 37.4 million under Mission Syracuse by July 2026, according to Defence Connect. The Air Force share rests on C-17A, KC-30A and C-130J fleets using laser countermeasures.
How do protection suppliers reach Australian buyers?
Based on sales channel, the market is categorized into Vehicle Prime Subcontracts, Government-to-Government Procurement and Direct Defence Contracts. Vehicle Prime Subcontracts led with 55.0% of 2025 value because Elbit sells through Hanwha Defense Australia, the prime that holds a contract first valued at AUD 4.63 billion. Foreign military sales carry aircraft kits, including 27 processor replacements approved in February 2022. Direct Defence Contracts grows fastest at 11.11% a year as Canberra now contracts developers directly, such as the AUD 5.7 million award to Electro Optic Systems reported by Defence Connect in July 2026.
| Segment Group | Leading Sub-segment | Share, 2025 | Fastest-growing Sub-segment | CAGR, 2026–2035 |
|---|---|---|---|---|
| By Solution Type | Hard-Kill APS | 56.0% | Soft-Kill APS | 11.22% |
| By Application | Infantry Fighting Vehicles | 41.0% | Supplementary Land Platforms | 11.87% |
| By End User | Australian Army | 77.0% | Joint Defence Organisations | 12.32% |
| By Sales Channel | Vehicle Prime Subcontracts | 55.0% | Direct Defence Contracts | 11.11% |
Request a Free Sample
Fill in your details and we'll send you a free sample report.
- Sample data tables & charts
- Research methodology
Redback work, local plants and support contracts lift demand
Redback program mobilization funds the first interceptor fleet
Redback program mobilization is the largest single source of demand because it puts an interceptor system on a whole Army fleet for the first time. Elbit Systems won a USD 600 million contract from Hanwha Defense Australia in February 2024, covering Iron Fist, laser warning and sensors for the Redback over five years, on a fleet of 129 vehicles under the Commonwealth contract. The Australian National Audit Office recorded approved project spending of AUD 7.3 billion at February 2026, with first delivery scheduled for 2027 and final delivery for December 2028. The vehicles replace M113AS4 carriers, so they raise the protection standard across armored vehicles in the combat brigades. As a result, Infantry Fighting Vehicles held 41.0% of 2025 value in the Credence Research estimate, even before the first vehicle arrives.
Domestic integration sites anchor test and assembly work
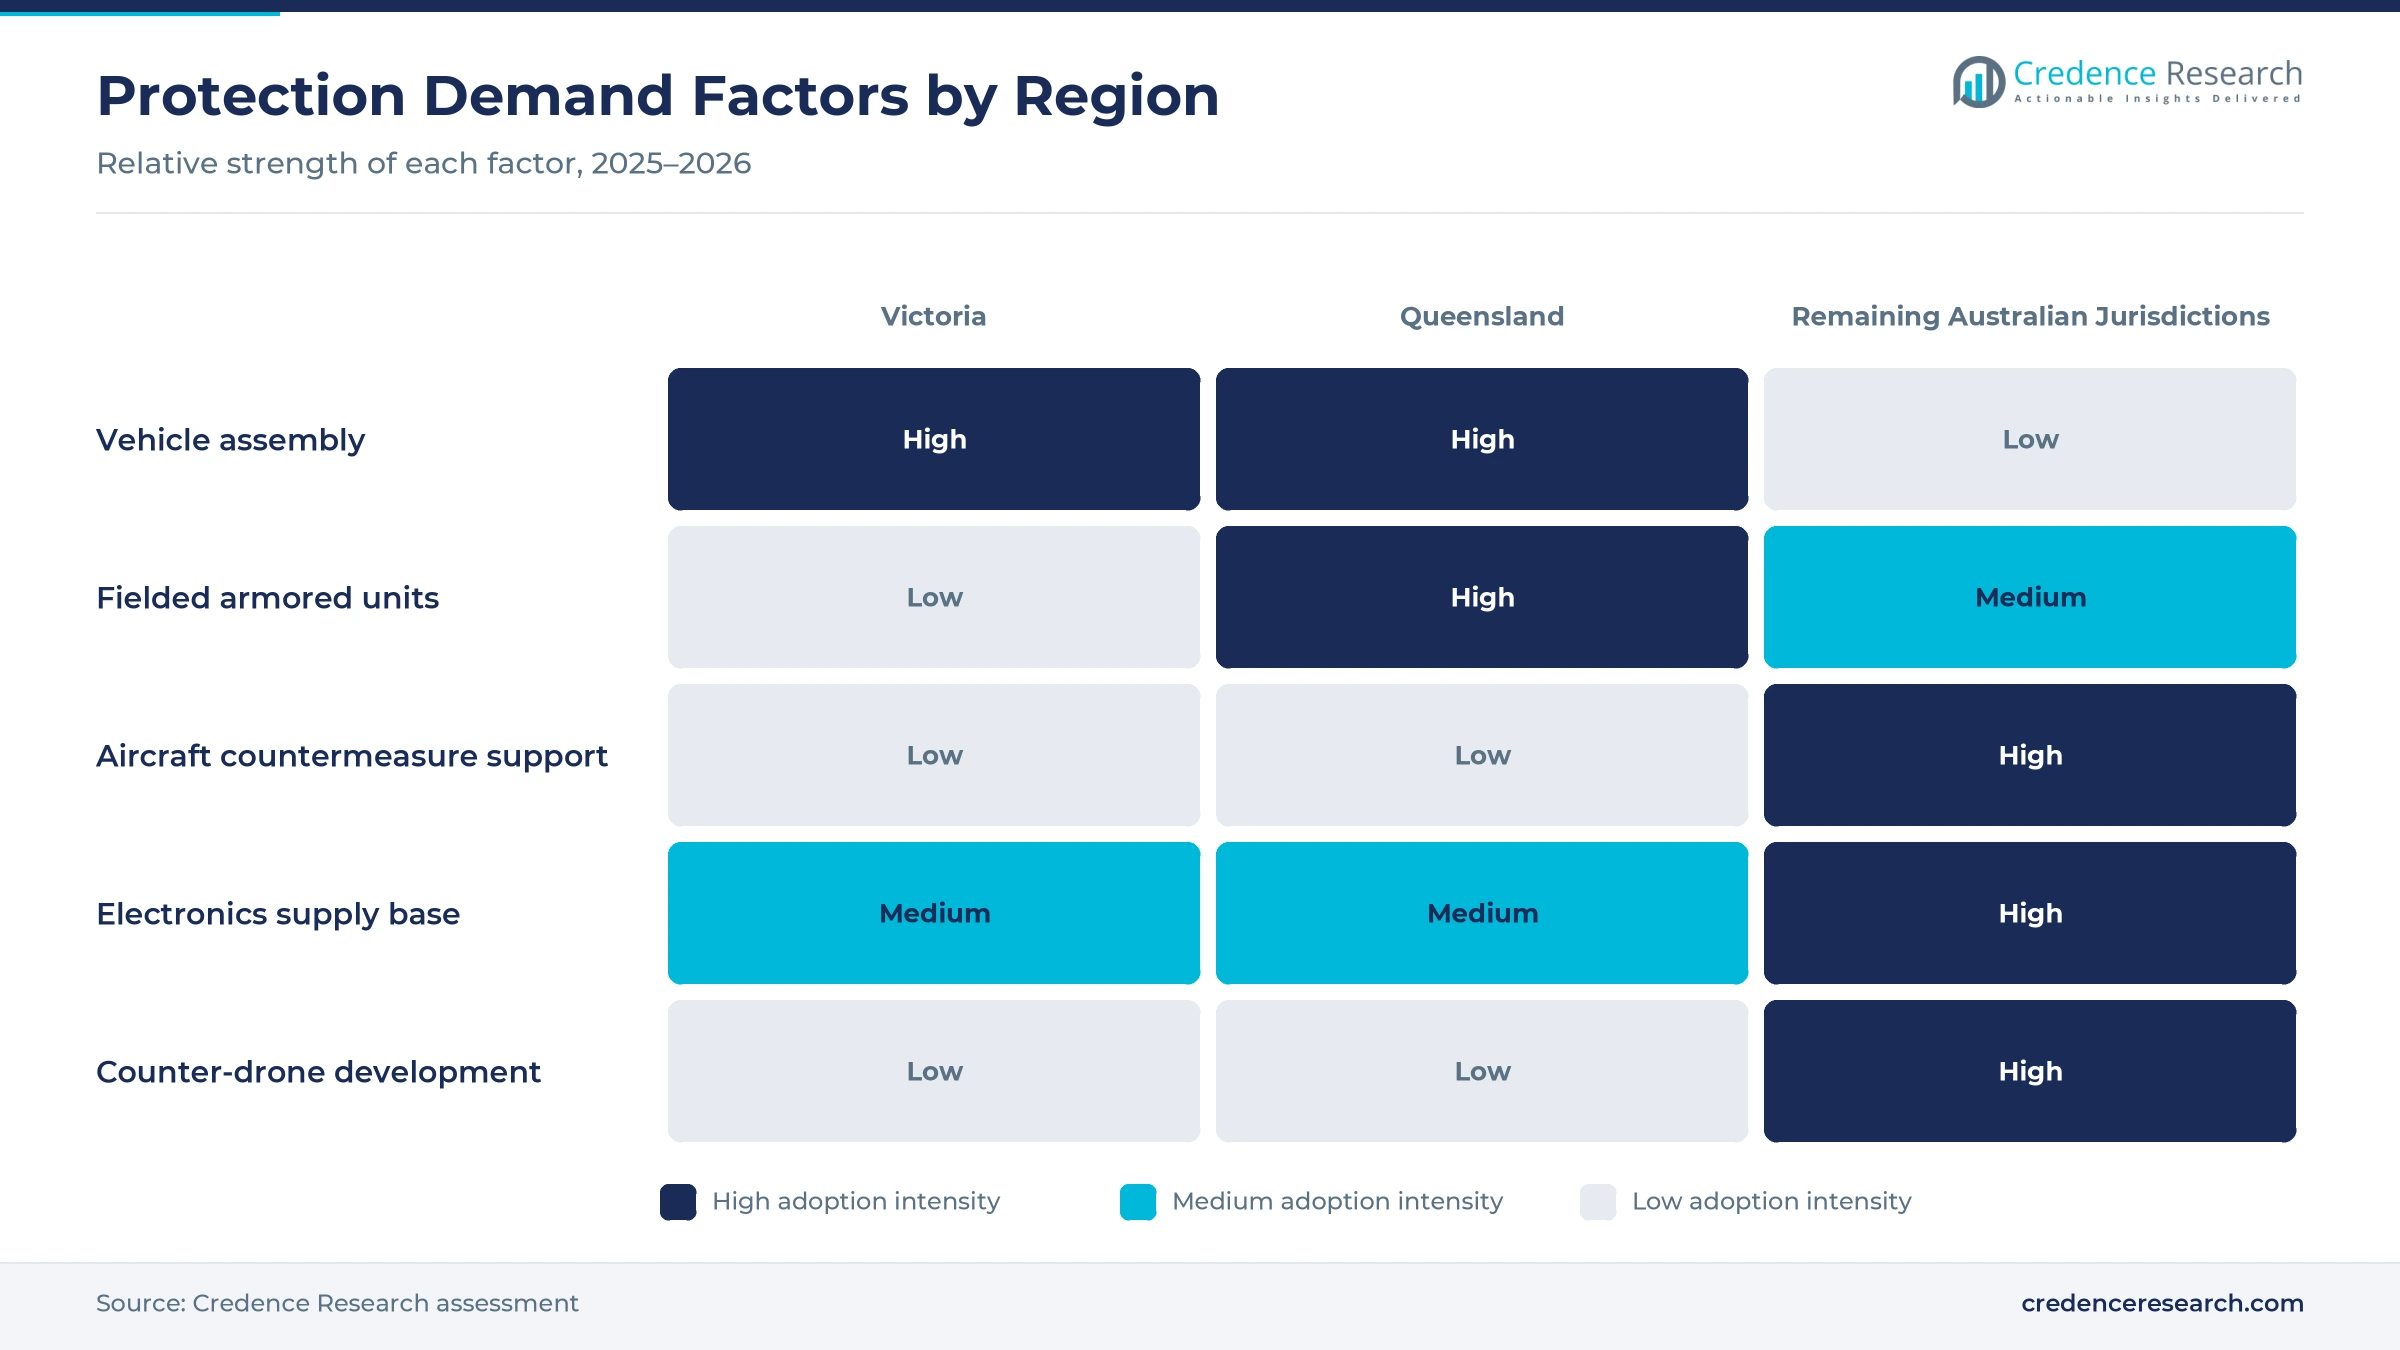
Domestic integration infrastructure keeps protection work in Australia, because turrets and sensors must be fitted and tested where the hulls are built. The Victorian government put the Avalon plant of Hanwha at AUD 225 million in February 2026, and Shephard reported in March 2025 that Stage Two and the Redback line would open during 2026. Queensland offers a second site, since the Queensland Treasury describes the Redbank plant of Rheinmetall as an 11-hectare precinct with a 30,000 square meter manufacturing building. Rheinmetall stated in April 2024 that more than 650 skilled workers were employed there. In turn, Victoria gains the most from assembly work, while local firms such as REDARC build Redback control units at Lonsdale, according to Australian Manufacturing in April 2026.
Recurring support contracts extend revenue beyond delivery
Recurring protection support matters because a fielded system needs repair, software updates and test equipment long after acceptance. The Department of Defence puts Redback spending at about AUD 7 billion for the whole project, with about AUD 4.5 billion of that covering acquisition and initial support contracts. The national auditor also noted a separate Hanwha support contract with an operative date of August 2028. Air Force practice shows the pattern, since a Northrop Grumman plan published by the Department of Defence describes a laser countermeasure sustainment contract worth about AUD 140 million. Elbit also holds a AUD 9 million thermal imaging repair contract, according to Defence Connect in June 2024. Consequently, support work steadies demand between production peaks across the 2026–2035 forecast period.
Counter-drone funding pulls soft-kill kits onto vehicles
Counter-drone funding has become a separate driver because first-person-view drones now threaten vehicles that interceptor suites were never bought to cover. Defence Connect reported on April 21, 2026, that Canberra would invest up to AUD 7 billion in counter-drone capability over a decade, more than doubling earlier funding. That sum sits within a commitment of up to AUD 22 billion for drones and autonomous systems. LAND 156 adds AUD 1.3 billion over a decade, with Leidos Australia as systems integration partner, according to Defence Industry Europe in August 2025. Wider budgets support the trend, since the World Bank shows Australian military spending at 1.92% of GDP in 2025, up from 1.86% in 2023. Consequently, Soft-Kill APS is the fastest solution at 11.22% a year.
Drone threats widen protection beyond heavy vehicles
Shift toward drone defense on protected mobility vehicles
Protection is shifting from heavy combat vehicles toward lighter trucks, because drones now reach units that never carried interceptors. Thales Australia tested Dedrone equipment on a Bushmaster near its Bendigo plant, with the system recognizing more than 200 drone types while moving, according to The Defense Post in March 2025. Militarnyi, citing ABC News, reported that the Army fleet had not yet received such protection at that time. The April 2026 Bushmaster order then added reinforced roof mounts and counter-drone integration, according to Army Recognition, with Bendigo production of about 50 vehicles a year starting in 2027. This work overlaps with electronic warfare spending, since radio-frequency detection and jamming share the same sensors and trained operators.
Rise of turrets designed around protection from the start
Buyers are moving away from aftermarket fitting toward turrets designed around protection, because retrofits add weight and integration risk later. Australian Defence Magazine reported in November 2022 that the Redback turret, based on the Elbit MT30, was designed to integrate Iron Fist rather than add it as an aftermarket item. Weight drives the same logic, since Army Recognition reported in January 2019 that Iron Fist was the only mature system meeting the 38.5-ton Boxer limit, for 121 Block II vehicles. The national audit then noted a Remote Weapon Station integration risk rated Extreme, later downgraded to High, when a mandated item arrived late. Accordingly, Vehicle Prime Subcontracts holds 55.0% of 2025 value, since primes now own these design decisions.
Opportunity in fitting Abrams and Boxer fleets after Redback
Later fleet fits offer the clearest opening for suppliers, because about 260 further combat vehicles have no publicly confirmed interceptor order. Australia approved up to 75 M1A2 SEPv3 Abrams tanks in January 2022, and Asian Military Review reported in May 2025 that they are understood to be provisioned for a later active protection fit. Australian Defence Business Review suggested Rafael Trophy as one possible route through United States Army adoption. The Department of Defence also lists 186 Block II Boxers in testing, production and delivery as of March 2026, and the same review said the Army directed Rheinmetall in 2019 to integrate Iron Fist. Therefore, Supplementary Land Platforms is the fastest application at 11.87% a year.
Opportunity for Australian suppliers in export-linked production
Export-linked production gives local firms an opening, because a qualified supplier can sell into overseas vehicle orders from an Australian line. Rheinmetall signed for 123 Boxer heavy weapon carriers at Redbank in April 2024, with more than 100 going to Germany, and the Queensland Treasury values the export agreement at AUD 1 billion. Australian Defence Magazine reported that Hanwha and Elbit agreed to support the Redback turret for the global market, while the Victorian government reported AUD 2.1 million in grants to 29 small firms joining the Hanwha supply chain by February 2026. Electro Optic Systems also draws on more than 100 Australian manufacturers, according to Defence Industry Europe. Accordingly, Queensland holds 19.0% of 2025 value and grows at 10.66% a year.
Certification, export controls and budget timing slow orders
Deferred certification adds risk to Redback timing
Certification is the most immediate risk, because the Australian National Audit Office reported in March 2026 that active protection system certification had been deferred. Independent reviewers told the auditor that delivering every vehicle fully capable by the end of 2028 would be a significant, if not impossible, challenge. Elbit and Hanwha therefore face compressed test windows, and Army units may accept vehicles before the full suite is cleared. Earlier live-fire trials on production vehicles would reduce that exposure for both companies.
American export controls limit local repair content
Export controls limit how much protection work can move to Australia, which affects both local suppliers and support costs. A Northrop Grumman plan published by the Department of Defence states that ITAR restrictions offer limited opportunities for Australian participation in the AUD 140 million laser countermeasure program. The named local site is RAAF Base Edinburgh, so most deep repair stays offshore. Consequently, Air Force fleets depend on foreign turnaround times, although closer alliance licensing could gradually widen the local share.
Supplier politics draw attention to Israeli-origin systems
Political scrutiny adds reputational risk, because the leading interceptor originates with an Israeli supplier during a contested public debate. Defence Connect reported on June 11, 2024, that Minister Pat Conroy rejected calls to stop contracting with such firms after the Greens cited 66 active export permits. Policy has not changed, yet future tranches could attract parliamentary questions and protests at supplier sites. Greater Australian assembly content could ease that pressure, and it would also support the sovereign capability case made to government.
Backloaded budgets and thin skills delay new fits
Budget phasing can delay fits on later fleets, since ASPI reported in May 2026 that capability acquisition fell by AUD 724 million in the 2026–27 budget. Growth then arrives from 2027–28, so optional upgrades compete with other programs that remain unapproved. Skills add pressure, because the Australian Bureau of Statistics counted 63,500 defense industry employees in 2024–25, down 2.6% in a year. Smaller suppliers feel this most, and shared training programs offer partial relief.
Army and industry sites outside two states hold most value
| Region | Value, 2025 (USD million) | Share, 2025 | CAGR, 2026–2035 |
|---|---|---|---|
| Remaining Australian Jurisdictions | 21.8 | 58.0% | 9.86% |
| Victoria | 8.6 | 23.0% | 11.06% |
| Queensland | 7.1 | 19.0% | 10.66% |
Remaining Australian Jurisdictions hold the broadest supplier base
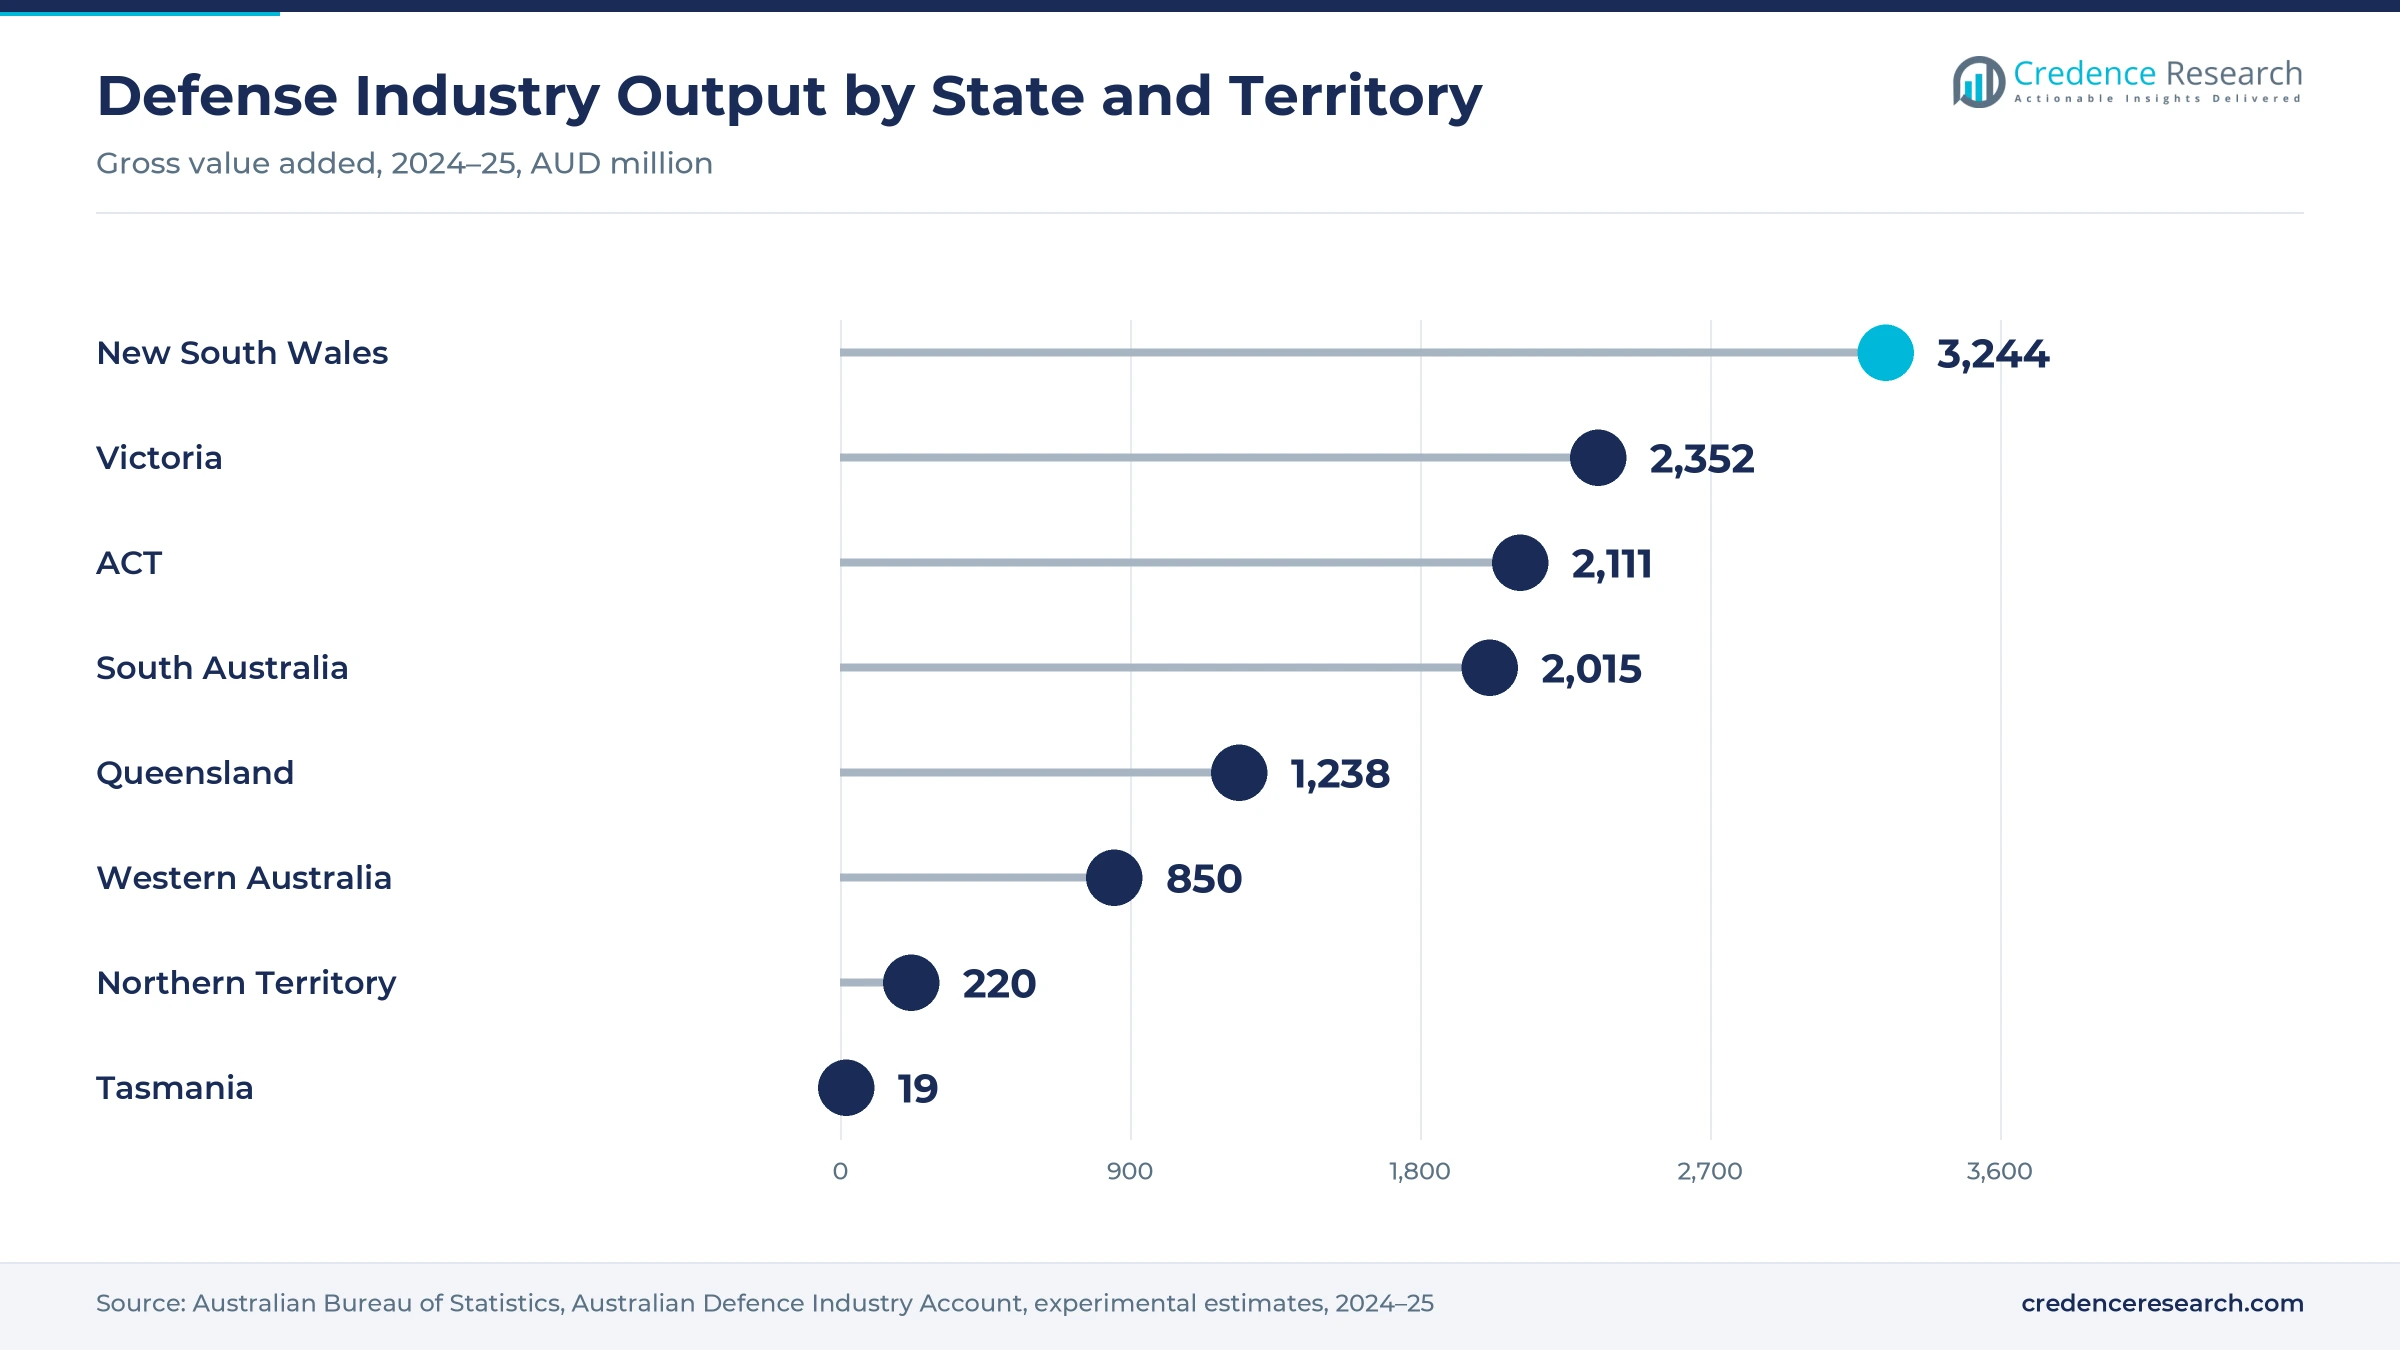
Remaining Australian Jurisdictions held 58.0% of 2025 value and grow at 9.86% a year because they combine New South Wales, the Australian Capital Territory, South Australia, Western Australia, Tasmania and the Northern Territory. Official statistics put New South Wales first at AUD 3,244 million of defense industry gross value added in 2024–25, with the Capital Territory at AUD 2,111 million. South Australia reached AUD 2,015 million, up 4%, according to Defence SA, and it hosts laser countermeasure support at RAAF Base Edinburgh and defense electronics at Lonsdale.
Victoria is fastest as Redback assembly ramps up at Avalon
Victoria held 23.0% of 2025 value and grows at 11.06% a year, the fastest pace, because it hosts both Redback assembly and Bushmaster production at Bendigo. Hanwha opened its Armoured Vehicle Centre of Excellence at Avalon on Aug. 23, 2024, and the first AS9 Huntsman howitzers left the line on Feb. 26, 2026. The Victorian government counts 2,500 businesses and more than 29,000 workers in its defense supply chain. Official gross value added of AUD 2,352 million in 2024–25, about 19.5% of the national total, supports that share.
Queensland combines Boxer production with major armored units
Queensland held 19.0% of 2025 value and grows at 10.66% a year because it holds both a production site and the main user brigade. Rheinmetall builds most Block II Boxers at its Military Vehicle Centre of Excellence at Redbank under the AUD 5.2 billion LAND 400 Phase 2 program. The Redbacks will go to the 3rd Armoured Combat Brigade at Townsville, where a second Abrams squadron stood up on May 1, 2025. Official gross value added of AUD 1,238 million in 2024–25, about 10% of the national total, sits below this share because the estimate also weights fleet basing.
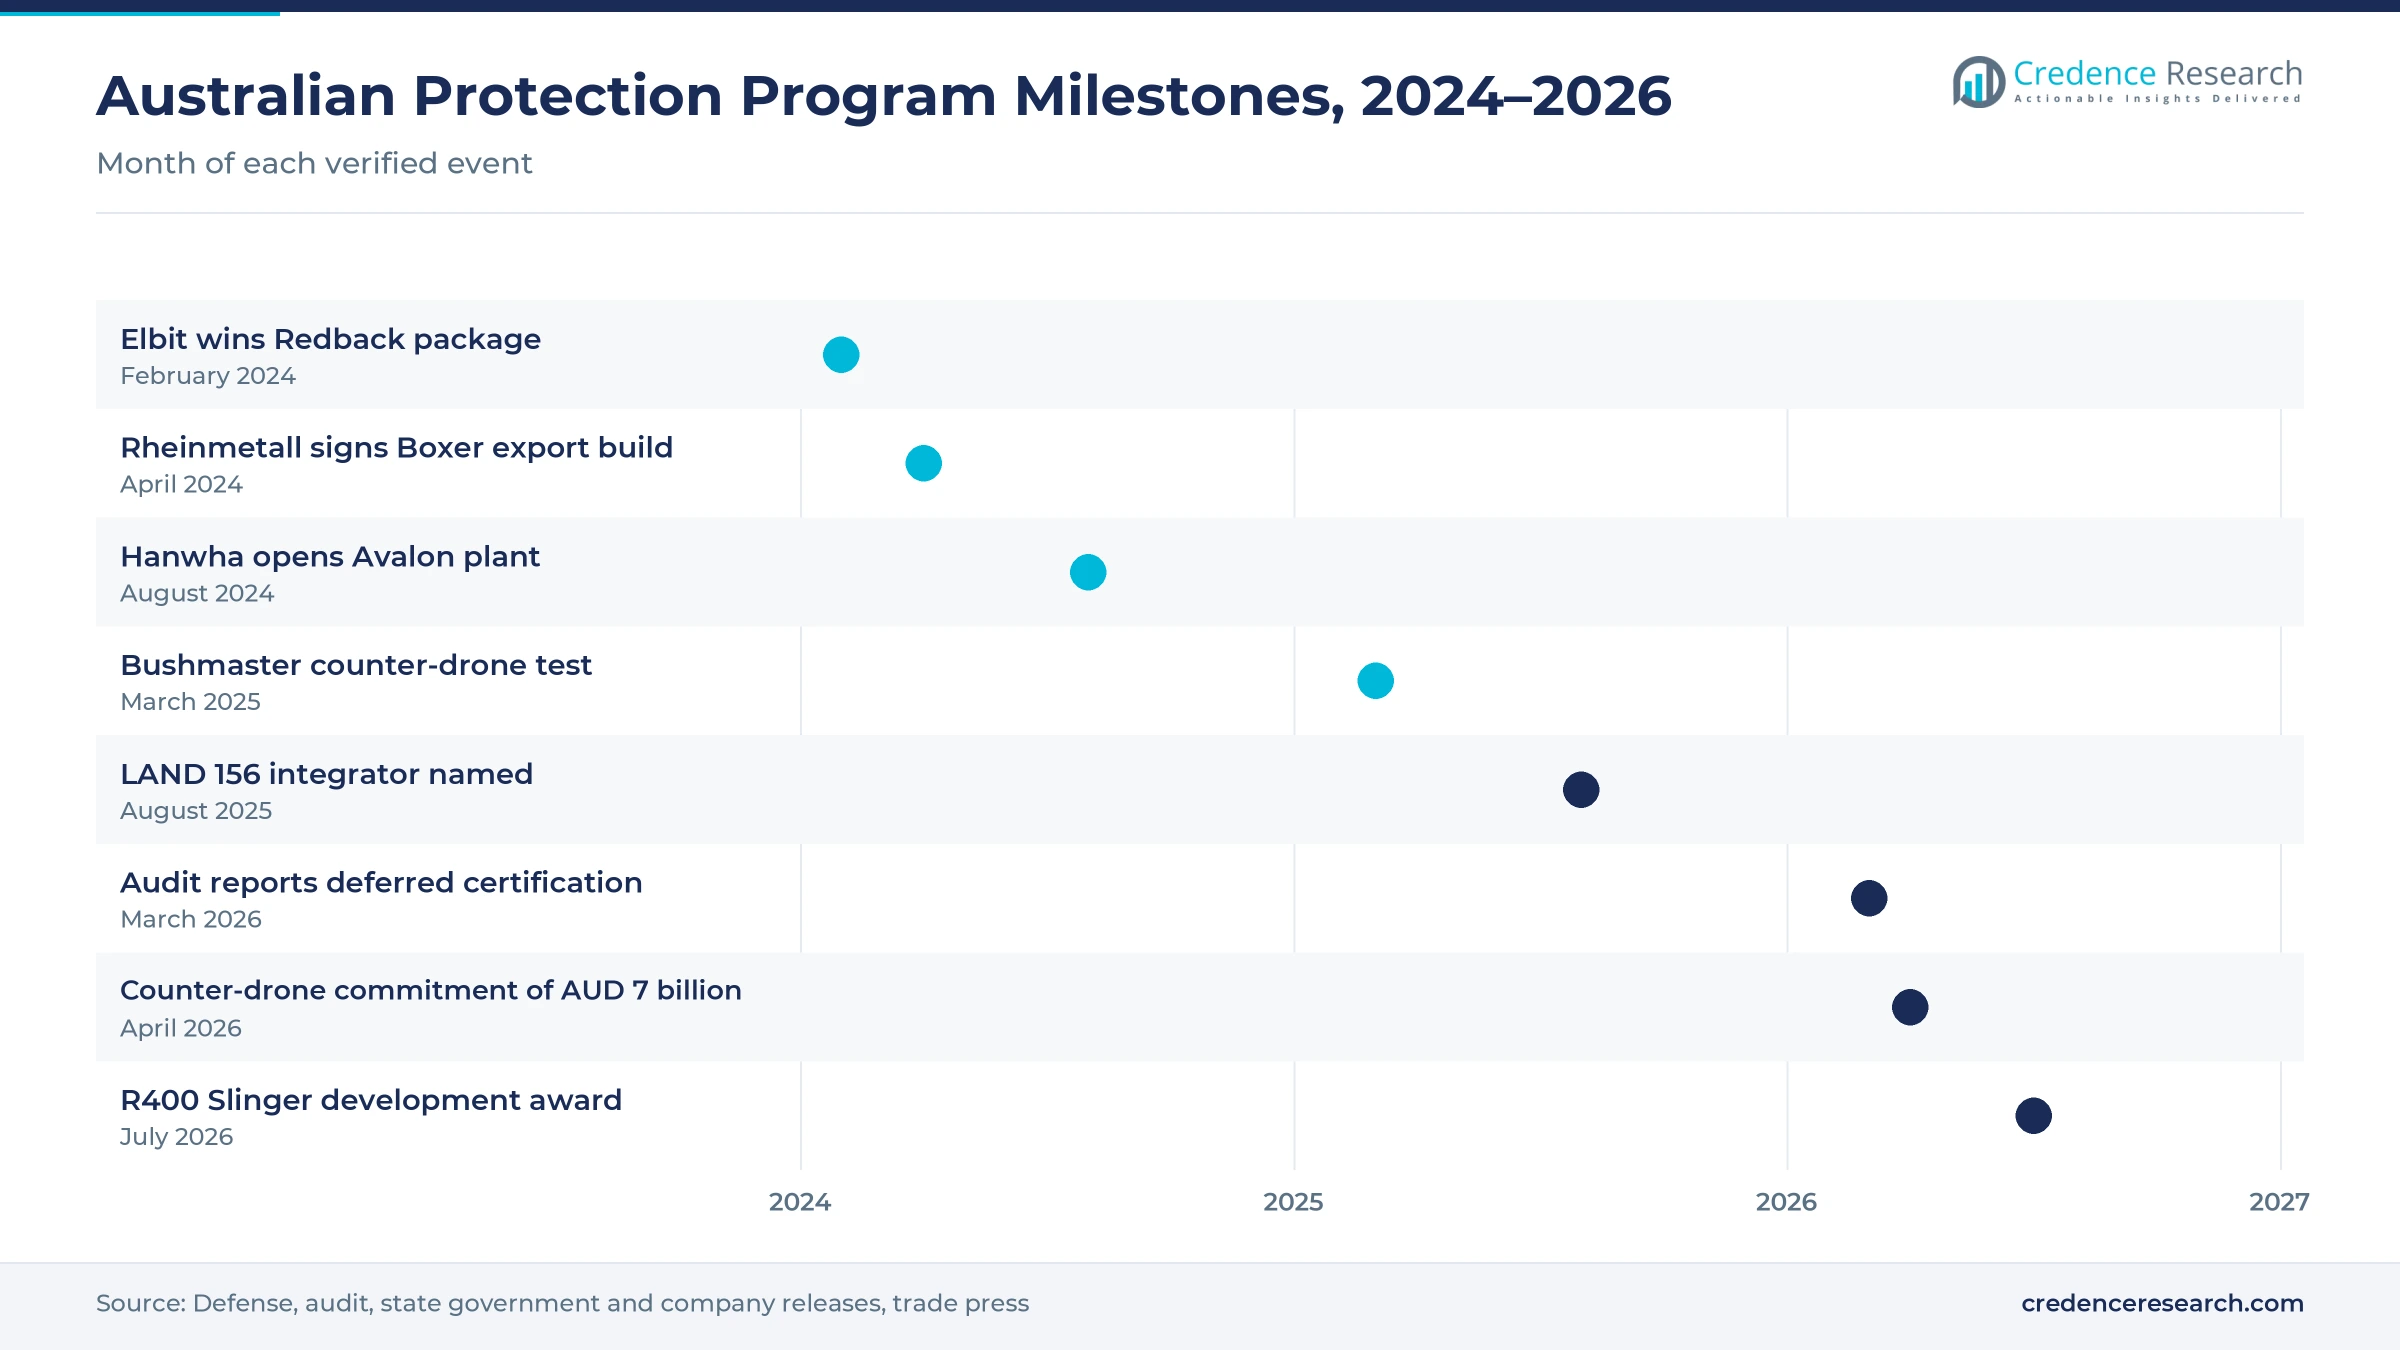
Contracts, plant openings and audit findings, 2024–2026
| Development | Status and market relevance |
|---|---|
| In February 2024, Elbit Systems won a USD 600 million contract from Hanwha Defense Australia for Redback turrets, sensors and Iron Fist. | Five-year contract; the largest named protection award in Australia |
| In August 2024, Hanwha opened its Armoured Vehicle Centre of Excellence at Avalon, near Geelong, with a second stage planned for Redback production. | Open; Stage Two was expected during 2026 |
| In August 2025, Leidos Australia was named systems integration partner for LAND 156, with Electro Optic Systems in its team. | Under way; AUD 1.3 billion allocated over a decade |
| In March 2026, the Australian National Audit Office reported that active protection certification on the Redback had been deferred. | Published; Defense accepted both recommendations |
| In April 2026, Canberra committed up to AUD 7 billion to counter-drone capability and ordered 268 more Bushmasters for AUD 750 million. | Funded; Bendigo production begins in 2027 |
Radar, optical and multi-sensor designs compete
- Radar-led architectures use short-range military radar to cue interceptors, and Australian Defence Business Review listed RADA and Elisra sensors for Iron Fist in its March-April 2021 issue.
- Electro-optical architectures rely on infrared and laser sensing, as with the 30 Guardian laser turret assemblies in the Air Force case approved in February 2022.
- Multi-sensor architectures merge several inputs, and LAND 156 pairs a command-and-control system with sensors and effectors across the whole land force.
- Radio-frequency detection tracks drone control links, and the Dedrone kit tested on Bushmaster in March 2025 recognizes more than 200 drone types while moving.
Need a Custom Version of This Report?
Tailor the scope, geography, or segments to your exact requirements.
- Custom geography or segment scope
- Direct access to our analyst team
Vehicle primes control access for sensor suppliers
Competition turns on access to vehicle primes, because few protection sales reach Australian buyers as standalone purchases. Elbit Systems holds the strongest position through its Redback contract and through earlier work on Boxer evaluation. Hanwha Defense Australia controls Redback integration and therefore the choice of local subcontractors. Rheinmetall Defence Australia controls the Boxer line at Redbank, and it was directed in 2019 to integrate Iron Fist, according to Australian Defence Business Review. Northrop Grumman holds the aircraft niche through laser countermeasures and sustainment at RAAF Base Edinburgh. Rafael holds no publicly confirmed Australian active protection contract, although The Jerusalem Post reported talks on Trophy in 2017 and its system was later named as one possible path for Abrams. New entrants come from drone defense, where Electro Optic Systems, AIM Defence and SYPAQ Systems hold development awards. Selection therefore favors suppliers already qualified on a fleet, while new contenders must win through research contracts.
Which companies shape active protection supply in Australia?
| Company | Type | Role in the market |
|---|---|---|
| Elbit Systems Ltd. | System originator | Supplies Iron Fist, turret and laser warning for the Redback |
| Hanwha Defense Australia Pty Ltd | Vehicle prime | Builds and integrates the Redback at Avalon, Victoria |
| Rheinmetall Defence Australia Pty Ltd | Vehicle prime | Builds Boxer vehicles at Redbank, Queensland |
| Northrop Grumman Corporation | Aircraft system supplier | Supplies and supports laser countermeasures for Air Force fleets |
| Rafael Advanced Defense Systems Ltd. | Potential entrant | Trophy originator with no confirmed Australian active protection order |
Certification timing will decide how fast spending lands
Credence Research's view is that the Australia active protection system market depends less on threat perception than on test schedules. The money is largely approved, and the suppliers are mostly chosen, yet revenue cannot land until each vehicle clears certification. The auditor found that process deferred on the Redback, so spending could slip toward 2028 and beyond rather than disappear. Soft-kill kits should bring faster revenue because they are lighter. Hard-Kill APS keeps the largest solution share through 2028 as 129 Redback vehicles join the 3rd Armoured Combat Brigade. Suppliers holding local test capacity and fleet qualifications should therefore gain the most during the next three years.
Model built from contract, audit and statistics data
The report uses 2025 as the base year on a calendar basis, and market values come from the Credence Research model. That model draws on published contract values, audit findings, fleet quantities and official statistics on defense industry output. Segment splits and regional growth rates are Credence Research estimates, and regional shares follow the Credence Research regional model. Because contract packages rarely price protection separately, the protection content in each package is an estimate. Sources used are government and audit documents, official statistics, trade press and company releases, and no interviews or surveys were used.
Fleet deliveries and drone defense shape the next decade
The market reaches USD 98.7 million by 2035 as Redback deliveries finish and support contracts begin. Spending should peak first around the 2027 and 2028 delivery years, then shift toward sustainment, software and spares. A second wave depends on decisions for Boxer and Abrams, which remain unconfirmed in public documents. Counter-drone funding will push lighter kits onto Bushmaster and other trucks through the early 2030s, with Bendigo output providing steady volume. The main swing factor is how quickly Defense converts decade-long commitments into signed contracts, because most of the plan is still unapproved.
Frequently Asked Questions
How big is the Australia active protection system market?
What drives active protection demand in Australia?
Which solution type leads the Australian market?
Which region grows fastest in this market?
When will the first Redback vehicles arrive?
Which companies supply these systems in Australia?
Do Australian Abrams tanks have active protection?
What is the largest risk to the forecast?
Table of Content
Chapter 1 Market Segmentation
- 1.1 Segmentation Framework
- 1.1.1 Product and Service Classification
- 1.1.2 Application and End-Use Classification
- 1.1.3 Technology and Solution Classification
- 1.1.4 Customer and Distribution Channel Classification
- 1.1.5 Geographic Segmentation
- 1.1.6 Market Segment Definitions and Boundaries
- 1.2 By Solution Type
- 1.2.1 Hard-Kill APS
- 1.2.2 Soft-Kill APS
- 1.2.3 APS-Coupled Protection Integration
- 1.3 By Application
- 1.3.1 Infantry Fighting Vehicles
- 1.3.2 Combat Reconnaissance Vehicles
- 1.3.3 Supplementary Land Platforms
- 1.3.4 Military Aircraft
- 1.4 By End User
- 1.4.1 Australian Army
- 1.4.2 Royal Australian Air Force
- 1.4.3 Joint Defence Organisations
- 1.5 By Sales Channel
- 1.5.1 Vehicle Prime Subcontracts
- 1.5.2 Government-to-Government Procurement
- 1.5.3 Direct Defence Contracts
Chapter 2 Introduction
- 2.1 Report Objectives and Scope
- 2.2 Product Definition and Industry Terminology
- 2.3 Market Inclusions and Exclusions
- 2.4 Research Process
- 2.4.1 Primary Research and Expert Interviews
- 2.4.2 Secondary Research and Source Review
- 2.4.3 Top-Down and Bottom-Up Estimation
- 2.4.4 Data Triangulation and Verification
- 2.5 Market Size Measurement Basis
- 2.5.1 2025: USD 37.5 million → 2035: USD 98.7 million
- 2.6 Historical and Forecast Reference Periods
- 2.6.1 Historical Period: 2018-2025
- 2.6.2 Base Year: 2025
- 2.6.3 Forecast Period: 2025-2035
- 2.7 Research Assumptions and Limitations
Chapter 3 Executive Summary
- 3.1 Market Snapshot and Key Findings
- 3.2 Base-Year Market Size, 2025
- 3.3 Forecast Market Size, 2035
- 3.4 Revenue and Volume Growth Outlook
- 3.5 Key Demand and Supply Indicators
- 3.6 Leading Market Segments
- 3.7 Fastest-Growing Market Opportunities
- 3.8 Regional Performance Highlights
- 3.9 Technology and Industry Transformation
- 3.10 Competitive Landscape Summary
- 3.11 Analyst View and Strategic Implications
Chapter 4 Australia Active Protection System Market Trends and Developments
- 4.1 Historical Industry Development, 2018-2025
- 4.2 Recent Market Trends and Developments
- 4.3 Demand and Customer Behavior Trends
- 4.4 Technology and Product Innovation
- 4.5 Artificial Intelligence, Automation and Digitalization
- 4.6 Local Manufacturing and Supply Chain Realignment
- 4.7 Industry Partnerships, Mergers and Acquisitions
- 4.8 Sustainability and Circular Economy Developments
- 4.9 Government and Private Sector Investment Trends
- 4.10 Emerging Business Models and Commercialization
- 4.11 Industry Developments and Announcements
Chapter 5 Australia Active Protection System Market Production, Supply and Demand Analysis
- 5.1 Demand Trend and Consumption Analysis, 2018-2025
- 5.2 Demand Forecast, 2025-2035
- 5.3 Production and Output Trend, 2018-2025
- 5.4 Production and Output Forecast, 2025-2035
- 5.5 Installed Capacity and Capacity Utilization
- 5.6 Company-Wise Production Plants and Statistics
- 5.6.1 Installed Production Capacity
- 5.6.2 Actual Production
- 5.6.3 Planned Capacity and Expansion Targets
- 5.7 Supply Chain Structure and Procurement Trends
- 5.8 Supply-Demand Gap and Bottlenecks
- 5.9 Import Dependence and Sourcing Structure
- 5.10 Contract Manufacturing and Outsourcing
- 5.11 Regional Supply and Demand Concentration
Chapter 6 Australia Active Protection System Market Pricing Analysis
- 6.1 Pricing Structure and Measurement
- 6.2 Historical Pricing Trends, 2018-2025
- 6.3 Pricing Outlook, 2025-2035
- 6.4 Average Selling Price and Unit Economics
- 6.5 Pricing by Product and Market Segment
- 6.6 Geographic Pricing Differences
- 6.7 Key Input, Energy, Labor and Logistics Costs
- 6.8 Contract Pricing and Purchasing Models
- 6.9 Pricing Sensitivity and Competitive Positioning
- 6.10 Price, Margin and Profitability Implications
Chapter 7 Australia Active Protection System Market Dynamics
- 7.1 Market Growth Drivers
- 7.1.1 Demand-Side Drivers
- 7.1.2 Technology and Innovation Drivers
- 7.1.3 Infrastructure and Investment Drivers
- 7.1.4 Regulatory and Policy Drivers
- 7.2 Market Restraints
- 7.2.1 Cost and Affordability Constraints
- 7.2.2 Technology and Adoption Barriers
- 7.2.3 Supply Chain and Operational Constraints
- 7.3 Market Challenges
- 7.3.1 Competitive Pressure and Margin Erosion
- 7.3.2 Skills, Infrastructure and Implementation Gaps
- 7.4 Emerging Market Opportunities
- 7.5 Market Dynamics Impact and Time-Horizon Assessment
Chapter 8 Australia Active Protection System Value Chain Analysis
- 8.1 Industry Value Chain Overview
- 8.2 Upstream Suppliers and Critical Inputs
- 8.3 Technology and Component Providers
- 8.4 Manufacturing or Service Delivery
- 8.5 Distribution, Channel Partners and Integrators
- 8.6 Downstream Applications and End Users
- 8.7 Value Addition and Profit Pools
- 8.8 Vertical Integration and Outsourcing
- 8.9 Supplier Concentration and Risk
- 8.10 Supply Chain Localization and Resilience
Chapter 9 Australia Active Protection System Market Regulations and Policies
- 9.1 Relevant Laws, Standards and Compliance Frameworks
- 9.2 Product, Service, Safety and Quality Requirements
- 9.3 Government Policies, Incentives and Subsidies
- 9.4 Imports, Exports and Trade Barriers
- 9.5 Public Procurement and Local Content Requirements
- 9.6 Environmental and Sustainability Compliance
- 9.7 Upcoming Policy Changes and Market Implications
Chapter 10 Australia Active Protection System Market Hotspots and Opportunities
- 10.1 Market Opportunity Mapping and Growth Hotspots
- 10.2 High-Growth Applications and Customer Groups
- 10.3 Underserved Markets and White-Space Opportunities
- 10.4 Emerging Technology and Product Opportunities
- 10.5 New Capacity and Investment Hotspots
- 10.6 Market Entry and Expansion Opportunities
- 10.7 Distribution and Partnership Opportunities
- 10.8 Near-Term and Long-Term Commercial Potential
- 10.9 Opportunity Attractiveness and Execution Risks
Chapter 11 Australia Active Protection System Market Outlook, 2025-2035
- 11.1 Market Size and Analysis
- 11.1.1 Revenue (Market Measurement: 2025: USD 37.5 million → 2035: USD 98.7 million)
- 11.1.2 Market Volume and Quantity Sold
- 11.1.3 Historical Market Size, 2018-2025
- 11.1.4 Base-Year Market Size, 2025
- 11.2 Market Forecast, 2025-2035
- 11.2.1 Revenue Forecast to 2035
- 11.2.2 Volume Forecast to 2035
- 11.2.3 CAGR and Year-on-Year Growth
- 11.2.4 Incremental Revenue Opportunity
- 11.3 Forecast Assumptions and Scenario Analysis
- 11.3.1 Base-Case Forecast
- 11.3.2 Optimistic and Conservative Scenarios
- 11.3.3 Technology, Pricing and Policy Sensitivities
- 11.4 Market Attractiveness and Growth Outlook
Chapter 12 Australia Active Protection System Market Segmentation and Outlook
- 12.1 Segmentation Summary and Market Shares, 2025
- 12.2 Largest and Fastest-Growing Segments
- 12.3 By Solution Type - Market Size and Forecast, 2025-2035
- 12.3.1 Segment Definition and Scope
- 12.3.2 Historical Market Size, 2018-2025
- 12.3.3 Revenue Forecast, 2025-2035
- 12.3.4 Volume Forecast, 2025-2035
- 12.3.5 Base-Year Market Share, 2025
- 12.3.6 Segment CAGR and Growth Drivers
- 12.3.7 Subsegment Market Size and Forecast
- 12.3.7.1 Hard-Kill APS
- 12.3.7.2 Soft-Kill APS
- 12.3.7.3 APS-Coupled Protection Integration
- 12.3.8 Subsegment Pricing and Adoption Trends
- 12.3.9 Leading Suppliers and Competition
- 12.3.10 Regional Demand and Opportunities
- 12.4 By Application - Market Size and Forecast, 2025-2035
- 12.4.1 Segment Definition and Scope
- 12.4.2 Historical Market Size, 2018-2025
- 12.4.3 Revenue Forecast, 2025-2035
- 12.4.4 Volume Forecast, 2025-2035
- 12.4.5 Base-Year Market Share, 2025
- 12.4.6 Segment CAGR and Growth Drivers
- 12.4.7 Subsegment Market Size and Forecast
- 12.4.7.1 Infantry Fighting Vehicles
- 12.4.7.2 Combat Reconnaissance Vehicles
- 12.4.7.3 Supplementary Land Platforms
- 12.4.7.4 Military Aircraft
- 12.4.8 Subsegment Pricing and Adoption Trends
- 12.4.9 Leading Suppliers and Competition
- 12.4.10 Regional Demand and Opportunities
- 12.5 By End User - Market Size and Forecast, 2025-2035
- 12.5.1 Segment Definition and Scope
- 12.5.2 Historical Market Size, 2018-2025
- 12.5.3 Revenue Forecast, 2025-2035
- 12.5.4 Volume Forecast, 2025-2035
- 12.5.5 Base-Year Market Share, 2025
- 12.5.6 Segment CAGR and Growth Drivers
- 12.5.7 Subsegment Market Size and Forecast
- 12.5.7.1 Australian Army
- 12.5.7.2 Royal Australian Air Force
- 12.5.7.3 Joint Defence Organisations
- 12.5.8 Subsegment Pricing and Adoption Trends
- 12.5.9 Leading Suppliers and Competition
- 12.5.10 Regional Demand and Opportunities
- 12.6 By Sales Channel - Market Size and Forecast, 2025-2035
- 12.6.1 Segment Definition and Scope
- 12.6.2 Historical Market Size, 2018-2025
- 12.6.3 Revenue Forecast, 2025-2035
- 12.6.4 Volume Forecast, 2025-2035
- 12.6.5 Base-Year Market Share, 2025
- 12.6.6 Segment CAGR and Growth Drivers
- 12.6.7 Subsegment Market Size and Forecast
- 12.6.7.1 Vehicle Prime Subcontracts
- 12.6.7.2 Government-to-Government Procurement
- 12.6.7.3 Direct Defence Contracts
- 12.6.8 Subsegment Pricing and Adoption Trends
- 12.6.9 Leading Suppliers and Competition
- 12.6.10 Regional Demand and Opportunities
- 12.7 Segment Growth Comparison
- 12.8 Segment Attractiveness and Priority Matrix
Chapter 13 Australia Active Protection System End-Use and Application Market Outlook
- 13.1 End-Use Industry and Customer Demand Structure
- 13.2 Leading Applications and Customer Groups
- 13.3 End-Use Market Size, Share and Forecast
- 13.4 Major End-Use Industry Deep Dives
- 13.4.1 Customer Requirements and Use Cases
- 13.4.2 Demand and Replacement Cycles
- 13.4.3 Technical and Regulatory Considerations
- 13.4.4 Purchasing and Procurement Models
- 13.4.5 Leading Vendors and Distribution Channels
- 13.4.6 Forecast and Commercial Opportunities
- 13.5 Emerging Applications and Cross-Segment Demand
- 13.6 End-Use Industry Investment Priorities
Chapter 14 Australia Active Protection System Geographic Market Outlook, 2025-2035
- 14.1 Domestic Market Distribution and Demand Clusters
- 14.2 State- or Province-Wise Market Size and Forecast, 2025-2035
- 14.3 City and Metropolitan Market Outlook
- 14.4 Industrial, Manufacturing and Commercial Clusters
- 14.5 Geographic Concentration of Key End Users
- 14.6 Local Pricing and Purchasing Differences
- 14.7 Domestic Production Facilities and Capacity Map
- 14.8 Local Infrastructure and Project Pipeline
- 14.9 State-Level Policy and Incentive Differences
- 14.10 Subnational Investment Hotspots and Opportunities
- 14.11 Distribution and Logistics Networks
- 14.12 Domestic Competitive Footprint
Chapter 15 Australia Active Protection System Technology, Innovation and Sustainability Outlook
- 15.1 Technology Landscape and Maturity
- 15.2 Product, Process and Service Innovation
- 15.3 AI, Automation and Digital Tools in the Industry
- 15.4 Technology Adoption and Performance Benchmarking
- 15.5 Innovation Pipeline and R&D Investment
- 15.6 Patent and Intellectual Property Trends
- 15.7 Energy Efficiency and Resource Management
- 15.8 Sustainability, Recycling and Circularity
- 15.9 Technology Roadmap, 2025-2035
- 15.10 Risks of Obsolescence and Technology Substitution
Chapter 16 Australia Active Protection System Market Key Strategic Imperatives
- 16.1 Growth and Market Entry Priorities
- 16.2 High-Return Products and Segments
- 16.3 Pricing, Profitability and Cost Optimization
- 16.4 Technology Investment and Product Differentiation
- 16.5 Supply Chain Localization and Resilience
- 16.6 Distribution and Customer Acquisition
- 16.7 Partnership, Acquisition and Capacity Strategy
- 16.8 Regional Expansion Priorities
- 16.9 Short-, Medium- and Long-Term Actions
Chapter 17 Competition Outlook
- 17.1 Industry Competition Characteristics
- 17.2 Market Structure and Concentration
- 17.3 Market Share and Competitive Positioning, 2025
- 17.4 Company-Wise Revenue and Product Benchmarking
- 17.5 Production and Service Capacity Benchmarking
- 17.6 Technology, Pricing and Differentiation
- 17.7 Regional Footprint and Distribution Strength
- 17.8 Mergers, Acquisitions and Strategic Alliances
- 17.9 New Entrants and Competitive Threats
- 17.10 Porter's Five Forces and Industry Attractiveness
- 17.11 Competitive Outlook, 2025-2035
Chapter 18 Company Profiles
- 18.1 Company Coverage and Selection Criteria
- 18.2 Elbit Systems Ltd.
- 18.2.1 Business Description
- 18.2.2 Company Ownership and Geographic Presence
- 18.2.3 Product and Service Portfolio
- 18.2.4 Manufacturing and Operating Footprint
- 18.2.5 Production Capacity and Expansion Plans
- 18.2.6 Financial Performance and Investment
- 18.2.7 Market Share and Competitive Position
- 18.2.8 Technology and Innovation Capabilities
- 18.2.9 Strategic Alliances or Partnerships
- 18.2.10 Recent Developments
- 18.2.11 Growth Strategy and Outlook
- 18.3 Hanwha Defense Australia Pty Ltd
- 18.4 Rheinmetall Defence Australia Pty Ltd
- 18.5 Northrop Grumman Corporation
- 18.6 Rafael Advanced Defense Systems Ltd.
- 18.7 Other Relevant Market Participants
Note: Every listed company is profiled on the structure shown under the first company. The company list is preliminary and may change based on research findings, market developments, data availability and client requirements.
Chapter 19 Disclaimer
- 19.1 Research and Forecast Disclaimer
- 19.2 Data Source and Estimation Limitations
Note: The depth of individual sections depends on data availability for this market. Volume, capacity, trade and other unit-based metrics are included where applicable.

