
Army squad weapon renewal sets the U.S. spending base
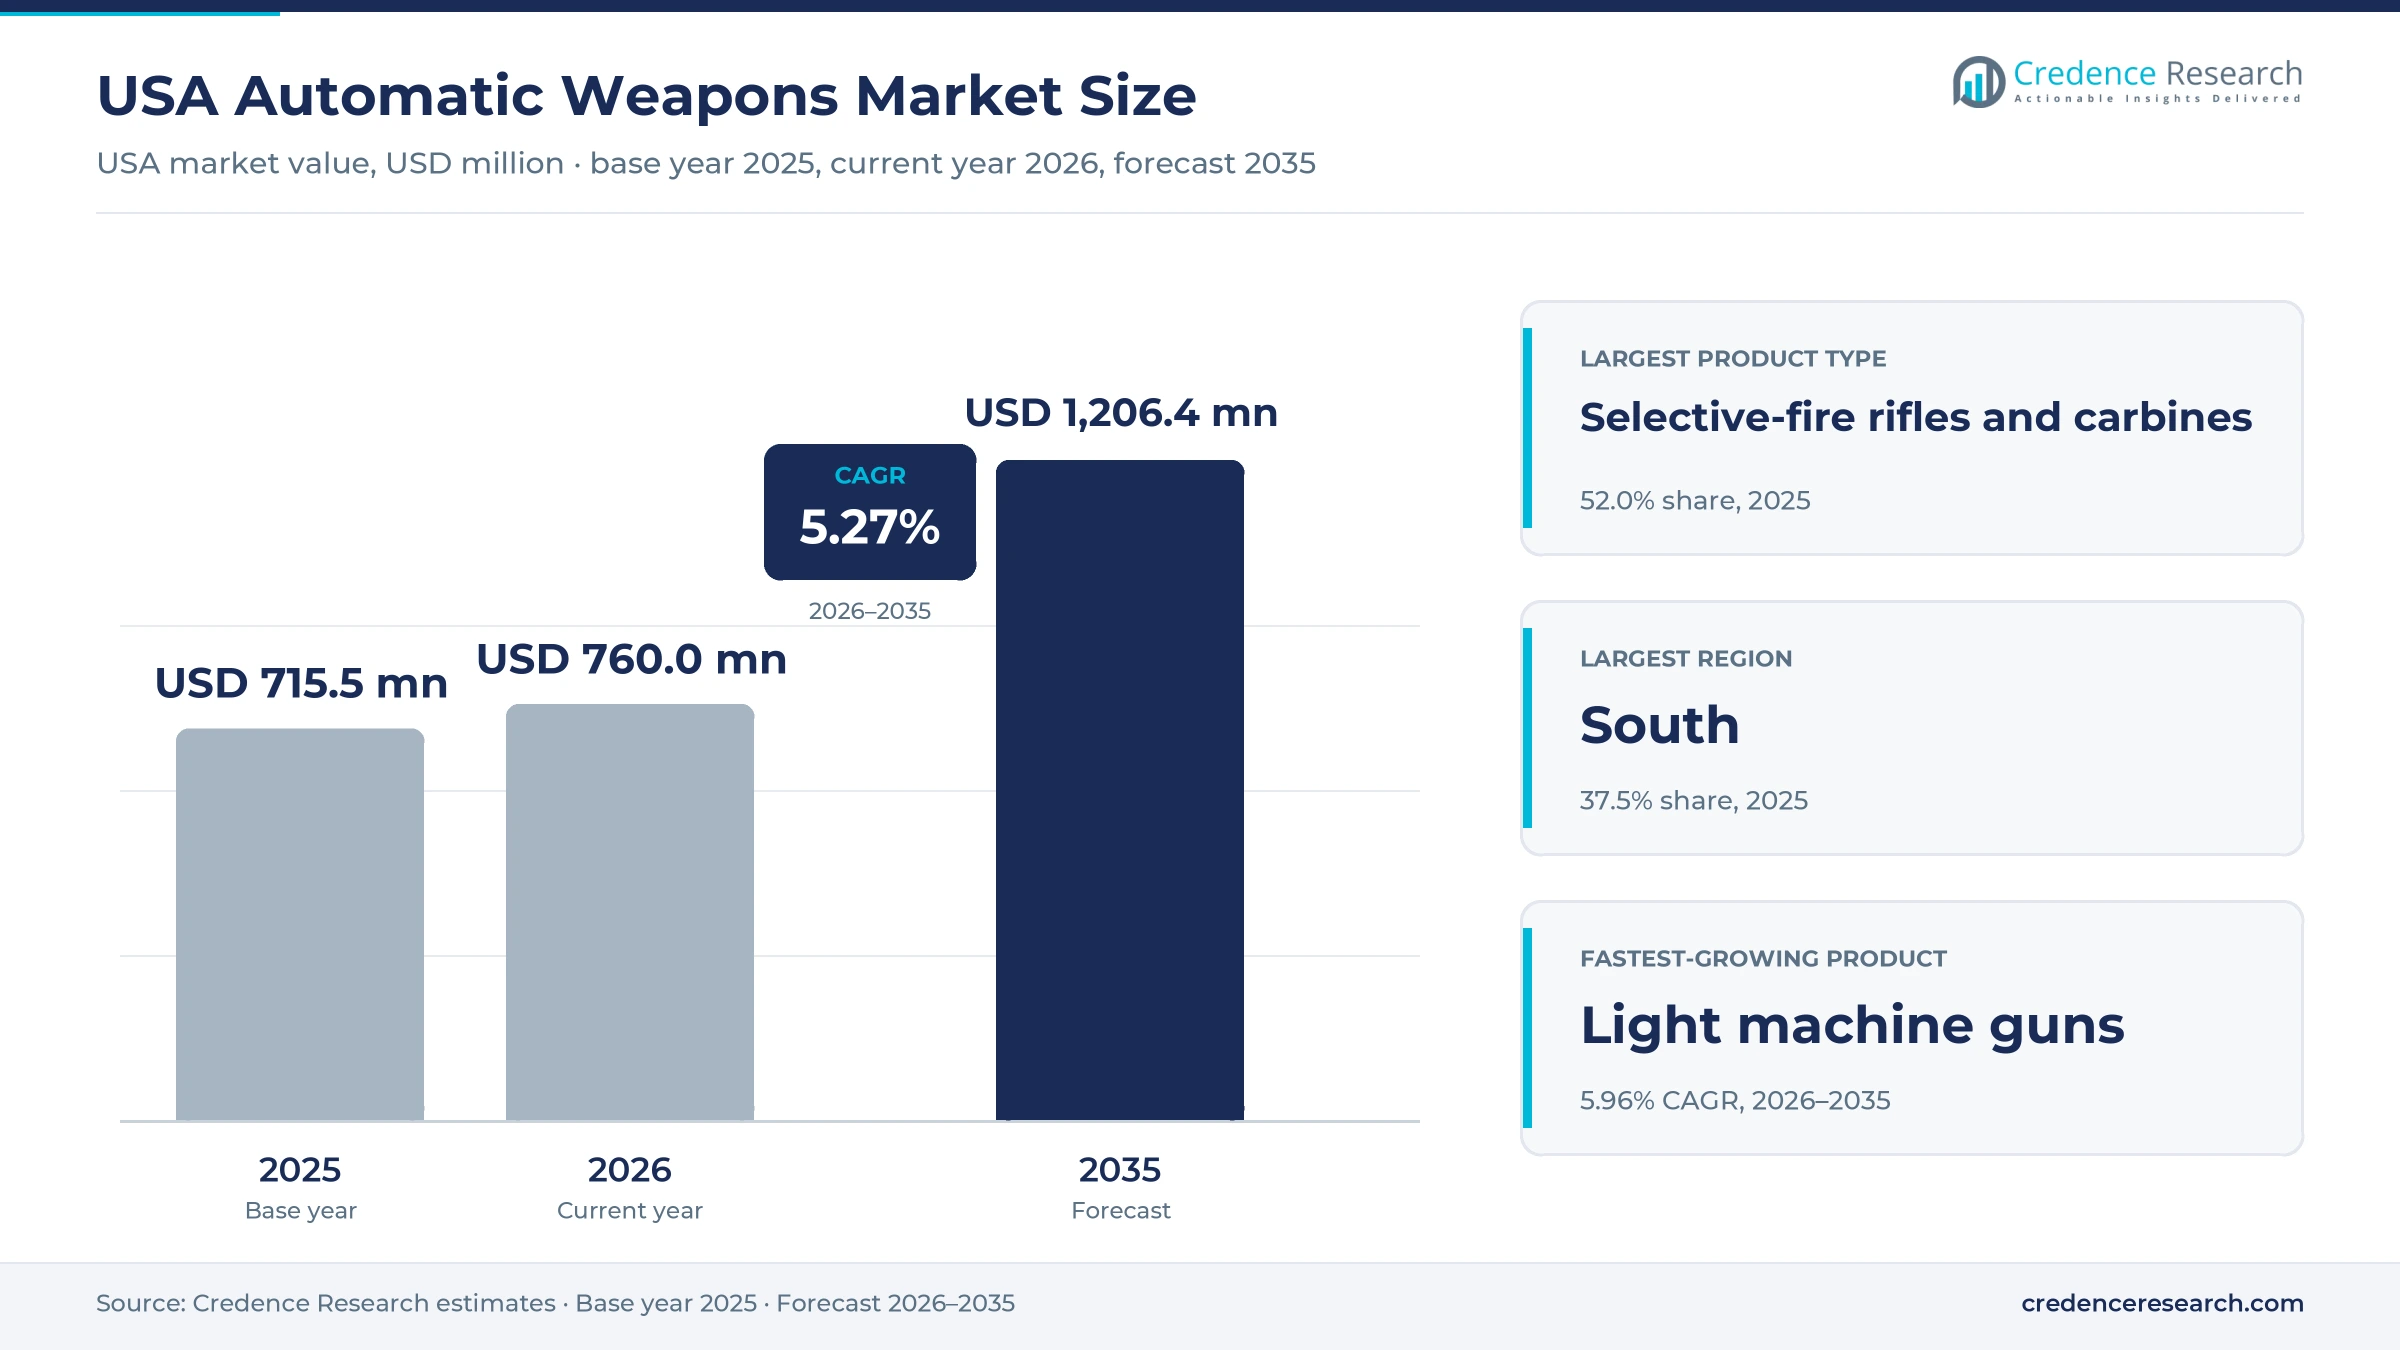
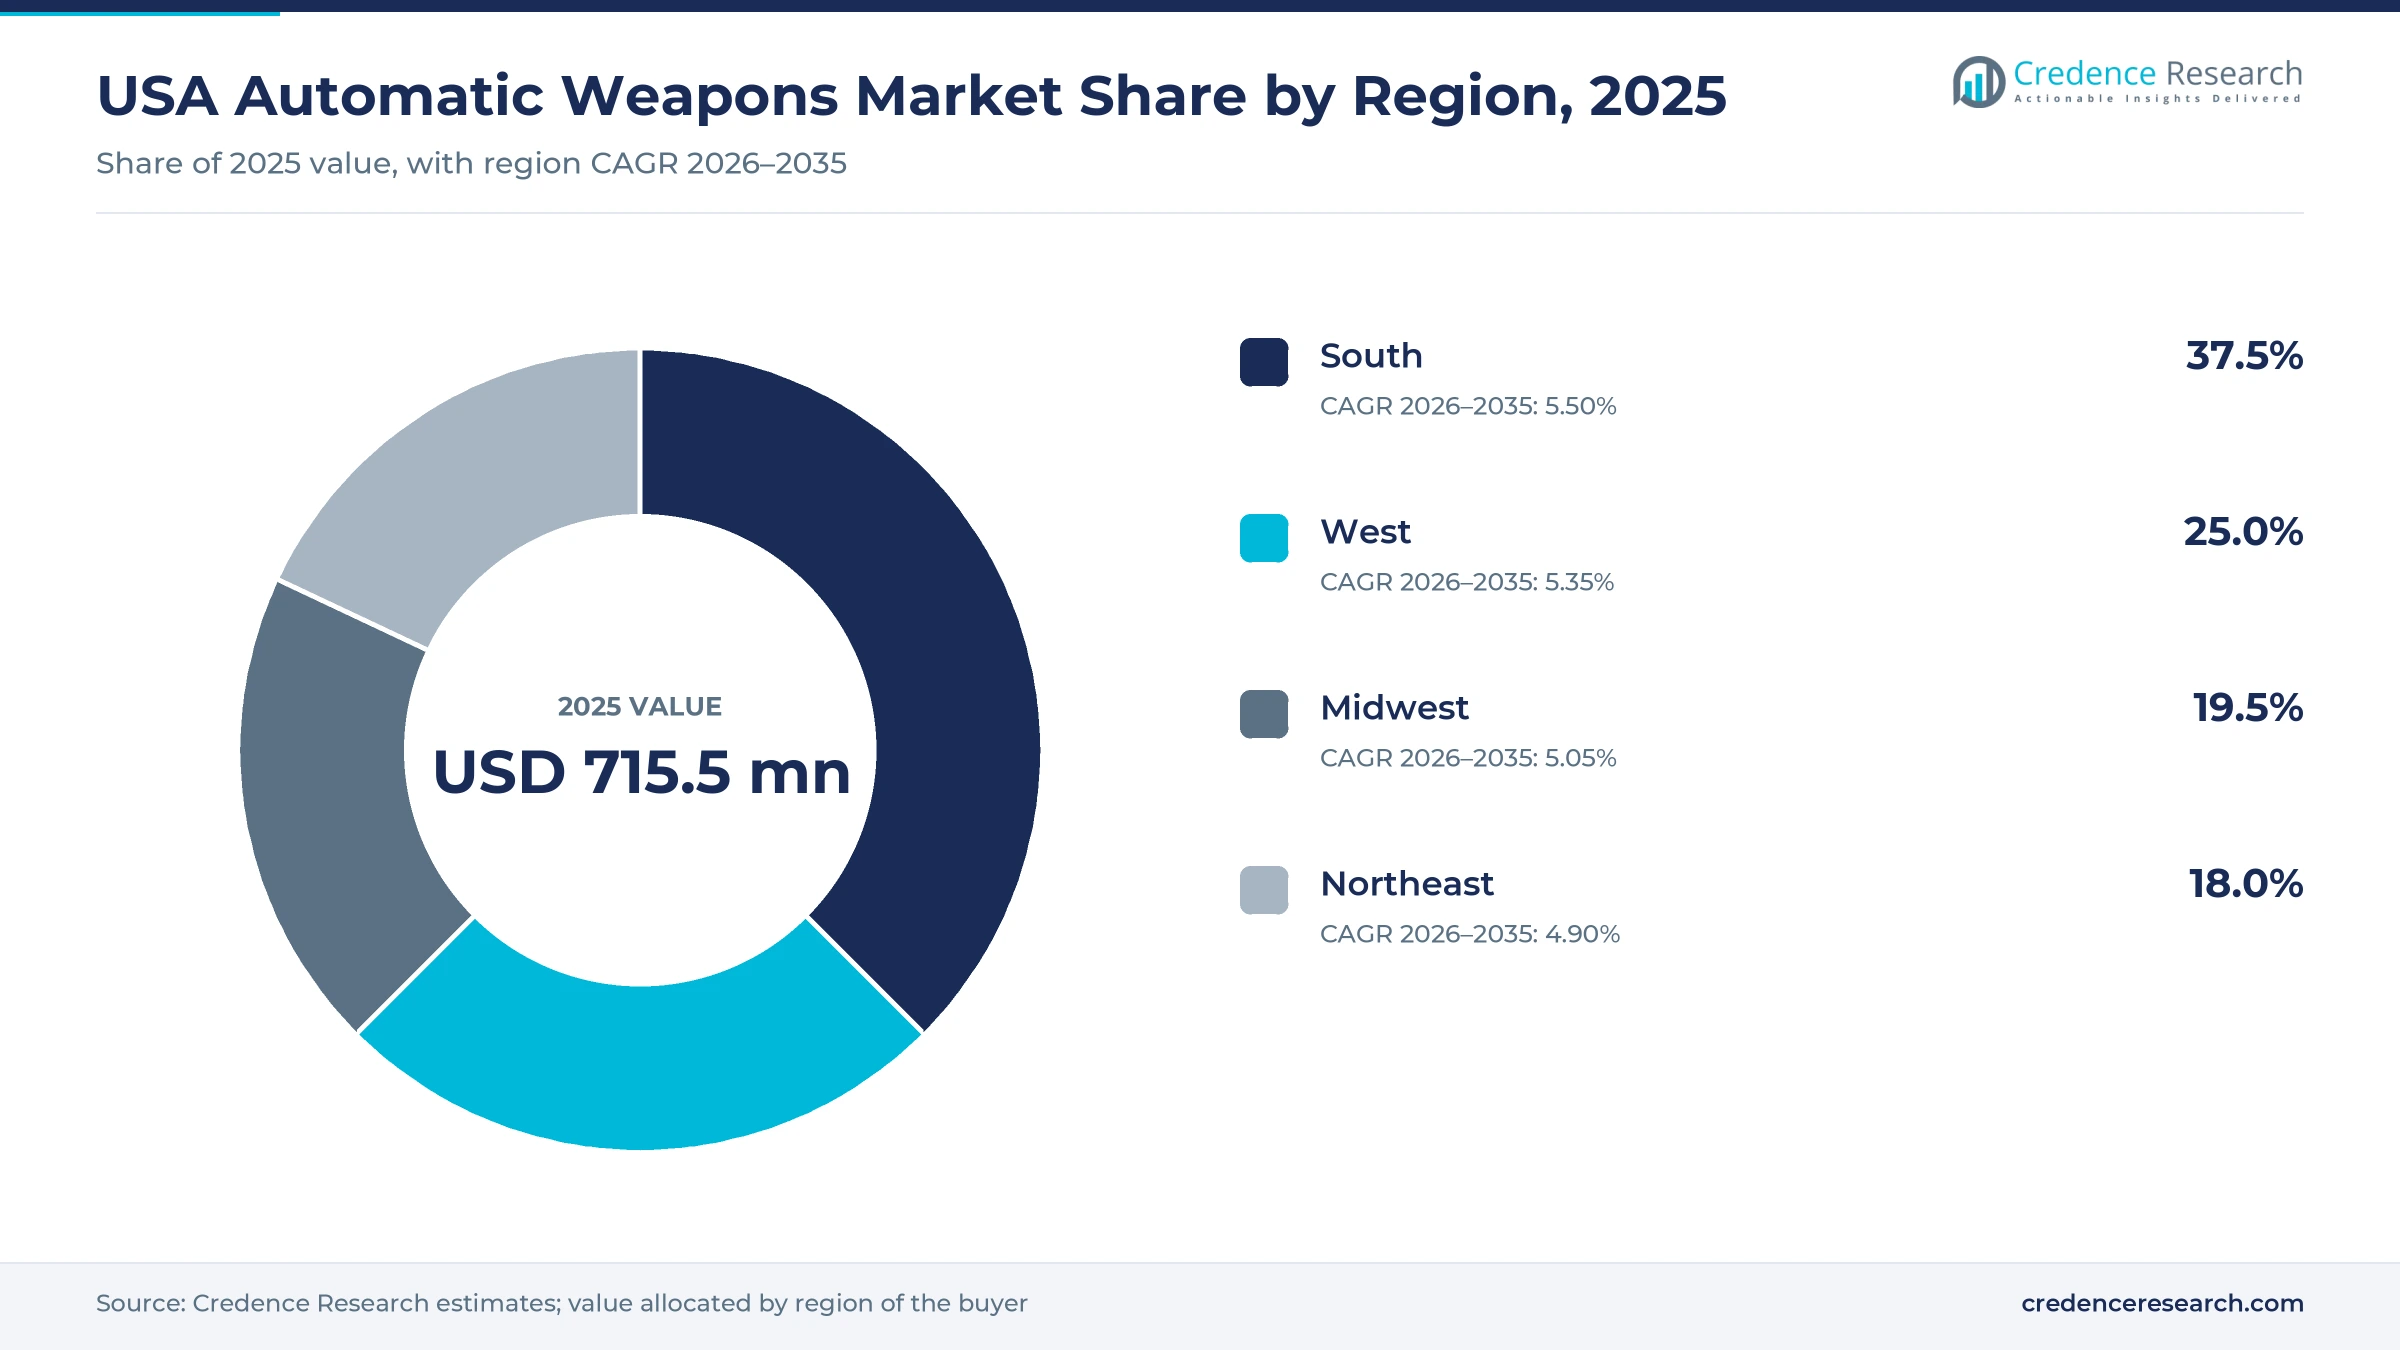
The USA automatic weapons market was valued at USD 715.5 million in 2025 and is projected to increase from USD 760.0 million in 2026 to USD 1.21 billion by 2035, registering a CAGR of 5.27% during 2026–2035. Spending rests on the Army Next Generation Squad Weapon program, recurring machine gun orders and federal agency rifle and submachine gun contracts. The South held the largest regional share, 37.5% in 2025, because major plants, Army posts and registered stock cluster there, and it is also the fastest-growing region at 5.50% a year. The West follows with 25.0%, supported by a Nevada machine gun supplier and 80.1 million residents. The largest commercial change came in June 2026, when the Army confirmed that its production line had moved from the M7 rifle to the lighter XM8 carbine. As a result, buying shifts toward carbines and support weapons while total program funding steps down from its 2025 and 2026 peak.
What does the U.S. automatic weapons market count, and who buys?
The market counts the value of new and replacement automatic weapons bought for U.S. end use by the Defense Department, federal, state and local agencies, and licensed civilian transfers of registered stock. Buying runs mainly through federal contract vehicles managed by Army Contracting Command at Picatinny Arsenal in New Jersey, and through agency contracts placed directly or through licensed dealers.
The estimate excludes ammunition, optics and fire control, training, accessories and Foreign Military Sales, although those programs share plants and budget documents with the counted spending. Semiautomatic civilian rifles also fall outside the count of this report. Value flows from a small group of prime manufacturers to program offices, agencies and, in the civilian channel, licensed dealers handling registered transfers.
USA Automatic Weapons Market Insights
- The U.S. automatic weapons market grows from USD 715.5 million in 2025 to USD 1.21 billion by 2035, a 5.27% CAGR that reflects fleet renewal and steadier replacement spending.
- The South led regional value with 37.5% in 2025, supported by FN America in South Carolina and Army posts such as Fort Campbell and Fort Bliss.
- Selective-fire rifles and carbines held 52.0% of 2025 value because the Army Next Generation Squad Weapon line reached about $762 million in fiscal 2025.
- The Army moved its production line from the M7 rifle to the XM8 carbine by June 2026, and its fiscal 2027 request lists 14,944 carbines.
- SIG Sauer holds the 10-year squad weapon program awarded in April 2022, while FN America, Colt and two M2 suppliers keep the recurring legacy orders.
Rifles and carbines lead as the Army renews its fleet
Why rifles and carbines lead while light machine guns gain
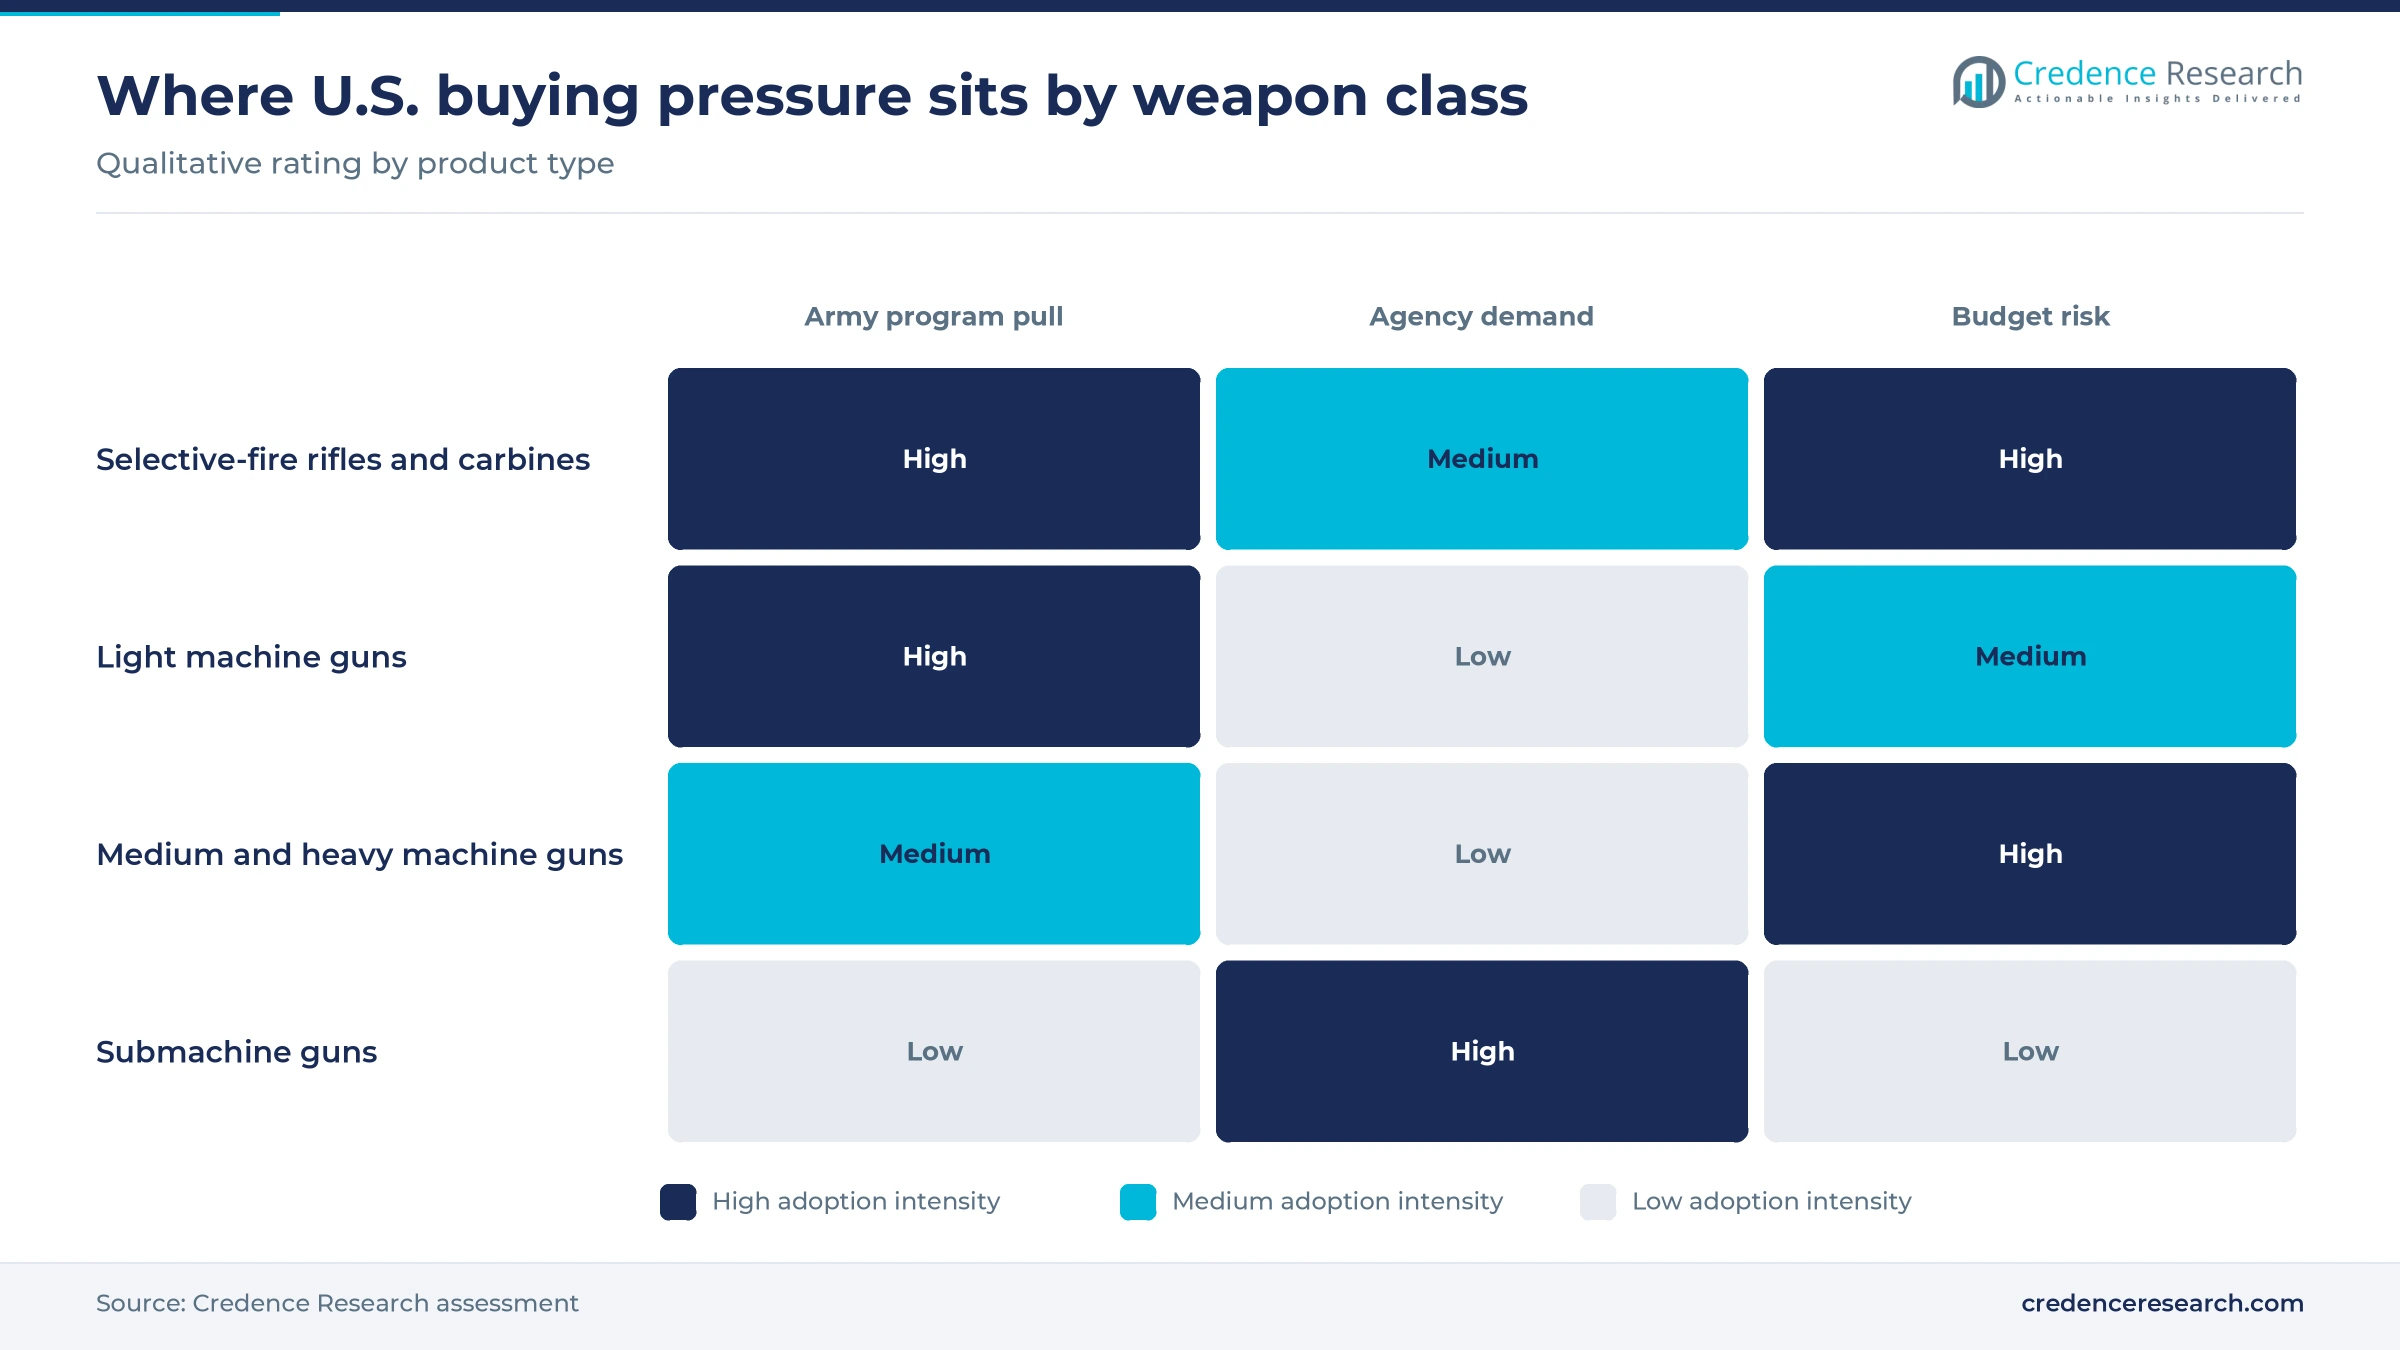
Based on product type, the market is categorized into selective-fire rifles and carbines, light machine guns, medium and heavy machine guns, and submachine guns. Selective-fire rifles and carbines led with 52.0% of 2025 value because the Army fiscal 2026 request alone listed 16,154 M7 rifles, according to Army Recognition in July 2025. Light machine guns grow fastest at 5.96% a year as M250 quantities rise from 2,636 in that request to 2,795 in the fiscal 2027 request. Medium and heavy models depend on smaller orders, such as two M2 delivery orders placed on Sept. 11, 2025.
Individual weapons dominate, but squad support buys rise faster
Based on application, the market is categorized into individual service weapons, unit-level support weapons, crew-served weapons and civilian collections. Individual service weapons led with 54.0% of 2025 value because the program replaces the M4 carbine and M249 across close combat force units, according to the Pentagon test office. Unit-level support weapons grow fastest at 5.96% a year as the fiscal 2027 request buys 2,795 M250s even while total program funding falls. Civilian collections stay small, since ATF counted about 234,718 privately transferable machine guns in June 2025.
Defense buyers dominate, while agencies add faster growth
Based on customer type, the market is categorized into regular defense procurement buyers, law enforcement agencies, civilian transferable owners and specialized government buyers. Regular defense procurement buyers led with 78.0% of 2025 value because one Army budget line reached $762 million in fiscal 2025, according to HigherGov budget records. Law enforcement agencies grow fastest at 6.04% a year as Customs and Border Protection plans a five-year $5 million to $10 million submachine gun contract starting in September 2026. Specialized buyers include U.S. Special Operations Command, which ASDNews names among FN customers for MK 46 and MK 48 models.
Direct contracts carry most value, with dealers serving agencies
Based on sales channel, the market is categorized into direct government contracts, agency dealer procurement and licensed civilian transfers. Direct government contracts led with 84.0% of 2025 value because Army Contracting Command placed orders such as the $11.5 million Ohio Ordnance Works M2 order, according to HigherGov award records. Agency dealer procurement grows fastest at 5.98% a year as agencies use resellers, shown by the $9 million FBI parts contract that Soldier Systems reported going to Arms Unlimited in June 2025. Licensed transfers stay limited by the $200 federal machine gun transfer tax.
| Segment Group | Leading Sub-segment | Share, 2025 | Fastest-growing Sub-segment | CAGR, 2026–2035 |
|---|---|---|---|---|
| By Product Type | Selective-fire rifles and carbines | 52.0% | Light machine guns | 5.96% |
| By Application | Individual service weapons | 54.0% | Unit-level support weapons | 5.96% |
| By Customer Type | Regular defense procurement buyers | 78.0% | Law enforcement agencies | 6.04% |
| By Sales Channel | Direct government contracts | 84.0% | Agency dealer procurement | 5.98% |
Request a Free Sample
Fill in your details and we'll send you a free sample report.
- Sample data tables & charts
- Research methodology
Budget lines and agency contracts carry U.S. demand
NGSW renewal and fleet transition set the spending base
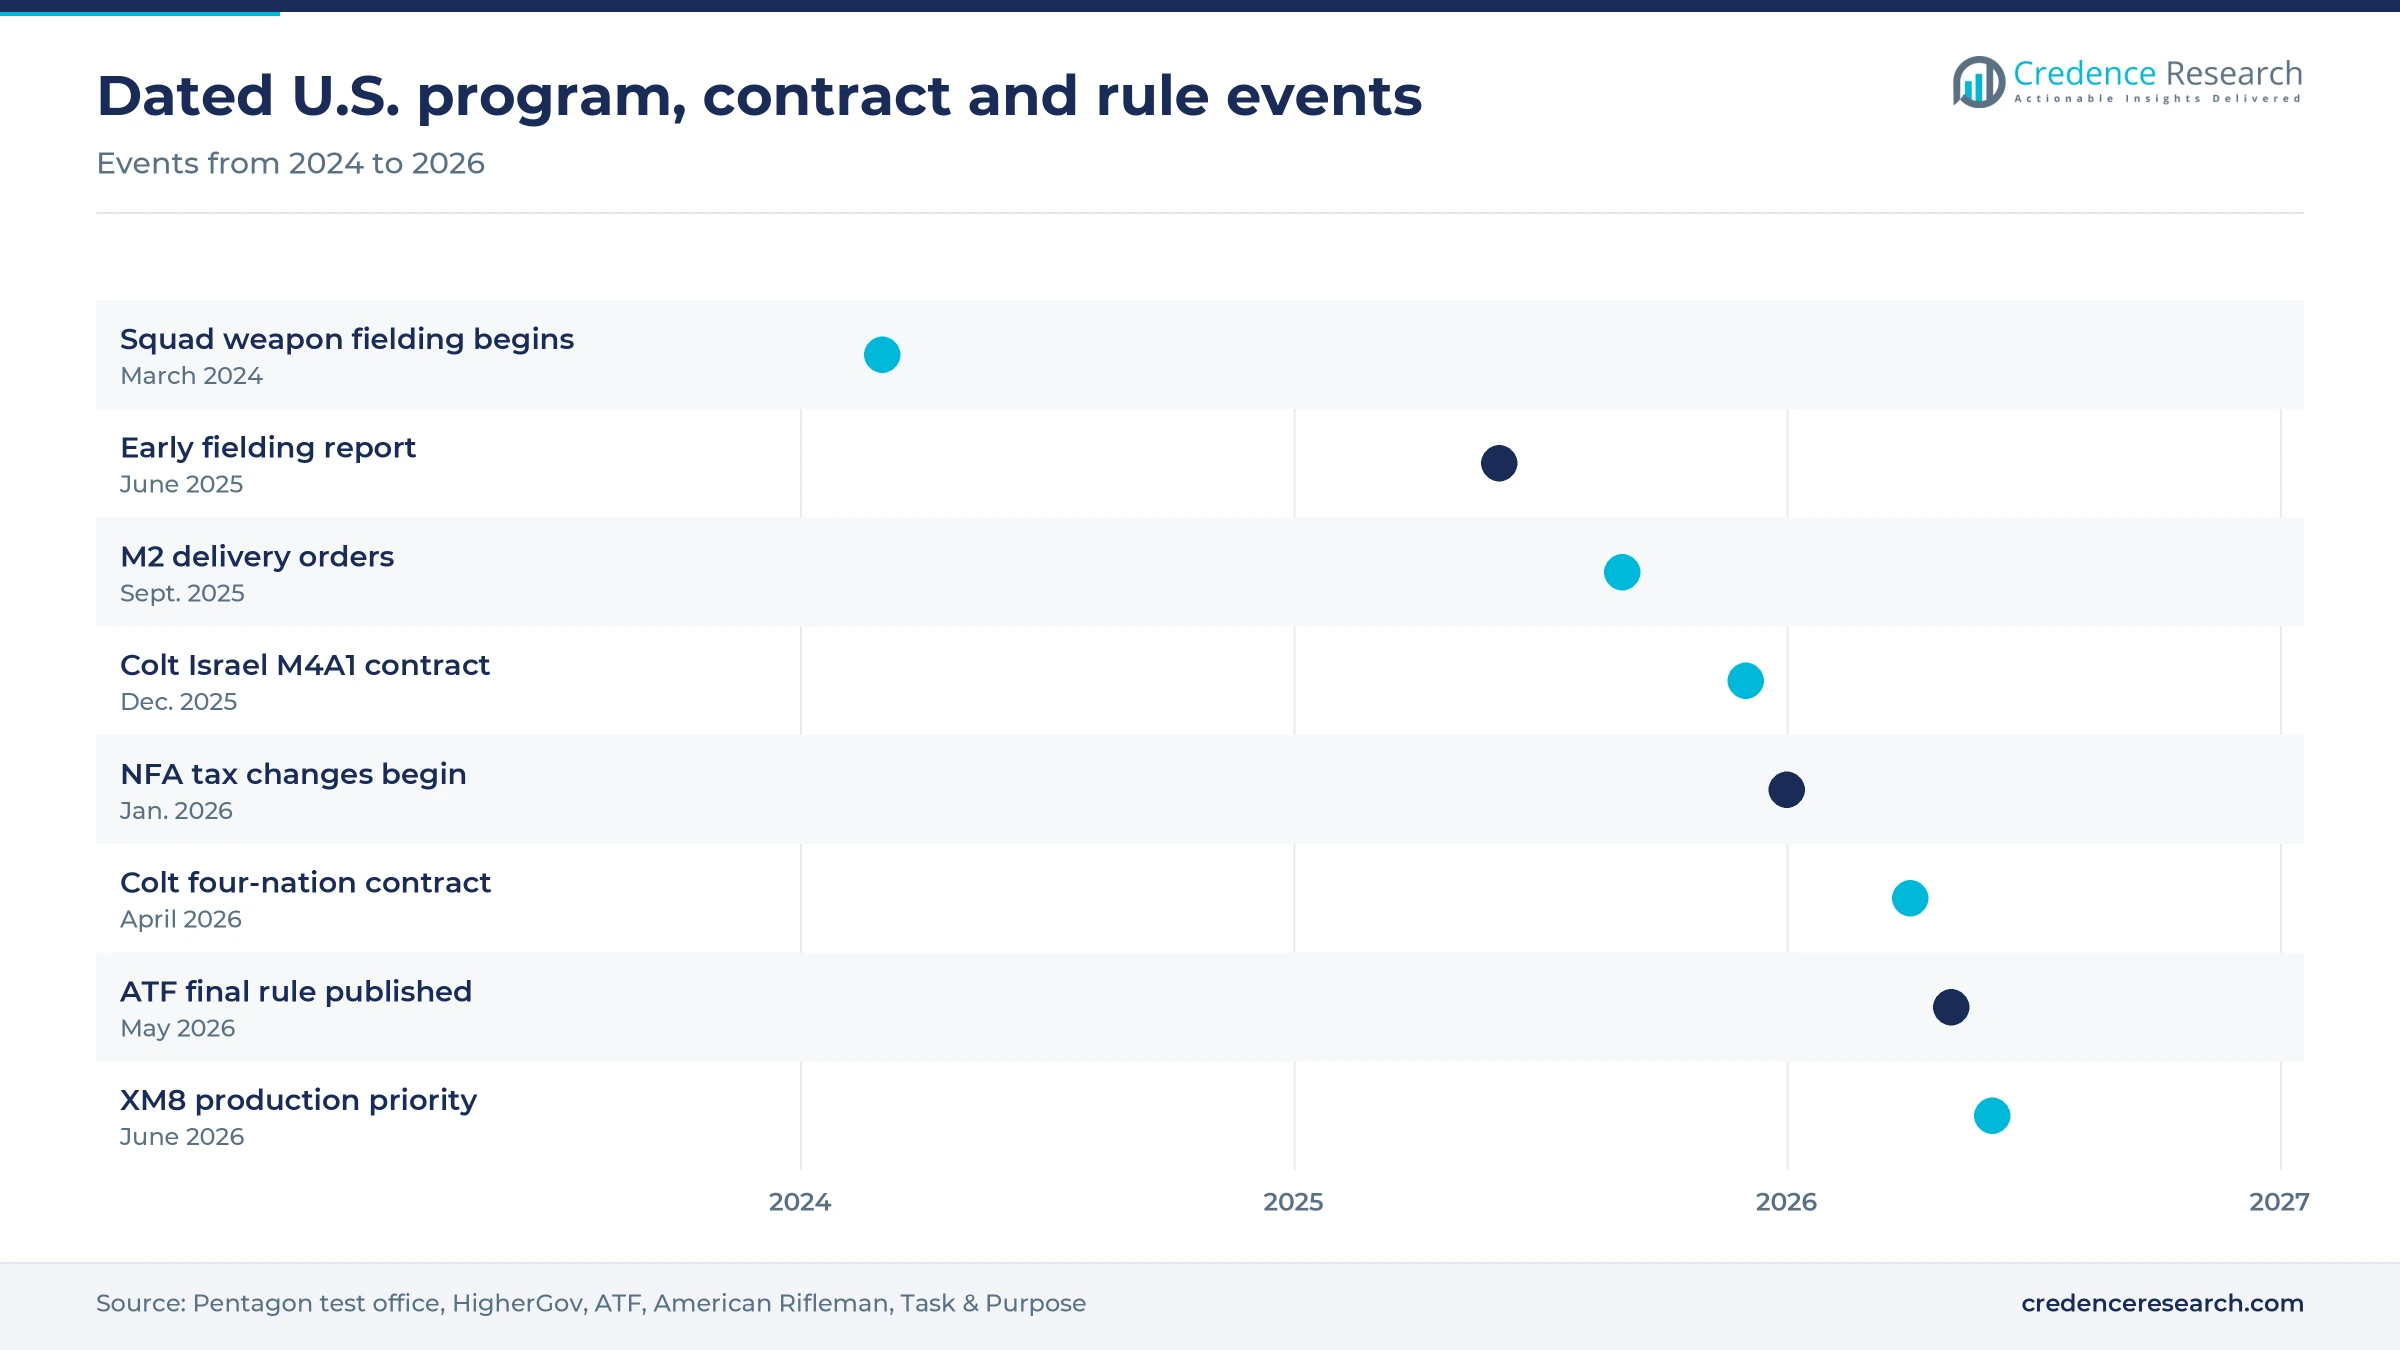
The largest driver is the Army decision to replace the M4 carbine and M249 in close combat units with the Next Generation Squad Weapon family. Army budget records compiled by HigherGov show the procurement line rising from $295.4 million in fiscal 2024 to $762.0 million in fiscal 2025, with $724.1 million enacted for fiscal 2026. Army Recognition reported that the fiscal 2026 request covered 16,154 M7 rifles and 2,636 M250s. Fielding began in March 2024, and Army.mil reported the 101st Airborne Division firing the weapons at Fort Campbell in April 2025. As a result, Selective-fire rifles and carbines hold 52.0% of 2025 market value, and renewal should remain the main revenue source for several more fiscal years.
Recurring sustainment keeps legacy lines and vendors busy
Legacy fleets continue to generate orders because the new family does not replace every weapon in service. HigherGov award records show two M2 and M2A1 delivery orders placed on Sept. 11, 2025, including $11.5 million to Ohio Ordnance Works in Ohio and $8.1 million to U.S. Ordnance in Nevada. ASDNews reported a $9.9 million Army and Navy order for M240B machine guns in March 2026, after a $4.9 million M240L order reported in July 2025. The Army M240 budget line also funded 260 units in fiscal 2026 for $6.0 million. These orders are smaller than the squad program, but they are recurring and spread across several suppliers, which steadies demand for crew-served models once new-fleet buying eases.
Government agency renewal adds multiyear contract demand
Federal agencies replace service stocks on their own contract cycles, which adds demand outside the defense budget. A March 2026 Department of Homeland Security forecast shows Customs and Border Protection planning a five-year, sole-source contract worth $5 million to $10 million for B&T America submachine guns, starting in September 2026. A May 2024 forecast showed Immigration and Customs Enforcement planning a similar $5 million to $10 million contract for SIG Sauer MPX models, and a December 2023 notice cited 1,400 MPX weapons already in service. DHS also runs a five-year duty rifle contract with Geissele Automatics through September 2027. Because these contracts recur, Law enforcement agencies grow fastest at 6.04% a year through 2035.
A fixed registered pool supports civilian transfer values
The civilian channel adds a small but distinct source of value because federal law limits the stock that private buyers may hold. ATF registry data counted about 2,382,403 machine guns on the national register in June 2025, yet only about 234,718 were transferable to or between private individuals. Section 922(o) of the federal criminal code, as published by the Cornell Legal Information Institute, ties lawful private possession to weapons held before that subsection took effect. Supply therefore cannot expand through new production, so values depend on resale activity among registered holders. Civilian transferable owners hold a small slice of market value, and this fixed pool keeps resale activity tied to registered stock rather than to new factory output through 2035.
Carbine priority and multiyear ordering reshape buying
Rising carbine priority shifts the squad weapon mix
The clearest shift is a move away from the M7 rifle toward the shorter XM8 carbine within the same program. An Army spokesman announced in June 2026, according to Task & Purpose, that the production line had changed to the XM8, and the report added that no M7s had been bought in fiscal 2026 by then. The fiscal 2027 request lists 14,944 XM8 carbines, 2,795 M250s and 20,402 fire control systems, according to HigherGov budget records. Sig Sauer told Task & Purpose that the M7 remains in service and that the company would support production and sustainment. For suppliers, the change alters the product mix inside Selective-fire rifles and carbines, while future buys remain described by the Army as predecisional.
Multiyear ordering vehicles spread awards across suppliers
Buyers increasingly rely on multiyear, indefinite-quantity vehicles rather than single large purchases, which changes how revenue arrives. The Army signed a 10-year squad weapon contract with SIG Sauer in April 2022, with a first delivery order of $20.4 million, according to Defense Daily. M2 requirements were split across two suppliers on Sept. 11, 2025, with both orders running into 2027. The Customs and Border Protection plan runs from September 2026 to August 2031, and American Rifleman reported that Colt M4 foreign sales work on an April 2026 contract runs to March 2031. Consequently, vendors see more predictable ceilings but less certain annual volume, which favors firms able to hold capacity across uneven order years.
Foreign sales work opens added capacity for U.S. plants
Foreign Military Sales sit outside the counted market, yet foreign small arms programs offer domestic plants an opening to keep lines active as U.S. buying changes. HigherGov records show a $12.9 million Colt contract on Dec. 15, 2025, for M4A1 carbines sold to Israel, performed in West Hartford, Connecticut. American Rifleman reported a further $40.9 million Colt contract dated April 1, 2026, covering carbines for Bosnia and Herzegovina, Iraq, Macedonia and Tunisia. The same report cites a Feb. 6, 2026, executive order aimed at reducing transfer delays. For Northeastern suppliers holding 18.0% of domestic value, this export work can support skilled labor and fixed plant costs, particularly as M4 demand from the Army itself falls away.
Post-fielding fixes create an opening for sustainment work
Test findings on the new family create an opportunity for suppliers able to deliver upgrades, spares and support. The Pentagon test office report for fiscal 2025 recommended that the Army address its June 2025 early fielding report, and it found that reliability and cold weather compatibility need improvement. Army budget records compiled by HigherGov show infantry support weapons research funding of $134.2 million enacted for fiscal 2026, with work listed on the M7, XM8 and M250. Fort Bliss, Texas, hosted desert testing that Army.mil reported in August 2025, and earlier cold weather trials ran at Fort Greely, Alaska, in February 2024. As a result, Unit-level support weapons and other fielded categories should create aftermarket revenue beyond the initial purchase.
Funding cliffs and test findings temper the outlook
Squad weapon funding steps down sharply after fiscal 2026
The biggest risk is a funding step-down after the program peak. HigherGov budget records show the line falling from $724.1 million enacted in fiscal 2026 to a $372.6 million request for fiscal 2027, with forecasts near $365 million to $373 million through 2031. Prime vendors and subcontractors face lower annual volume as a result. This makes delivery timing and follow-on orders more important, so suppliers can ease the gap only by widening sustainment and agency work.
Test findings add reliability and schedule risk
Published test results add program risk for the new weapon family. The Pentagon test office said its June 2025 report found that reliability, safety, human-systems integration and cold weather compatibility need improvement, and it recorded fire control problems on most M250s in testing. These findings affect the Army and SIG Sauer directly, because fixes can absorb funds and delay fielding decisions. The program was also due to move into separate acquisition programs in the third quarter of fiscal 2026, so oversight of those fixes changes hands.
Legacy machine gun budget lines are running out
Legacy product lines also face a clearly visible funding end. HigherGov records show the Army M240 line falling from $33.4 million in fiscal 2025 to $6.0 million in fiscal 2026, with nothing requested in fiscal 2027 or forecast through 2031. FN America and its suppliers feel this first, since recurring orders can stop without a replacement program. As a result, suppliers need Navy, agency and support revenue to keep crew-served lines efficient once Army new-production buys end.
Tax and registry limits cap the civilian channel
Civilian transfers face limits that newer tax relief did not remove. The ATF final rule of May 8, 2026 confirmed that the making and transfer tax on machine guns stays at $200 while silencers and short-barreled firearms fall to zero. ATF also cautions that its 234,718 transferable count may include nonfunctional weapons and those held by government or licensed entities. Dealers therefore serve a narrow slice of the wider firearms trade, and growth depends on price rather than unit volume.
South leads on plants, posts and registered stock
| Region | Value, 2025 (USD million) | Share, 2025 | CAGR, 2026–2035 |
|---|---|---|---|
| South | 268.3 | 37.5% | 5.50% |
| West | 178.9 | 25.0% | 5.35% |
| Midwest | 139.5 | 19.5% | 5.05% |
| Northeast | 128.8 | 18.0% | 4.90% |
South combines machine gun plants, Army posts and registered stock
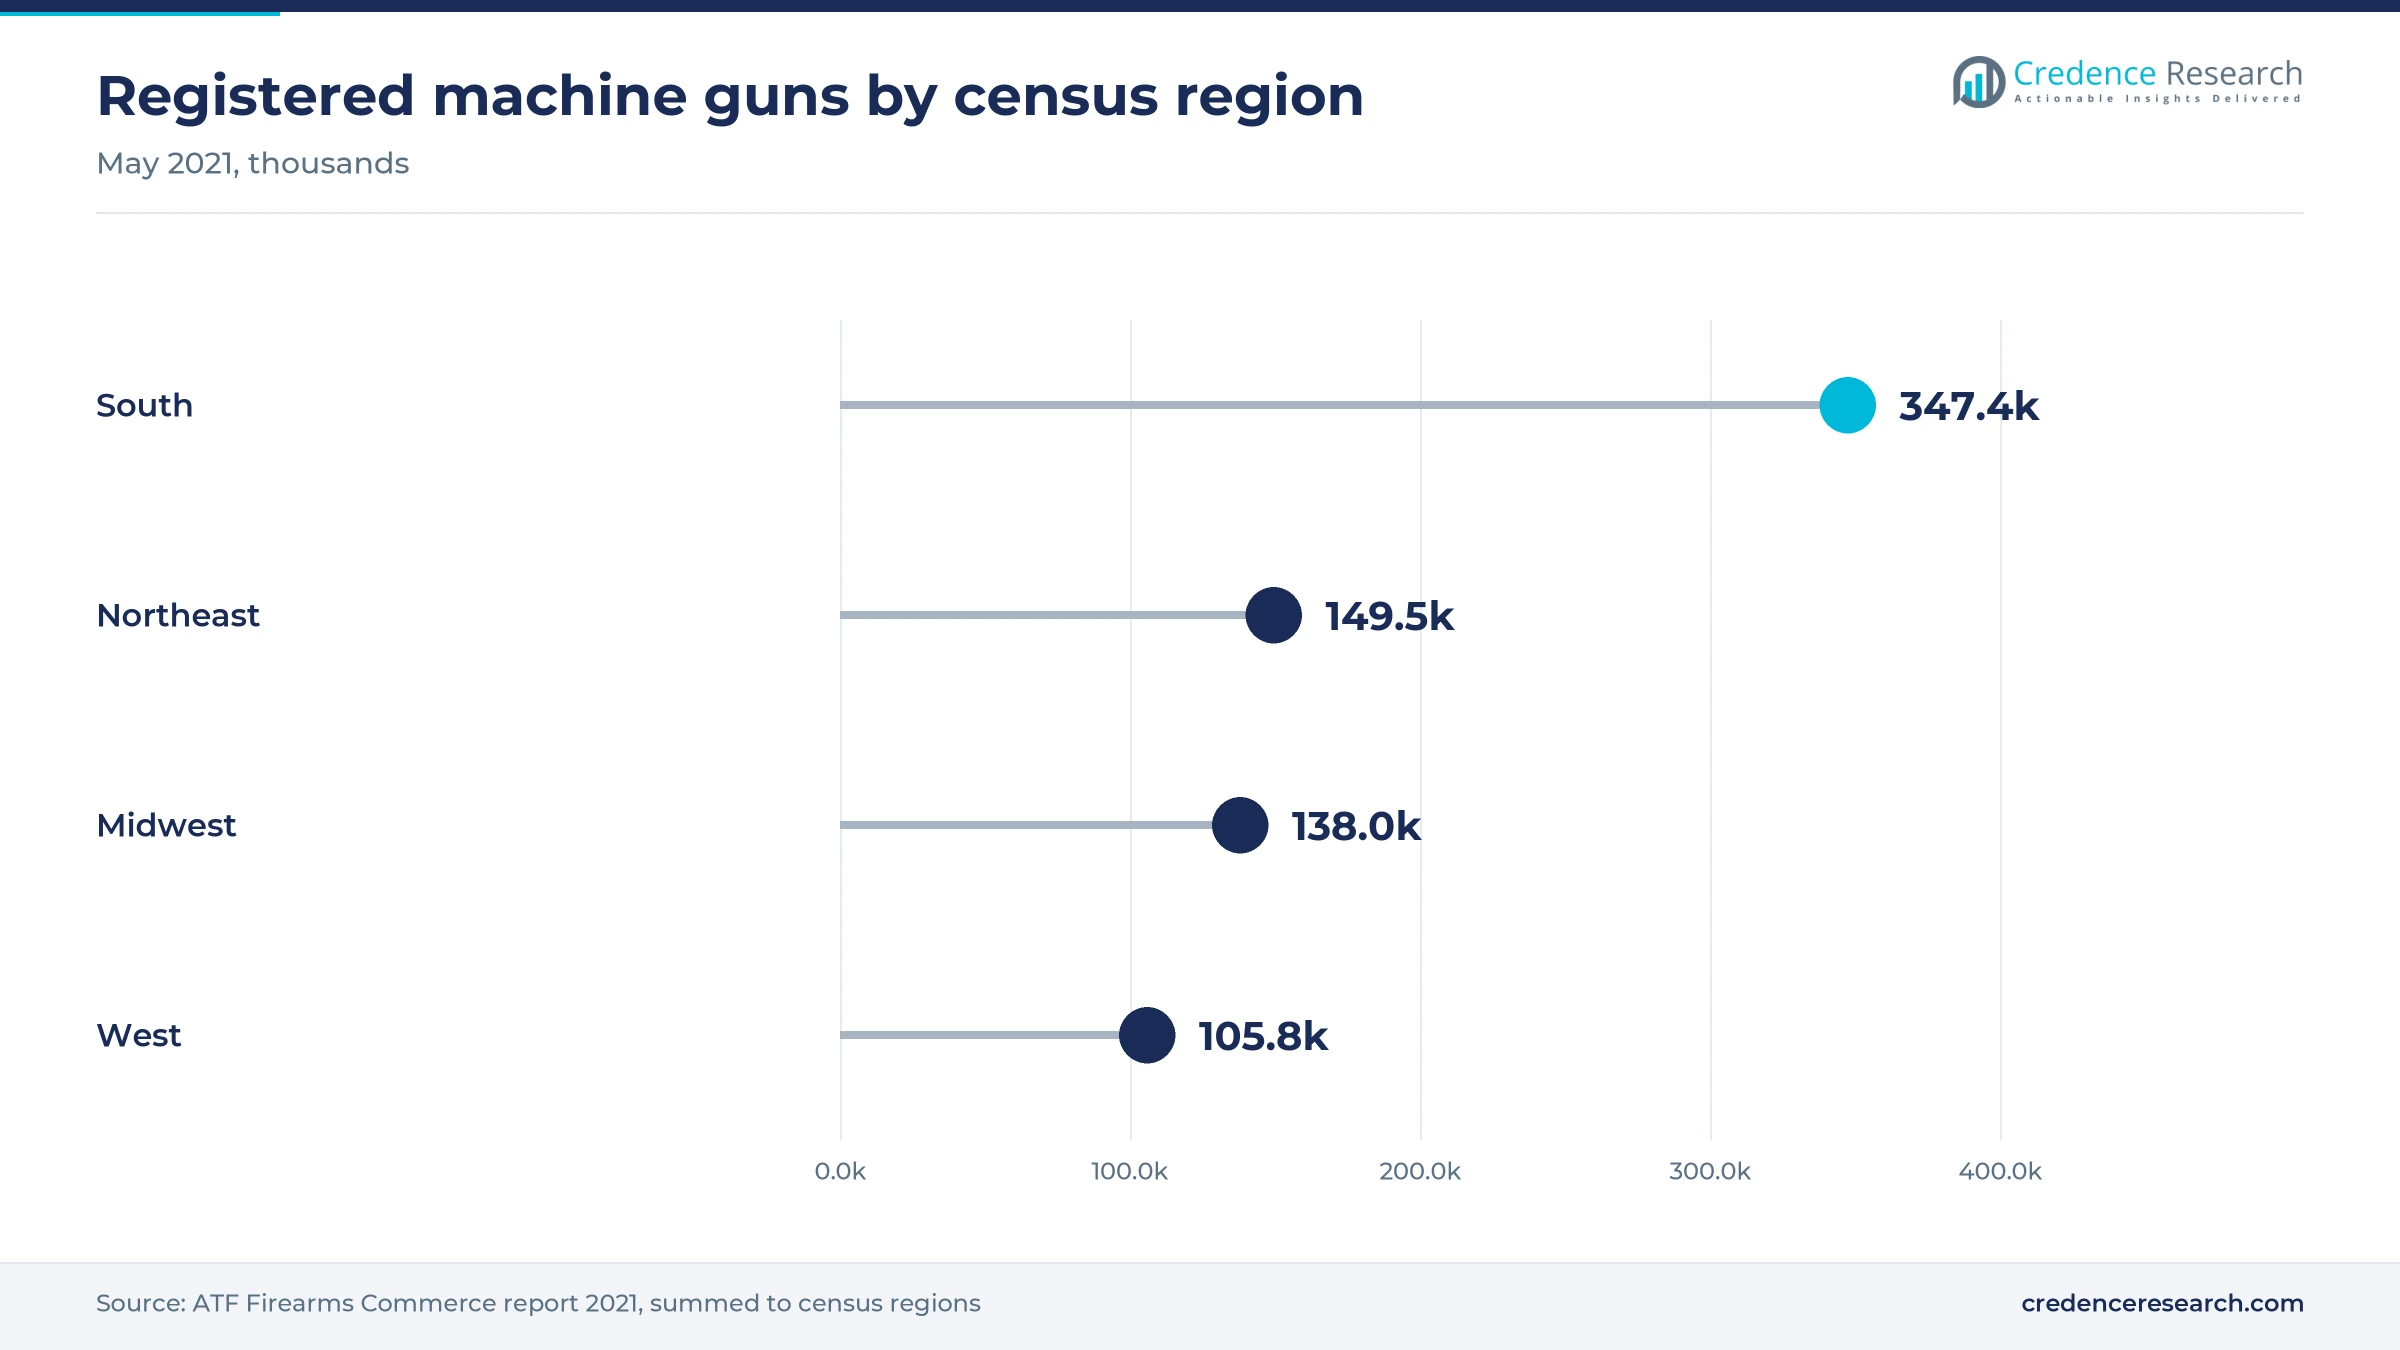
The South held 37.5% of 2025 value and grows at 5.50% a year, the fastest regional rate. FN America builds M240 models in Columbia, South Carolina and the firm has produced there since 1981, according to ASDNews. Fort Campbell, Kentucky, was the first unit site for the new squad weapons, and Fort Bliss, Texas, hosted 2025 desert trials. SIG Sauer also announced a $150 million expansion in Jacksonville, Arkansas, in October 2023, although that site makes ammunition. Registered stock also concentrates here, with Florida at 47,117 and Texas at 46,318 machine guns in the 2021 ATF commerce report.
West combines large installations with a Nevada supplier
The West held 25.0% of 2025 value and grows at 5.35% a year. U.S. Ordnance in Sparks, Nevada, won an M2 and M2A1 order worth up to about $8.1 million on Sept. 11, 2025, according to HigherGov records. California counted 29,112 registered machine guns in the 2021 ATF report, the largest Western total. Fort Greely, Alaska, also hosted natural environment testing in February 2024. The region counted 80.1 million residents in Census Bureau 2025 estimates, which frames agency demand.
Midwest demand rests on Ohio production and registered holdings
The Midwest held 19.5% of 2025 value and grows at 5.05% a year. Ohio Ordnance Works in Chardon, Ohio, holds an $11.5 million M2 and M2A1 order running to July 2027, according to HigherGov records, which ties the region directly to crew-served sustainment. Registered stock is also meaningful, because Illinois counted 30,576 machine guns and Ohio counted 22,979 in the 2021 ATF report. Growth is slower because the region has fewer squad weapon fielding sites than the South.
Northeast holds contracting offices and legacy carbine work
The Northeast held 18.0% of 2025 value and grows at 4.90% a year, the slowest regional rate. Army Contracting Command at Picatinny, New Jersey, awards many of the program contracts, and Colt performs carbine work in West Hartford, Connecticut. New Jersey counted 44,422 registered machine guns and Connecticut counted 35,235 in the 2021 ATF report, and ATF counts registrations from every type of applicant. The region grows more slowly because Army M4 replacement demand is falling and part of the Colt workload is exported.
Contract awards and rules moved the market in 2025–26
| Development | Status and market relevance |
|---|---|
| In March 2024, the Army issued urgent materiel release for the M7, M250 and fire control and began fielding them. | Fielding continues across close combat units, according to the Pentagon test office. |
| In September 2025, Army Contracting Command placed M2 and M2A1 orders with Ohio Ordnance Works and U.S. Ordnance. | Both orders run into 2027 and support crew-served sustainment. |
| In March 2026, FN America was reported to hold a $9.9 million Army and Navy order for M240B machine guns. | The order keeps the Columbia, South Carolina, line active as the Army budget line ends. |
| In May 2026, ATF published its final rule aligning National Firearms Act tax provisions with Public Law 119-21. | Machine gun transfers stay taxed at $200, so civilian channel economics are unchanged. |
| In June 2026, the Army confirmed that the squad weapon production line had changed to the XM8 carbine. | Future buys remain predecisional, but the fiscal 2027 request is built around carbines. |
Acquisition changes now shape who gets paid and when
- Rapid fielding authority allowed the squad weapon program to start under Middle Tier of Acquisition rules approved in March 2022, ahead of a planned move to major capability programs.
- Indefinite-quantity contracts let agencies set ceilings and order over five years, as shown by the Customs and Border Protection plan valued at up to $10 million.
- Dual-sourced delivery orders spread M2 and M2A1 requirements across Ohio Ordnance Works and U.S. Ordnance on the same date in September 2025.
- The Soldier Enhancement Program funds rapid assessment of commercial items under an Army approach that its budget text describes as buy, try and decide.
- Electronic tax stamps became permitted under the May 2026 ATF rule, which modernizes the approval record without altering the $200 machine gun tax.
Need a Custom Version of This Report?
Tailor the scope, geography, or segments to your exact requirements.
- Custom geography or segment scope
- Direct access to our analyst team
A few prime vendors hold most federal program work
Competition is concentrated because federal program awards are long, specific and hard to displace. SIG Sauer holds the Army squad weapon award, which it won over LoneStar Future Weapons in 2022, and it also supplies MPX models used by Immigration and Customs Enforcement. FN America keeps machine gun lines in Columbia, South Carolina, covering M240, M249, MK 46 and MK 48 work, and it announced a $33 million Pickens County plant in April 2023. Colt remains the named source for M4A1 carbine foreign sales. Ohio Ordnance Works and U.S. Ordnance split recent M2 orders, and this keeps a second source available to the Army. Smaller vendors compete in agency niches, such as Geissele Automatics for DHS duty rifles, B&T America for Customs and Border Protection, and Arms Unlimited as an FBI reseller. Pricing pressure therefore comes mostly at recompete dates rather than through ongoing rivalry.
Companies profiled and their roles in this market
| Company | Type | Role in the market |
|---|---|---|
| SIG Sauer | Prime manufacturer | Army Next Generation Squad Weapon prime under the 10-year award of April 2022, and MPX supplier to ICE |
| FN America | Prime manufacturer | M240 machine gun orders for the Army and Navy, built in Columbia, South Carolina |
| Colt's Manufacturing | Prime manufacturer | M4A1 carbine contracts awarded through Army Contracting Command, performed in West Hartford, Connecticut |
| Ohio Ordnance Works | Machine gun supplier | M2 and M2A1 delivery order of about $11.5 million placed in September 2025 |
| U.S. Ordnance | Machine gun supplier | M2 and M2A1 delivery order worth up to about $8.1 million placed in September 2025 |
| B&T America | Agency supplier | Named source in the Customs and Border Protection submachine gun forecast of March 2026 |
| Geissele Automatics | Agency supplier | Holder of the DHS 5.56 duty rifle contract running through September 2027 |
| Arms Unlimited | Reseller | FBI Colt carbine replacement parts contract valued at $9 million, reported in June 2025 |
Sustainment and agency work will steady U.S. revenue
Credence Research's view is that the market is moving from a fleet-renewal peak toward a broader revenue base. The fiscal 2027 step-down to $372.6 million will test program suppliers, although deliveries from earlier budgets should cushion near-term revenue. Longer-term growth depends on sustainment after fielding, agency contract renewals and later replacement cycles rather than on repeating 2025 budget levels. The estimate is most sensitive to the size of the XM8 buy, which the Army still calls predecisional. Buyers and suppliers should therefore watch fiscal 2028 budget documents and the separate acquisition programs that follow the rapid fielding phase.
How the U.S. estimate was built from public records
The report uses 2025 as the base year and 2026 to 2035 as the forecast period. Market values come from the Credence Research model, which was checked against a bottom-up view of public budget lines, federal contract records and ATF registry statistics. Regional and segment shares are Credence Research estimates informed by contractor locations, Army fielding sites and registered stock by state. Sources used include Defense Department budget data compiled by HigherGov, Pentagon test reports, Federal Register notices, ATF statistics, Department of Homeland Security forecasts and named trade publications. No interviews or surveys were conducted for this edition of the report. The estimate excludes ammunition, optics, accessories and Foreign Military Sales.
Fleet transition gives way to steadier buying by 2035
From 2026 to 2035, the market is forecast to rise from USD 760.0 million to USD 1.21 billion at a 5.27% CAGR. Early years depend on deliveries already funded and the size of the carbine buy, while later years depend on agency renewals, upgrades and replacement of legacy support weapons. The South should keep its regional lead as Army fielding and FN America work continue. Adjacent demand for small-caliber ammunition will follow fielding but stays outside this estimate. Program test outcomes and budget decisions remain the main sources of variance through the forecast period.
Frequently Asked Questions
How big is the USA automatic weapons market?
Which product type leads the U.S. market?
Which U.S. region is largest?
What is driving spending in this market?
How did the fiscal 2027 budget change the outlook?
How large is the civilian part of the market?
Who are the main suppliers in the U.S. market?
What does the estimate exclude?
Table of Content
Chapter 1 Market Segmentation
- 1.1 Segmentation Framework
- 1.1.1 Product and Service Classification
- 1.1.2 Application and End-Use Classification
- 1.1.3 Technology and Solution Classification
- 1.1.4 Customer and Distribution Channel Classification
- 1.1.5 Geographic Segmentation
- 1.1.6 Market Segment Definitions and Boundaries
- 1.2 By Product Type
- 1.2.1 Selective-fire rifles and carbines
- 1.2.2 Light machine guns
- 1.2.3 Medium and heavy machine guns
- 1.2.4 Submachine guns
- 1.3 By Application
- 1.3.1 Individual service weapons
- 1.3.2 Unit-level support weapons
- 1.3.3 Crew-served weapons
- 1.3.4 Civilian collections
- 1.4 By Customer Type
- 1.4.1 Regular defense procurement buyers
- 1.4.2 Law enforcement agencies
- 1.4.3 Civilian transferable owners
- 1.4.4 Specialized government buyers
- 1.5 By Sales Channel
- 1.5.1 Direct government contracts
- 1.5.2 Agency dealer procurement
- 1.5.3 Licensed civilian transfers
Chapter 2 Introduction
- 2.1 Report Objectives and Scope
- 2.2 Product Definition and Industry Terminology
- 2.3 Market Inclusions and Exclusions
- 2.4 Research Process
- 2.4.1 Primary Research and Expert Interviews
- 2.4.2 Secondary Research and Source Review
- 2.4.3 Top-Down and Bottom-Up Estimation
- 2.4.4 Data Triangulation and Verification
- 2.5 Market Size Measurement Basis
- 2.5.1 2025: USD 715.5 million → 2035: USD 1.21 billion
- 2.6 Historical and Forecast Reference Periods
- 2.6.1 Historical Period: 2018-2025
- 2.6.2 Base Year: 2025
- 2.6.3 Forecast Period: 2025-2035
- 2.7 Research Assumptions and Limitations
Chapter 3 Executive Summary
- 3.1 Market Snapshot and Key Findings
- 3.2 Base-Year Market Size, 2025
- 3.3 Forecast Market Size, 2035
- 3.4 Revenue and Volume Growth Outlook
- 3.5 Key Demand and Supply Indicators
- 3.6 Leading Market Segments
- 3.7 Fastest-Growing Market Opportunities
- 3.8 Regional Performance Highlights
- 3.9 Technology and Industry Transformation
- 3.10 Competitive Landscape Summary
- 3.11 Analyst View and Strategic Implications
Chapter 4 USA Automatic Weapons Market Trends and Developments
- 4.1 Historical Industry Development, 2018-2025
- 4.2 Recent Market Trends and Developments
- 4.3 Demand and Customer Behavior Trends
- 4.4 Technology and Product Innovation
- 4.5 Artificial Intelligence, Automation and Digitalization
- 4.6 Local Manufacturing and Supply Chain Realignment
- 4.7 Industry Partnerships, Mergers and Acquisitions
- 4.8 Sustainability and Circular Economy Developments
- 4.9 Government and Private Sector Investment Trends
- 4.10 Emerging Business Models and Commercialization
- 4.11 Industry Developments and Announcements
Chapter 5 USA Automatic Weapons Market Production, Supply and Demand Analysis
- 5.1 Demand Trend and Consumption Analysis, 2018-2025
- 5.2 Demand Forecast, 2025-2035
- 5.3 Production and Output Trend, 2018-2025
- 5.4 Production and Output Forecast, 2025-2035
- 5.5 Installed Capacity and Capacity Utilization
- 5.6 Company-Wise Production Plants and Statistics
- 5.6.1 Installed Production Capacity
- 5.6.2 Actual Production
- 5.6.3 Planned Capacity and Expansion Targets
- 5.7 Supply Chain Structure and Procurement Trends
- 5.8 Supply-Demand Gap and Bottlenecks
- 5.9 Import Dependence and Sourcing Structure
- 5.10 Contract Manufacturing and Outsourcing
- 5.11 Regional Supply and Demand Concentration
Chapter 6 USA Automatic Weapons Market Pricing Analysis
- 6.1 Pricing Structure and Measurement
- 6.2 Historical Pricing Trends, 2018-2025
- 6.3 Pricing Outlook, 2025-2035
- 6.4 Average Selling Price and Unit Economics
- 6.5 Pricing by Product and Market Segment
- 6.6 Geographic Pricing Differences
- 6.7 Key Input, Energy, Labor and Logistics Costs
- 6.8 Contract Pricing and Purchasing Models
- 6.9 Pricing Sensitivity and Competitive Positioning
- 6.10 Price, Margin and Profitability Implications
Chapter 7 USA Automatic Weapons Market Dynamics
- 7.1 Market Growth Drivers
- 7.1.1 Demand-Side Drivers
- 7.1.2 Technology and Innovation Drivers
- 7.1.3 Infrastructure and Investment Drivers
- 7.1.4 Regulatory and Policy Drivers
- 7.2 Market Restraints
- 7.2.1 Cost and Affordability Constraints
- 7.2.2 Technology and Adoption Barriers
- 7.2.3 Supply Chain and Operational Constraints
- 7.3 Market Challenges
- 7.3.1 Competitive Pressure and Margin Erosion
- 7.3.2 Skills, Infrastructure and Implementation Gaps
- 7.4 Emerging Market Opportunities
- 7.5 Market Dynamics Impact and Time-Horizon Assessment
Chapter 8 USA Automatic Weapons Value Chain Analysis
- 8.1 Industry Value Chain Overview
- 8.2 Upstream Suppliers and Critical Inputs
- 8.3 Technology and Component Providers
- 8.4 Manufacturing or Service Delivery
- 8.5 Distribution, Channel Partners and Integrators
- 8.6 Downstream Applications and End Users
- 8.7 Value Addition and Profit Pools
- 8.8 Vertical Integration and Outsourcing
- 8.9 Supplier Concentration and Risk
- 8.10 Supply Chain Localization and Resilience
Chapter 9 USA Automatic Weapons Market Regulations and Policies
- 9.1 Relevant Laws, Standards and Compliance Frameworks
- 9.2 Product, Service, Safety and Quality Requirements
- 9.3 Government Policies, Incentives and Subsidies
- 9.4 Imports, Exports and Trade Barriers
- 9.5 Public Procurement and Local Content Requirements
- 9.6 Environmental and Sustainability Compliance
- 9.7 Upcoming Policy Changes and Market Implications
Chapter 10 USA Automatic Weapons Market Hotspots and Opportunities
- 10.1 Market Opportunity Mapping and Growth Hotspots
- 10.2 High-Growth Applications and Customer Groups
- 10.3 Underserved Markets and White-Space Opportunities
- 10.4 Emerging Technology and Product Opportunities
- 10.5 New Capacity and Investment Hotspots
- 10.6 Market Entry and Expansion Opportunities
- 10.7 Distribution and Partnership Opportunities
- 10.8 Near-Term and Long-Term Commercial Potential
- 10.9 Opportunity Attractiveness and Execution Risks
Chapter 11 USA Automatic Weapons Market Outlook, 2025-2035
- 11.1 Market Size and Analysis
- 11.1.1 Revenue (Market Measurement: 2025: USD 715.5 million → 2035: USD 1.21 billion)
- 11.1.2 Market Volume and Quantity Sold
- 11.1.3 Historical Market Size, 2018-2025
- 11.1.4 Base-Year Market Size, 2025
- 11.2 Market Forecast, 2025-2035
- 11.2.1 Revenue Forecast to 2035
- 11.2.2 Volume Forecast to 2035
- 11.2.3 CAGR and Year-on-Year Growth
- 11.2.4 Incremental Revenue Opportunity
- 11.3 Forecast Assumptions and Scenario Analysis
- 11.3.1 Base-Case Forecast
- 11.3.2 Optimistic and Conservative Scenarios
- 11.3.3 Technology, Pricing and Policy Sensitivities
- 11.4 Market Attractiveness and Growth Outlook
Chapter 12 USA Automatic Weapons Market Segmentation and Outlook
- 12.1 Segmentation Summary and Market Shares, 2025
- 12.2 Largest and Fastest-Growing Segments
- 12.3 By Product Type - Market Size and Forecast, 2025-2035
- 12.3.1 Segment Definition and Scope
- 12.3.2 Historical Market Size, 2018-2025
- 12.3.3 Revenue Forecast, 2025-2035
- 12.3.4 Volume Forecast, 2025-2035
- 12.3.5 Base-Year Market Share, 2025
- 12.3.6 Segment CAGR and Growth Drivers
- 12.3.7 Subsegment Market Size and Forecast
- 12.3.7.1 Selective-fire rifles and carbines
- 12.3.7.2 Light machine guns
- 12.3.7.3 Medium and heavy machine guns
- 12.3.7.4 Submachine guns
- 12.3.8 Subsegment Pricing and Adoption Trends
- 12.3.9 Leading Suppliers and Competition
- 12.3.10 Regional Demand and Opportunities
- 12.4 By Application - Market Size and Forecast, 2025-2035
- 12.4.1 Segment Definition and Scope
- 12.4.2 Historical Market Size, 2018-2025
- 12.4.3 Revenue Forecast, 2025-2035
- 12.4.4 Volume Forecast, 2025-2035
- 12.4.5 Base-Year Market Share, 2025
- 12.4.6 Segment CAGR and Growth Drivers
- 12.4.7 Subsegment Market Size and Forecast
- 12.4.7.1 Individual service weapons
- 12.4.7.2 Unit-level support weapons
- 12.4.7.3 Crew-served weapons
- 12.4.7.4 Civilian collections
- 12.4.8 Subsegment Pricing and Adoption Trends
- 12.4.9 Leading Suppliers and Competition
- 12.4.10 Regional Demand and Opportunities
- 12.5 By Customer Type - Market Size and Forecast, 2025-2035
- 12.5.1 Segment Definition and Scope
- 12.5.2 Historical Market Size, 2018-2025
- 12.5.3 Revenue Forecast, 2025-2035
- 12.5.4 Volume Forecast, 2025-2035
- 12.5.5 Base-Year Market Share, 2025
- 12.5.6 Segment CAGR and Growth Drivers
- 12.5.7 Subsegment Market Size and Forecast
- 12.5.7.1 Regular defense procurement buyers
- 12.5.7.2 Law enforcement agencies
- 12.5.7.3 Civilian transferable owners
- 12.5.7.4 Specialized government buyers
- 12.5.8 Subsegment Pricing and Adoption Trends
- 12.5.9 Leading Suppliers and Competition
- 12.5.10 Regional Demand and Opportunities
- 12.6 By Sales Channel - Market Size and Forecast, 2025-2035
- 12.6.1 Segment Definition and Scope
- 12.6.2 Historical Market Size, 2018-2025
- 12.6.3 Revenue Forecast, 2025-2035
- 12.6.4 Volume Forecast, 2025-2035
- 12.6.5 Base-Year Market Share, 2025
- 12.6.6 Segment CAGR and Growth Drivers
- 12.6.7 Subsegment Market Size and Forecast
- 12.6.7.1 Direct government contracts
- 12.6.7.2 Agency dealer procurement
- 12.6.7.3 Licensed civilian transfers
- 12.6.8 Subsegment Pricing and Adoption Trends
- 12.6.9 Leading Suppliers and Competition
- 12.6.10 Regional Demand and Opportunities
- 12.7 Segment Growth Comparison
- 12.8 Segment Attractiveness and Priority Matrix
Chapter 13 USA Automatic Weapons End-Use and Application Market Outlook
- 13.1 End-Use Industry and Customer Demand Structure
- 13.2 Leading Applications and Customer Groups
- 13.3 End-Use Market Size, Share and Forecast
- 13.4 Major End-Use Industry Deep Dives
- 13.4.1 Customer Requirements and Use Cases
- 13.4.2 Demand and Replacement Cycles
- 13.4.3 Technical and Regulatory Considerations
- 13.4.4 Purchasing and Procurement Models
- 13.4.5 Leading Vendors and Distribution Channels
- 13.4.6 Forecast and Commercial Opportunities
- 13.5 Emerging Applications and Cross-Segment Demand
- 13.6 End-Use Industry Investment Priorities
Chapter 14 USA Automatic Weapons Geographic Market Outlook, 2025-2035
- 14.1 Domestic Market Distribution and Demand Clusters
- 14.2 State- or Province-Wise Market Size and Forecast, 2025-2035
- 14.3 City and Metropolitan Market Outlook
- 14.4 Industrial, Manufacturing and Commercial Clusters
- 14.5 Geographic Concentration of Key End Users
- 14.6 Local Pricing and Purchasing Differences
- 14.7 Domestic Production Facilities and Capacity Map
- 14.8 Local Infrastructure and Project Pipeline
- 14.9 State-Level Policy and Incentive Differences
- 14.10 Subnational Investment Hotspots and Opportunities
- 14.11 Distribution and Logistics Networks
- 14.12 Domestic Competitive Footprint
Chapter 15 USA Automatic Weapons Technology, Innovation and Sustainability Outlook
- 15.1 Technology Landscape and Maturity
- 15.2 Product, Process and Service Innovation
- 15.3 AI, Automation and Digital Tools in the Industry
- 15.4 Technology Adoption and Performance Benchmarking
- 15.5 Innovation Pipeline and R&D Investment
- 15.6 Patent and Intellectual Property Trends
- 15.7 Energy Efficiency and Resource Management
- 15.8 Sustainability, Recycling and Circularity
- 15.9 Technology Roadmap, 2025-2035
- 15.10 Risks of Obsolescence and Technology Substitution
Chapter 16 USA Automatic Weapons Market Key Strategic Imperatives
- 16.1 Growth and Market Entry Priorities
- 16.2 High-Return Products and Segments
- 16.3 Pricing, Profitability and Cost Optimization
- 16.4 Technology Investment and Product Differentiation
- 16.5 Supply Chain Localization and Resilience
- 16.6 Distribution and Customer Acquisition
- 16.7 Partnership, Acquisition and Capacity Strategy
- 16.8 Regional Expansion Priorities
- 16.9 Short-, Medium- and Long-Term Actions
Chapter 17 Competition Outlook
- 17.1 Industry Competition Characteristics
- 17.2 Market Structure and Concentration
- 17.3 Market Share and Competitive Positioning, 2025
- 17.4 Company-Wise Revenue and Product Benchmarking
- 17.5 Production and Service Capacity Benchmarking
- 17.6 Technology, Pricing and Differentiation
- 17.7 Regional Footprint and Distribution Strength
- 17.8 Mergers, Acquisitions and Strategic Alliances
- 17.9 New Entrants and Competitive Threats
- 17.10 Porter's Five Forces and Industry Attractiveness
- 17.11 Competitive Outlook, 2025-2035
Chapter 18 Company Profiles
- 18.1 Company Coverage and Selection Criteria
- 18.2 SIG Sauer
- 18.2.1 Business Description
- 18.2.2 Company Ownership and Geographic Presence
- 18.2.3 Product and Service Portfolio
- 18.2.4 Manufacturing and Operating Footprint
- 18.2.5 Production Capacity and Expansion Plans
- 18.2.6 Financial Performance and Investment
- 18.2.7 Market Share and Competitive Position
- 18.2.8 Technology and Innovation Capabilities
- 18.2.9 Strategic Alliances or Partnerships
- 18.2.10 Recent Developments
- 18.2.11 Growth Strategy and Outlook
- 18.3 FN America
- 18.4 Colt's Manufacturing
- 18.5 Ohio Ordnance Works
- 18.6 U.S. Ordnance
- 18.7 B&T America
- 18.8 Geissele Automatics
- 18.9 Arms Unlimited
- 18.10 Other Relevant Market Participants
Note: Every listed company is profiled on the structure shown under the first company. The company list is preliminary and may change based on research findings, market developments, data availability and client requirements.
Chapter 19 Disclaimer
- 19.1 Research and Forecast Disclaimer
- 19.2 Data Source and Estimation Limitations
Note: The depth of individual sections depends on data availability for this market. Volume, capacity, trade and other unit-based metrics are included where applicable.

