
Pilot intake, defense budgets and plant startups fill sims
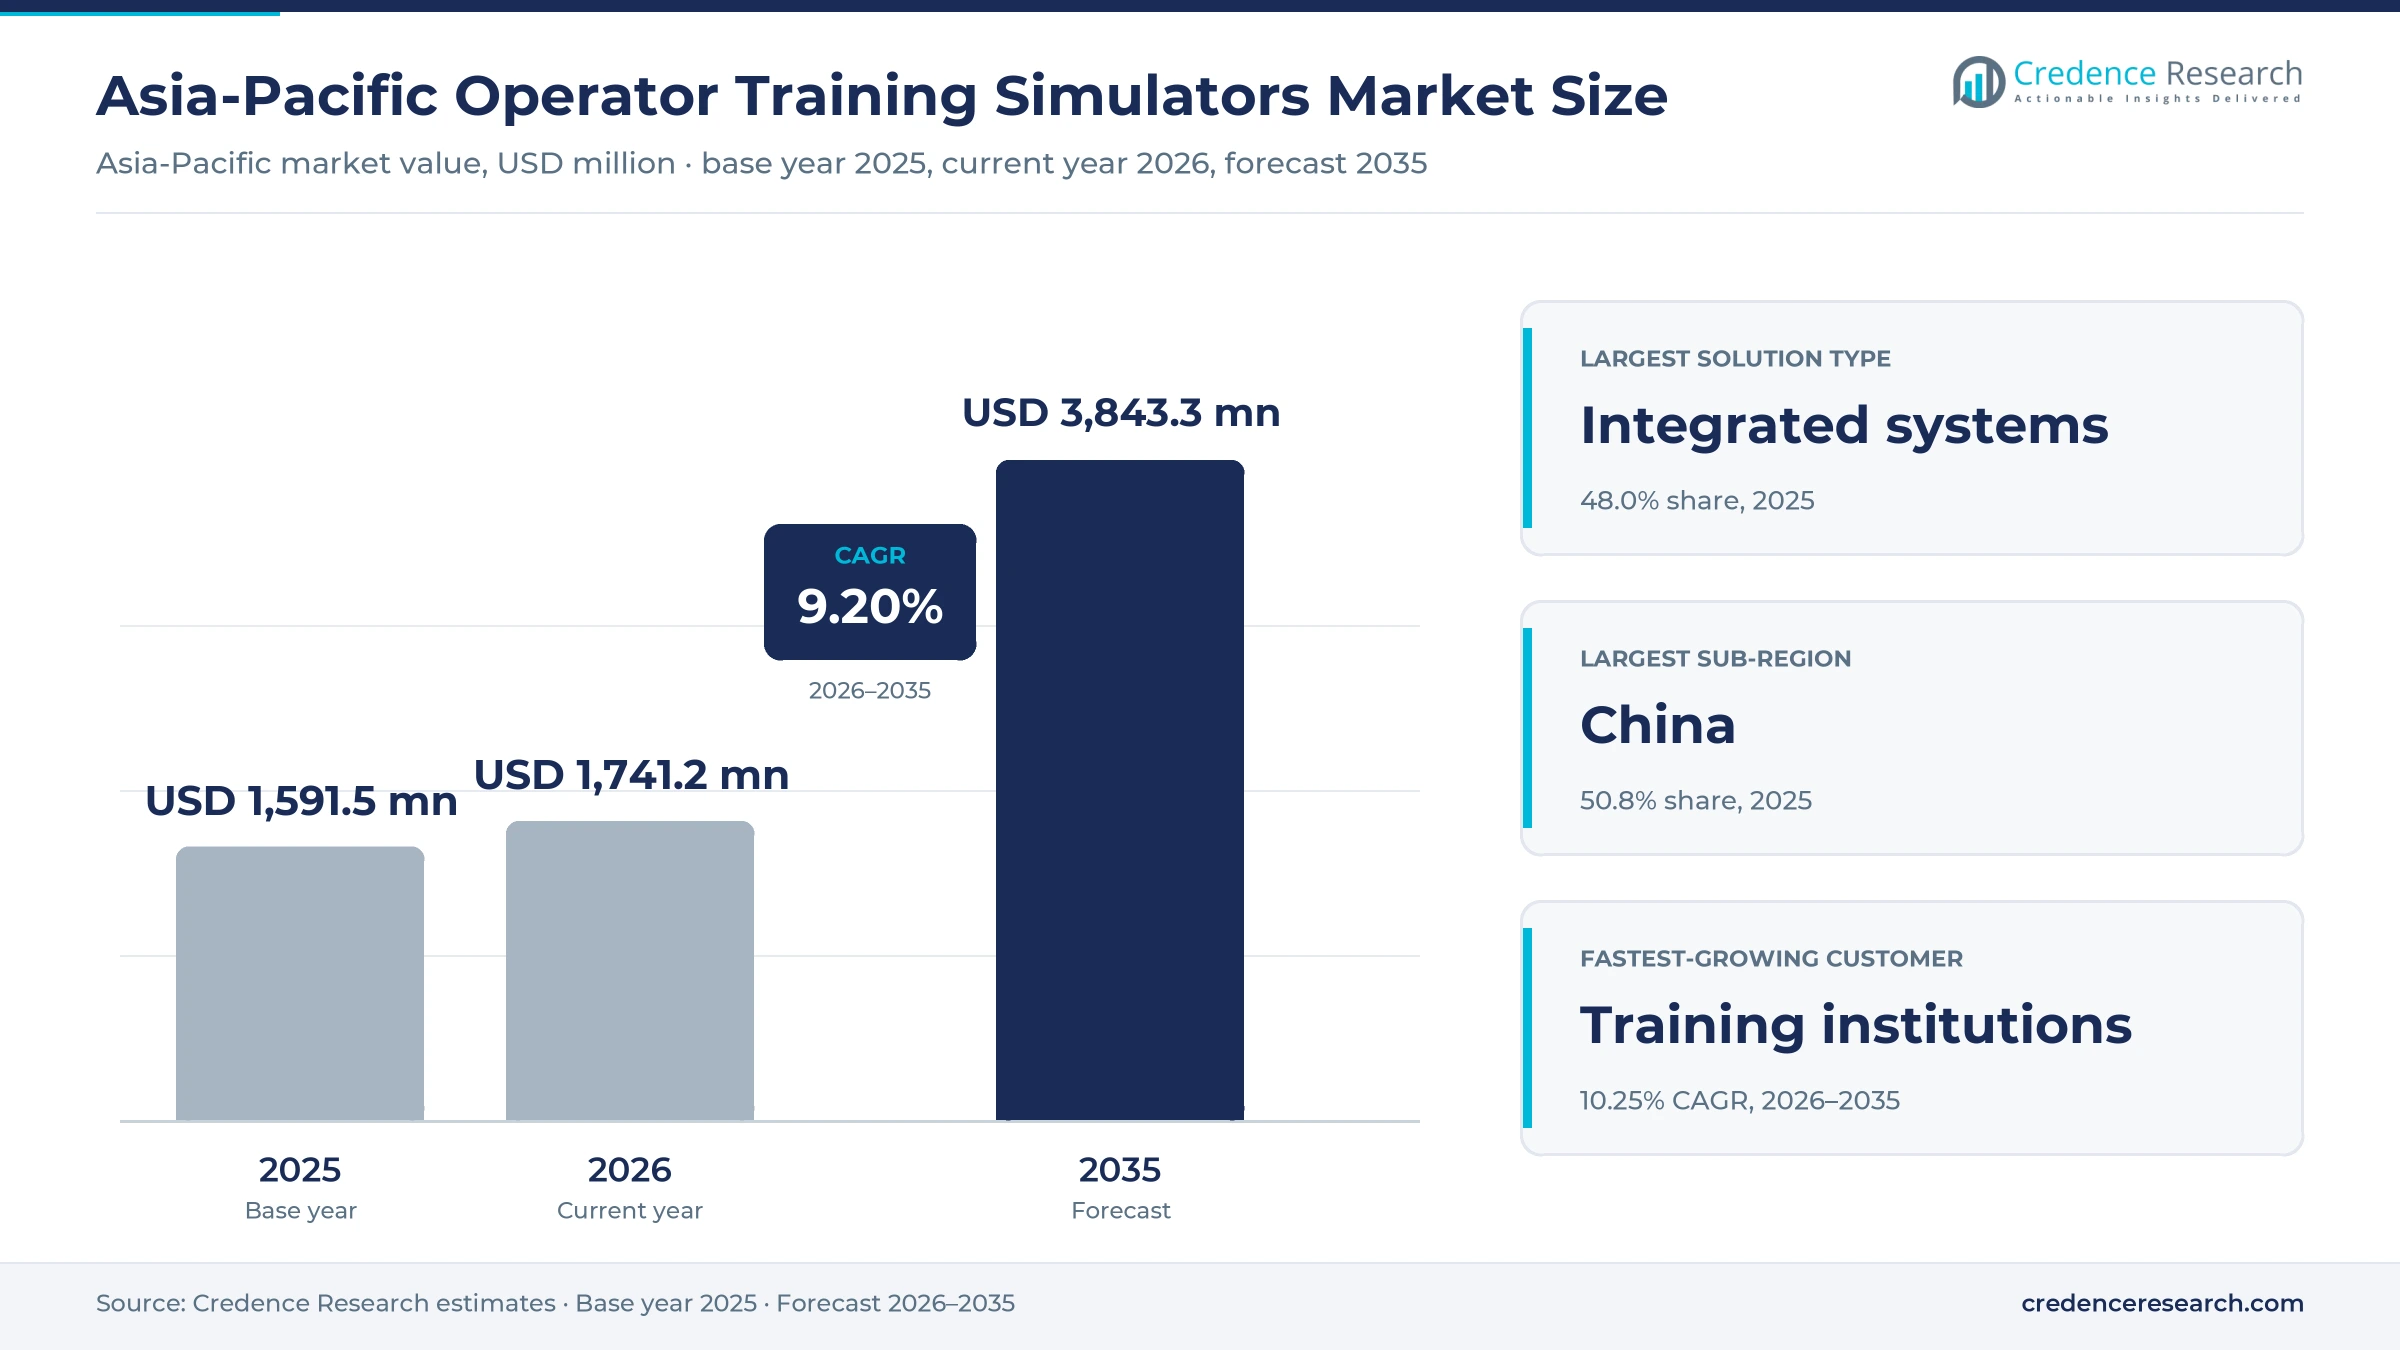
The Asia-Pacific operator training simulators market was valued at USD 1.59 billion in 2025 and is projected to increase from USD 1.74 billion in 2026 to USD 3.84 billion by 2035, registering a CAGR of 9.20% during 2026–2035. Demand comes from airlines that must qualify thousands of new pilots, air forces and navies that move more flying hours into synthetic devices, and refinery, chemical and power operators that rehearse startups before a plant goes live. China held the largest sub-regional share, 50.8% in 2025, because its airlines carried 770 million passengers that year and its training centers keep adding Airbus and Boeing devices. South Asia is the fastest-growing sub-region at 11.10% a year, as Indian carriers and training groups open new simulator centers. Northeast Asia and Oceania and Southeast Asia add defense and maritime demand. In September 2025, Air India and Airbus opened a training academy in Gurugram that will house 10 full flight simulators.
Which training devices and services does the regional estimate cover?
The estimate measures spending on simulators that train people to operate aircraft, military platforms, ships and process plants across the Asia-Pacific region. It covers full flight and mission simulators, control room and process simulation software, the engineering work that connects a simulator to a real control system, and the support contracts that keep devices certified. Values are measured as equipment, license and service payments received by vendors and integrators.
The estimate excludes training hours sold to individual students, aircraft and plant hardware, general engineering design software and entertainment simulators. The value chain runs from motion, visual and modeling suppliers through simulator makers and control system vendors to airlines, defense agencies, plant owners and training academies in China, South Asia, Northeast Asia and Oceania and Southeast Asia.
Asia-Pacific Operator Training Simulators Market Insights
- The Asia-Pacific operator training simulators market was valued at USD 1.59 billion in 2025 and is projected to reach USD 3.84 billion by 2035, registering a CAGR of 9.20% during 2026–2035.
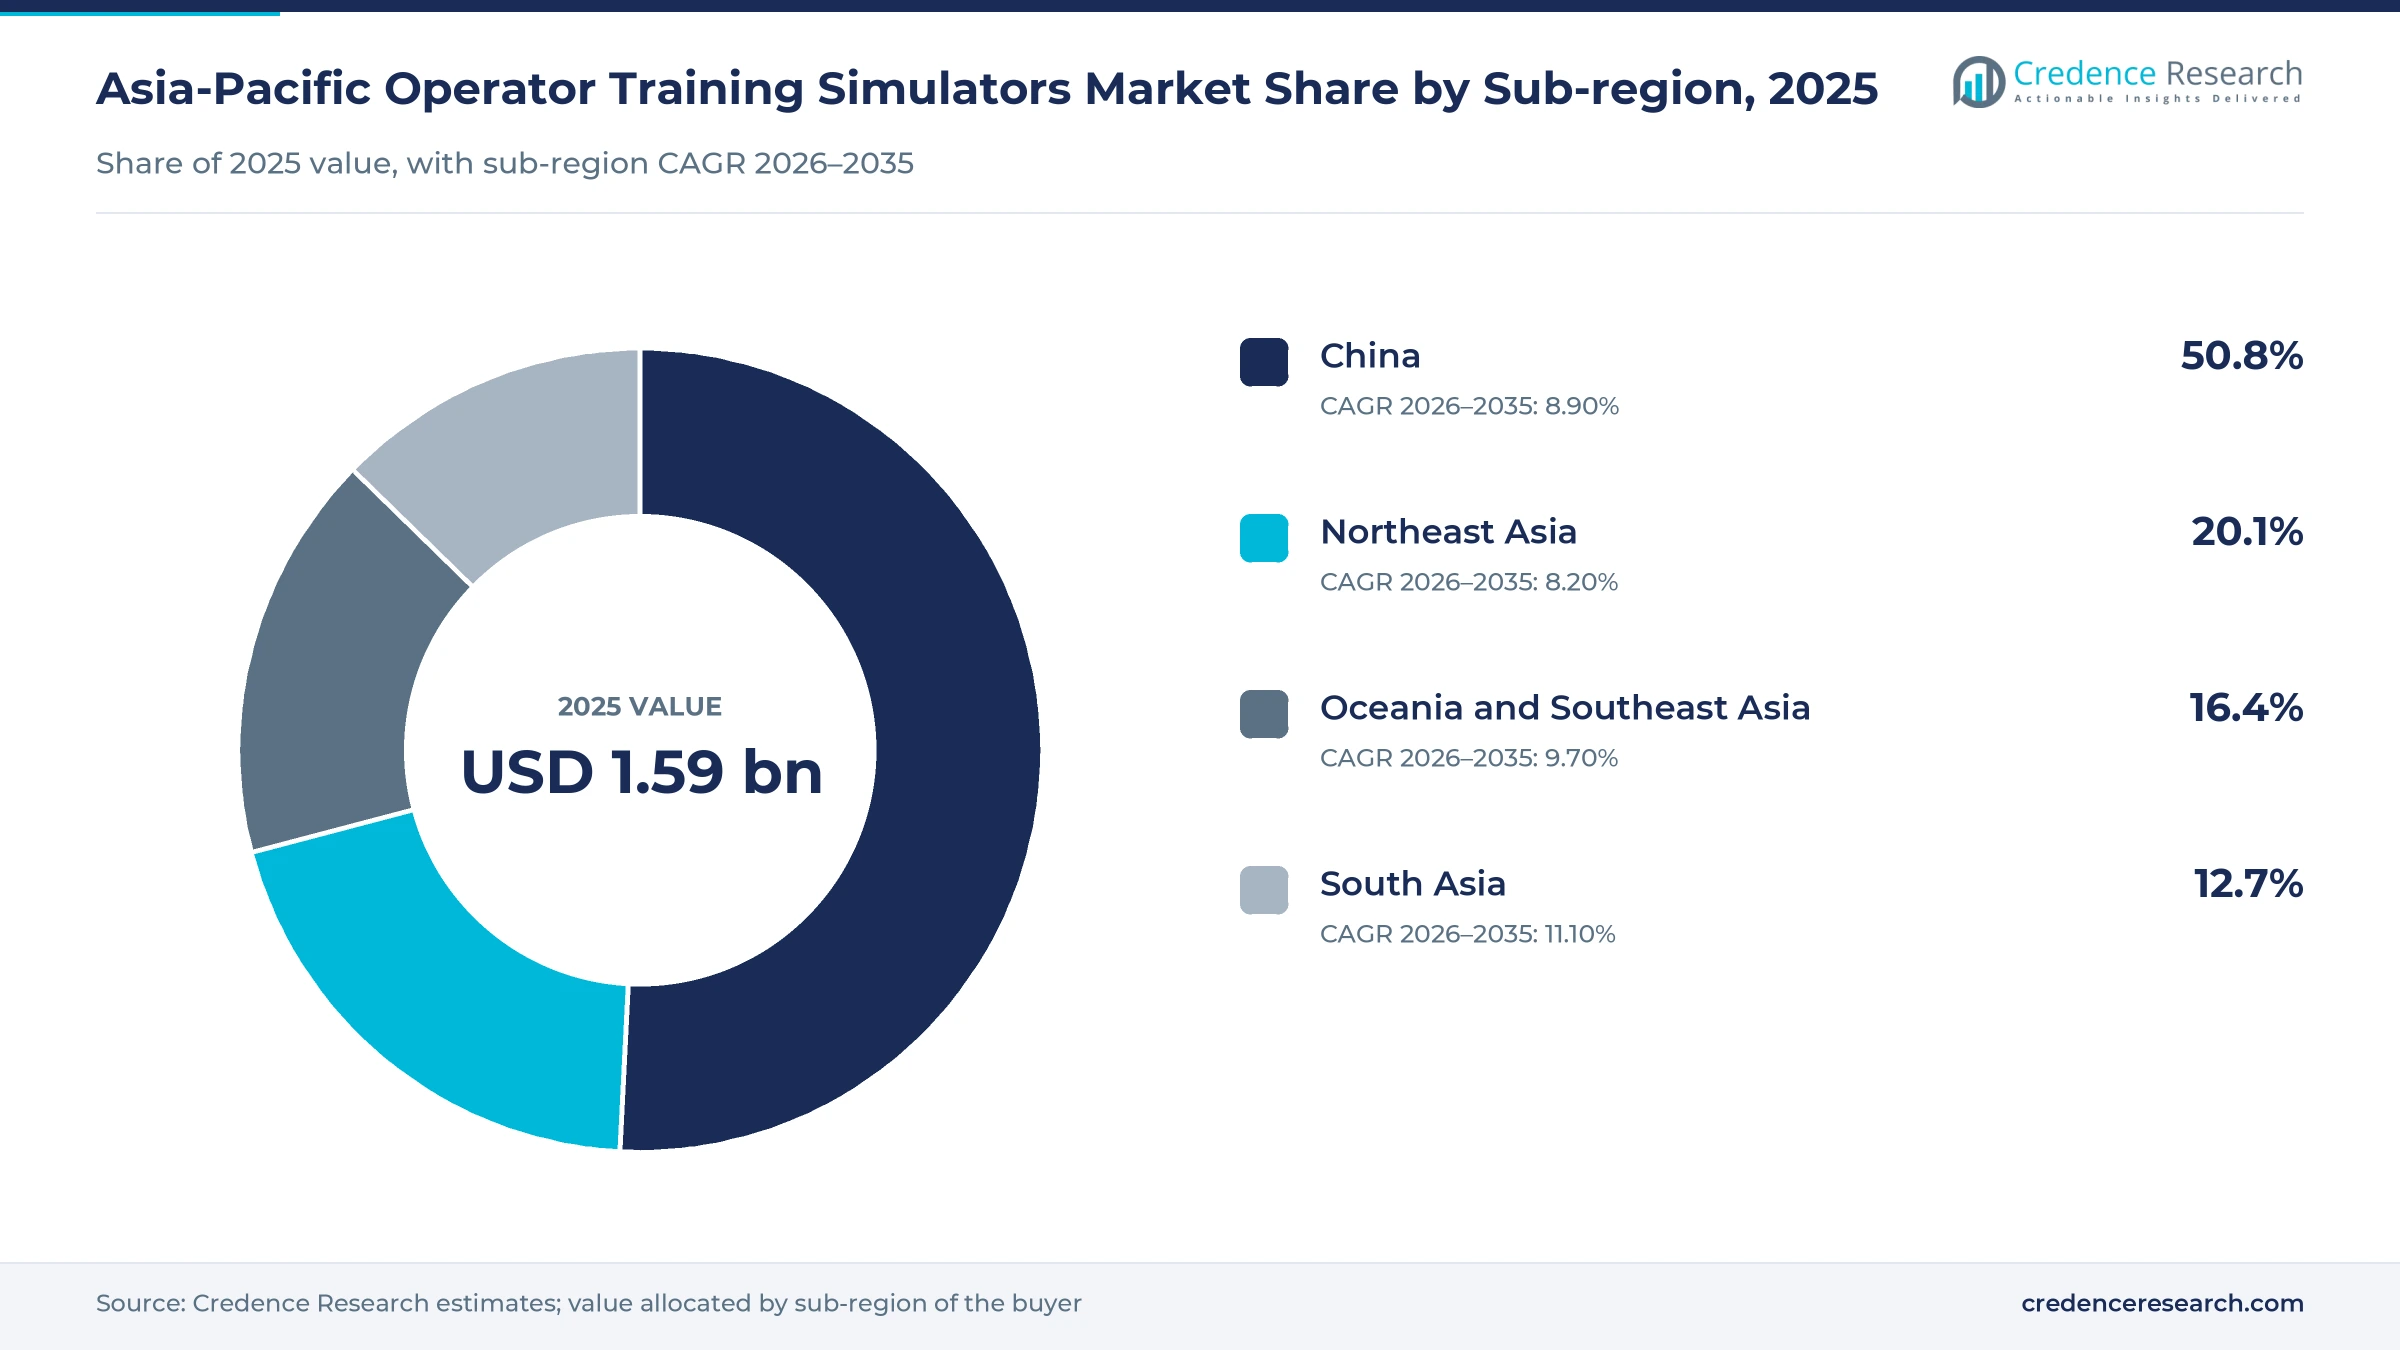
- China held a 50.8% share of 2025 value, because Chinese airlines carried 770 million passengers in 2025 and keep adding training devices.
- Integrated simulator systems led solution demand with a 48.0% share of 2025 value, because certified full flight devices carry the highest unit value.
- Boeing said on July 22, 2025, that China will need 124,000 new commercial pilots and Southeast Asia 62,000 through 2044.
- Emerson completed its purchase of the remaining AspenTech shares on March 12, 2025, which brings process simulation under a control system group.
Full simulator systems lead while software grows fastest
Why do full simulator systems hold the largest share?
Based on solution type, the market is categorized into integrated simulator systems, simulation software, engineering and integration services and lifecycle support services. Integrated Simulator Systems led with a 48.0% share of 2025 value, because a certified full flight or mission simulator costs far more than software alone. Simulation Software grows fastest at 10.26% a year, as plant owners and training groups buy dynamic models that run on standard computers.
How does aviation shape end-use demand?
Based on end-use industry, the market is categorized into aviation, defense, process and resource operations and maritime and emerging transport. Aviation led with a 44.0% share of 2025 value, because airlines must type rate and recheck every pilot on certified devices. Maritime and Emerging Transport grows fastest at 10.19% a year, as port operators and maritime academies add full mission bridge and tug simulators.
Why does initial qualification lead applications?
Based on application, the market is categorized into initial operator qualification, recurrent proficiency assessment, emergency and mission rehearsal and commissioning and change readiness. Initial Operator Qualification led with a 41.0% share of 2025 value, because large pilot intakes in China and India need type rating hours. Commissioning and Change Readiness grows fastest at 9.92% a year, as new refineries and chemical units train crews before startup.
How do private asset owners lead customer demand?
Based on customer type, the market is categorized into private asset owners, public asset operators, defense and security agencies and independent training institutions. Private Asset Owners led with a 38.0% share of 2025 value, because airlines and plant owners buy devices for their own crews. Independent Training Institutions grow fastest at 10.25% a year, as joint venture academies sell simulator time to many airlines.
| Segment Group | Leading Sub-segment | Share, 2025 | Fastest-growing Sub-segment | CAGR, 2026–2035 |
|---|---|---|---|---|
| By Solution Type | Integrated Simulator Systems | 48.0% | Simulation Software | 10.26% |
| By End-Use Industry | Aviation | 44.0% | Maritime and Emerging Transport | 10.19% |
| By Application | Initial Operator Qualification | 41.0% | Commissioning and Change Readiness | 9.92% |
| By Customer Type | Private Asset Owners | 38.0% | Independent Training Institutions | 10.25% |
Request a Free Sample
Fill in your details and we'll send you a free sample report.
- Sample data tables & charts
- Research methodology
Fleet growth, defense budgets and new plants lift demand
How does airline fleet growth build training capacity?
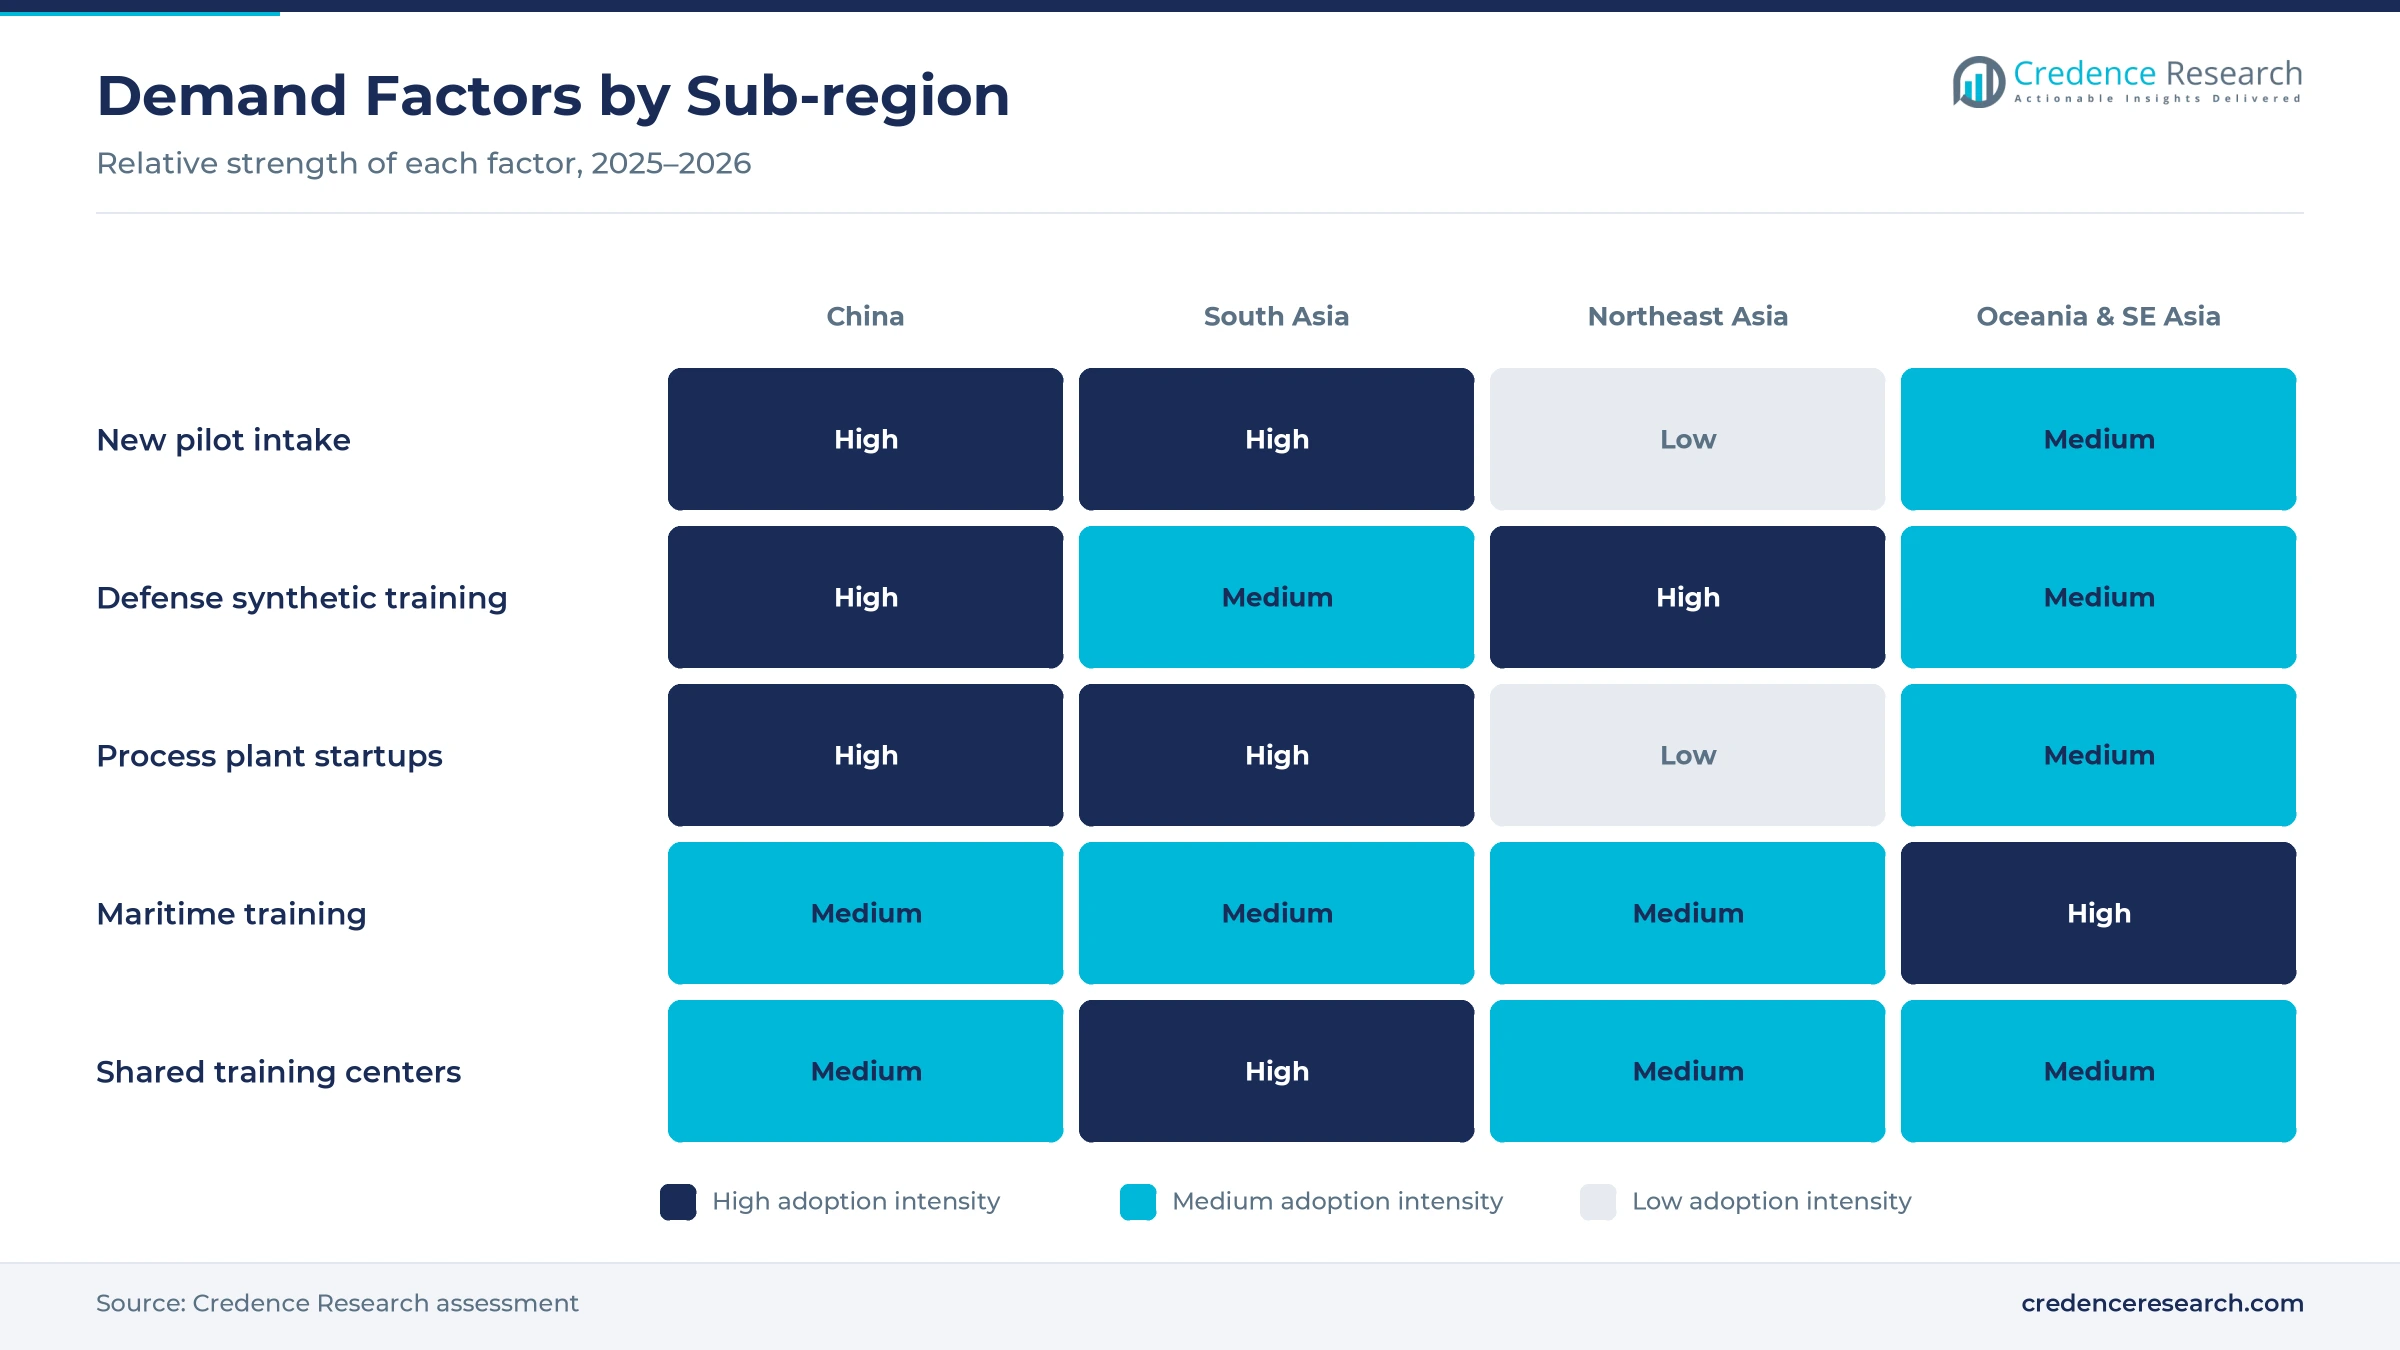
Airlines in the region must qualify large numbers of new pilots, and each pilot needs hours on a certified simulator before flying passengers. Boeing forecast on July 22, 2025, that China will need 124,000 new pilots, Southeast Asia 62,000 and South Asia 45,000 through 2044, according to its Pilot and Technician Outlook. India issued 1,652 commercial pilot licenses in 2025 and 1,331 in the first half of 2026, IANS reported in July 2026. Air India and Airbus opened a Gurugram academy on Sept. 30, 2025, that will house 10 full flight simulators and train more than 5,000 new pilots over a decade. As a result, aviation leads end-use demand with a 44.0% share of 2025 value.
Why do defense budgets move hours into synthetic devices?
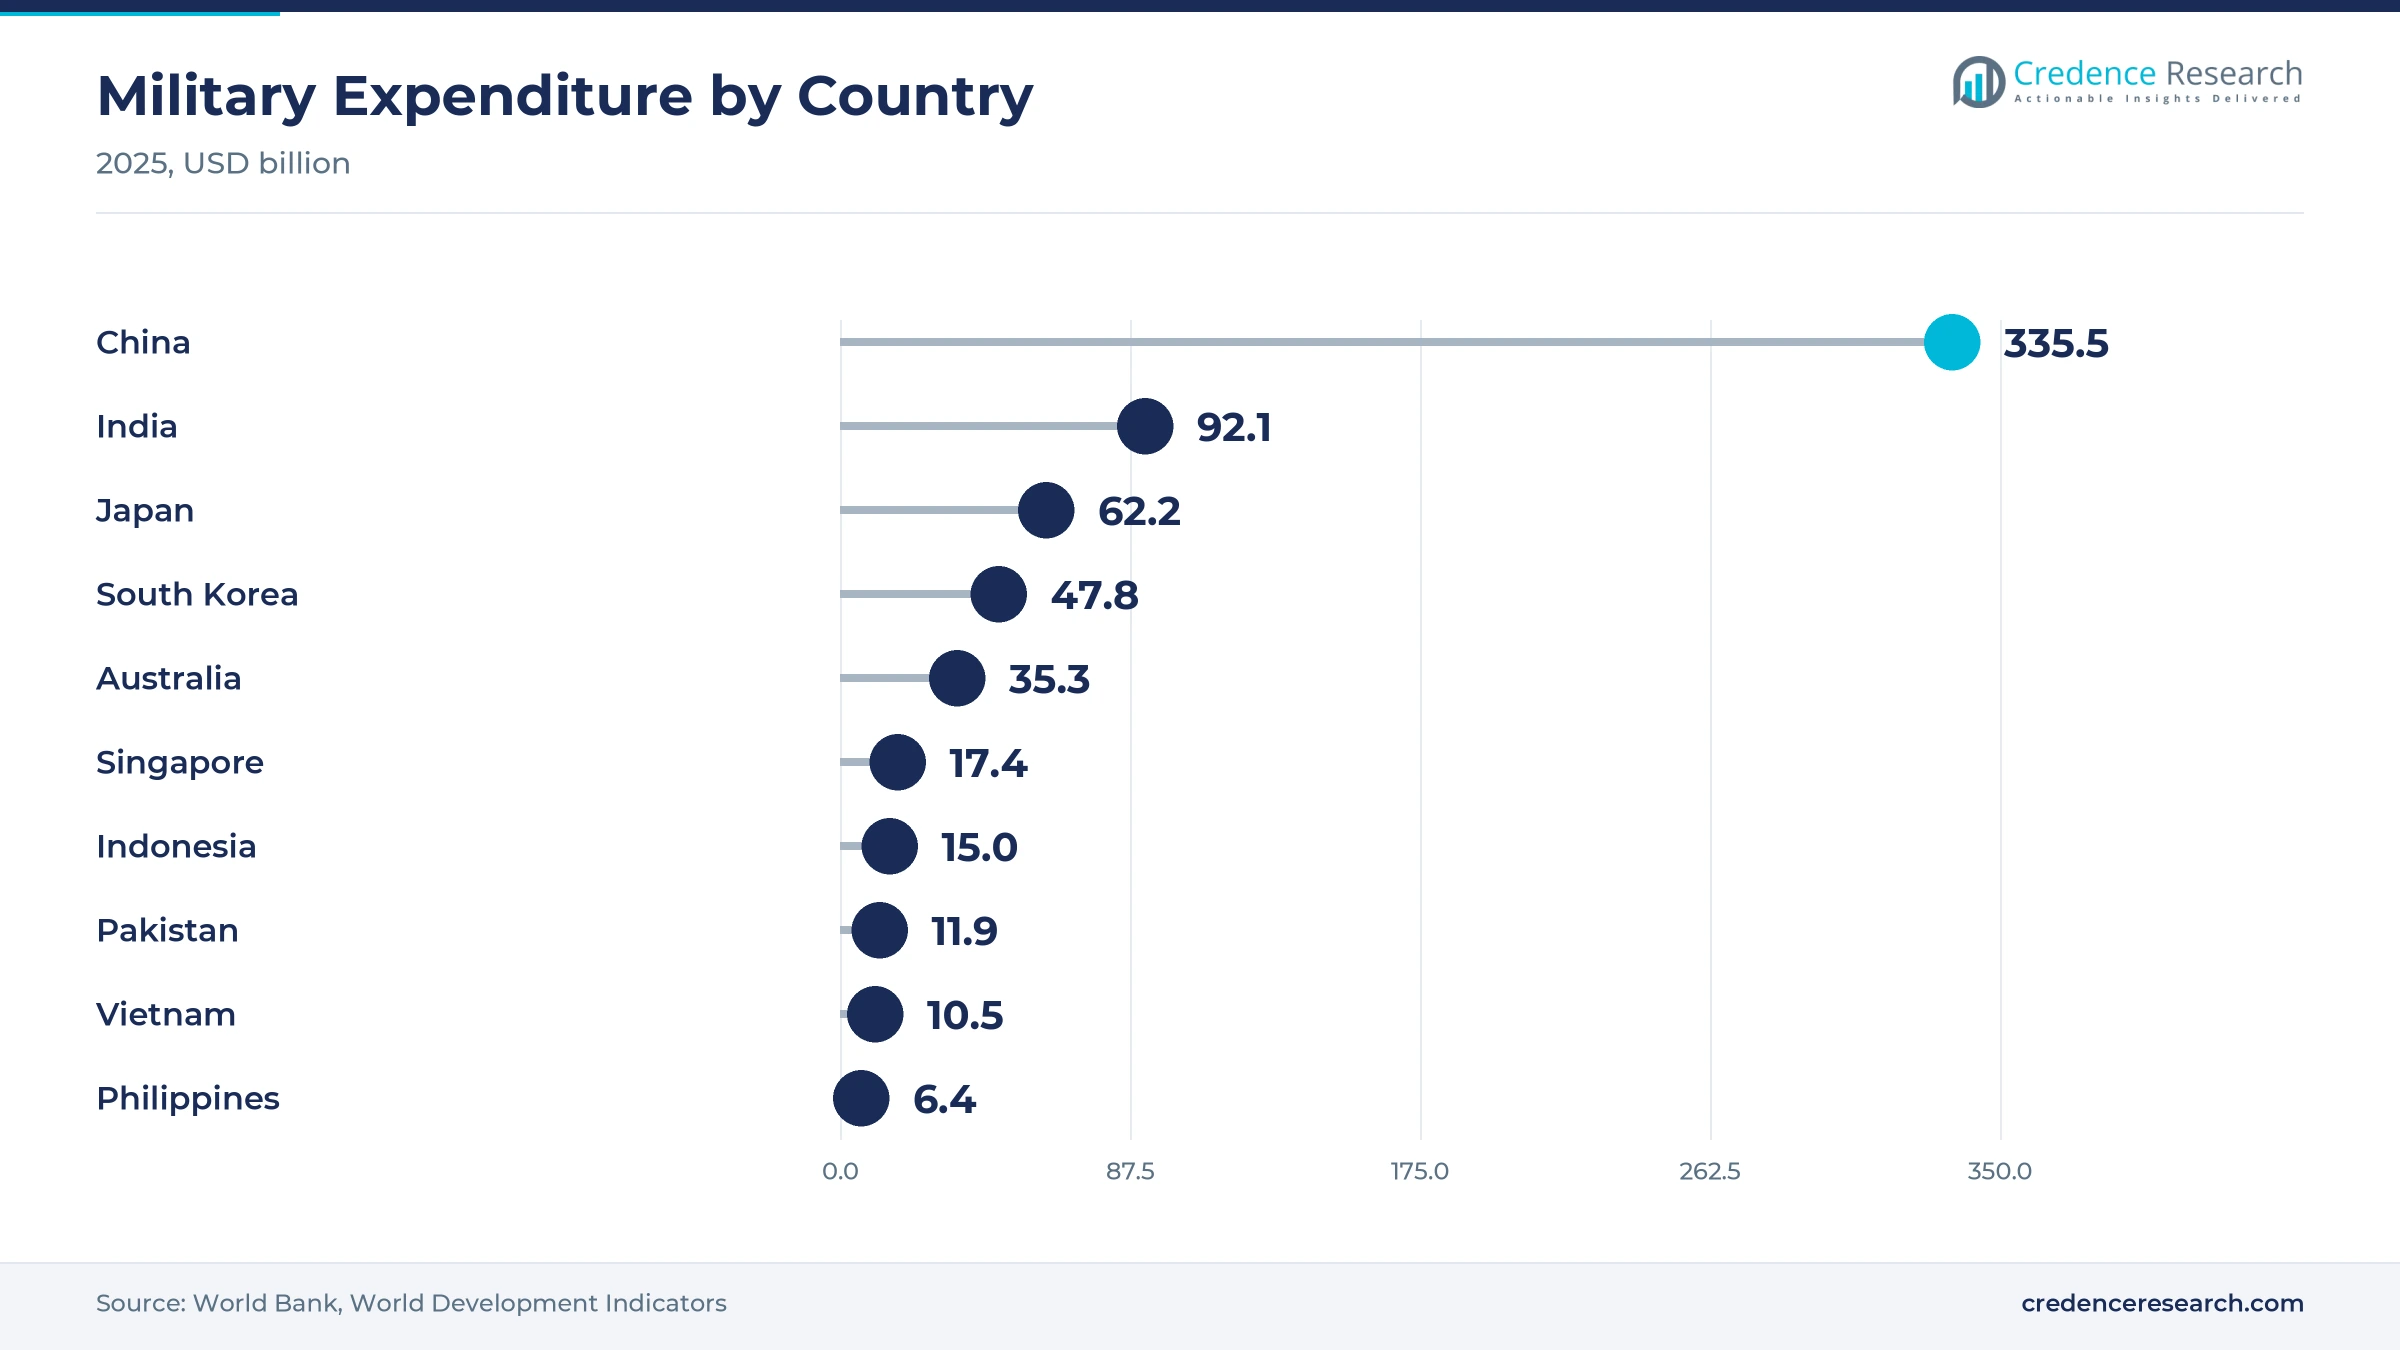
Air forces and navies now use simulators for more mission training, because live flying hours are costly and some tactics cannot be practiced in the air. Military spending reached about USD 335.5 billion in China in 2025, while Japan's rose to USD 62.2 billion from USD 54.2 billion a year earlier, according to World Bank data. CAE won Australia's Future Air Mission Training System contract in December 2025, with an initial 10-year performance period at RAAF Base East Sale. Thales also delivered an AW139 Reality H full flight simulator to the Royal Malaysian Police in May 2025. In turn, defense and security agencies remain a core customer group, as budgets such as Japan's move more training hours into military simulation programs.
How do plant startups raise demand for process simulators?
Refinery, chemical and power operators train control room crews on a copy of the plant before startup, which cuts the risk of costly trips. India plans to lift refining capacity from 256.8 million metric tons a year to 309.5 million metric tons by 2028, Indian Chemical News reported in July 2024. Yokogawa said its simulator for PetroVietnam Ca Mau Fertilizer trained 66 operators, matched plant response with about 90% precision and helped prevent two possible shutdowns. Yokogawa also began a digital twin and simulator training project with the Osaka City Waterworks Bureau in February 2022. As a result, commissioning and change readiness grows fastest among applications at 9.92% a year.
Why do new training centers widen access to certified devices?
Joint venture academies now place many simulators in one building and sell time to several airlines, which lowers the cost of each training hour. CAE and InterGlobe said on Aug. 26, 2025, that a Mumbai center would open in early 2026 with two A320 simulators and room for six, according to a CAE release. Their three existing centers in Greater Noida, Gurugram and Bengaluru already have capacity for up to 23 full flight simulators. CAE also made its first A320 simulator ready for training at Loong Air's new Hangzhou center in December 2025. In turn, independent training institutions grow fastest among customers at 10.25% a year.
Shared centers, digital twins and immersive tools rise
How is the shift to shared academy models changing purchases?
Airlines increasingly share training centers with manufacturers and simulator makers instead of buying every device alone. Air India and Airbus plan eight A320 family and two A350 simulators at their Gurugram academy, according to an Air India release dated Sept. 30, 2025. CAE said Loong Air will receive three A320 full flight simulators and three flight training devices, with two more simulators due to be ready in 2026. Loong Air flies 74 A320 family aircraft and employs more than 800 pilots, which explains the in-house center. As a result, integrated simulator systems keep a 48.0% share, while lifecycle support contracts grow with each installed device.
Why is the rise of digital twins pulling software demand?
Control system vendors now link plant models, design tools and training software into one digital twin that crews can use for practice. Emerson completed its purchase of the remaining AspenTech shares on March 12, 2025, which places process simulation inside a control system group. Siemens completed its acquisition of Altair in March 2025 and said the deal adds mechanical and electromagnetic simulation to its digital twin portfolio. Yokogawa's Osaka water project, which ran until March 2024, compared a virtual plant with real process data to improve simulator accuracy. In turn, simulation software grows fastest among solution types at 10.26% a year.
Can maritime full mission simulators open new revenue?
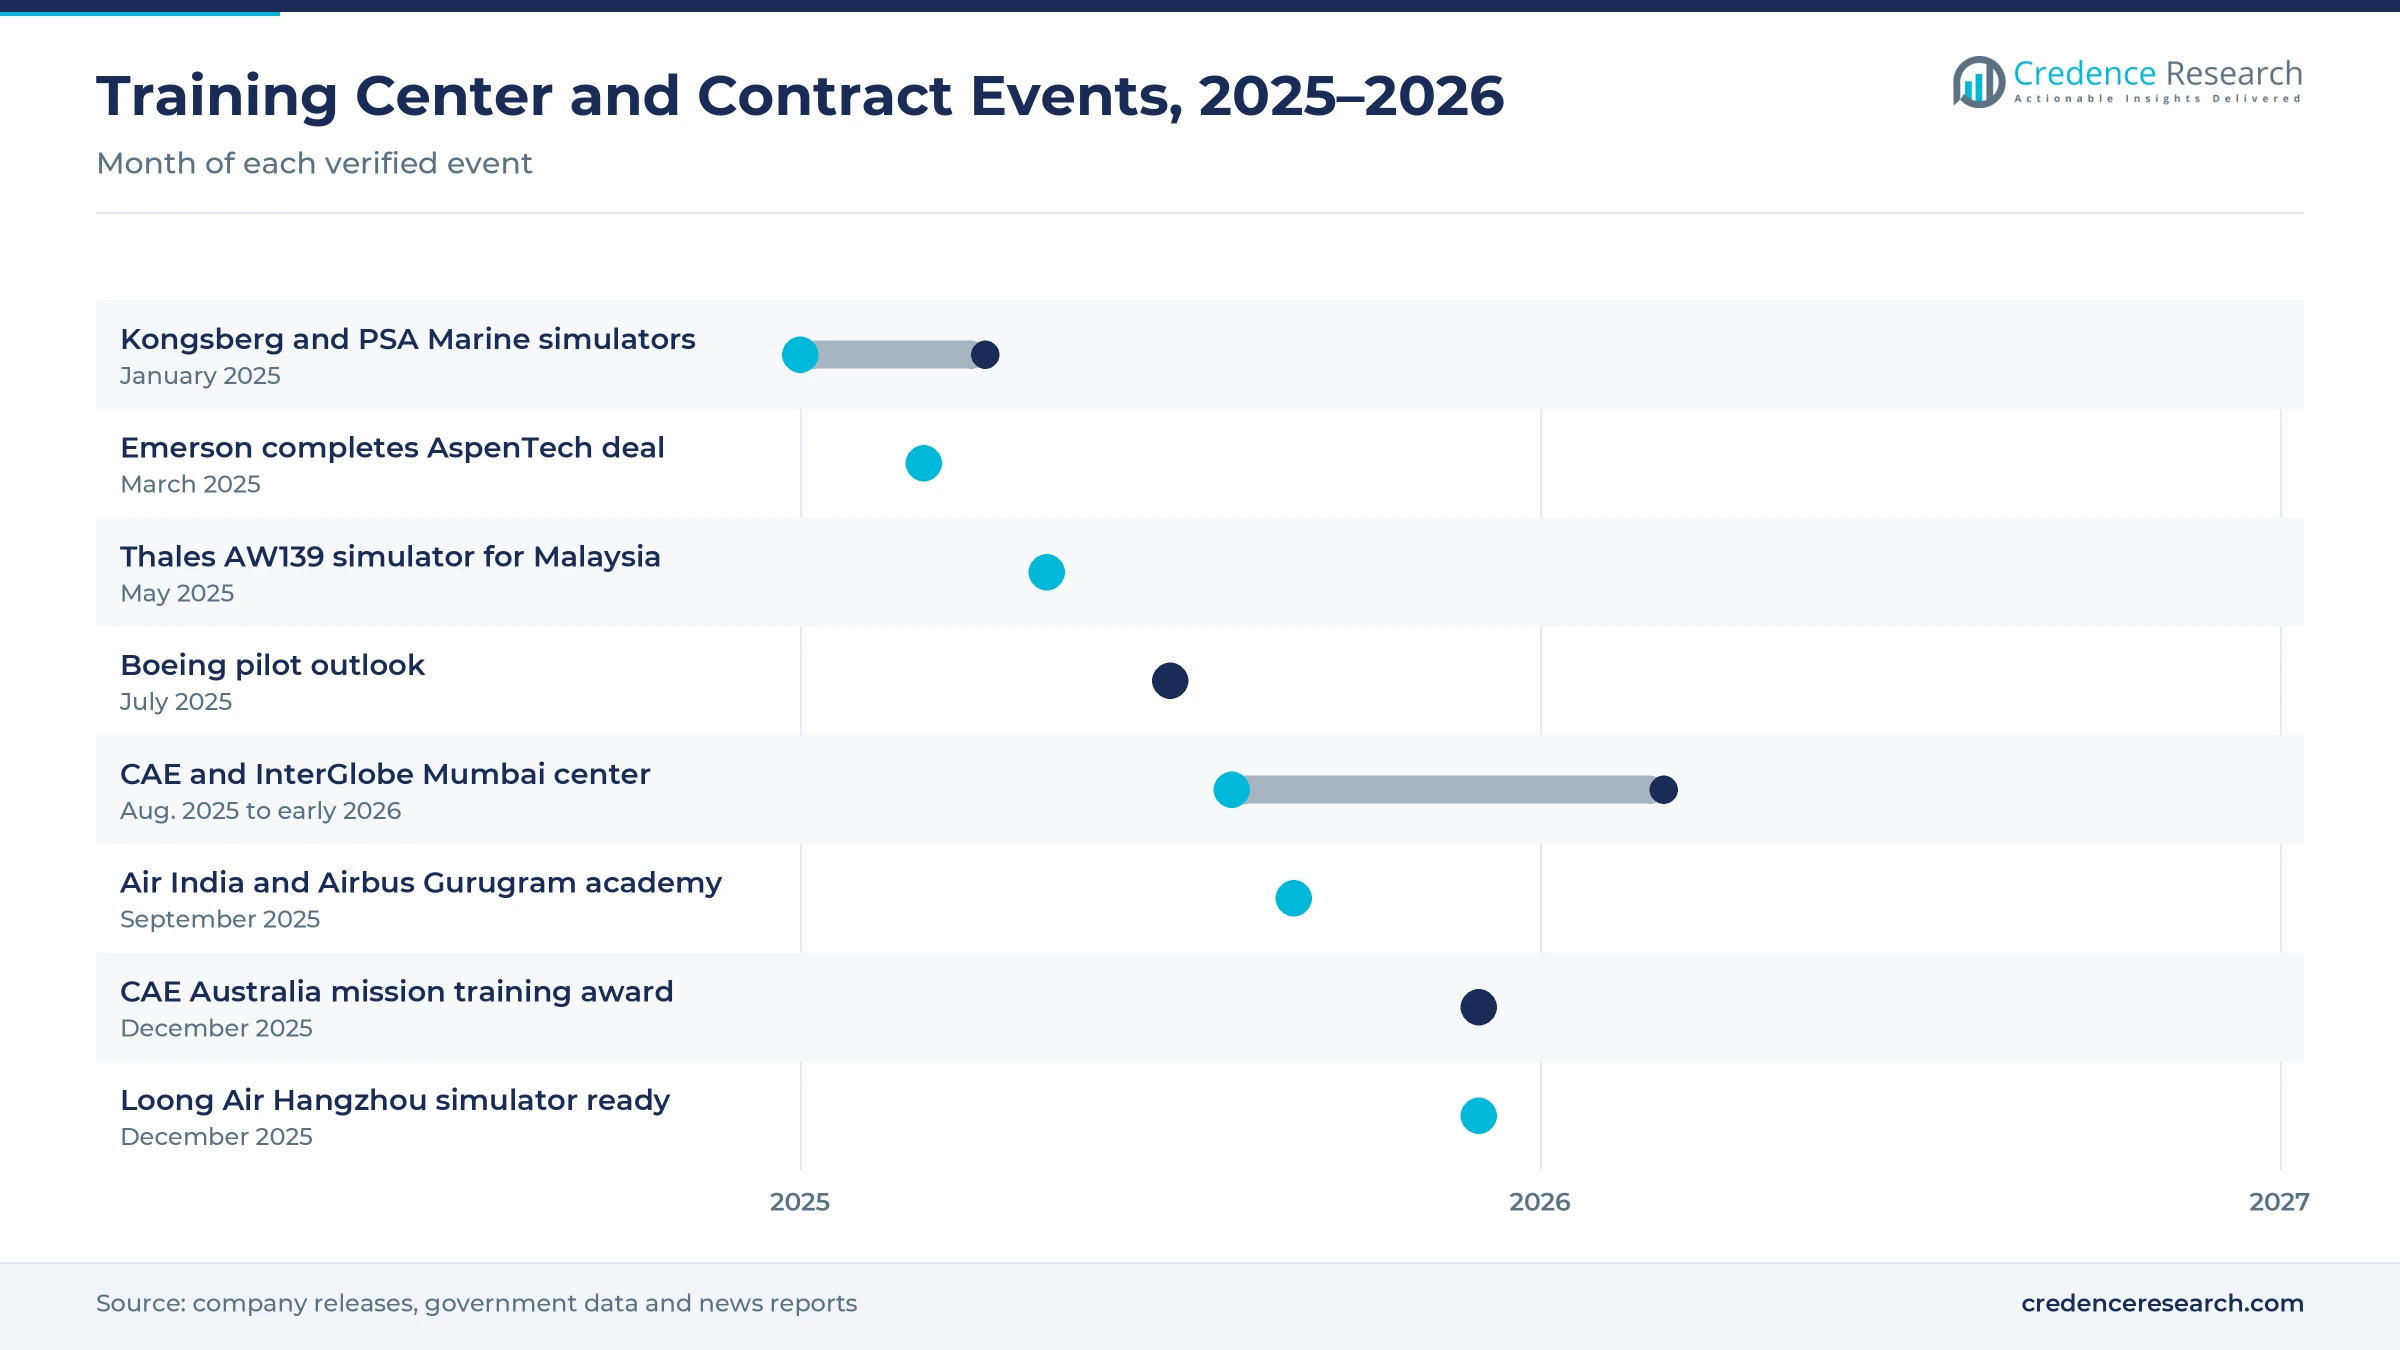
Ports and maritime academies need crews that can handle larger ships, new fuels and dense traffic, which creates demand for bridge and tug simulators. Kongsberg Digital and PSA Marine agreed in January 2025 to install full mission bridge and tug bridge simulators in Singapore, according to The Maritime Executive. PSA Marine serves more than 180,000 vessels a year in the Port of Singapore, and both systems are Class A devices. Kongsberg also supplied navigation, engine room and cargo simulators to Tolani Maritime Institute in India in 2021. As a result, maritime and emerging transport grows fastest among end uses at 10.19% a year.
Is there room for growth in immersive and VR trainers?
Lower-cost virtual reality trainers let air forces and plant owners add practice time without buying another full simulator. CAE tested virtual reality simulators with 30 Japanese pilot cadets and reported about 20% better grades after one hour of AI-based coaching, Defense News reported. Japan issued a request for information on advanced jet trainers in October 2024, with submissions closing May 8, 2025, which could open a new training system program. Japan's fleet of more than 200 T-4 trainers has served since 1988, so any replacement will also need new flight simulation equipment for cadets. In turn, emergency and mission rehearsal gains share among applications, because these programs add scenario practice for each new platform.
High device costs, instructor gaps and approvals slow buyers
How do high device costs delay purchases?
A certified full flight or mission simulator needs motion, visual and aircraft data packages, which makes each device a large capital purchase. Smaller airlines and plant owners often delay orders until a fleet or unit is confirmed. As a result, demand clusters around large carriers, defense agencies and new mega projects. Vendors respond with leasing, shared academy models and long service contracts that spread the cost over many years, which helps smaller buyers gain access.
Why do instructor shortages limit capacity?
Each simulator needs qualified instructors and examiners, and these people are often senior pilots or experienced plant operators. India relied on foreign schools for about 41% of new commercial pilot licenses in the first half of 2026. In turn, new devices can sit idle when instructor hiring lags behind equipment delivery. Operators respond by training more instructors, using automated scoring and adding AI coaching tools that reduce instructor workload.
How do approval rules slow new devices?
Aviation regulators must qualify each full flight simulator before its hours count toward a license, and process plants must validate models against real control systems. At the Air India and Airbus academy in Gurugram, only two of 10 planned simulators were installed at its September 2025 opening, with the rest added gradually. As a result, vendors carry risk when local rules differ from those in Europe or North America. Simulator makers respond by working with regulators early, building local teams and using known aircraft data packages to shorten approval.
Why do export controls and local content rules add costs?
Defense simulators often carry sensitive data, so governments limit which suppliers can deliver them and require local partners. Thales delivered its Malaysian police simulator through a letter of offer with local partner Novatis Resources. In turn, global vendors must share work with domestic firms, which can raise costs and slow delivery. Vendors respond with joint ventures and local assembly, which also builds support capacity close to the customer.
China leads while South Asia grows fastest
| Sub-region | Value, 2025 (USD billion) | Share, 2025 | CAGR, 2026–2035 |
|---|---|---|---|
| China | 0.81 | 50.8% | 8.90% |
| Northeast Asia | 0.32 | 20.1% | 8.20% |
| Oceania and Southeast Asia | 0.26 | 16.4% | 9.70% |
| South Asia | 0.20 | 12.7% | 11.10% |
Why does China hold the largest share?
China held a 50.8% share of 2025 value and grows at 8.90% a year, because its airlines and air force run the region's largest training fleets. Chinese airlines carried 770 million passengers in 2025, up 5.5% from 2024, China Daily reported in January 2026. Boeing expects China to need 124,000 new pilots through 2044, and Loong Air opened a new Hangzhou center with CAE simulators in December 2025.
What keeps Northeast Asia a large defense buyer?
Northeast Asia held a 20.1% share of 2025 value and grows at 8.20% a year, because Japan and South Korea fund advanced fighter, naval and power plant training. Japan raised military spending to about USD 62.2 billion in 2025, while South Korea spent about USD 47.8 billion. Japan is also studying new advanced jet trainers after a request for information that closed on May 8, 2025.
How does Oceania and Southeast Asia build mixed demand?
Oceania and Southeast Asia held a 16.4% share of 2025 value and grows at 9.70% a year, because defense, maritime and mining buyers all use simulators. Australia awarded CAE its Future Air Mission Training System in December 2025, and Singapore added Class A bridge and tug simulators for harbor pilots in 2025. Mines also use mining simulation software to train equipment operators.
Why is South Asia the fastest-growing sub-region?
South Asia held a 12.7% share of 2025 value and grows fastest at 11.10% a year, because Indian airlines and training groups are adding simulator capacity quickly. India issued 1,652 commercial pilot licenses in 2025, and Boeing expects South Asia to need 45,000 new pilots through 2044. CAE and InterGlobe also planned a Mumbai center for early 2026 with room for six full flight simulators.
Training centers, contracts and deals, 2025 to 2026
| Development | Status and market relevance |
|---|---|
| In January 2025, Kongsberg Digital and PSA Marine agreed to install full mission bridge and tug simulators in Singapore. | Adds Class A maritime training capacity |
| In March 2025, Emerson completed its purchase of the remaining AspenTech shares. | Brings process simulation into a control system group |
| In May 2025, Thales delivered an AW139 Reality H full flight simulator to the Royal Malaysian Police. | First Thales engagement with the police air wing |
| In September 2025, Air India and Airbus opened a Gurugram training academy planned for 10 full flight simulators. | Expands pilot training capacity in India |
| In December 2025, CAE won Australia's Future Air Mission Training System contract for RAAF Base East Sale. | Initial 10-year performance period |
Motion platforms, dynamic models and VR shape delivery
- Full motion platforms move the cockpit or bridge in step with the model, which lets regulators count simulator hours toward a license.
- Dynamic process models copy plant chemistry and control logic, which lets crews rehearse startups and trips before a unit goes live.
- Virtual reality trainers place students in a headset view of a cockpit or field unit, which adds practice time at lower cost.
- Connected digital twins link design data, live plant data and training software, which keeps the simulator in step with the real asset.
Need a Custom Version of This Report?
Tailor the scope, geography, or segments to your exact requirements.
- Custom geography or segment scope
- Direct access to our analyst team
Vendors compete on certified devices and local centers
Competition combines global simulator makers, control system vendors and maritime specialists. CAE leads civil pilot training through joint ventures with InterGlobe in India and device sales to Chinese airlines such as Loong Air, and it also serves defense customers in Australia. Thales supplies helicopter and mission simulators to Southeast Asian agencies, while Kongsberg Maritime and Kongsberg Digital deliver bridge, engine room and tug simulators to ports and academies. Yokogawa Electric builds process simulators for plants in Vietnam and Japan, and Siemens added Altair simulation tools in March 2025, while AspenTech now sits within Emerson. Boeing shapes demand through its pilot forecasts and fleet sales. Companies compete on certified device quality, local training centers, aircraft and plant data access and long service contracts that keep simulators current.
Companies profiled and their roles in this market
| Company | Type | Role in the market |
|---|---|---|
| CAE | Simulator maker and training provider | Runs Indian centers with InterGlobe and supplies Loong Air in China |
| Thales | Simulator maker | Delivered an AW139 full flight simulator to the Royal Malaysian Police |
| Kongsberg Maritime | Maritime simulator supplier | Supplies bridge and tug simulators for harbor pilots in Singapore |
| Yokogawa Electric | Control system and simulation vendor | Builds process simulators for plants in Vietnam and Japan |
Credence Research view on synthetic training demand
Credence Research's view is that synthetic training demand in the Asia-Pacific region will grow steadily because airlines, defense agencies and plant owners all face more crews to qualify. Integrated simulator systems keep the largest share, while simulation software grows fastest as plant models move into digital twins. China stays the largest buyer, and South Asia grows fastest as Indian training centers expand. However, high device costs and instructor shortages will limit smaller buyers. Vendors that pair certified devices with local centers should gain share fastest.
How the regional synthetic training estimate was built
The report uses 2025 as the base year on a calendar basis, and market values come from the Credence Research model. That model combines pilot demand forecasts, training center capacity, defense spending statistics, plant project data and company information on device deliveries and contracts. Segment splits and sub-regional growth rates are Credence Research estimates, while sub-regional shares follow the Credence Research regional model. Sources used are official statistics, government releases, company releases and news reports, and no interviews or surveys were used.
Pilot pipelines and plant projects carry growth to 2035
Regional value for operator training simulators is expected to reach USD 3.84 billion by 2035, a 9.20% CAGR during 2026–2035, as pilot pipelines and plant projects keep devices busy. Growth should be strongest through 2030, while Indian and Chinese centers fill new simulator bays and new refinery units start up. After that, software, support contracts and digital twins will carry more growth as installed devices age. Faster fleet deliveries would raise this outlook, while delayed defense programs would lower it.
Frequently Asked Questions
How big is the Asia-Pacific operator training simulators market?
Which solution type leads regional demand?
Which sub-region leads the regional market?
Why does aviation lead end-use demand?
How do defense budgets affect simulator demand?
Which customer type grows fastest?
Who are the leading companies in the region?
What are the main challenges for buyers?
Table of Content
Chapter 1 Market Segmentation
- 1.1 Segmentation Framework
- 1.1.1 Product and Service Classification
- 1.1.2 Application and End-Use Classification
- 1.1.3 Technology and Solution Classification
- 1.1.4 Customer and Distribution Channel Classification
- 1.1.5 Geographic Segmentation
- 1.1.6 Market Segment Definitions and Boundaries
- 1.2 By Solution Type
- 1.2.1 Integrated Simulator Systems
- 1.2.2 Simulation Software
- 1.2.3 Engineering and Integration Services
- 1.2.4 Lifecycle Support Services
- 1.3 By End-Use Industry
- 1.3.1 Aviation
- 1.3.2 Defense
- 1.3.3 Process and Resource Operations
- 1.3.4 Maritime and Emerging Transport
- 1.4 By Application
- 1.4.1 Initial Operator Qualification
- 1.4.2 Recurrent Proficiency Assessment
- 1.4.3 Emergency and Mission Rehearsal
- 1.4.4 Commissioning and Change Readiness
- 1.5 By Customer Type
- 1.5.1 Private Asset Owners
- 1.5.2 Public Asset Operators
- 1.5.3 Defense and Security Agencies
- 1.5.4 Independent Training Institutions
- 1.6 By Sub-region
- 1.6.1 China
- 1.6.2 South Asia
- 1.6.3 Northeast Asia
- 1.6.4 Oceania and Southeast Asia
Chapter 2 Introduction
- 2.1 Report Objectives and Scope
- 2.2 Product Definition and Industry Terminology
- 2.3 Market Inclusions and Exclusions
- 2.4 Research Process
- 2.4.1 Primary Research and Expert Interviews
- 2.4.2 Secondary Research and Source Review
- 2.4.3 Top-Down and Bottom-Up Estimation
- 2.4.4 Data Triangulation and Verification
- 2.5 Market Size Measurement Basis
- 2.5.1 2025: USD 1.59 billion → 2035: USD 3.84 billion
- 2.6 Historical and Forecast Reference Periods
- 2.6.1 Historical Period: 2018-2025
- 2.6.2 Base Year: 2025
- 2.6.3 Forecast Period: 2025-2035
- 2.7 Research Assumptions and Limitations
Chapter 3 Executive Summary
- 3.1 Market Snapshot and Key Findings
- 3.2 Base-Year Market Size, 2025
- 3.3 Forecast Market Size, 2035
- 3.4 Revenue and Volume Growth Outlook
- 3.5 Key Demand and Supply Indicators
- 3.6 Leading Market Segments
- 3.7 Fastest-Growing Market Opportunities
- 3.8 Regional Performance Highlights
- 3.9 Technology and Industry Transformation
- 3.10 Competitive Landscape Summary
- 3.11 Analyst View and Strategic Implications
Chapter 4 Asia-Pacific Operator Training Simulators Market Trends and Developments
- 4.1 Historical Industry Development, 2018-2025
- 4.2 Recent Market Trends and Developments
- 4.3 Demand and Customer Behavior Trends
- 4.4 Technology and Product Innovation
- 4.5 Artificial Intelligence, Automation and Digitalization
- 4.6 Local Manufacturing and Supply Chain Realignment
- 4.7 Industry Partnerships, Mergers and Acquisitions
- 4.8 Sustainability and Circular Economy Developments
- 4.9 Government and Private Sector Investment Trends
- 4.10 Emerging Business Models and Commercialization
- 4.11 Industry Developments and Announcements
Chapter 5 Asia-Pacific Operator Training Simulators Market Production, Supply and Demand Analysis
- 5.1 Demand Trend and Consumption Analysis, 2018-2025
- 5.2 Demand Forecast, 2025-2035
- 5.3 Production and Output Trend, 2018-2025
- 5.4 Production and Output Forecast, 2025-2035
- 5.5 Installed Capacity and Capacity Utilization
- 5.6 Company-Wise Production Plants and Statistics
- 5.6.1 Installed Production Capacity
- 5.6.2 Actual Production
- 5.6.3 Planned Capacity and Expansion Targets
- 5.7 Supply Chain Structure and Procurement Trends
- 5.8 Supply-Demand Gap and Bottlenecks
- 5.9 Import Dependence and Sourcing Structure
- 5.10 Contract Manufacturing and Outsourcing
- 5.11 Regional Supply and Demand Concentration
Chapter 6 Asia-Pacific Operator Training Simulators Market Pricing Analysis
- 6.1 Pricing Structure and Measurement
- 6.2 Historical Pricing Trends, 2018-2025
- 6.3 Pricing Outlook, 2025-2035
- 6.4 Average Selling Price and Unit Economics
- 6.5 Pricing by Product and Market Segment
- 6.6 Geographic Pricing Differences
- 6.7 Key Input, Energy, Labor and Logistics Costs
- 6.8 Contract Pricing and Purchasing Models
- 6.9 Pricing Sensitivity and Competitive Positioning
- 6.10 Price, Margin and Profitability Implications
Chapter 7 Asia-Pacific Operator Training Simulators Market Dynamics
- 7.1 Market Growth Drivers
- 7.1.1 Demand-Side Drivers
- 7.1.2 Technology and Innovation Drivers
- 7.1.3 Infrastructure and Investment Drivers
- 7.1.4 Regulatory and Policy Drivers
- 7.2 Market Restraints
- 7.2.1 Cost and Affordability Constraints
- 7.2.2 Technology and Adoption Barriers
- 7.2.3 Supply Chain and Operational Constraints
- 7.3 Market Challenges
- 7.3.1 Competitive Pressure and Margin Erosion
- 7.3.2 Skills, Infrastructure and Implementation Gaps
- 7.4 Emerging Market Opportunities
- 7.5 Market Dynamics Impact and Time-Horizon Assessment
Chapter 8 Asia-Pacific Operator Training Simulators Value Chain Analysis
- 8.1 Industry Value Chain Overview
- 8.2 Upstream Suppliers and Critical Inputs
- 8.3 Technology and Component Providers
- 8.4 Manufacturing or Service Delivery
- 8.5 Distribution, Channel Partners and Integrators
- 8.6 Downstream Applications and End Users
- 8.7 Value Addition and Profit Pools
- 8.8 Vertical Integration and Outsourcing
- 8.9 Supplier Concentration and Risk
- 8.10 Supply Chain Localization and Resilience
Chapter 9 Asia-Pacific Operator Training Simulators Market Regulations and Policies
- 9.1 Relevant Laws, Standards and Compliance Frameworks
- 9.2 Product, Service, Safety and Quality Requirements
- 9.3 Government Policies, Incentives and Subsidies
- 9.4 Imports, Exports and Trade Barriers
- 9.5 Public Procurement and Local Content Requirements
- 9.6 Environmental and Sustainability Compliance
- 9.7 Upcoming Policy Changes and Market Implications
Chapter 10 Asia-Pacific Operator Training Simulators Market Hotspots and Opportunities
- 10.1 Market Opportunity Mapping and Growth Hotspots
- 10.2 High-Growth Applications and Customer Groups
- 10.3 Underserved Markets and White-Space Opportunities
- 10.4 Emerging Technology and Product Opportunities
- 10.5 New Capacity and Investment Hotspots
- 10.6 Market Entry and Expansion Opportunities
- 10.7 Distribution and Partnership Opportunities
- 10.8 Near-Term and Long-Term Commercial Potential
- 10.9 Opportunity Attractiveness and Execution Risks
Chapter 11 Asia-Pacific Operator Training Simulators Market Outlook, 2025-2035
- 11.1 Market Size and Analysis
- 11.1.1 Revenue (Market Measurement: 2025: USD 1.59 billion → 2035: USD 3.84 billion)
- 11.1.2 Market Volume and Quantity Sold
- 11.1.3 Historical Market Size, 2018-2025
- 11.1.4 Base-Year Market Size, 2025
- 11.2 Market Forecast, 2025-2035
- 11.2.1 Revenue Forecast to 2035
- 11.2.2 Volume Forecast to 2035
- 11.2.3 CAGR and Year-on-Year Growth
- 11.2.4 Incremental Revenue Opportunity
- 11.3 Forecast Assumptions and Scenario Analysis
- 11.3.1 Base-Case Forecast
- 11.3.2 Optimistic and Conservative Scenarios
- 11.3.3 Technology, Pricing and Policy Sensitivities
- 11.4 Market Attractiveness and Growth Outlook
Chapter 12 Asia-Pacific Operator Training Simulators Market Segmentation and Outlook
- 12.1 Segmentation Summary and Market Shares, 2025
- 12.2 Largest and Fastest-Growing Segments
- 12.3 By Solution Type - Market Size and Forecast, 2025-2035
- 12.3.1 Segment Definition and Scope
- 12.3.2 Historical Market Size, 2018-2025
- 12.3.3 Revenue Forecast, 2025-2035
- 12.3.4 Volume Forecast, 2025-2035
- 12.3.5 Base-Year Market Share, 2025
- 12.3.6 Segment CAGR and Growth Drivers
- 12.3.7 Subsegment Market Size and Forecast
- 12.3.7.1 Integrated Simulator Systems
- 12.3.7.2 Simulation Software
- 12.3.7.3 Engineering and Integration Services
- 12.3.7.4 Lifecycle Support Services
- 12.3.8 Subsegment Pricing and Adoption Trends
- 12.3.9 Leading Suppliers and Competition
- 12.3.10 Regional Demand and Opportunities
- 12.4 By End-Use Industry - Market Size and Forecast, 2025-2035
- 12.4.1 Segment Definition and Scope
- 12.4.2 Historical Market Size, 2018-2025
- 12.4.3 Revenue Forecast, 2025-2035
- 12.4.4 Volume Forecast, 2025-2035
- 12.4.5 Base-Year Market Share, 2025
- 12.4.6 Segment CAGR and Growth Drivers
- 12.4.7 Subsegment Market Size and Forecast
- 12.4.7.1 Aviation
- 12.4.7.2 Defense
- 12.4.7.3 Process and Resource Operations
- 12.4.7.4 Maritime and Emerging Transport
- 12.4.8 Subsegment Pricing and Adoption Trends
- 12.4.9 Leading Suppliers and Competition
- 12.4.10 Regional Demand and Opportunities
- 12.5 By Application - Market Size and Forecast, 2025-2035
- 12.5.1 Segment Definition and Scope
- 12.5.2 Historical Market Size, 2018-2025
- 12.5.3 Revenue Forecast, 2025-2035
- 12.5.4 Volume Forecast, 2025-2035
- 12.5.5 Base-Year Market Share, 2025
- 12.5.6 Segment CAGR and Growth Drivers
- 12.5.7 Subsegment Market Size and Forecast
- 12.5.7.1 Initial Operator Qualification
- 12.5.7.2 Recurrent Proficiency Assessment
- 12.5.7.3 Emergency and Mission Rehearsal
- 12.5.7.4 Commissioning and Change Readiness
- 12.5.8 Subsegment Pricing and Adoption Trends
- 12.5.9 Leading Suppliers and Competition
- 12.5.10 Regional Demand and Opportunities
- 12.6 By Customer Type - Market Size and Forecast, 2025-2035
- 12.6.1 Segment Definition and Scope
- 12.6.2 Historical Market Size, 2018-2025
- 12.6.3 Revenue Forecast, 2025-2035
- 12.6.4 Volume Forecast, 2025-2035
- 12.6.5 Base-Year Market Share, 2025
- 12.6.6 Segment CAGR and Growth Drivers
- 12.6.7 Subsegment Market Size and Forecast
- 12.6.7.1 Private Asset Owners
- 12.6.7.2 Public Asset Operators
- 12.6.7.3 Defense and Security Agencies
- 12.6.7.4 Independent Training Institutions
- 12.6.8 Subsegment Pricing and Adoption Trends
- 12.6.9 Leading Suppliers and Competition
- 12.6.10 Regional Demand and Opportunities
- 12.7 By Sub-region - Market Size and Forecast, 2025-2035
- 12.7.1 Segment Definition and Scope
- 12.7.2 Historical Market Size, 2018-2025
- 12.7.3 Revenue Forecast, 2025-2035
- 12.7.4 Volume Forecast, 2025-2035
- 12.7.5 Base-Year Market Share, 2025
- 12.7.6 Segment CAGR and Growth Drivers
- 12.7.7 Subsegment Market Size and Forecast
- 12.7.7.1 China
- 12.7.7.2 South Asia
- 12.7.7.3 Northeast Asia
- 12.7.7.4 Oceania and Southeast Asia
- 12.7.8 Subsegment Pricing and Adoption Trends
- 12.7.9 Leading Suppliers and Competition
- 12.7.10 Regional Demand and Opportunities
- 12.8 Segment Growth Comparison
- 12.9 Segment Attractiveness and Priority Matrix
Chapter 13 Asia-Pacific Operator Training Simulators End-Use and Application Market Outlook
- 13.1 End-Use Industry and Customer Demand Structure
- 13.2 Leading Applications and Customer Groups
- 13.3 End-Use Market Size, Share and Forecast
- 13.4 Major End-Use Industry Deep Dives
- 13.4.1 Customer Requirements and Use Cases
- 13.4.2 Demand and Replacement Cycles
- 13.4.3 Technical and Regulatory Considerations
- 13.4.4 Purchasing and Procurement Models
- 13.4.5 Leading Vendors and Distribution Channels
- 13.4.6 Forecast and Commercial Opportunities
- 13.5 Emerging Applications and Cross-Segment Demand
- 13.6 End-Use Industry Investment Priorities
Chapter 14 Asia-Pacific Operator Training Simulators Geographic Market Outlook, 2025-2035
- 14.1 Regional Market Size and Country-Level Shares, 2025
- 14.2 Country Market Size Comparison, 2025
- 14.3 Country Market Forecasts, 2025-2035
- 14.4 Subregional Industrial and Demand Clusters
- 14.5 Intra-Regional Pricing and Cost Differences
- 14.6 Cross-Border Trade and Supply Networks
- 14.7 Regional Supply and Demand Balances
- 14.8 Country Opportunity Comparison and Prioritization
Note: Every listed country is covered on the structure shown under the first country.
Chapter 15 Asia-Pacific Operator Training Simulators Technology, Innovation and Sustainability Outlook
- 15.1 Technology Landscape and Maturity
- 15.2 Product, Process and Service Innovation
- 15.3 AI, Automation and Digital Tools in the Industry
- 15.4 Technology Adoption and Performance Benchmarking
- 15.5 Innovation Pipeline and R&D Investment
- 15.6 Patent and Intellectual Property Trends
- 15.7 Energy Efficiency and Resource Management
- 15.8 Sustainability, Recycling and Circularity
- 15.9 Technology Roadmap, 2025-2035
- 15.10 Risks of Obsolescence and Technology Substitution
Chapter 16 Asia-Pacific Operator Training Simulators Market Key Strategic Imperatives
- 16.1 Growth and Market Entry Priorities
- 16.2 High-Return Products and Segments
- 16.3 Pricing, Profitability and Cost Optimization
- 16.4 Technology Investment and Product Differentiation
- 16.5 Supply Chain Localization and Resilience
- 16.6 Distribution and Customer Acquisition
- 16.7 Partnership, Acquisition and Capacity Strategy
- 16.8 Regional Expansion Priorities
- 16.9 Short-, Medium- and Long-Term Actions
Chapter 17 Competition Outlook
- 17.1 Industry Competition Characteristics
- 17.2 Market Structure and Concentration
- 17.3 Market Share and Competitive Positioning, 2025
- 17.4 Company-Wise Revenue and Product Benchmarking
- 17.5 Production and Service Capacity Benchmarking
- 17.6 Technology, Pricing and Differentiation
- 17.7 Regional Footprint and Distribution Strength
- 17.8 Mergers, Acquisitions and Strategic Alliances
- 17.9 New Entrants and Competitive Threats
- 17.10 Porter's Five Forces and Industry Attractiveness
- 17.11 Competitive Outlook, 2025-2035
Chapter 18 Company Profiles
- 18.1 Company Coverage and Selection Criteria
- 18.2 CAE
- 18.2.1 Business Description
- 18.2.2 Company Ownership and Geographic Presence
- 18.2.3 Product and Service Portfolio
- 18.2.4 Manufacturing and Operating Footprint
- 18.2.5 Production Capacity and Expansion Plans
- 18.2.6 Financial Performance and Investment
- 18.2.7 Market Share and Competitive Position
- 18.2.8 Technology and Innovation Capabilities
- 18.2.9 Strategic Alliances or Partnerships
- 18.2.10 Recent Developments
- 18.2.11 Growth Strategy and Outlook
- 18.3 Yokogawa Electric
- 18.4 Thales
- 18.5 Kongsberg Maritime
- 18.6 Honeywell
- 18.7 Siemens
- 18.8 ABB
- 18.9 Schneider Electric
- 18.10 Boeing
- 18.11 AspenTech
- 18.12 Other Relevant Market Participants
Note: Every listed company is profiled on the structure shown under the first company. The company list is preliminary and may change based on research findings, market developments, data availability and client requirements.
Chapter 19 Disclaimer
- 19.1 Research and Forecast Disclaimer
- 19.2 Data Source and Estimation Limitations
Note: The depth of individual sections depends on data availability for this market. Volume, capacity, trade and other unit-based metrics are included where applicable.

